Syeed Anta Kashfi, Queensland University of Technology, Australia
Associate Professor Jonathan Bunker, Queensland University of Technology, Australia
ABSTRACT
This study focuses on weather effects on daily bus ridership in Brisbane, given bus’ dominance in this city. The weather pattern of Brisbane varies by season according to its sub-tropical climate characteristics. Bus is prone to inclement weather condition as it shares the road system with general traffic. Moreover, bus stops generally offer less or sometimes no protection from adverse weather. Hence, adverse weather conditions such as rain are conjectured to directly impact on daily travel behaviour patterns. There has been limited Australian research on the impact of weather on daily transit ridership. This study investigates the relationship between rainy day and daily bus ridership for the period of 2010 to 2012. Overall, rainfall affects negatively with varying impacts on different transit groups. However, this analysis confirmed a positive relationship between consecutive rainy days (rain continuing for 3 or more days). A possible explanation could be that people may switch their transport mode to bus to avoid high traffic congestion and higher accident potentiality on rainy days. Also, Brisbane’s segregated busway (BRT) corridor works favourably towards this mode choice. Our study findings enhance the fundamental understanding of traveller behaviour, particularly mode choice behaviour under adverse weather conditions.
INTRODUCTION
A host of factors influence transit ridership either directly or indirectly including, but not limited to socio-economic characteristics of trip makers, household socio-economic characteristics, such as household size, structure and composition, housing tenure, lifestyle, and attitude towards using transit (Crowley, 2001; Zarei, 2007; Cervero and Kockelman, 1997). Geographic elements such as walkability, parking availability, and cost at origin and destination also influence transit ridership (Hendricks, 2005). Moreover, transit quality of service (QoS) measured by two important aspects; availability, and comfort and convenience, has a direct influence on transit ridership (Kittelson & Associates, 2013). However, one factor that affects transit ridership on a day-to-day basis that researchers often overlook is weather (Stover & McCormack, 2012).
Weather variables such as precipitation, temperature, relative humidity and wind speed affect ridership on a daily basis, influencing almost every aspect of transit service. Adverse weather conditions lead to increased transit travel times and degraded service regularity (Hofmann and O’Mahony, 2005). Different transit modes such as bus, subway, and train are influenced by weather differently (Guo et al, 2007). Among them, bus is affected more by inclement weather compared with rail as it shares the road system with general traffic. Adverse weather results in a higher level of congestion due to increase in private vehicle usage (Hofmann and O’Mahony, 2005). Additionally, on-street bus (OSB) users are directly affected by weather while waiting or walking to and from the transit stop and bus stops infrastructure often offer less and sometimes no protection. Transit riders need extra protection from adverse weather (Sarkar, 2002); otherwise ridership may be negatively affected by weather conditions (Fielding, 1995; Levine, 1990).
The city of Brisbane, Australia is increasingly using bus. More than 25 km of busway has been built to date as a form of bus rapid transit. It comprises a mixture of grade-separated bus-only sections with on-street transitway sections, complementing the region's urban rail network to provide faster and more efficient bus services to its residents (Brisbane Metropolitan Transport Management Centre, 2013). The maximum load segment (MLS) on Brisbane’s South East Busway carries over 12,500p/h during the a.m. peak (Department of Transport and Main Roads, 2011), which equates to approximately five to six busy motorway lanes, or approximately 13
26th
ARRB Conference – Research driving efficiency, Sydney, New South Wales 2014
six-carriage trains at maximum schedule load. According to Australian Bureau of statistics (2011) in Brisbane approximately 43,500 people use bus as their main travel mode compared with only 26,800 people train as their main transport mode. Since bus is considered as the primary public transport mode in this region, factors that affect its ridership are worthy of investigation.
The weather pattern of Brisbane is highly variable by season according to its sub-tropical climate. It makes the region prone to severe weather events such as severe thunderstorms during spring and early summer, both heat waves and heavy rainfall during summer (Brisbane City Council, 2013), as well as occasional cold snaps during the dryer winter. In recent years, the occurrence of extreme weather conditions has increased, with more frequent, heavier rain events over a longer period, transforming the rainy days to be heavier and continue for longer (Holper, 2011).
The main goal of this research is to investigate the extent to which daily bus ridership in Brisbane is affected by adverse weather conditions. While a significant number of studies have analysed weather impacts on vehicle safety, speed and traffic conditions, few have studied the impact of weather on transit ridership. Moreover, existing research on this topic provides conflicting results: some studies support a perception that adverse weather affects negatively on public transport use, while others opposite it. Additionally, the majority of the studies on the effect of weather conditions on transit ridership were confined to North American and Western European contexts. A few Australian studies have explored weather impact on non-motorised travellers such as cyclists (Phung and Rose, 2007; Nankervis, 1999; Richardson, 2000; Ahmed et al., 2012; Keya, 1992) and pedestrians (Burke et al., 2006).
Research concentrating on Melbourne’s tram system performance includes (Currie et al., 2013; Mesbah et al., 2014; Mazloumi et al., 2008). Among them, Currie’s study used rain as one of the explanatory variables in one model, to analyse tram system’s operational performance in terms of reduction in run time. They found rain to be the least influential among other variables. The other studies did not include rain or any other weather variables. Mesbah analysed the effect of seasonal variation of daylight hours on the reliability of tram while Mazloumi focused on the effect of day-to-day travel time variability on transit system’s reliability. Considering that research on the impacts of weather conditions on transit ridership in Australia is very limited, this study attempts to understand the influence of weather on transit ridership using Brisbane as a case study city.
LITERATURE REVIEW
The literature review section will discuss previously identified research in this area focusing on three key points. Firstly, it will discuss the weather variables effects on public transport. Then narrowing down, it will summarize how various users’ groups’ are affected by adverse weather. Finally, it will cover previously observed ridership result under extreme weather condition.
Weather effects on public transport
The majority of research concerning the impacts of weather variables on transit ridership revealed negative correlation between adverse weather and ridership, while some found a positive trend. The first research in this area (Guo et al., 2007) explored the effect of weather variables on transit ridership in Chicago. Their research unveiled that precipitation; snow and wind have significant negative impact on transit ridership. Also, weather impacts vary by transit mode, season, and day of the week. For instance, weather effect is more prominent on bus riders than those using other public transit modes. They found that 1 inch (25mm) more rain fall reduced bus passenger volume by between 16,000 and 22,000; whereas, for rail it reduced only between 5,000 and 8,000. Further, the study confirmed more significant weather impact on weekends than weekdays. More recently, Stover et al., (2012) investigated how bus ridership in Pierce County, Washington, USA is affected by wind, temperature, rain, and snow in four seasons (winter, spring, summer & autumn). The study indicated that rain is the only variable having a significant effect on ridership in all four seasons. Compared with the average ridership, the occurrence of rainfall led to a decrease in bus ridership by 5.05% in winter, 9.73% in spring,
26th
ARRB Conference – Research driving efficiency, Sydney, New South Wales 2014
7.36% in summer, and 5.97% in autumn. A weather-ridership investigation was also performed on bus performance measures such as ridership, frequency, headway regularity, and travel time in Dublin, Ireland (Hofmann and O’Mahony, 2005). Using magnetic strip card data the study found a lower level of ridership during rainy days than non-rain days. Additionally, Changnon (1996) observed summer precipitation effects on weekday’s ridership in Chicago urban area. His study identified ridership decreased by 3% to 5% on a rainy day. Interestingly, a greater reduction in ridership occurred when rainfall occurred at midday (6%) compared with morning (3.3%) or afternoon (1.9%). This result suggests that discretionary passengers are more likely to avoid travelling by public transport on rainy days.
Contrary to the aforementioned studies, some researchers associated adverse weather with a positive trend in public transit use. Mostly this issue is linked with commuters’ response to severe weather condition. Khattak et al. (1995) in a travel survey study found that commuters switch from car to public transport during adverse weather in the San Francisco Bay Area. The Belgium study of Khattak and de Palma (1997) concurs with previous findings. During their survey period, a substantial number of automobile users (54%) responded that they changed their travel mode, departure time, and/or route choice during bad weather conditions. Among the commuters who changed their travel pattern in adverse weather, 27% of respondents indicated that weather was either “very important” or “important” factor in determining what mode of transport to use. Also, according to the transit agency in Brussels, a higher level of transit ridership was identified during adverse weather and unexpected delays on major routes.
Weather effects by different population category
Weather effects could vary depending on different population category in terms of their gender, age, user’s type, work pattern and profession. In Australia, women were found more vulnerable during adverse weather rather than men (Keay, 1992). That analysis detects a considerable reduction of female cyclists even in light rain, whereas it takes heavy rain to reduce male cyclists. Research in Canada identified that older adults and women are associated with lower likelihood of cycling for utilitarian purpose than young adults and men (Winters et.al, 2007).
A significant number of analyses observed that travel behaviour is reliant on trip purpose in the course of adverse weather condition. The majority of studies indicate a larger effect on leisure compared with utilitarian trips. Discretionary trips were found to be more sensitive to weather conditions than mandatory trips i.e. commuting trips (Guo et al., 2007). Similarly, a very recent study (Arana et. al., 2014) analysed how different types of bus user (smartcard paying and cash paying) are impacted by weather. The analysis found a significant influence of weather variables on occasional (cash paying) bus users than regular (smartcard paying) users. Conversely, using the magnetic strip card data a slight decrease of the bus ridership was found on rainy days in an Irish city. The study concludes that card users do not prefer bus on rainy days, but the significance of the result was unclear (Hofmann and O'Mahony, 2005).
Flexibility in work schedule also dictates the individual’s attitude towards adverse weather condition. People with higher rigidity in work arrival time or longer travelling time to work have higher propensity to change departure time under adverse weather condition (Khattak & de Palma, 1997). Moreover, in terms of job’s nature, professionals are less likely to postpone or change their travel schedule during inclement weather; however, decrease in passenger vehicle shows people’s preference of staying home in this circumstance (Call, 2011).
Extreme weather effect on ridership
The behavioural travel survey study by Khattak (1991) confirmed a surprising result. It established that due to extreme weather condition the weather-ridership relationship follows a positive trend. The possible reason is migration of non-motorised travellers and automobile users to transit under extreme condition. The extreme weather effect was also analysed by Guo et al., (2007) revealing a mixed result. It identified an upward ridership trend under extremely bad weather such as fog or blizzard. This result also indicated the change in mode choice among automobile users in these conditions. On the other hand, due to heavy rainfall the effect
26th
ARRB Conference – Research driving efficiency, Sydney, New South Wales 2014
seemed negative. However, the observation was not clear cut as others, possibly attributable to the existence of non-linear relationship between heavy rainfall and ridership.
Supporting the aforementioned results a negative trend was found for non-motorised transport mode under extreme weather condition. Heavy rain was found to have the greatest deterrent to cycling. In Melbourne, 67% respondents mentioned not to cycling due to heavy rain, among these respondents most of them indicated that they still have that trip, but they prefer to use other transport mode (Nankervis, 1999). Similarly, Keay (1992) found that cyclist’s volume declined by 50% because of a high amount of rainfall. The effect of heavy rain on cyclist volumes was found to be many times higher than light rain (Ahmed et al., 2012). Cyclist volume decreased around 29% due to high amount of rain.
STUDY AREA
Brisbane is located in the south east corner of Queensland. The South East Queensland (SEQ) region includes 11 regional and city councils (Hinchliffe, 2009). Among them, the city of Brisbane, comprising 189 suburbs, occupies 5.9% of SEQ and only 0.1% of Queensland in terms of land area. However, it supports nearly one third of SEQ’s population and one quarter of Queensland’s total population (QTT, 2011). Likewise, Brisbane comprises significant economic drivers of the region as well as the whole of Queensland, including the CBD, adjacent employment area, and the region’s principal airport and seaport.
Figure 1: Location of Brisbane in Queensland (left) and in South-East Queensland (right).
Public transport in Brisbane is delivered by TransLink Division of the Queensland Department of Transport and Main Roads, which splits its network into 23 travel zones. Brisbane city encompasses five of these zones. In order to deliver bus services to Brisbane area, TransLink works with Brisbane Transport and Brisbane Bus Lines (TransLink, 2013). TransLink operates a total of 394 routes that originate from within the Brisbane City Council region (study area). For the years 2010, 2011 and 2012, the estimated total patronage for Brisbane’s bus service was 77.2 million, 75.9 million and 77.8 million, respectively. The patronage decline in 2011 is explained by the impact of floods in January 2011 and the change of multi-trip ticket type (TransLink Transit authority annual report 2010-2011, 2011).
Brisbane is known as the “sub-tropical” capital of Queensland. The climate of Brisbane is characterised as warm temperate, with a fully humid precipitation and hot temperature in summer (Kottek et al. 2006). Generally, there are four distinct seasons observed in Brisbane. Summer is from December to February (typically high heat, humid and wet); winter from June to August (typically dry, low humid and cold); autumn from March to May; and spring from September to November. Brisbane on average receives 1,165 mm of rainfall each year (QTT, 2011). Rainfall peaks in this region during summer months, following table shows the highest average rainfall amount around 230mm is observed in December and January.
Table 1: Average monthly precipitation in mm (2010-2012) in Brisbane
Weather Variable Jan Feb Mar Apr May Jun Jul Aug Sep Oct Nov Dec
This section will explain the nature of weather and ridership data that has been used in this paper. Two data sets were used for this analysis: Daily bus ridership data for whole Brisbane Local Government area (BLGA) from TransLink, Department of Transport and Main Roads, Queensland Government and Daily precipitation data from Bureau of Meteorology, Climate Data Services (2013). Both datasets were collected for a three-year period from 1 January 2010 to 31 December 2012.
Precipitation data
There are three different weather observation centres under BLGA which currently provide quality-controlled hourly weather data. These stations are Brisbane, Archerfield Airport and Brisbane Aero. Hourly cumulative rain data was acquired from all three weather observation centres. It is worth mentioning that the weather stations measure the hourly cumulative rainfall data, starting from 09:00 am in the morning for a 24-hour period. In this study, precipitation only between 06:00 am to 09:00 pm was considered as whole day rainfall. This is because patronage numbers are negligible in the late night (after 09:00 pm) and in early morning (before 06:00 am). Since, daily bus ridership data were acquired from whole BLGA it was not sensible to consider any one particular weather station’s data for this analysis. A more realistic approach was to apply an arithmetical average system and obtain the average hourly cumulative rainfall from these three weather stations. Subsequently, daily cumulative rainfall amount was calculated from average hourly cumulative rainfall data, maintaining the whole day period time frame (06:00 am - 09:00 pm) of the analysis.
It is important to note that the weather data collected from Bureau of Meteorology Data Services, was for 24-hour period; from 09:00 am through to 09:00 am the following day. For example, the rain data of 21st January will have rain measure from 09:00 am to 11:59 pm of 21st January and 12:00 am to 08:59 am of 22nd January. The amount of rain occurring between 06:00 am until 08:59 am on 21st January, is listed under the hourly rain data of 20th January. Hence, the daily rainfall for a particular day was calculated by combining hourly rain data of 06:00 am to 09:00 am from previous day and 9:00 am to 09:00 pm for the current day.
Ridership data
Daily bus ridership data comprises the daily sum of all passengers for 24-hr period. The database contains approximately 231 million total daily ridership records for three years including weekends and other holidays. This study did not consider weekends and public holidays. The two ticket types available for ridership are paper ticket and electronic ticket, which is also known as “go-card”. The go card was launched throughout Brisbane in February 2008 (Mickel, J, 2006). TransLink lunched a promotional campaign in 2010 to elevate the use of Go-card among transit riders (TransLink Transit Authority, 2010). As a result, continuous migration from paper ticket users to go card users was observed throughout 2010 and lasted till end of 2011. Due to this unconformity of the ticket users during the analysis period, it was not necessary to conduct any analysis based on the user’s ticket type. However, both the ticket types have two common user groups; adult and concession. It paved the way to conduct analysis based on the transit user type by combining paper and go-card data for a particular user category. TransLink offers 50 per cent concession fare to children, students, pensioners, seniors and Defence Force veterans (TransLink, Queensland Government, 2014). In this research these users groups were consider as concession users and the rest were listed as adult users.
METHODOLOGY
The underlying method of data analysis used in this study was adopted from a previous paper (Kashfi et al. 2013). The demand for travel is not consistent throughout the year; rather it varies from day to day and month to month. This is known as the ‘Seasonality Effect’. Therefore, it raised the question of how to design the analysis, adjusting for seasonality effects. A general approach to eliminate the seasonality from the ridership data had been identified in the
26th
ARRB Conference – Research driving efficiency, Sydney, New South Wales 2014
aforementioned literature as seasonal decomposition. It is worth mentioning that the school holiday period was excluded in the previous paper but has been included in this research to understand the overall effect of rain throughout the year. Seasonal decomposition was done for Brisbane’s total bus ridership using the method adopted in the former paper. This data set will be used in the later part of this study. Subsequently, for the purpose of this analysis the original total ridership data was segmented into adult and concession user group. Each user group’s data was segmented according to the weekdays (i.e., from Monday to Friday). The mean and standard deviation of daily ridership for both user types by day of week is presented in table 2. When comparing the mean ridership of each weekday with rest of the working days, the only substantial variation was observed for Monday in both adult and concession ridership.
In order to confirm the statistical significance of the mean difference, ANOVA test was performed. Adult user group had p value = 0.000 and F value = 29.645. Similarly, concession user group had p value = 0.045 and F value = 2.445. The test result was significant (p < 0.05) for both user groups meaning there was a statistically significant difference between at least one group’s mean and the other group’s means. Compared to the concession user group, adult user group performed better in terms of F value and p value. The outcomes of this analysis confirmed the existence of seasonality in the daily ridership patterns for both user groups.
Table 2: Mean daily ridership & Standard deviation by day of week.
Day N Adult ridership
mean
Adult std. deviation
Concession ridership
mean
Concession std.
deviation
Monday 138 1,16,237 4,981 1,44,433 30,835
Tuesday 146 1,20,821 4,980 1,52,060 31,303
Wednesday 141 1,21,579 4,552 1,53,080 31,747
Thursday 147 1,21,798 4,601 1,55,135 31,064
Friday 143 1,20,444 5,454 1,51,539 28,737
Total 751 1,20,211 5,304 1,51,337 30,873
Therefore, due to the presence of seasonality effect among days of week, seasonal adjustment (i.e. seasonal decomposition) is required. The following two formulas were used for weekly seasonal decomposition process.
{(∑
) ( )⁄ }
…… (1)
{(∑
) ( )⁄ }
…. (2)
Where:
Rw_adult = Seasonally adjusted adult ridership data by day of week Rw_concession = Seasonally adjusted concession ridership data day of week Radult = Adult ridership data for each day of week Rconcession = Concession ridership data for each day of week Wadult_avg = Weekly Average adult Ridership Wconcession_avg = Weekly Average concession Ridership N = Number of weeks in the study period
26th
ARRB Conference – Research driving efficiency, Sydney, New South Wales 2014
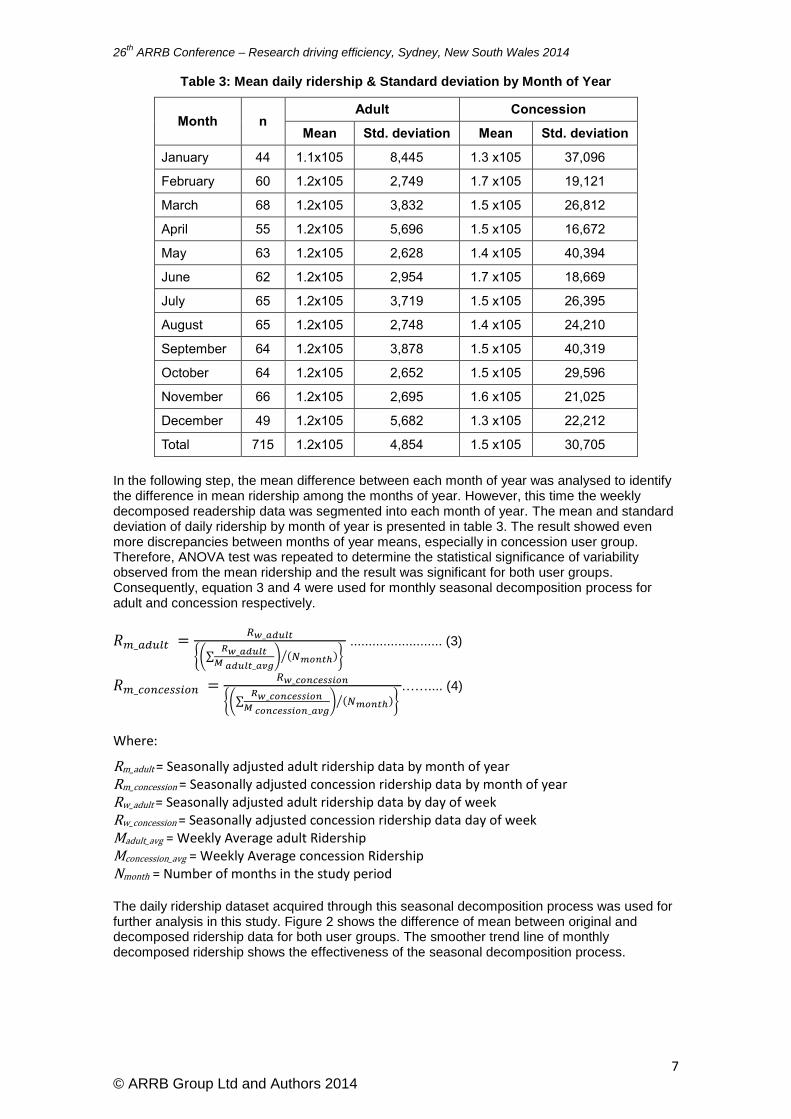
Table 3: Mean daily ridership & Standard deviation by Month of Year
Month n Adult Concession
Mean Std. deviation Mean Std. deviation
January 44 1.1x10⁵ 8,445 1.3 x10⁵ 37,096
February 60 1.2x10⁵ 2,749 1.7 x10⁵ 19,121
March 68 1.2x10⁵ 3,832 1.5 x10⁵ 26,812
April 55 1.2x10⁵ 5,696 1.5 x10⁵ 16,672
May 63 1.2x10⁵ 2,628 1.4 x10⁵ 40,394
June 62 1.2x10⁵ 2,954 1.7 x10⁵ 18,669
July 65 1.2x10⁵ 3,719 1.5 x10⁵ 26,395
August 65 1.2x10⁵ 2,748 1.4 x10⁵ 24,210
September 64 1.2x10⁵ 3,878 1.5 x10⁵ 40,319
October 64 1.2x10⁵ 2,652 1.5 x10⁵ 29,596
November 66 1.2x10⁵ 2,695 1.6 x10⁵ 21,025
December 49 1.2x10⁵ 5,682 1.3 x10⁵ 22,212
Total 715 1.2x10⁵ 4,854 1.5 x10⁵ 30,705
In the following step, the mean difference between each month of year was analysed to identify the difference in mean ridership among the months of year. However, this time the weekly decomposed readership data was segmented into each month of year. The mean and standard deviation of daily ridership by month of year is presented in table 3. The result showed even more discrepancies between months of year means, especially in concession user group. Therefore, ANOVA test was repeated to determine the statistical significance of variability observed from the mean ridership and the result was significant for both user groups. Consequently, equation 3 and 4 were used for monthly seasonal decomposition process for adult and concession respectively.
{(∑
) ( )⁄ }
......................... (3)
{(∑
) ( )⁄ }
…….... (4)
Where:
Rm_adult = Seasonally adjusted adult ridership data by month of year Rm_concession = Seasonally adjusted concession ridership data by month of year Rw_adult = Seasonally adjusted adult ridership data by day of week Rw_concession = Seasonally adjusted concession ridership data day of week Madult_avg = Weekly Average adult Ridership Mconcession_avg = Weekly Average concession Ridership Nmonth = Number of months in the study period
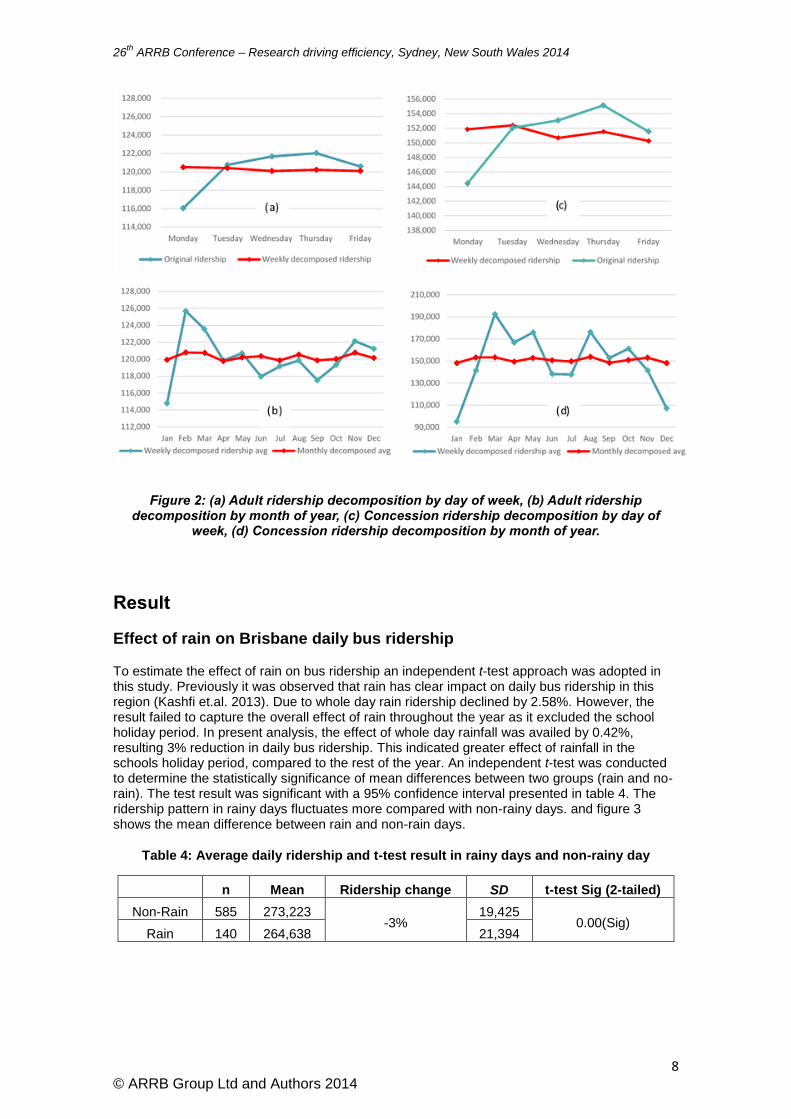
The daily ridership dataset acquired through this seasonal decomposition process was used for further analysis in this study. Figure 2 shows the difference of mean between original and decomposed ridership data for both user groups. The smoother trend line of monthly decomposed ridership shows the effectiveness of the seasonal decomposition process.
26th
ARRB Conference – Research driving efficiency, Sydney, New South Wales 2014
Figure 2: (a) Adult ridership decomposition by day of week, (b) Adult ridership decomposition by month of year, (c) Concession ridership decomposition by day of
week, (d) Concession ridership decomposition by month of year.
Result
Effect of rain on Brisbane daily bus ridership
To estimate the effect of rain on bus ridership an independent t-test approach was adopted in this study. Previously it was observed that rain has clear impact on daily bus ridership in this region (Kashfi et.al. 2013). Due to whole day rain ridership declined by 2.58%. However, the result failed to capture the overall effect of rain throughout the year as it excluded the school holiday period. In present analysis, the effect of whole day rainfall was availed by 0.42%, resulting 3% reduction in daily bus ridership. This indicated greater effect of rainfall in the schools holiday period, compared to the rest of the year. An independent t-test was conducted to determine the statistically significance of mean differences between two groups (rain and no-rain). The test result was significant with a 95% confidence interval presented in table 4. The ridership pattern in rainy days fluctuates more compared with non-rainy days. and figure 3 shows the mean difference between rain and non-rain days.
Table 4: Average daily ridership and t-test result in rainy days and non-rainy day
n Mean Ridership change SD t-test Sig (2-tailed)
Non-Rain 585 273,223 -3%
19,425 0.00(Sig)
Rain 140 264,638 21,394
26th
ARRB Conference – Research driving efficiency, Sydney, New South Wales 2014
This section examines whether all travellers groups behave similarly in the rain situation or there are differences between adult and discount travellers. It is conceivable that the degree of rain effects may vary by diverse user types. Figures 4 (a) and 4 (b) compare the bus ridership changes by adult and concession type passenger due to rain and non-rain conditions. Both graphs show significant and consistent ridership reductions during rainy days.
Figure 4: Impact of rain on daily ridership by user group; (a) adult (b) concession.
Table 5 reveals that observed ridership reduction is more influential with the concession user group than the adult.
26th
ARRB Conference – Research driving efficiency, Sydney, New South Wales 2014
Table 5: Impact of rain on adult and concession type ridership
Rainfall causes the adult passenger number to reduce only by 2%, compared to 5% on concession passenger. The result suggests high proportions of vulnerable passengers under discount user groups, who are more likely to avoid public transport on rainy days are responsible for this outcome. On the other hand, majority of adult ticket users consist of workforce. Hence, it is perceivable that they are less likely to be affected by adverse weather. An independent sample t-test was conducted to identify the statistical significance of rain effect for each category. For both groups, the t-test results confirmed that the ridership changes are statistically significant with 95% confidence with p = 0.000.
Consecutive rain day effect on daily ridership
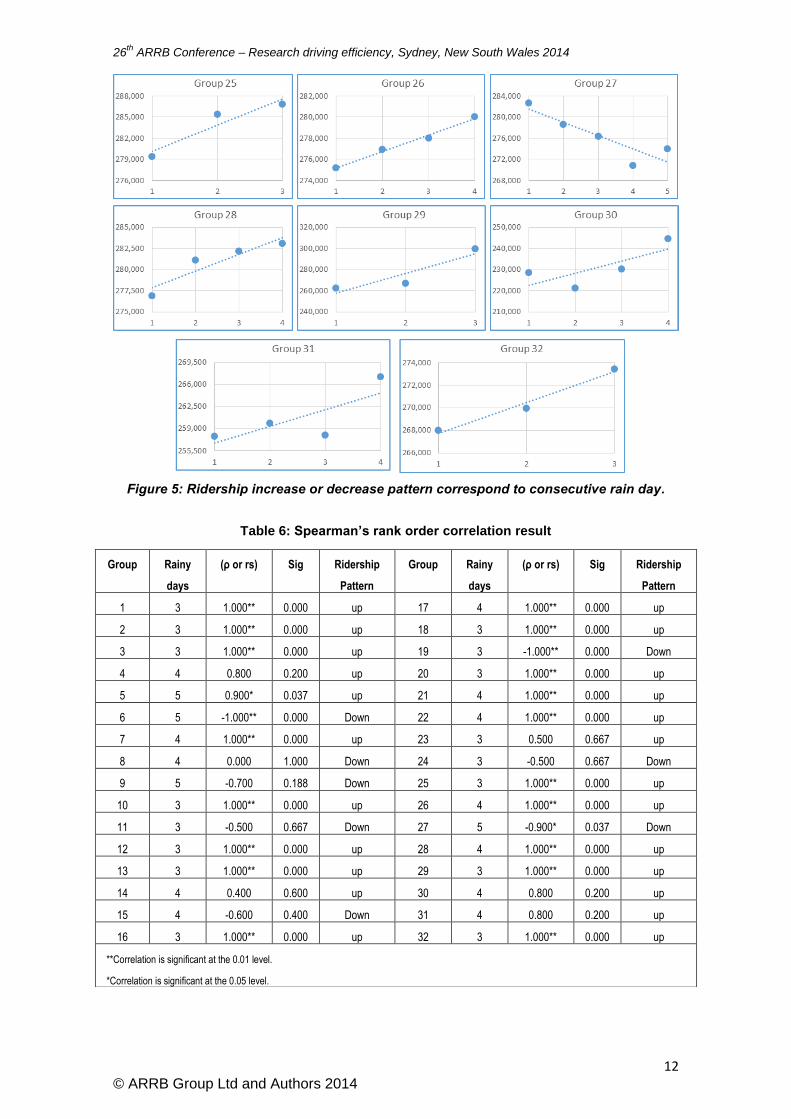
The subtropics climate characteristics of this region often cause a continuous rainfall for few days and in recent years the occurrence of continuous rainfall was observed more frequently (Holper, 2011). Therefore, it was essential to explore the relationship between consecutive rainy days and daily passenger volume. This section examines whether due to continuous rain,
ridership declines as before or if there any possible new insight. In order to determine the
association between variables, the Spearman rank-order correlation was performed. This statistical procedure measures the strength and direction of the association between two variables. If the rain continues for three or more days, it was defined as consecutive rain day. From the three year analysis period a total of 32 consecutive rainy day groups were identified that met the study condition. A trend line was fit through each group to identify effect of consecutive rain day on ridership and to determine whether the relationship extrudes a positive or negative trend. The following scatter plots show the increase or decrease pattern of daily ridership corresponding with consecutive rain days. The daily ridership amount was presented in X axis and the number of consecutive days in Y axis. The number 1 indicates first rainy day, 2 indicates second rainy day and so on.
User
Groups
Rain
Situation n Mean
Ridership
Change
Std.
Deviation
t-test Sig
(2-tailed)
Adult Non-Rain 585 120,651
-2% 3,603
0.00 (Sig) Rain 140 118,663 5,562
Concession Non-Rain 585 152,489
-5% 17,617
0.00 (Sig) Rain 140 145,570 16,915
26th
ARRB Conference – Research driving efficiency, Sydney, New South Wales 2014
Each scatter plot represents individual group. The above table shows the Spearman’s rank order correlation result with each group’s ridership trend and number of consecutive rain days. Overall, the analysis found an upward trend in ridership among majority of the groups. This dictates the understanding that if precipitation continues for few days across this region, ridership increases significantly day by day. Evidently, throughout the continuous rain day period, people switch to public transport from other transport mode. Earlier studies (Guo et.al, 2007; Khattak, 1991; Khattak et.al, 1995) also support the outcome of this analysis. They have notified that due to extreme weather people choose transit as preferred transport mode over others.
Several possible explanations could justify this study’s result. Some earlier studies discovered that a rainy day leads to higher congestion levels on road (Pisano and Goodwin, 2004; Smith et al, 2004). Therefore, attempting to avoid congestion on rainy days people may use transit. This phenomenon is particularly true for this region, due to reasonable number of bus ways, providing buses with their own right-of-way separate from general traffic and offering commuters a congestion-free run with fast, frequent and reliable services. Therefore, people choose bus transit as their preferred transport mode. Another reason is that inclement weather greatly increases the chance of a road traffic crash (Maze et al., 2006). Likewise, constant rain decreases road surface grip thus discouraging some people from driving. Finally, rainfall decreases significant cyclist volume in Brisbane (Ahmed et al., 2012) and perhaps they diverted from their own transport mode to transit during adverse weather. Khattak (1991) confirmed that commuters including pedestrian and cyclist change their travel mode from automobile to transit during extreme weather.
CONCLUSION
This paper examined the influence of weather variables on the daily bus ridership using Brisbane as a case study. Daily bus passenger data was acquired from all bus stops across the Brisbane City Council area. In addition, hourly cumulative rainfall data was collected from three weather stations within this area. This provided a robust dataset to study. As Brisbane residents are increasingly turning to bus transit, particularly its busway network, this analysis focused only on bus users among other transit modes.
A significant negative influence of precipitation on daily bus ridership was identified in this paper. It is also revealed that weather conditions have a more prominent influence on concession user groups than adult. A possible explanation is that a large portion of vulnerable (i.e. child, senior, school children) passengers were encompassed under concession user group. Hence, this user group are more affected by adverse weather. The results of this analysis could not be compared with previous studies because none offer this type of differentiation. Moreover, it is worth mentioning that whereas most of the previous studies focused their attention on how adverse weather influence daily ridership, this paper also contributes to the literature on continuous adverse weather condition. Although it was established that rain-fall affects ridership negatively, a positive relationship was observed between ridership and consecutive rainy days. This implies that throughout the continuous rain day period travellers may shift their transport mode to bus in this bus reliant region.
Overall, the findings of this paper are consistent with international literature and provide a solid basis for further investigation of weather–ridership related research. First of all, this study concentrated only on one weather factor (precipitation); whereas, combination of multiple metrological factors may affect the ridership differently. Hence, analysing the weather-transit relationship concerning the combined effect of various weather variables (i.e. temperature, humidity, and wind speed) can be a future scope for research. A similar analysis should be performed at suburb level using the nearest weather station data. This topic is interesting because individual suburb analysis will provide a more realistic result as it will be performed at the root level. This examination will also provide valuable insight to transit authorities whether providing better infrastructure at bus stops will attract riders and makes a difference in ridership changes in adverse weather.
26th
ARRB Conference – Research driving efficiency, Sydney, New South Wales 2014
Ahmed, F., Rose, G., Figliozzi, M. & Jakob, C. (2012) Commuter Cyclist’s Sensitivity to Changes in Weather: Insight from Two Cities with Different Climatic Conditions. Transportation Research Board Annual Meeting, 91st, 2012, Washington, DC, USA.
Arana, P., Cabezudo, S., and Peñalba, M. (2014) Influence of weather conditions on transit ridership: A statistical study using data from Smartcards. Transportation Research Part A (59), 1–12.
Australian Bureau of statistics (2011) Accessed January 2014. http://www.abs.gov.au/.
Brisbane City Council. Dedicated to better Brisbane (2013) Accessed January 2013.http://www.brisbane.qld.gov.au/
Burke, M., Sipe, N., Evans, R. and D. Mellifont (2006). Climate, geography and the propensity to walk: environmental factors and walking trip rates in Brisbane. In 29th Australasian Transport Research Forum.
Bureau of Meteorology, Climate Data Services (2013). Australian Government. http://www.bom.gov.au/climate/data-services/
BMTMC (Brisbane Metropolitan Transport Management Centre), 2013 Busway Operations Centre. Accessed May 12. http://www.bmtmc.com.au/index.php/entry/4.
Call, D. A. (2011) The Effect of Snow on Traffic Counts in Western New York State. American Meteorological Society, 3. 71-75.
Cervero, R., and K. Kockelman. (1997)Travel Demand and the 3Ds: Density, Diversity, and Design. Transportation Research D 2(3), 199–219.
Changnon, S. A. (1996) Effects of summer precipitation on urban transportation. Climatic Change 32 (4), 481-494.
Crowley, D. (2001) Transit Corridors and Land Use: Final Report. Urban Development Service,
City Planning, Toronto, Ontario, Canada.
Currie, G.,Goh. K., and Sarvi. M., (2013). An Analytical Approach to Measuring the Impacts of Transit 3 Priority. 92nd Annual Meeting of the Transportation Research Board. Washington, D.C.
Fielding, G.J. (1995) Transit in American cities. In: Hanson, S. (Ed.), The Geography of Urban Transportation, second ed. Guilford Press, New York, pp. 287–304.
Guo, Z., Wilson, N H. M. & Rahbee , A.(2007) Impact of weather on transit ridership in Chicago, Illinois.Transportation Research Record: Journal of the Transportation Research Board 2034
(1), 3-10.
Hendricks, S. J. (2005) Impacts of Transit Oriented Development on Public Transportation Ridership. University of South Florida, Tampa.
Hinchliffe, S. (2009) South East Queensland Regional Plan 2009–2031, Department of Infrastructure and Planning.
Hofmann, M. & O'Mahony, M. (2005) The impact of adverse weather conditions on urban bus performance measures. In Intelligent Transportation Systems, 2005. Proceedings. 2005 IEEE,
edited, 84-89: IEEE.
Holper, P. (2011) Climate Change Science Information Paper: Australian rainfall— past, present and future, Department of Climate Change and Energy Efficiency.
Kashfi, S., A., Lee, B., and Bunker, J.(2013) Impact of rain on Daily Bus ridership: A Brisbane Case Study. Australasian Transport Research Forum 2013 Proceeding. Brisbane, Australia.
Keya, C. (1992) Weather to Cycle. (1992) Ausbike 92: Proceedings of a National Bicycle Conference, Melbourne, pp. 152-155.
Khattak, A., Polydoropoulou, A. & Ben-Akiva, M. (1995) Commuters' Normal And Shift Decisions In Unexpected Congestion: Pre-trip Response To Advanced Traveler Information Systems. Transportation Research Record 1537, 46–54
Khattak, A. J. (1991) Driver Response to Unexpected Travel Conditions: Effect of Traffic Information and Other Factors. PhD dissertation, Department of Civil Engineering, Springer, Evanston, Illinois.
Khattak, A. J. and De Palma, A. (1997) The impact of adverse weather conditions on the propensity to change travel decisions: a survey of Brussels commuters. Transportation Research Part A: Policy and Practice 31 (3), 181-203.
Kittelson & Associates inc.,(2013) Transit Capacity and Quality of Service Manual Third Edition. TCRP REPORT 165. Washington D.C.
Kottek, M., Grieser, J., Beck, C., & B. & Rubel Rudolf, F. (2006) World map of the Koppen-Geiger climate classification updated. Meteorologische Zeitschrift 15 (3), 259-264.
Levine, L., (1990) Phoenix bus riders don’t swelter in the shelter. METRO Magazine July/August, pp. 38–39.
Maze, T.H., Agarwal, M., and Burchett, G., (2006) Whether weather matters to traffic demand, traffic safety, and traffic operations and flow. Transportation Research Record 1948, 170–176.
Mazloumi, E., Currie, G., and Rose, G., (2008) Causes of travel time unreliability – a Melbourne case study. 31
st Australian Transport Research Form.
Mesbah, M., Currie, G., and Prohens, N. P. (2014) The Effect of Daylight on Reliability of Transit Service: Case Study of the Melbourne Tram Network. Transportation Research Record 2014 Annual Meeting.
Mickel, J., (2006) 1,000 volunteers to test new smart card. Ministerial Media Statements. Queensland Government.
Nankervis, M. (1999) The effect of weather and climate on bicycle commuting. Transportation Research Part A: Policy and Practice 33 (6), 417-431.
Phung, J. & Rose, G. (2007) Temporal variations in usage of Melbourne’s bike paths. Proceedings of 30th Australasian Transport Research Forum, Melbourne.
Pisano, P. and Goodwin, L., (2004) Research Needs for Weather-Responsive Traffic Management. (CD-ROM). 83rd Annual Meeting of the Transportation Research Board. Washington, D.C.
QTT(Queensland Treasury and Trade), Queensland Government. (2011) Queensland Regional Profiles. Accessed May 20. http://statistics.oesr.qld.gov.au/report-viewer/run?__report=profile.rptdesign&sessionId=T8E02C6X0ZIV7MYR7G8PTSTQXT66C1O3S773AXVCAHTW1MGVHLB2REIR2L7FDV1S6PZIKU4HX2LVEALFFI83F7VUSEINSX5G7TELGKCFOWX6O46H3FIS2XNY4H5DR9X4&__format=pdf.
Richardson, A. J.(2000) Seasonal and Weather Impacts on Urban Cycling Trips. Victoria,
Australia: The Urban Transport Institute.
Sarkar, S. (2003) Qualitative evaluation of comfort needs in urban walkways in major activity centers." Transportation Quarterly 57 (4), 39-59.
26th
ARRB Conference – Research driving efficiency, Sydney, New South Wales 2014
Smith, B., et al., (2004). An Investigation into the Impact of Rainfall on Freeway Traffic Flow. (CD-ROM). 83rd Annual Meeting of the Transportation Research Board. Washington, D.C.
Stover, V. W. & Christine Bae, C.-H. (2011) Impact of Gasoline Prices on Transit Ridership in Washington State. Transportation Research Record: Journal of the Transportation Research Board 2217 (1), 11-18.
Stover, V. W. & McCormack, E.D. (2012) The Impact of Weather on Bus Ridership in Pierce County, Washington. Journal of Public Transportation 15 (1), 95-110
TRANSLink, Queensland Government. (2014) Concessions. Accessed February 15. http://translink.com.au/tickets-and-fares/concessions
TransLink Transit Authority (2010). New fare structure. Queensland Government, Brisbane, Australia.
Winter, M., Friesen, M. C., Koehoorn, M., and Teschke, K.(2007) Utilitarian Bicycling A Multilevel Analysis of Climate and Personal Influences. American Journal of Preventive Medicine 32(1).
Zarei, H., (2007) Relationship Between Non-Auto Travel and Characteristics of the Built Environment and Trip Makers: Empirical Analysis and Case Study. MS thesis. University of Toronto, Ontario, Canada.
ACKNOWLEDGEMENTS
The authors thank Briohny Rootman (Senior Network Analyst) TransLink Division, Department of Transport and Main Roads (TMR), and Bureau of Meteorology Department, Australia who provided invaluable data and support for this study.
AUTHOR BIOGRAPHIES
Syeed Anta Kashfi is doing PhD on Transportation planning area at Queensland University of technology under Faculty of Science and Engineering. She holds a Master Degree in Urban and Regional Planning from Queensland University of technology as well. She also holds a Bachelor degree in Architecture. Her research interest is in area of Active transportation, Transport policy making and their real world implication, particularly in human travel behaviour.
Dr Jonathan Bunker is Associate Professor in Transport Engineering with the Civil Engineering School at Queensland University of Technology. He researches and teaches in transit engineering and planning, traffic engineering, highway engineering, and infrastructure asset management. Jonathan has a Bachelor of Engineering (Civil) with Honours 1 and a Doctor of Philosophy (QUT). Prior to joining faculty at QUT he practised as a consulting transport engineer in Brisbane, Australia and Portland, Oregon. Jonathan is Past National President of the Australian Institute of Traffic Planning and Management.
The Author allows ARRB Group Ltd to publish the work/s submitted for the 26th ARRB Conference, granting ARRB the non-exclusive right to:
• publish the work in printed format • publish the work in electronic format • publish the work online. The Author retains the right to use their work, illustrations (line art, photographs, figures, plates) and research data in their own future works The Author warrants that they are entitled to deal with the Intellectual Property Rights in the works submitted, including clearing all third party intellectual property rights and obtaining formal permission from their respective institutions or employers before submission, where necessary.