ADVERTIMENT. Lʼaccés als continguts dʼaquesta tesi doctoral i la seva utilització ha de respectar els drets de la persona autora. Pot ser utilitzada per a consulta o estudi personal, així com en activitats o materials dʼinvestigació i docència en els termes establerts a lʼart. 32 del Text Refós de la Llei de Propietat Intel·lectual (RDL 1/1996). Per altres utilitzacions es requereix lʼautorització prèvia i expressa de la persona autora. En qualsevol cas, en la utilització dels seus continguts caldrà indicar de forma clara el nom i cognoms de la persona autora i el títol de la tesi doctoral. No sʼautoritza la seva reproducció o altres formes dʼexplotació efectuades amb finalitats de lucre ni la seva comunicació pública des dʼun lloc aliè al servei TDX. Tampoc sʼautoritza la presentació del seu contingut en una finestra o marc aliè a TDX (framing). Aquesta reserva de drets afecta tant als continguts de la tesi com als seus resums i índexs. ADVERTENCIA. El acceso a los contenidos de esta tesis doctoral y su utilización debe respetar los derechos de la persona autora. Puede ser utilizada para consulta o estudio personal, así como en actividades o materiales de investigación y docencia en los términos establecidos en el art. 32 del Texto Refundido de la Ley de Propiedad Intelectual (RDL 1/1996). Para otros usos se requiere la autorización previa y expresa de la persona autora. En cualquier caso, en la utilización de sus contenidos se deberá indicar de forma clara el nombre y apellidos de la persona autora y el título de la tesis doctoral. No se autoriza su reproducción u otras formas de explotación efectuadas con fines lucrativos ni su comunicación pública desde un sitio ajeno al servicio TDR. Tampoco se autoriza la presentación de su contenido en una ventana o marco ajeno a TDR (framing). Esta reserva de derechos afecta tanto al contenido de la tesis como a sus resúmenes e índices. WARNING. The access to the contents of this doctoral thesis and its use must respect the rights of the author. It can be used for reference or private study, as well as research and learning activities or materials in the terms established by the 32nd article of the Spanish Consolidated Copyright Act (RDL 1/1996). Express and previous authorization of the author is required for any other uses. In any case, when using its content, full name of the author and title of the thesis must be clearly indicated. Reproduction or other forms of for profit use or public communication from outside TDX service is not allowed. Presentation of its content in a window or frame external to TDX (framing) is not authorized either. These rights affect both the content of the thesis and its abstracts and indexes.
Transcript
ADVERTIMENT. Lʼaccés als continguts dʼaquesta tesi doctoral i la seva utilització ha de respectar els drets de lapersona autora. Pot ser utilitzada per a consulta o estudi personal, així com en activitats o materials dʼinvestigació idocència en els termes establerts a lʼart. 32 del Text Refós de la Llei de Propietat Intel·lectual (RDL 1/1996). Per altresutilitzacions es requereix lʼautorització prèvia i expressa de la persona autora. En qualsevol cas, en la utilització delsseus continguts caldrà indicar de forma clara el nom i cognoms de la persona autora i el títol de la tesi doctoral. Nosʼautoritza la seva reproducció o altres formes dʼexplotació efectuades amb finalitats de lucre ni la seva comunicaciópública des dʼun lloc aliè al servei TDX. Tampoc sʼautoritza la presentació del seu contingut en una finestra o marc alièa TDX (framing). Aquesta reserva de drets afecta tant als continguts de la tesi com als seus resums i índexs.
ADVERTENCIA. El acceso a los contenidos de esta tesis doctoral y su utilización debe respetar los derechos de lapersona autora. Puede ser utilizada para consulta o estudio personal, así como en actividades o materiales deinvestigación y docencia en los términos establecidos en el art. 32 del Texto Refundido de la Ley de PropiedadIntelectual (RDL 1/1996). Para otros usos se requiere la autorización previa y expresa de la persona autora. Encualquier caso, en la utilización de sus contenidos se deberá indicar de forma clara el nombre y apellidos de la personaautora y el título de la tesis doctoral. No se autoriza su reproducción u otras formas de explotación efectuadas con fineslucrativos ni su comunicación pública desde un sitio ajeno al servicio TDR. Tampoco se autoriza la presentación desu contenido en una ventana o marco ajeno a TDR (framing). Esta reserva de derechos afecta tanto al contenido dela tesis como a sus resúmenes e índices.
WARNING. The access to the contents of this doctoral thesis and its use must respect the rights of the author. It canbe used for reference or private study, as well as research and learning activities or materials in the terms establishedby the 32nd article of the Spanish Consolidated Copyright Act (RDL 1/1996). Express and previous authorization of theauthor is required for any other uses. In any case, when using its content, full name of the author and title of the thesismust be clearly indicated. Reproduction or other forms of for profit use or public communication from outside TDXservice is not allowed. Presentation of its content in a window or frame external to TDX (framing) is not authorized either.These rights affect both the content of the thesis and its abstracts and indexes.
Dental Care Process Characterization.
Spectroscopic Methods for a Robust
Determination of Remineralization and Dental
Sensitivity
Olga Kotkowska
Doctoral Thesis
Doctoral Studies in Chemistry
Supervisor:
Manuel Valiente
Department of Chemistry
Faculty of Science
2015
Report submitted to aspire for the Doctor Degree by:
Olga Kotkowska
Supervisors’ approval:
Prof. Manuel Valiente
Bellaterra, 25/11/2015
Nauce też trzeba się przyglądać, zwykle odkrywa to co już dawno wiadomo...
Pani Zielarka z „Rancza”
Pracę dedykuję Rodzicom,
w podziękowaniu za ustawiczne wsparcie
9
The work presented in this doctoral thesis has been done in collaboration with other research
groups and scientific centers to whom the author of this work is especially grateful for their
cooperation and guidance:
A novel methodology for the evaluation of the dentinal tubuli obliteration
In collaboration with Dr Rubén Cárdenes Universitat Pompeu Fabra, Barcelona, Spain
A novel HSI approach for the evaluation of the efficacy of the remineralising treatment Measurements were performed at Sapienza University di Roma, Roma, Italy In collaboration with Dr Juan Rosas Universitat Autonónoma de Barcelona
Dr Maike Windbergs and Branko Vukosavljevic Universität des Saarlandes, Saarbrücken, Germany
Study of the remineralised human dental tissues by the Synchrotron Infrared Spectroscopic Ellipsometry: optical constants determination Measurements were performed at BESSY II and ISAS, Berlin, Germany In collaboration with Dr Hinrichs Karsten Leibniz-Institut für Analytische Wissenschaften – ISAS, Berlin, Germany
Dr Ulrich Schade BESSYII, Helmholtz Zentrum Berlin, Germany
Application of FTIR Spectroscopy for the dental tissue characterization: a curve fitting approach Measurements were performed at SOLEIL, Paris, France and ALBA, Cerdanyola del Vallés, Spain In collaboration with Dr Christophe Sandt French Synchrotron National Facility, Paris, France
The author would like to also thank his Director Manuel Valiente for the possibility of forming a
part of his research group.
10
A part form the scientific investigation the author of this thesis performed multiple researches
for the private companies that finalized with the creation of the new toothpaste that is currently
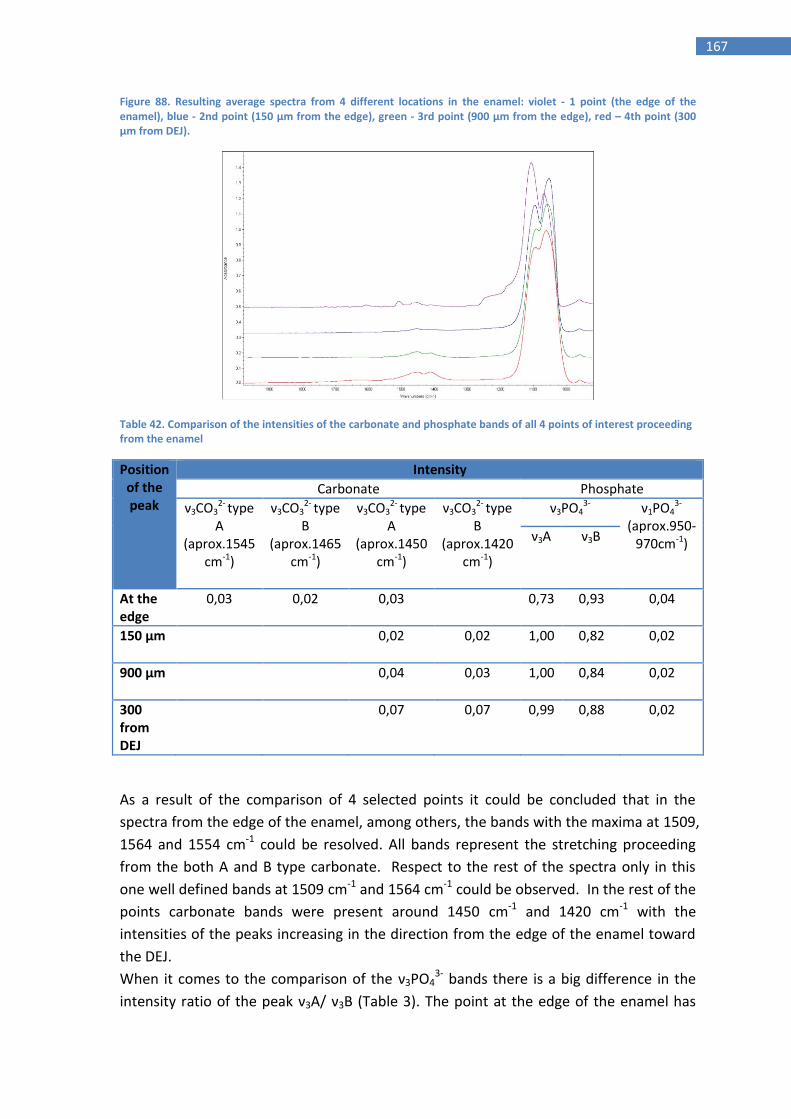
available on the market:
Lacer S.A, Barcelona, Spain
Colgate – Palmolive S.A , New York, USA
Studies presented in this doctoral dissertation resulted in three scientific papers that
were sent to journals enlisted below:
Kotkowska O, Cardenés R, Ricra E, Muroc J, Valiente M. “A novel method for the
evaluation of the dentinal tubuli obliteration” send to Journal of Dental Research
Kotkowska O., Rosas Portugal J., Vukosavljevic B., Windbergs M., Lubreras F, Serranti S,
Bonifazi G, Valiente M. “ Application of Hyperspectral Imaging and Raman Spectroscopy
for the characterisation of the remineralised dental tissue ” send to Dental Materials
Kotkowska O, Karsten H., Schade U., López Mesas M., Valiente M. “Application of IR
synchrotron ellipsometry for the characterisation of dental specimens: a reference
sample evaluation” send Journal of Dental Research
CPP-ACFP - Casein Phosphopeptide containing a sequence Ser-Ser-Ser-Glu-Glu
HSI – Hyper Spectral Imaging
nHAP – nano Hydroxyapatite
HA/HAP – Hydroxyapatite
FA/ FAP – Fluorapatite
NIR – Near Infrared
NMTD- remineralizing agent, mixture of ion exchange resins
DEJ - Dentin Enamel Junction
OTC - over-the-counter
SEM - Scanning Electron Microscopy
AFM - Atomic Force Microscopy
XPS - X-Ray Photoelectron Spectroscopy
SIMS - Secondary Ion Mass Spectrometry
TEM - Transmission Electron Microscopy
IR - Infrared
FTIR - Fourier Transform Infrared
CI - Crystallinity Index
MWIR – Medium Infrared or Mid-wave Infrared
FIR - Far Infrared
PCA - Principal Component Analysis
MVA - multivariate analysis
MIA - multivariate image analysis
PLS- Partial Least Squares
MCR- Multivariate Curve Resolution
MCR-ALS – Multivariate Curve Resolution Alternating Least Squares
CRM - Confocal Raman Microscopy
IRSE - Infrared Spectroscopic Ellipsometry
MCR (Multiplicative Scatter Correction)
SNV (Standard Normal Variate)
19
Introduction
1. Dental tissues
Teeth are anatomical hard structures rooted in the maxillae bones. They play the
principal function in the digestion process by participating in the mechanical
fragmentation of the food. Moreover they participate in the oral communication acting
as a resonance box that allows producing sounds but above all teeth are important for
the simple esthetical reasons (15). Being a crucial part of the human body and health it
causes an increase in the importance of dental health in modern society. Recently the
market is trying to fulfill the necessity to look after the dental health by the constant
development of the new methodologies and dental products (16).
2. Tooth structure
Tooth can be divided into three parts: crown, neck and root. Crown is the part that is
covered by the enamel and is the visible part of the tooth, whereas the root is covered
with cementum and is inserted in the dental alveoli located in the jaw. Neck is the
junction between the root and the crown and is located close to the gingiva. On the
Figure 1 the transversal cut through the tooth is presented where all the mentioned
parts can be distinguished. The most outer part of the teeth is the enamel, underneath
can be found dentine and in the center, the pulp cavity with all the nerves and blood
vessels.
Figure 1. Tooth structure (transversal cut)
20
2.1. Tooth enamel
2.1.1. Enamel histology
Enamel is built by the carbonated hydroxyapatite nanocrystals that are grouped in
clusters called prisms or rods. They are glued by interrods which are also hydoxyapatite
crystallites but oriented in the different direction. The rods are approximately 1-2 nm
thick and 1 mm long where the last value also corresponds to the thickness of the
enamel. Rods begin in the interjunction dentine-enamel and spread perpendicular to it
through the entire length of the enamel (17). On the Figure 2 the organised structure of
carbonated hydroxyapatite crystals is presented.
Figure 2. The organisation of dental enamel. SEM image of the acid – etched enamel where organised enamel rods (prisms) can be seen (18).
2.1.2. Chemical composition of enamel
Mature enamel is in 96% of weight made of hydroxyapatite (HA), 1% of protein and 3%
of water (17). It has a very high mineral density what can be easily demonstrated by
comparing its density (2,85-3,00 g/cm3) to the density of the pure HA monolith (3,08
g/cm3) (19).
From the crystallographic point of view, hydroxyapatite has a hexagonal structure with
space group P63/m. One unit cell contains 10 Ca 2+, 6 PO43- and 2 OH- ions. Phosphate
ions form hexagonal channels. Along those channels OH- ions are located; each ion is
surrounded by three calcium ions. Two Ca 2+ triangles are shifted by 60 ̊ (17). The shift in
the hydroxyapatite structure, as well as the entire structure, is presented on the Figure 3.
21
Figure 3. a) Hydroxyapatite and Fluorapatite structure b) Crystallographical structure of hydroxyapatite
In the crystallographic structure some common substituents can be encountered. As a
lattice component, the phosphate or hydroxyl groups can be substituted by the CO32- ion.
Biological apatites normally contain 2-3% of carbonate ions incorporated into the
structure (17).
Another common substitution is the incorporation of the fluoride ion into the crystal
lattice. During the creation of the dentine and enamel, fluoride replaces calcium and
creates fluorapatite (FA) - a different type of apatite that, from the crystallographic point
of view, differs from hydroxyapatite only in the substitution of the ion OH- by the F-. To
this structural change, FA can attribute its increased stability that results, for example, in
better resistance to the acid attacks than HA presents (20). Fluorapatite was one of the
first apatites which structure was revealed and described in the scientific literature (21).
During the mineralisation some other elements in minor or trace quantity are also
incorporated into the structure (Table 1 and 2). The concentration of those elements
may influence the general stability of the structure as well as the resistance of the
apatite against acid attacks. The distribution of the elements varies depending on the
teeth zone (17).
Table 1. Major and minor elements of the enamel (17) Table 2. Trace elements in the enamel (17)
22
2.1.3. Morphogenesis of the enamel
Enamel starts to grow from the dentine-enamel junction (DEJ). After the nucleation, the
created crystals start to elongate perpendicularly to the junction (c-axis) and form the
above mentioned rods (prisms). Crystals are created in the ameloblast- a protein cell
that produces protein matrix responsible for the development of the enamel. Enamel is
formed in three phases: secretion, transition and maturation (17).
Growth of the crystals is possible due to the unceasing supply of calcium produced by
the calcium pump. When the local concentration of the calcium is very high it
precipitates in forms of calcium phosphate. When it happens close to the ameloblasts
the amelogenins are segregated. Those proteins (amelogenins) control the morphology,
size and orientation of the growing crystal. One ameloblast produces one ribbon – like
crystal where the amelogenins are assembled in the spherical structure (nanosphere)
around it. In that moment the secretion is finished.
Transition phase begins when the ameloblast cell shrinks and the proteins are degraded
by certain enzymes. In the secretion phase, the content of the protein reaches 20-30%,
when the crystal enters into the maturation stage this percentage drops dramatically to
1% of weight (17). This decrease is attributed to the fact that in the last stage the
enamel grows in thickness and width and is almost completely covered with the mineral.
During this complex process the enamel is being transformed from the cellular tissue
into a mineralised tissue (17). The above described process is illustrated in the Figure 4.
23
Figure 4. Rod (prism) like crystal formation controled by the amelogenins (17).
2.1.4. Proteins role in the mineralisation of enamel
Protein extracellular matrix located in the ameloblasts is responsible for the production
and further mineralisation of the enamel. Almost 80% of the proteins that form the
24
matrix are amelogenins. As a continuation, the role of amelogenins as well as non-
amelogenins in the mineralization process is explained.
Amelogenin plays a very important role in the enamel creation. The self-assembled
nanospheres influence the orientation of the growing hydroxypaptite crystals during the
biomineralization process of the enamel (22). The amelogenin establish the orientation
of the alignment of apatite crystals what results in the “ribbon-like” form of the
structure (22) (23). In general, it is believed that amelogenin on a developing stage of
the enamel, is a key protein that delivers the calcium and phosphate ions that are
further transferred from the protein into the growing crystal (24).
According to the literature (25), (26), (27), (28), (18), (29) enamel mineralization
depends in 90% on the presence of amelogenins but there are other proteins that can
alter the remineralization process such as enamelins, tuftelins, ameloblastins and
proteases.
Enamelin is a glycoprotein that represents only 5% of extracellular matrix; nonetheless it
happens to be essential in the enamel formation (25). Its lack proved to cause a disorder
during the amelogenesis (6). After proteolithic a cleavage, enamelin is cut into six pieces,
among all of them enamelin 32kDa occurred to be the most stable one and it has the
strongest affinity towards the hydroxyapatite (25). The enamelin supports the
nucleation of hydroxyapatite together with amelogenin (27). Basing on the literature
knowledge, enamelin itself will not alter the biomineralization of enamel, only in
presence of amelogenin the difference can be noticed, thus those two proteins interact
with each other. It is believed that enamelin regulates the amelogenin assembly and the
further process of nucleation and hydroxyapatite crystals formation (28).
Tuftelin is believed to play an essential role in the hydroxyapatite nucleation too (18),
(29). Basing on its characteristics, anionic character and localization in the newly
secreted matrix enamel, it is postulated to contribute highly in the biomineralization of
enamel (29). Paine et al. discovered proteins that interact with tuftelin (TIP). Among
them the 39 kDa TIP molecule was selected as the protein that contributes in linking the
ameloblasts with the enamel surface (29).
The presence and connections between some of the crucial proteins for the enamel
development are illustrated in the Figure 5.
25
Figure 5. Creation of the enamel at the DEJ (dentin enamel junction) with the participation of proteins. Ameloblasts express the proteins crucial for the creation of the enamel (18). Proteins segregated by theameloblasts: DSPP- dentine sialophosphoprotein,, TIP-39, tuftlein, enamelin, AMBN- amelogenin; EMSP-1- Enamel matrix serine
2.2.1. Histology and chemical composition of dentin
The internal tooth part, beneath the enamel layer is formed by the dentin. This dental
tissue has a calcified form filled with tubules that are the reminiscences of the
odontoblast location during the dentin formation (dentinogenesis). In the adult tooth,
the resting cell bodies are accumulated at the inner edge of the dentin where they form
the boundary with the pulp chamber (30), (31).
Dentin is constituted in 50 % wt of mineral (mostly hydroxyapatite), 40% wt organic
phase and 10% wt of fluids. The composition of dentin is similar to the composition of
bone. The organic phase in 98% wt refers to collagen type I fibers that form the network
which builds the dentin matrix (31).
The calcified content of the dentin is mostly hydroxyapatite and is located between the
collagen fibers (intrafibrillar) or attached to it (extrafibrillar). The morphology of the
mineral is mostly plate-like and cylindrical (20-5 nm big). Proteins such as glycoproteins
and proteoglycans on the other hand, cover the collagen fibrils. The most crucial
components for the dentin functioning are phosphoproteins responsible of inducing the
mineral nucleation and binding to the calcium phosphates (31). Unlike the enamel,
26
dentin is able to repair itself due to the presence of the previously mentioned proteins,
but most of all, thanks to the odontoblasts that can be stimulated in order to form more
tissue (30).
2.2.2. Dentin morphology
Depending on the stage of formation, three types of dentin can be found: primary,
secondary and tertiary. The first one is produced during the formation of the tooth and
constitutes the major part of its mass. When the root is formed the secondary dentin is
produced by the odontoblast cells which are deposited on the pulpal part of the primary
dentin. As a result of some external stimuli such as caries creation, application of
restorative products or some trauma, tertiary dentin can be formed (32).
2.2.2.1. Dentinal tubules
One of the main characteristics of the dentin is its permeability; the entire material is
filled with dentinal tubules. Those structures resemble an inverted cone with the
diameter from 0,5-0,9 µm at the DEJ (dentin enamel junction) increasing to 2-3 µm near
the pulp (33). Since the tubule diameter is bigger close to the chamber comparing to the
DEJ region the permeability of dentin increases exponentially in the direction of the
deeper parts of the tooth (34) (Figure 6).
Figure 6. Distribution of the dentinal tubules. Tubules close to the DEJ are smaller and the density of tubules is also smaller. Going deeper into the dentine, density and the size of the tubules increases.
27
The longitude of the tubules normally oscillates from 3 to 3,5mm and has an S - like
shape. They are densely packed throughout the entire dentin. It is calculated that in the
outer dentin there are 15 000 tubules/mm2, whereas in the central part increases to
25 000/mm2 and up to 55 000/mm2 close to the pulp chamber region (32).
Dentinal tubules are filled with the fluid responsible of transmitting the sensations, such
as pain, to the pulp chamber where the nerves are located. The permeability of dentin is
one of the main causes of the hypersensitivity of teeth (Figure 7).
Figure 7. Cross-section of the dental tubules filled with the fluid that transmits the stimuli.
3. Dentinogenesis
The essential role in the dentin formation plays the odontoblast cells. Firstly they form
the predentin that works as a base for the dentin formation. All along the
dentinogenesis, odontoblasts perform the secretion and synthesis of the dentin
constituents. They are organised in a columnar shape and the dental tubules are the
reminiscence of its activity during the dentinogenesis. Once the process is finalised and
the dentin is created odontoblasts move to the inner edge of the dentin where they are
stored in order to produce the tertiary dentin when it is necessary. The number of
odontoblast in teeth diminishes with age as the pulp gradually retracts (32).
The dentinogenesis occurs in two different phases: formation of the predentin and the
subsequent mineralisation. At first preodontoblasts are created in the basement
membrane. Afterwards cells undercome polarisation in order to be dentinogenically
active. After this step, the predentin starts its formation (Figure 8). Simultaneously, the
28
basement membrane diminishes in order to be replaced by the new created predentin
(32).
The next step is the creation of the nonmineralised mantle dentin and the formation of
the type I collagen that create a dense network of fibres. The subsequent mineralisation
process begins in the matrix vesicles located in the mantle dentin. Once the initial
crystals are formed the mineralisation of the tissue begins (32).
Figure 8. Predentin region in dentinogenesis (32). Odontoblasts segregate collagen and proteoglycan (PG) that form extracellular predentin. Proteins such as phosphorylated phosphoprotein (PP-H) and Gla- protein are transported
by the odontoblasts into the mineralisation front in order to implement the mineralisation process.
4. Demineralization of the teeth
Dental caries are defined as a localised destruction of the hard tissue caused by the acids
produced during the bacterial activity in the buccal plaque. The process begins in the
bacterial biofilm by the fermentation of the carbohydrates (present due the ingestion of
food) and starts to be visible on the hard tissue. Dental caries are the most common
reason of the oral pain and the tooth loss (7).
The origin of the dental caries is the imbalance in the pH of the mouth caused by the
acid formation proceeding from the bacterial plaque. Biofilm is a natural and
indispensable part of the buccal environment. It is responsible of the protection against
the desiccation and resistance to antimicrobial agents. However, when this
microenvironment is out of balance the endogenous bacteria Streptococcus mutans,
Streptococcus sobrinus and Lactobacillus produce too much acid causing the drop of the
pH what results in the demineralization of teeth (7). As a consequence the apatite is
dissolved and the subsequent reaction takes place:
29
Ca10(PO4)6(OH)2 + 8H+ 10Ca
2+ + 6(HPO4)
2- + 2H2O (Eq.1)
Caries can normally be differentiated on the enamel as white spots that are basically
small areas that undercame the demineralization. If the described process is not
stopped, the created cavity can enlarge, finally reaching the pulp and the nerve endings,
perceived by the organism as pain (Figure 9). Untreated dental caries can lead even to
the necrosis of the pulp and the necessity of the piece extraction (8).
Figure 9. Scheme of the dental caries propagation
There are a wide number of risk factors that favor the dental caries creation and
development (7):
Inadequate salivary flow and composition
Elevate number of bacteria
Insufficient supply of fluoride ions
Gingival recession
Genetic factors
Poor oral hygiene
Poor dietary habits
5. Remineralization of teeth
The process of demineralisation and remineralisation takes place constantly during the
day in the oral cavity. The balance between those two processes stops, reverse or
maintains the progress of caries disease. Remineralisation process prevails frequently,
especially thanks to the saliva which acts as a pH buffer (35). The crucial function play
the proteins, such as glycoproteins, that are adsorbed on the tooth surface where they
form a pellicle layer and additionally the phosphoproteins which regulate calcium
activity. Mentioned pellicle protects enamel from mineral loss especially when acidic
conditions are introduced being able to reverse the demineralization process (Eq.2) (36).
Ca10(PO4)6(OH)2 + 8H+
↔ 10Ca
2+ + 6(HPO4)
2- + 2H2O (Eq.2)
30
5.1. Prevention and treatment of dental caries
Without any doubt the most popular agent used for enhancing the teeth
remineralization process nowadays is fluoride. Beside the antibacterial properties at low
concentrations, fluoride stops the demineralization and favours the opposite-
remineralizing process on the tooth surface. At higher concentrations it creates a
calcium fluoride layer that protects the enamel from the formation of caries (11), (12). It
reacts with hydroxyapatite (Kps ~ 10-40) and forms fluorapatite (Kps ~ 10-55) which is less
soluble. Described processes, is represented by the chemical equation:
Ca10(PO4)6(OH)2 + 2F- Ca10(PO4)6(F)2 + 2(OH)
- (Eq.3)
Attin et al (12) evaluated the influence of fluoridation on the hardness of enamel. Teeth
treated with bleaching agent and without subsequent fluoridation showed significantly
higher hardness loss than fluoridated samples. Similar conclusion was made by Gladwell
et al. (37) but in their studies fluoride ion was directly added to the bleaching gel. As a
result a significant reduction in lesion depth was recorded. Generally it is claimed that
presence of fluoride at level of 1 ppm increases enamel remineralization (11), (38).
Apart from fluoride, a wide number of agents with different chemical approaches
designed for teeth restoration has been evaluated (Table 3). One of them are tricalcium
Fluoride Antibacterial, reacts with hydroxyapatite and forms fluorapatite which is less soluble than hydroxyapatite, desensitizing agent,
In high concentrations it can be toxic especially during early childhood, can cause dental fluorosis, stomach ailments, acute toxicity, skin rashes (perioral dermatitis), and impairment in glucose metabolism
Teeth treated with bleaching agent and without fluoridation show significantly higher hardness loss and reduction on lesion depth than fluoridated samples
Almost all of the toothpastes contain fluoride in its composition
(50),
(51),
(52),
(53),
(54)
β-TCP Supplies bio-available calcium or fluoride
Formation of calcium-phosphate (calcium fluoride) complexes that diminish the bio-available calcium and fluoride
Low concentrated TCP, TCP + TiO2 or other metal oxides, coating particles of TCP with surfactants, polymers or carboxylic acids what limits interactions between calcium and phosphate
Clinpro™ 5000, Vanish™
(9),
(39),
ACP Delivers calcium and phosphate salt when ACP is dissolved in human saliva; remineralizing ions are released separately, achieves the desensitizing effect
Under physiological temperatures and pH 7.4 it hybridizes and forms octacalcium phosphate to subsequently form a surface apatite what prevents from penetration of calcium and fluoride into the subsurface
Created ACP hybrids with silica and zirconia that cause retardation of ACP transformation into hydroxyapatite form (HAP). Presumably Si and Zr are adsorbed on nucleation and growth sites of hydroxyapatite and stop HAP formation. Another solution is the separation of the components in the toothpaste tube in order to deliver soluble calcium and phosphate separately to the enamel surface
Arm& Hammer® Enamel Care™, Enamelon TM
(9),
(41),
(56)
CPP-ACP Remineralizing and anti -cariogenic properties, controls the spontaneous precipitation of calcium phosphate, allows achieving subsurface remineralization by maintaining high concentration gradient of calcium and phosphate ions that
The amount of calcium and phosphate bounded by CPP grows when pH increases. It begins with pH 5 and stops at pH 9 to reach the level when the CPP bounds the amount of ions that are equivalent to its weight. When the pH drops the ions are liberated. Most of the products that apply this technology are active in pH 4 to 7 and are the most effective in 5.5
migrates into the subsurface lesions, can include fluoride
CPP-ACFP
Remineralizing ability of enamel subsurface lesions, the main product of CPP-ACFP formation is fluoroapatite that is more resistant to acid conditions than hydroxypaptite
The pH values in the range of 4.5 to 7 with the best effect at pH 5,5. At pH below this value CPP-ACFP is known to have better remineralizing proprieties than CPP-ACP
Recaldent ® (9)
Bio glass/ Nova- Min®
Bioactive glass (calcium sodium phosphosilicate) as an alternative for the standard abrasive silica, combined with the fluoride, reduces hypersensitivity
Precipitation of hydroxycarbonateapatite on the teeth surface and therefore the occlusion of dental tubules, when fluoride is added also fluorapatite is deposited
Sensodyne® Repair and Protect, Sensodyne® Complete Protection
(57),
(58)
Arg- CaCO3
Physically seals dentin tubules with a plug that contains arginine, calcium carbonate, and phosphate, reduces hypersensitivity
Calcium carbonate with arginine let the positively charged amino acid binds the negatively charged dentin what facilitates the attraction of calcium ions to form a sealing layer
Colgate® Sensitive Pro-Relief™
(59),
(60),
(61),
(62),
(63),
n-HAP nHAP has a strong affinity to the tooth and can easily be adsorbed on the enamel surface what helps to promote remineralization, reduces hypersensitivity
The action of nanoparticles is the deposition on the enamel surface in such a way that it seals the exposed dentinal tubules forming a wash-resistant protective layer helping to decrease the dentin sensitivity
BioRepair® and BioRepair® Sensitive, ApaCare®, Desensin® Dentaid,
Teeth hypersensitivity is a common clinical problem in modern society. Its symptoms are
short and sharp pain that comes from the exposed dentin as a result of a susceptibility
to thermal, chemical, osmotic or dehydrating factors (1).This disease affects a wide
range of adult population, 25-30 %, women are more eager to suffer from
hypersensitivity, especially at age 30-40. Also young patients present high prevalence
due to teeth erosion. Older patients on the other hand tend to suffer from
hypersensitivity as a result of a periodontal disease and its treatments (66). In this case,
the prevalence of hypersensitivity is 72.5-98% (67). Such high prevalence indicates that
hypersensitivity of teeth is an important issue and should be treated in order to prevent
or eliminate the pain.
The principal cause of the hypersensitivity of teeth are exposed dentin tubules often
associated to the gingival recession that leaves the cementum exposed to eroding or
abrasive factors. Brannstorm’s hydrodynamic theory of pain explains the mechanism as
a change in the fluid flow in dentine tubules as a result of external stimuli such as
changes in the temperature or osmotic parameters. Mentioned factors stimulate the bar
receptor and depolarize the nerve. Since there is a relationship between the amounts of
the fluid flow in the tubules and the charge produced in the nerve fibers, the
uncontrolled movement of the fluid such as inward flow cause by its expansion with the
temperature, leading to pressure changes across the dentin perceptible by patient as
pain (Figure 10) (1), (68) (69).
Figure 10. Scheme of the mechanism that causes the hypersensitivity of teeth. An external stimuli affects the
nerves located on the odontoblast at the end of the dentinal tubuli. This stimulus affects the flow of the dentin fluid what changes the charge of the nerve endings and results in pain reception
37
The hypersensitivity of teeth can be remarkably reduced by the sealing of dentinal
tubules or by preventing the nerves depolarization. The second approach is currently
reached by potassium containing compounds like potassium nitrate (Crest® Sensitivity
Protection Fluoride Toothpaste, Orajel® Sensitive Pain Relieving Toothpaste for Adults,
Colgate® Sensitive Maximum Strength Toothpaste and Protect® Sensitive Teeth Gel
Toothpaste). This compound penetrates into the tubules and reaches the nerve, than
the potassium ions increase the contraction on the extracellular fluid around the nerves
causing its depolarization and the elimination of pain (1) (67) (68) (70).
The occlusion of dental tubules, apart from the surgery intervention or laser etching (2),
can be also reached by the over-the-counter (OTC) products. Most of them are salts that
can precipitate inside the tubules resulting in its occlusion: stannous fluoride (Gel Kam®
Pro-Dentx®, and OMNI product lines of stannous fluoride) (3), oxalate (Protect Dentin
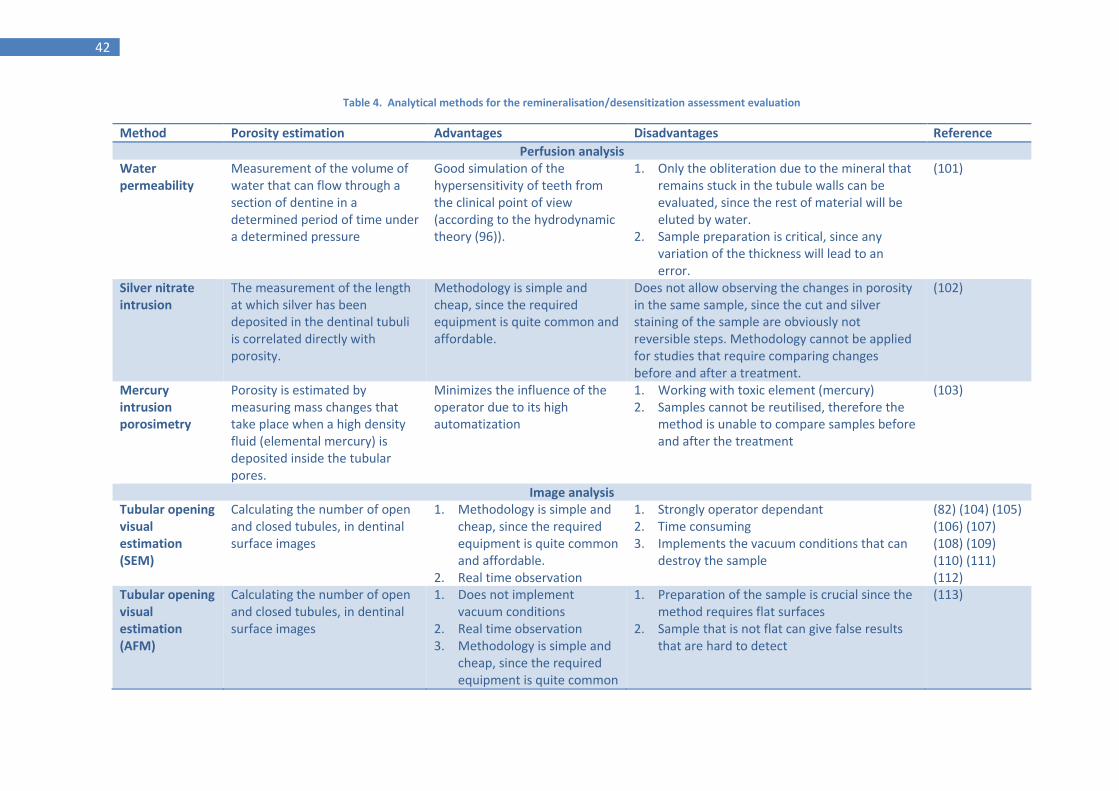
Measurement of the volume of water that can flow through a section of dentine in a determined period of time under a determined pressure
Good simulation of the hypersensitivity of teeth from the clinical point of view (according to the hydrodynamic theory (96)).
1. Only the obliteration due to the mineral that remains stuck in the tubule walls can be evaluated, since the rest of material will be eluted by water.
2. Sample preparation is critical, since any variation of the thickness will lead to an error.
(101)
Silver nitrate intrusion
The measurement of the length at which silver has been deposited in the dentinal tubuli is correlated directly with porosity.
Methodology is simple and cheap, since the required equipment is quite common and affordable.
Does not allow observing the changes in porosity in the same sample, since the cut and silver staining of the sample are obviously not reversible steps. Methodology cannot be applied for studies that require comparing changes before and after a treatment.
(102)
Mercury intrusion porosimetry
Porosity is estimated by measuring mass changes that take place when a high density fluid (elemental mercury) is deposited inside the tubular pores.
Minimizes the influence of the operator due to its high automatization
1. Working with toxic element (mercury) 2. Samples cannot be reutilised, therefore the
method is unable to compare samples before and after the treatment
1. Preparation of the sample is crucial since the method requires flat surfaces
2. Sample that is not flat can give false results that are hard to detect
(113)
44
Objectives of the PhD thesis
In previous introduction, two most common dental diseases: hypersensitivity of teeth
and caries creation have been highlighted. The objective of the present studies is to
propose new approaches for the evaluation of the efficacy of the restorative treatments.
Furthermore, an influence of the mentioned treatments on the dental tissue micro-
structure is to be studied.
To investigate the porosity of dentin tissue, a novel methodology has been developed by
applying disc model technique and observation of the dentin tubuli under the Scanning
Electron Miscroscope (SEM). This will include specifically developed MATLAB software to
determine the evolution of dentinal tubuli. This technique aims to be a reliable scientific
tool to investigate the efficacy of obliteration products.
A Hyperspectral-Near Infrared Imaging (NIR HSI) technique is proposed as an effective
and fast way to observe the influence of a remineralising treatment on dental enamel.
The methodology consists of image acquisition, processing and multivariate data
treatment. Confocal Raman Microscopy will be applied to check the reliability of the
obtained results. Influence of the fluoride concentration, presence of protein application
and contact time under this treatment are to be studied by the implementation of the
optimized NIR-HSI method.
In order to evaluate the influence of the fluoride-based remineralising treatment on the
teeth micro-structure a synchrotron Infrared Ellipsometry is to be applied. Since the
success of synchrotron measurements and subsequent data treatment depends on the
adequate reference sample selection, a series of experiments and simulations are to be
designed in order to choose a suitable reference sample.
Further investigation of the teeth structural changes are to be performed with the FTIR
spectroscopy. A detailed study of the various points of the targeted tooth under the
remineralisng treatment will provide key information on the influence of the related
treatment on the dental tissue. Deconvolution approach is to be used in order to
investigate the structure of teeth and Principal Component Analysis is to be
implemented to compare various regions of the tooth and to reveal the spectral
differences.
A part from the scientific objectives of the developed research lines a multidisciplinary
collaborative work with various research groups is planned in order to ensure the
appropriate development of the main objectives.
45
Methodology
8. Scanning Electron Microscopy
Scanning Electron Microscopy (SEM) is commonly applied in the characterization of the
surface of a given material at high magnifications. In this method, interaction of the
electrons with the material’s surface is represented on the digital image. It is considered
a very powerful method that allows producing 3D images on a high resolution and
observing with details studied material (15).
First step is the acceleration of the electrons by the electric gun; the flux of generated
electrons hits the sample thanks to the high vacuum conditions created at the
experimental chamber. Subsequently, they are reflected from the sample and gathered
on the detector. The final image is the representation of the electrons interactions with
the elements of the sample. The principal parts of the equipment are represented at
the Figure 11.
Figure 11. SEM set up
Formerly, in order to observe a sample with SEM, the sample had to have a conductive
surface. In the case of having a nonconductive material, the sample was covered with a
thin layer of a conductive material (silver or gold) for its observation. Nowadays, thanks
to the advancements in the scientific technology it is possible to work with sample under
a low conductivity configuration without the necessity of the metallization pretreatment.
46
Due the charge compensation systems in new SEM instruments, electrons accumulated
on the surface of the sample are eliminated by a gentle flux of nitrogen that prevent
from over- charging (117).
In presented work SEM was applied in order to determine the characteristics of the
denitn surface. Images of the dentinal tubuli before and after the remineralising
treatments were obtained and analyzed by the self-developed analytical software that
allowed the evaluation of the efficacy of the treatment. The new generation SEM with
charge compensation system allowed observing the changes of the studied sample
without the necessity of metallization (Figure 12).
Figure 12. SEM images of dentinal tubuli a) before and b) after the remineralizing treatment
9. Raman spectroscopy
Raman spectroscopy is a technique that delivers information about the structure and
composition of the studied material within a very short time and with high resolution.
Through this method, vibrational and rotational modes of the law frequency are
detected. Light proceeding from the laser (visible, IR or ultraviolet range) is inelastically
dispersed on the sample surface. As a result of this process, changes in the
characteristic frequency of the analyzed material (independent from the frequency of
the incident light) are obtained (118).
When photons with energy higher than the energetic difference between two
vibrational (or rotational) levels of the molecule collide with it, most of the energy goes
through, but a small part of it gets dispersed. It is caused by the photon with the exact
amount of energy necessary to provoke the transition of the molecule into a higher
energy level (not permitted) that is abandoned by the molecule at once, in order to
come back to the permitted level of energy by the emission of a photon. The frequency
of the emission received back is equivalent to the difference of the energy between
those two occupied levels.
If the result of the interaction between the photon and the molecule is the same
frequency than the incident photon, we speak about an elastic collision. Molecule comes
back to the same energetic state as before the collision and the emitted photon has the
same energy as the incident one – Rayleigh dispersion is (Figure 13)
47
On the other hand, when the dispersed photon has different frequency than the
incident one, the inelastic collision takes place and two phenomena can occur: molecule
absorbs the energy and the emitted photon has smaller energy than the incident one
(Stokes scattering or red shift) or the molecule loses energy and the emitted photon has
higher energy than the incident one (anti-Stokes scattering or blue shift).
Figure 13. Illustration of a Raman Scattering
Raman is a non-destructive method where sample is analyzed directly and without any
surface pretreatment. In present study Confocal Raman technique was used in order to
detect and distinguish fluorapatite from the hydroxyapatite on the enamel surface
treated with various remineralising products.
In the confocal technique, the resolution and contrast is increased thanks to the pinhole
(confocal detector aperture) that is introduced into the instrumentation and that
eliminates the light that is not focused properly. The out of focus light is rejected
improving the resolution and reducing the background signal (Figure 14). In difference
with the traditional Raman where only few spectra are acquired at one experimental
point with confocal Raman the entire Raman spectrum is collected at each point. With
this methodology a depth profile or a 3D image of the sample can be obtained.
48
Figure 14. Confocal microscopy principles
Experiments performed in previous studies with the traditional Raman instrumentation
on the curved enamel surface did not allow the study due to the changes of the enamel
topography (15). With the instrumentation used in the present study, small maps
(1000x1000µm) on dental samples were acquired and both FA and HA were
distinguished in the cluster analysis of the spectra.
10. Synchrotron Techniques
Synchrotron is an accelerator able to maintain a closed orbit of the circulating particles.
Synchrotrons are successors of cyclotrons in which the constant flow of the particles
accelerated by the electric field is curved by a magnetic field. In cyclotrons both, electric
and magnetic fields, have constant intensity whereas in synchrotrons applied fields are
not constant (119).
Nowadays there are around 70 synchrotron facilities around the world where
researchers from various fields meet in order to perform scientific experiments.
Synchrotron methods have been applied in biology, chemistry, physics, material science,
cultural heritage and many more branches of science (120). In this PhD project, IR
synchrotron ellipsometry (section 11.3) was used in order to determine the micro-
structure of dental tissues (120).
There are two kinds of manipulations that can be performed in this type of accelerators:
particles can collide with each other or can maintain the same direction of the
movement. In the first case there are two beams of particles accelerated in opposite
directions in order to cause its collision and to study the resulting products. In the
second type, only one beam is accelerated with constant energy and with a curved
49
trajectory. As a result synchrotron radiation with vide range of energy (from IR to X Rays)
is emitted (121).
The intensity of synchrotron radiation is much higher than in case of traditional sources
of electromagnetic wave. Another advantage is its high brilliance. In other words,
synchrotron beam can be focused into a very small area and as a consequence obtain
very high intensity. Synchrotron radiation brilliance is million times superior to the
traditional sources of energy. It is also tunable; it means that from the entire beam an
adequate and concrete wave range can be extracted. Due to the characteristics of the
applied radiation, IR microscopic or ellipsometric measurements have a very high spatial
resolution and a high signal to noise ratio.
Synchrotron accelerators have various constants components present in each facility
(Figure 15) (15):
Source of particles
Auxiliary accelerators: particles are injected in the linear accelerator (Linac) and
are directed into a Booster- an accelerator where they get the final energy
before being injected into the Storage Ring
Radiofrequency cavities (RF): cavities where oscillating voltage is applied in
order to accelerate the particles and maintain them in parts (packages) of the
same velocity and frequency
Magnetic elements: magnets with poles oriented perpendicularly to the
particles orbit. It is responsible for focalization and bending the beam trajectory.
Beamlines: a certain range of wavelength is extracted from the main beam and
directed to the experimental beamlines. A linear cavity transports the radiation
into a specific instrumentation that adapts the beam into the necessities of the
applied methodology. Normally optic and experimental cabin together with the
work station form each beamline. In case of IR beamline the instrumentation
consists of a series of mirrors, monochromators and the IR microscope
(ellipsometer).
Figure 15. Scheme of the synchrotron accelerator
50
11. IR spectroscopy
Infrared spectroscopy (IR) implies the infrared range of the electromagnetic wave. It
includes three regions depending on the energy: near, medium and far infrared. The far
infrared (FIR) (10 - 400 cm-1), located next to the microwaves, has the lowest energy
from all IR waves and is mostly applied in the rotational spectroscopy (Raman). Medium-
infrared, or mid-wave infrared (MWIR) (400-4000 cm-1) is used to study the fundamental
vibrations of the molecules whereas near-infrared (NIR) (4000-14000 cm-1) can excite
overtones or harmonic vibrations (122).
IR technique is based on vibrations of atoms that build the molecule. It is performed by
interaction the IR wave with a sample and observing which part of the spectral radiation
is absorbed at particular energy. The peak that appears at the IR spectrum represents
the vibration of a molecule and has a specific frequency. In order to see the vibration in
the IR light, an electric dipole moment of the molecule has to undecome a change. As a
matter of fact, the process of the IR determination can be treated as a change in the
dipole moments associated with vibrations and rotations of the molecule. Common
movements of the molecule that result in such a change are stretchings and bendings of
the molecular bond that result in a change of the bond length or bond angle (Figure 16).
Stretching can be symmetrical (in phase) and asymmetrical (out of phase) (123). The
symmetrical stretchings of a molecule are inactive in the IR measurement (such as CO2)
since no change in the dipole moment is produced during its vibration.
Figure 16. Common vibrations of the molecule as a result of the interaction of the IR wave with the sample (presented on the methane molecule) Image courtesy of Prof Przemyslaw Maslak
51
11.1. FTIR Spectroscopy
The invention of the FTIR (Fourier Transformed IR) caused a significant advance in the
development of the IR instrumentation (123). This type of equipment implements an
interferometer that applies a well-known mathematical operation: Fourier
transformation. FTIR significantly improved the quality of the spectra and shortened the
time of the measurements (123).
In the FTIR spectrometer, the electromagnetic wave has to pass through the
interferometer to the sample before reaching a detector. The signal is amplified and the
high frequencies are eliminated by a filter, subsequently the data is converted to the
digital form and analyzed by the application of Fourier transformation (123).
The most common interferometer used in FTIR is a Michelson interferometer (Figure 17)
(123). It is made of two perpendicularly placed mirrors; one of them is fixed whereas the
second one moves back and forth. Light that goes through a beamspliter is separated:
one part is reflected by the fixed mirror whereas the second one by the moving mirror.
As a result, when they finally meet again in the spliter, retardation is generated since the
paths that traveled both of the beams are not equal. When the modulated beam passes
through a sample, an interferogram is created that further undercomes Fourier
transformation.
Figure 17. Scheme of Michelson interferometer
Another important part of the FTIR instrumentation is the source of light. The commonly
applied sources in spectrometers are Globar (silicon carbide rod) or Nernst (ceramic
52
rode). In FIR the high pressure mercury lamp is applied whereas for the NIR
measurements tungsten-halogen lamps are common.
When it comes to detectors, there are two options available: the commonly used DTGS
(deuterium tryglycine sulfate) or the more sensitive MCT (mercury cadmium telluride)
however, in the second case a cooling with liquid nitrogen is necessary. Germanium or
Indium-Antimony detectors are applied in FIR at liquid helium temperature. For NIR,
lead sulfide photoconductors are used.
IR spectroscopy is commonly applied in organic chemistry in order to identify organic
compounds. It also found application in characterizing polymers and biological materials
such as peptides, lipids, proteins, biomembranes, animal tissues or cells (123). IR/FTIR
method deliver valuable information about the chemical structure of the dental tissues
(97), (90), (98), (99). The careful analysis of the spectra proceeding from the teeth allows
observing the nature of the sample and its changes depending on the applied treatment
or the stress agent. It examines inorganic and organic materials of the sample and has
been successfully applied for the quantitative analysis of the mineralized composition
and the determination of the physical properties of the dental tissue (98).
In present work FTIR was applied to investigate structural changes in the human enamel
and dentin induced by the remineralization process. Spectroscopic results were based
on the deconvolution of the phosphate band. The spectra from various points
proceeding from different locations of the tooth were compared and studied applying
Principal Component Analysis (PCA) and curve-fitting procedure.
11.2. IR ellipsometry
The principles of the ellipsometry have been established at the beginning of XX century;
however it was not considered a reliable scientific instrument in that time. The situation
changed thanks to the development of the computer technology in 1990s that allowed
the automatization of the instrumentation and data analysis. After that, ellipsometry
became a high precision optical characterization technique and is commonly applied in
science and industry until present moment (124) .
In ellipsometry, an optical characterization of the material is performed through the
reflection or transmission of light. It measures changes in the polarization as a
consequence of the reflection or transmission of the light on the measured sample. Very
often polarized light adopts an elliptical shape as a result of the reflection and to this
fact ellipsometry owes its name (124).
During the ellipsometric measurement two values are extracted: amplitude ratio ( )
and phase (∆) differences between two light waves p- and s- polarized (Figure 18). As
a result a value is obtained:
i
s
pe
r
rtan (Eq.4)
53
Where:
rs – complex reflection coefficient of the s – polarized wave
rp - complex reflection coefficient of the p – polarized wave
Figure 18. Experimental set-up of ellipsometer. Image courtesy of Dr Ulrich Schade (BESSY, HZB Helmholtz Zentrum Berlin)
Ellipsometric measurement is applied in ultraviolet, visible and infrared region.
Depending on the wave length used in the experimental set up, different information
about the studied material can be extracted (Figure 19).
Figure 19. Physical proprieties derived from ellipsometric measurement (124)
54
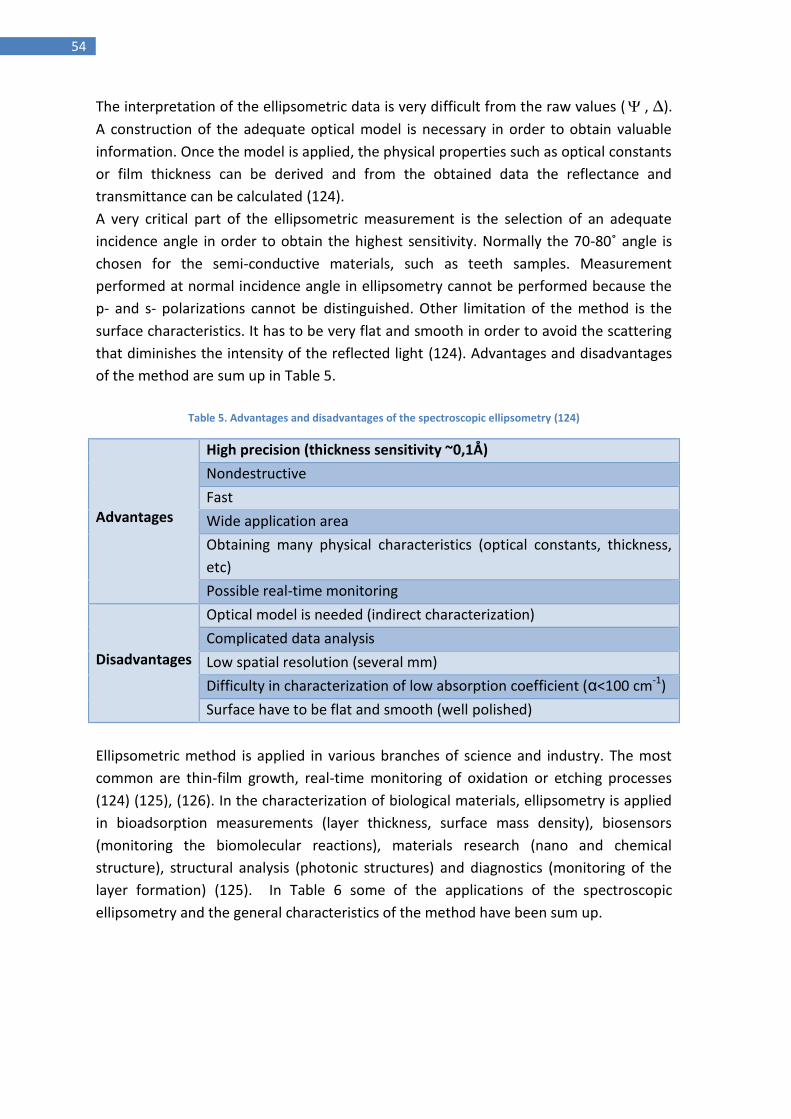
The interpretation of the ellipsometric data is very difficult from the raw values ( , ∆).
A construction of the adequate optical model is necessary in order to obtain valuable
information. Once the model is applied, the physical properties such as optical constants
or film thickness can be derived and from the obtained data the reflectance and
transmittance can be calculated (124).
A very critical part of the ellipsometric measurement is the selection of an adequate
incidence angle in order to obtain the highest sensitivity. Normally the 70-80˚ angle is
chosen for the semi-conductive materials, such as teeth samples. Measurement
performed at normal incidence angle in ellipsometry cannot be performed because the
p- and s- polarizations cannot be distinguished. Other limitation of the method is the
surface characteristics. It has to be very flat and smooth in order to avoid the scattering
that diminishes the intensity of the reflected light (124). Advantages and disadvantages
of the method are sum up in Table 5.
Table 5. Advantages and disadvantages of the spectroscopic ellipsometry (124)
Advantages
High precision (thickness sensitivity ~0,1Å)
Nondestructive
Fast
Wide application area
Obtaining many physical characteristics (optical constants, thickness,
etc)
Possible real-time monitoring
Disadvantages
Optical model is needed (indirect characterization)
Complicated data analysis
Low spatial resolution (several mm)
Difficulty in characterization of low absorption coefficient (α<100 cm-1)
Surface have to be flat and smooth (well polished)
Ellipsometric method is applied in various branches of science and industry. The most
common are thin-film growth, real-time monitoring of oxidation or etching processes
(124) (125), (126). In the characterization of biological materials, ellipsometry is applied
in bioadsorption measurements (layer thickness, surface mass density), biosensors
(monitoring the biomolecular reactions), materials research (nano and chemical
structure), structural analysis (photonic structures) and diagnostics (monitoring of the
layer formation) (125). In Table 6 some of the applications of the spectroscopic
ellipsometry and the general characteristics of the method have been sum up.
55
Table 6. Sum up of the characteristics of the spectroscopic ellipsometry (124)
Measurement probe Light
Measured value Amplitude ratio ( ), phase difference (∆) between p- and s- polarised waves
Measured region IR, UV-Vis
Application
Semiconductors Substrates, thin films, gate dielectrics, lithography films
Chemistry Polymer films, self-assembled monolayers, proteins, DNA Display TFT films, transparent conductive oxides, organic LED Optical coating High and low dielectrics for anti-reflection coating Data storage Phase change media for CD and DVD, magneto-optic layers
Ellipsometric studies are getting popular nowadays especially in composition, thickness
or roughness determination of organic films and multilayers (126). When determined
properties are changing along the probed material the polarization degree is affected
and a very sophisticated model is required in order to process the obtained data. For
applying a reasonably defined angle, the spot size of the probed sample has to be
limited; sometimes it has to be set close to the diffraction limit. It means that IR
ellipsometry is limited by the degree of the light brightness. With the purpose to
improve it, the synchrotron storage rings have been applied due its superior brillance
(126).
Nowadays, there are three instruments that apply the IR synchrotron radiation to
ellipsometry studies: NSLS in Brookhaven (New York), ANKA in Karlsruhe (Germany) and
IRIS at BESSY II in Berlin (Germany). The last one, constructed as a micro-focus mapping
ellipsometer, was applied in present work. The experimental set-up, presented in Figure
20, allows to scan an area of 50x50mm, has a spectral range of 2,5-30µm (4000-333 cm-
1) (126) and lateral resolution below 1 mm2 whereas the traditional ellipsometers are of
around 50 mm2 (127).
The sensitivity improves enormously thanks to the brilliance that is of twice the
magnitude than in the Globar source instrumentation. Its first commissioning was
performed in 2003 and since than it has been applied in many investigations but mainly
in the thin films area (126).
56
Figure 20. a) Experimental set up of the IRIS BESSY II instrumentation b) spectra of the polyamide film on silicon acquired on IRIS beamline and by standard Globar source (126).
11.4. NIR Spectroscopy
NIR started to be applied as an analytical method in 1950s but it gained its popularity in
1970s. General development of the electronics, optics and computational
methodologies improved the acquirement and processing of the NIR data and as a
consequence took part in the expansion of the method in scientific and industrial world
(128).
With NIR spectroscopy, solid and liquid samples can be analyzed. It requires no
pretreatment; measurement is quick and provides information about chemical aspects
of the sample. Since bond vibrations can alter other characteristic bands in the crystal
structure, the physical properties (density, viscosity, particle size) of a sample can also
be determined (128).
NIR works mainly in range 780-2500 nm where overtones and fundamental vibrations
are located. The intensity of the NIR band is conditioned by the change in the dipole
moment and the anharmonicity of the bond. The most active bands in the NIR
measurements contain typically hydrogen atom (C-H, N-H, O-H, S-H etc). On the other
hand, bands with equal or similar atoms are absent or have a very weak intensity (C-C,
C-Cl, C=O etc) (128).
NIR Spectrometers have similar configuration to those applied in other spectral regions.
The instrument can cover the entire range (whole spectrum spectrometers) or only a
certain range of the spectrum (discrete spectrometer). The commonly used detectors
can be semiconductors (PbS, InGaAs), diode arrays or planes (CCD) in the multi-channel
detectors. Last types of multi-channel detector allow the acquisition of spectra at
different points of the sample and at the same time to determine its shape, this data
57
combination allowed the development of NIR-imaging spectroscopy. With this method a
three dimensional image that is a function of spatial composition and the radiation
wavelength is obtained (128).
Very often, NIR spectroscopy data requires chemometric methods in order to extract the
needed information. Multivariate analysis techniques are the most commonly applied in
NIR data treatments. It relates the analytical variables to the properties (such as
concentration) by grouping similar characteristic together and establishing classification
methods for the qualitative and quantitative analysis (128).
Since NIR spectroscopy is fast, easy to perform and can be applied in a wide variety of
samples without pretreatment, it has a multiple application in science and industry. It is
commonly used in agricultural food, pharmaceutical, environmental, petrochemical and
clinical sector (128). In the present work, it was proposed for the first time together with
the Hyper Spectral Imaging method as a tool for the control of the process of
remineralization of human dental tissue. Teeth samples were acquired with the NIR
spectrometer and further obtained images were analyzed applying multivariate analysis
techniques.
12. Hyper Spectral Imaging
HSI was designed and applied at first in cartography, although very quickly it started to
gain popularity also in chemical analysis (129). Till now, this technique is a very popular
method for the image analysis and is commonly applied in many branches of science,
especially in development and control of drugs (130).
In HSI technique a full spectrum of the applied range (in case of this work NIR range) is
acquired for each point (pixel) of the sample by the spectrometer in combination with
the digital camera (Figure 21). Resulting data is organized in the hyperspectral cube, a
three dimensional set of data with two spatial dimensions (x and y axis of an image) and
one spectral (wavelengths). This kind of a very compact image gives plenty of
information where multivariate analysis is necessary to implement, in order to extract
wanted information.
58
Figure 21. Scheme of a typical HSI instrumentation (131)
Before the multivariate data analysis is implemented, a simple pretreatment of the
initial data is performed. All acquired information can be represented as a set of
bidimensional matrixes that need to be unfolded (separated) in order to analyze all the
information from the initial set of data (a cube) (Figure 22). Since the acquired spectra
are the sums of components of the sample’s pure spectra, D matrix can be decomposed
to concentrations, C, and spectra matrix, S, with its residuals, E:
𝐷 = 𝐶 ∙ 𝑆𝑇 + 𝐸
D matrix has three dimensions: x and y, which are spatial dimensions (represented on
the picture as a position of the pixel) and the third - the spectral one (all measured
wavelengths). Matrix C is composed of two dimensions: to every point a concentration
of the component is assigned. It shows the distribution of the given signal on the image,
it can be represented for all wavelengths. ST matrix contains the measured data
(absorbance, transmittance etc) for each wavelength. E matrix is a residual error (131).
59
Figure 22. Unfolding of the hyperspectral cube data set (132)
12.1. HSI Data Treatment
At the beginning of the HSI development, images were analyzed as a RGB (red-green-
blue) images, gray scale images or histograms. The following application of the MVA
(multivariate analysis) and especially MIA (multivariate image analysis) allowed a better
exploration of the data and the extraction of detailed information from the studied
sample.
Exists a wide number of approaches for the data treatment when HSI methods are
implemented (133). Among them, PCA (134), (135), (136), (137), PLS-DA (138), (139) or
PLS (Partial least squares) (140) are the most popular one. In the present study, the
correlation coefficient and MCR-ALS (Multivariate Curve Resolution Alternating Least
Squares) (141) were used in order to obtain necessary information from the acquired
spectra of dental samples. Both methods are useful tools to find similarities between
two spectra; correlation coefficient allows a qualitative comparison of parameters (133)
whereas with MCR both qualitative and quantitative analysis can be performed (141). In
this work both methods were applied in order to differentiate fluorapatite and
hydroxyapatite species on the human enamel.
12.1.1. Correlation Coefficient
In case of correlation coefficient, spectra obtained in the measurement is compared to
spectra of pure components. As a result, a correlation (degree of similarity) map that
60
represents the distribution of those components can be constructed. The correlation
coefficient is calculated from the subsequent equation:
𝑐𝑜𝑟𝑟𝑐𝑜𝑒𝑓 = ∑ 𝑥𝑚𝑛𝜆𝜆 𝑦𝜆
√∑ 𝑥𝑚𝑛𝜆 2 ∑ 𝑦𝜆
2𝜆𝜆
(Eq.5)
where, for each wavelength, xmnλ is the spectrum for the mn-th pixel and yλ the pure
spectral profile for one analyte. Similarity is the greatest when corrcoef = 1 and it means
that two spectra are identical (142), (143).
12.1.2. MCR-ALS (Multivariate Curve Resolution Alternating Least Squares)
MCR-ALS is a popular method for the identification of multi-component mixtures. The
advantage of this method is that a great variety of data sets can be analyzed by its
decomposition into a bilinear model. Moreover, multiple analyzes can be performed
simultaneously on many matrices (144).
MCR-ALS method is often applied when the pure spectra of the constituents are not
known (145). The algorithm (141) consists in the decomposition of the spectral matrix X
(MN x ) in two matrices, C (MN x F), which contains the concentration profiles, and ST
(F x ), which contains the spectral profiles for each F constituent.
𝑋 = 𝐶𝑆𝑇 + 𝐸
Being E (MN x ) the residual matrix related to experimental error. MCR-ALS works by
iteratively optimizing the matrices C and ST with the help of constraints based on
chemical knowledge or on mathematical features of the data (145).
ALS algorithm calculates possible concentration C and pure spectra ST by fitting it in the
D matrix. It is performed for the concrete number of components for the estimated
initial C and ST (evaluated by Evolving Factor Analysis or SIMPLISMA). The model is
finished when in two calculative cycles difference in standard deviations of the residuals
calculated and experimental ALS are less than 0,1%. The value can be modified by the
user depending on the optimization stage desired (144).
MCR-ALS is applied in spectroscopic, electrochemical, composition experiments where a
big variety of aspects such chromatographic elution, spectroscopic images,
environmental data, industrial processes or chemical reactions can be studied (145).
61
A NOVEL METHODOLOGY FOR THE
EVALUATION OF THE DENTINAL TUBULI
OBLITERATION
62
Summary of the study
Objectives
A methodology based on the dentin disc model was evaluated. Specimens treated with a
desensitizing agent were observed under Scanning Electron Microscope (SEM) and the
resulting images were analyzed by an automatic segmentation algorithm developed to
calculate the number and area of the open tubuli. The dependence from the operator,
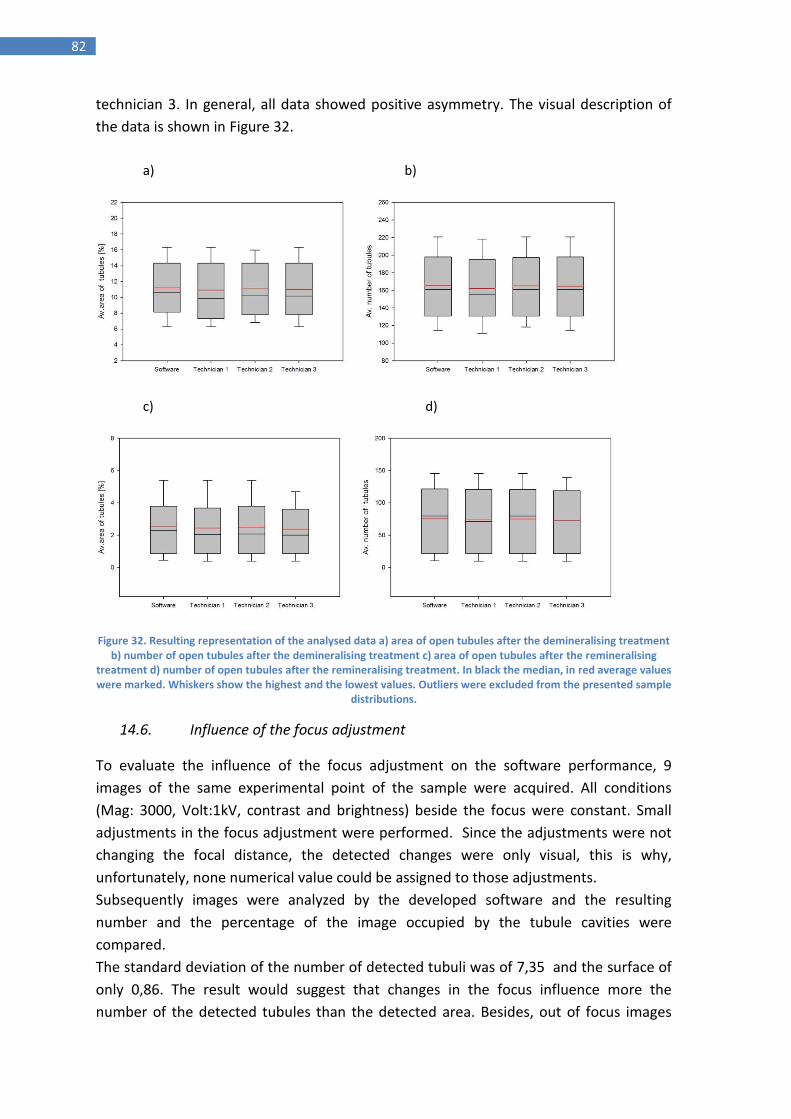
error of the algorithm, experimental error, the influence of focus adjustment during SEM
measurements and vacuum conditions of the presented method has been evaluated.
The determination of the region of interest was established by analyzing images that
covered the entire surface of teeth. Subsequently, the representative number of
pictures was calculated and discussed. Once the method was optimized a comparison of
three different commercial tooth pastes targeting the hypersensitivity of teeth was
carried out. The experimental error of the study was calculated.
Methodology
The tooth paste applied in the optimization part of the study was a commercial product
of Sensodyne® Protect and RepairTM with the Bioglass® NovaMinTM technology. Daily
cyclical applications of the demineralization solution and remineralising tooth paste
were performed during 5 days. Specimens were observed with SEM after the
demineralizing process and for the second time after toothpaste applications. Resulting
images were analyzed by automatic segmentation algorithm applying the Matlab
routine especially developed for the study. The number and area occupied by open
tubules were detected by the automatic algorithm (Figure 23) and statistically analysed.
For the second part of the experiment three commercial toothpastes, namely, Sensitive
Pro-Relief™ Colgate® with the Pro-Argin Technology, Repair and ProtectTM Sensodyne®
with NovaMinTM Technology and DesensinTM Dentaid® with nanoparticles of
hydroxyapatite, were applied in the study to test the performance of the evaluated
methodology.
Figure 23. Illustration of one image analyzed by the automatic segmentation algorithm
Matlab
routine
application
63
Results
Very low values of the standard deviation for both: detected number of tubules (0,54) as
well as the calculated percentage area of open tubules (0,16%) indicated that the
performance of the routine on the designed digital simulations was correct. The
calculated experimental error of the performance of the developed MATLAB routine
(0,04%/sample) was also low when pictures after the demineralization process were
concerned. On the other hand, slightly higher errors for the pictures after the
application of the remineralising treatment (0,06% / sample) occurred mostly due to
impurities detected over the surface of the dentin.
It is also remarkable, that the presented method is independent from the operator since
the standard deviations for the detected area for three independent technicians were
significantly low before the treatment (0,13%) as well as after the application of the
tooth paste (0,11%).
The described studies have demonstrated that the average number and area of open
tubules is bigger for the central zone of the teeth, indicating that developed routine
performs better in that zone.
Furthermore, such studies demonstrate that once the sample is immersed into a
microscope vacuum chamber for approximately two hours, the conditions of the
environment does not change the number or the detected area of tubules. Therefore,
the developed routine is also independent from the focus adjustment.
As a result of the comparative study after 3 and 5 days treatment the n-HAP based
product of Dentaid ® revealed to be stable in the studied range of time obtaining 93,3%
of the final average obliteration. On the other hand, the Sensitive Pro-ReliefTM tooth
paste that contains arginine revealed much smaller average obliteration after 3 days
(71,2%) comparing to 5 days (95,5%). A completely different phenomenon was observed
for the Sensodyne® Repair and ProtectTM tooth paste. The obliteration dropped from the
84,5% to 70,7%.
Conclusions
The present method becomes a suitable scientific tool that will allow scientists and
private companies the in vivo monitoring and assist on the development of new
remineralising agents. The method also facilitates the comparison of different occluding
methods and the evaluation of its efficacy.
64
Introduction
Remineralisation is a natural reconstructive process of a tooth that aims rebuilding the
damaged surface in order to prevent creation of caries. It is based on the deposition of
calcium and phosphate ions assisted by fluoride on the enamel what results in the
creation of the new hydroxyapatite crystals on the area affected by the deminaralising
process (9) (10). The crucial role plays the saliva that delivers all necessary ions, behaves
as a natural buffer and controls the equilibrium between the demineralization and
remineralization (9). When the equilibrium is not maintained the demineralization starts
to dominate and the process of caries creation is triggered. The problem of caries is the
most relevant dental disease worldwide. It is the main cause of pain and tooth loss (35).
That is why there is a constant demand for the new remineralising methodologies in
order to prevent or to diminish the creation of caries.
Since the introduction of the fluoride based remineralising methods (50) (146) (147)
(148) the prevalence of dental caries disease dropped significantly (10). This method is
the most common, although it is limited by the adequate concentration levels of calcium
and phosphate ions and its delivery to the surface of the teeth. Recently, other
remineralising approaches have been considered (9). Among them, the most popular
ones are a casein phosphopeptide stabilized amorphous calcium phosphate technology
of a fluid to penetrate the dentine tubuli. On the other hand, image analysis implements
optical methodologies in order to obtain pictures of the tooth surface that are further
analyzed for the number and/or area of the open tubuli.
The implementation of SEM techniques requires from skilled technician the ability to
distinguish the open tubuli from the closed one. Further, the detected tubules are
counted and its contours are determined in order to measure the area of open tubules.
The manual method becomes strongly operator dependent and time consuming (110)
(114) (109) (105) (108) (115) A step forward was made when computerized systems for
the image analysis were developed. Most of them implemented software such as
MATLAB, OPTIMAS, IMAGIC-5, LUCIA (82) in order to analyze SEM images. However,
those methods also implemented the technician judgment as the basic step in the data
analysis. So far, these types of tools were tested only on the clean, demineralized or
etched dentinal surface.
At this point, it is important to highlight that implementation of the SEM microscope
requires the vacuum conditions that can negatively affect teeth samples. High vacuum
creates cracks and fissures on the surface of teeth sample that can make the
observation of the specimen impossible.
On the other hand, the AFM (Atomic Force Microscopy) microscope methodology does
not require the vacuum conditions. Such fact, allows eliminating the problem of the
negative influence of the fast elimination of water on experimental samples. Although,
this method requires a flat sample to properly observe the teeth surface what makes the
study of the treated sample more difficult due to the presence of the impurities on the
surface of the specimen. Moreover, the interpretation of the image, especially the tubuli
orifice, is more challenging comparing to SEM images, where a skilled technician can
easily classify the content of the tubuli.
In this section, a robust, universal and automatic methodology for the determination of
dental products obliteration capacity is being presented. Such methodology is based on
the dentin disc model (107) (106) (111) where specimens treated with
remineralising/desensitizing agent are observed under Scanning Electron Microscope
and the resulting images are analyzed by the automatic segmentation algorithm
developed in order to calculate the number and area of the open tubuli.
66
Experimental section
13. Methodology
13.1. Specimen preparation
Bovine teeth were extracted and carefully selected in order to obtain specimens lacking
any defects like cementoenamel defects that could possibly affect results of the study.
After the extraction, specimens were stored in the 0,05% Chloramine-T solution that
besides its antibacterial properties also prevents the precipitation of ions.
Subsequently, the teeth were immobilized in a Triplex Cold ® polymer and
perpendicularly cut in order to obtain discs of 5 to 10 mm thickness. Each tooth was cut
into two discs of equal thickness and the resulting surface was subsequently subjected
into further treatment.
In case of the comparative study of 3 different commercial toothpastes discs contained 5
different specimens and each one was implemented for only one corresponding tooth
paste application (Figure 24).
Figure 24. Preparation of specimens: 5 teeth were immobilized in the polymer, subsequently teeth were cut
perpendicularly. Resulting discs contained 5 specimens that were further demineralized. On one disc only one, corresponding toothpaste was applied in order to evaluate its performance.
13.2. Treatment performance
Demineralization of the teeth, in order to create cariogenic-like lesion, was performed
by its submersion in the demineralizing solution (0,1 M lactic acid/0,2% polyacrylic
acid/50% saturated hydroxyapatite solution at pH 5) for 72 hours. Described process is
carried out as a preliminary treatment of the dental surface in order to activate it and
accelerate the process of remineralization/demineralization (157) (158).
Daily cyclical applications of the demineralization solution were performed during 5 days.
Treatments with the tooth paste/artificial saliva and demineralizing solution were
alternatively applied. Tooth paste was applied in 1 minutes periods with an electric
tootbrush (Vitality Oral-B®) of a controlled velocity of oscillations (7600 osc/min). The
replecement tooth brush heads were always used with only one tooth paste in order to
67
avoid cross-contaminations. The demineralizing solution was used in 3 hours periods.
The process was originally designed by Ten Cate and Duijsters. It simulates tooth
brushing exposure,the subsequent remineralisation through the generated pellicle and
daily acid challenges from the bacterial plaque. The process was designed in order to
simulate real changes in the mouth cavity (159). Below, the employed treatment is
ilustrated in Figure 25.
Figure 25. Scheme of a daily treatment in the durability study. On the discs with immobilized specimens corresponding toothpastes were applied, specimens were brushed carefully with electric toothbrush during one minute. Afterwards discs were submerged in the solution of the artificial saliva for 1 hour. Subsequently another application was performed but this time it was followed with the submersion in the demineralizing solution for 3
hours. The above described cycle was repeated. Specimens were stored overnight at room temperature in the solution of artificial saliva.
Evaluated toothpastes that were stored under controlled humidity environment and
room temperature were previously dissolved in 3 drops of artificial saliva and applied on
the surface of the specimens. Dilution was performed right before each application of
the toothpaste. Specimens were stored in artificial saliva between daily treatments.
During the weekend, they were stored in the refrigerator under a relative humidity of
100%, also in artificial saliva.
13.3. Control group
Since the goal of the present study is to detect changes in the teeth surface at various
stages of the experiment and taking into consideration the big variance in the
homogeneity between different teeth, pictures acquired after the demineralisation
process were considered as a control group (160).
68
13.4. Evaluated toothpastes
Tooth pastes implemented in the study are Sensitive Pro-Relief™ Colgate® with the Pro-
Argin Technology, Repair and ProtectTM Sensodyne® with NovaMin® Technology and
DesensinTM Dentaid® with nanoparticles of hydroxyapatite (Table 7).
Table 7. Comparison of three studied commercial toothpastes with different approaches to enhance the tubuli
Positively charged arginine is attracted to dentine surface together with CaCO3. It adheres to fiber networks and deeply infiltrate into dentinal surface. In this manner, the compound agglomerate generates an alkaline environment that allows the phosphate and calcium ions to precipitate and seal dentinal tubuli.
The mechanism starts with the exchanges of Na+ by H+ or H3O
+ at the same time that Ca2+ and PO4
3-are released. As a pH increases and induces the precipitation of ions and formation of hydroxyapatite crystals. At the end, a homogeneous layer that covers dentine surfaces and blocks dentinal tubuli.
(56) (153) (161)
DesensinTM Dentaid®(with nanoparticles of hydroxyapatite)
n-HAP (nano-hydroxyapatite)
The action of nanoparticles is the deposition on the dentin surface in such a way that it seals the exposed dentinal tubuli forming a wash-resistant protective layer helping to decrease the dentin sensitivity.
(63) (64) (65)
13.5. Scanning Electron Microscope (SEM) observations
SEM analyses were performed on MERLIN FE-SEM, ZEISS with the detector EDS Oxford
LINCA X-Max and EBSD analisys Oxford Nordlys II, resolution of 0,8nm at 15kV and
1,4nm at 1kV, the current of the probe from 4pA to 100nA and voltage of the
acceleration form 0,2 to 30 kV.
69
As a first preparation step before the observation, specimens were carefully brushed
with artificial saliva with a toothbrush in order to eliminate any spare material that could
possibly prevent the observation of the surface under SEM.
Described procedure of the preparation of specimens was previously studied and
optimized in order to minimalize the deterioration of the sample that results in the
creation of fissures on the dental surface. Those fissures can be provoked by the
constant changes in the humidity of the sample, as a result of the experimental
procedure, which includes immersion of samples 3 times into the vacuum conditions.
The creation of fissures destroys the sample and invalidates it from the study.
Employment of the discs of thickness below 5-10 mm leads to even stronger
degradation of the specimen and makes the observation of the obliteration impossible.
To avoid such threats 5-10 mm thickness discs were prepared for this study.
Moreover, a sequence of the vacuum drying process before SEM observation was
developed in order to avoid the destruction of the specimens. Before each observation,
firstly, all specimens were held for 4 min in a vacuum pump of 101 mbar, subsequently
they were transferred into the preliminary vacuum chamber until reaching approx. 8∙10-
3 mbar in order to introduce the samples into the main chamber of approximately 4 10-4
mbar. Through this process, drying is performed in 3 steps what allows diminishing the
creation of cracks and fissures on the surface of the specimens.
Samples were visualized by SEM with minimal handling of the specimens, after assuring
that the surface of the specimen has not overcame any procedure that could intervene
in the result. Samples were introduced into the microscope without previous
metallization, under a controlled humidity and at room temperature. Determinations by
SEM were performed two times: After the demineralization process and after 5 days of
the remineralising treatment.
Images were always acquired at the same conditions: focal distance 3,5-5 mm and
voltage of 1kV.
13.5.1. Analysis of the entire surface of the teeth
In order to acquire the entire surface of the teeth, an automatic routine was developed
and implemented. Once the adequate parameters (focal distance 3,5-5 mm and voltage
of 1kV ) were adjusted, the length and the width of the resulting image was measured
(for magnification 3000: 100µm x 67,4 µm ). Subsequently those parameters were
introduced into the SEM software in order to move the sample holder always in the
same dimensions (100µm in longitudinal movements and 67,4 µm in vertical). In such a
way, the entire surface of the teeth could be recorded and furtherly analyzed.
70
13.6. Image analysis
The automatic segmentation of the cavities is carried out as follows. For normalization
purposes, the input image is normalized between 0 and 255 in grayscale values. We will
refer to this normalized image as I(x). To avoid biasing the results, the regions of the
images containing text information in black frames were automatically excluded, and
saturated image values are shifted to values corresponding to the closest image
minimum, prior to the normalization. In the following step, the noise of the image was
partially filtered by using a Gaussian kernel of 8 pixels size. Then, an automatic threshold
(R) is computationally obtained to separate the holes from the rest of the image points,
such as the points belonging to holes can be expressed as:
H = {x \in I(x) | I(x) < R} (Eq.6)
The threshold value R, is obtained from first order statistics of the images. This is
justified observing that the histogram of the images present similar shapes, which differ
in their mean, m(I), and standard deviation, std(I), values. Assuming a linear dependence
of the threshold R with these values:
R = a* std(I) + b *m(I) + c, (Eq.7)
the optimal values of the parameters a, b and c are obtained by using a least squares
analysis from a set of training set images where the threshold R was manually set by
expert observers. The optimal values found were: a = 0.75, b = - 0.75 and c = 15.
The obtained segmentation was afterwards processed to avoid false detections. First, a
cleaning step was performed (removing isolated pixels), and then, the holes that occupy
areas below a minimum and above a maximum pre-defined size were removed (if
existing). In our images the holes are normally bigger than 20 pixels and smaller than
5*10^3 pixels, any hole below and above that range were eliminated to avoid including
it in the final result. Since holes touching the image borders change their shape, what
most of the times result in the false detection, were also removed. Finally, the contours
obtained are smoothed by morphological operations. As a result, the percentage of
points occupied by the holes as well as their total size were computed.
13.7. Statistical and Data Analysis
Xlstat (Addinsoft, New York, USA), SigmaPlot 13 (Systat, San Jose, USA), Ene 3.0
(GlaxoSmithKline, Brentford, Great Britain) software were employed for data analysis
purposes. Outliers were determined applying Grubbs Test within a confidence interval of
95%. In order to evaluate difference in the variance of various sample groups the
ANOVA test was implemented. The differences between the series of results of various
71
categories were compared using t- Test along with Tukey’s Test (HSD) and Dunet’s test
within a confidence interval of 95%.
14. Results and Discussion
14.1. Determination of the magnification properties of the image
In order to evaluate the adequate parameters of the pictures acquired in the entire
study the optimization of the magnification was performed (82). Three magnifications
were considered: 1000, 3000 and 5000. 10 points of interest were recorded applying the
same parameters (focal distance 3,8 mm and voltage of 1kV, constant contrast and
brightness) where only the magnification was changed. The study was performed with
samples after the demineralization process.
The resulting images were analyzed with the developed routine, further images were
analyzed by the skilled SEM technician and the errors committed by the software were
corrected. The resulting number and the percentage of the picture occupied by the open
tubules before and after the intervention of the technician were compared.
Images performed at the magnification 1000 were discarded due to the poor resolution
capabilities. Since the surface of the teeth is not completely flat and can get bent by the
vacuum conditions, the resulting SEM image may consist of some parts of the picture
that are well focused whereas other parts stay out of focus. That phenomenon makes
the unfocused parts inadequate for the software application. Even for the skilled
technician, it is extremely difficult to decide whether the observed tubules are open or
closed (Figure 26).
The error analysis revealed significantly better performance for a 3000x magnification
(0,62% for the number of detected tubules; 2,93 % for the area occupied by open
tubules) than in case of a 5000x magnification (4,56% for the number of detected
tubules; 5,12 % for the area occupied by open tubules). With higher magnification the
detected area of tubuli is bigger and the possible error is consequently higher.
Furthermore, taking into consideration that analysis performed at the smaller
magnification requires less time than bigger magnification it was decided to proceed
with the rest of the experiment applying a 3000x magnification.
72
Figure 26. Example of a picture analyzed by the software at 1000x magnification. Some tubules were not detected because of the surface characteristics.
14.2. Analysis of the entire surface of the teeth
14.2.1. Determination of the zone of interest
A perpendicularly cut teeth represents a surface that is not homogenous. It could be
observed that there is a big difference in the number, distribution and shape of the
dental tubule depending on the zone of the teeth from which it proceeds. In order to
characterise those tendencies of the dentine, images from the entire surface of the
teeth from 3 different specimens after the demineralisation process, where carefully
analyzed. The surface of the teeth was divided into two zones: zone 1 that is located in
the center of the teeth and is composed of two parts that are surrounding the pulp
chamber and zone 2 that is located on the opposite sides of zone 1 (Figure 27). Further,
the number of tubules, the number of pictures with tubules presenting the orifice cut
perpendicularly, the area occupied by the tubules (mm2) and the percentage of pictures
with orifice cut longitudinally and the shape of the tubules in 2 zones were studied
(Table 8).
73
Figure 27. Two different zones that can be distinguished in a perpendicularly cut surface of a teeth: zone 1 – where
tubules are cut perpendicularly and zone 2 – longitudinal.
Table 8. Characteristics of zone 1 and 2 as a result of analyzed teeth.
Characteristics Zone Tooth 1 Tooth 2 Tooth 3
Av. number of tubules 1 172 83 188
2 100 47 157
Av. area occupied by tubules [%] 1 7,01 3,64 8,00
2 3,67 1,66 6,24
Surface occupied by tubules [mm2] 1 0,3441 0,1084 0,2873
2 0,0607 0,0075 0,1086
Number of images with tubules cut perpendicularly 1 733 445 536
2 247 68 260
Number of images with tubules cut longitudinal 1 42 37 31
2 230 107 252
As a result of the performed experiment, it could be concluded that both, the average
number of tubules and the average percentage area of tubules is much higher in zone 1
in case of all of the analyzed teeth (Figure 28). As a result, a surface covered with the
open tubules is bigger for the zone 1 comparing to zone 2. Number of photos that
contained tubules cut perpendicularly represents the number of images suitable for the
study since only a well exposed open and round tubule allows a reliable observation of
its further obliteration. In this type of surface, dental tubules can be properly examined
and compared when treated with various remineralising products. Since the obliteration
74
is easy to observe, the number of tubules or its obliteration degree can be examined and
detected by the developed software. Again, for the zone 1, this number is much higher
than for the zone 2. On the other hand, the number of images with the tubules cut
longitudinally, rises for the zone 2 in all of the cases. This type of tubule’s cut invalids the
picture from the study since it makes the observation of the inside of the tubule
impossible for the technician and what is more, the tubule cannot be detected properly
by the software.
To define such issues, the Test ANOVA within a confidence interval of 95% showed that
there are significant statistical differences between the zone 1 and 2 in case of all of the
studied teeth (Supplemental Material 1).
75
Figure 28. The statistical characteristics of all of the studied populations of three specimens. In black the median, in red average values were marked. Whiskers show the highest and the lowest values. Outliers were excluded from
the presented sample distributions.
Having in mind the described phenomena, it is advisable to always work in the zone 1,
when the teeth is cut perpendicularly. Such zone allows the proper observation of the
tubules and potential changes provoked by various treatments. Therefore, only pictures
acquired in that zone of the specimens were further considered and analyzed.
14.3. Error determination
14.3.1. Sensitivity of the automatic segmentation algorithm under different
illumination conditions
To verify the applicability of the automatic segmentation algorithm under different
illumination conditions, a numerical experiment in digitally simulated images was
performed. These images were created starting from the reference simulation shown in
Figure 29A, that represents a typical distribution of the holes in a SEM image, as the
ones analyzed here, and will constitute the reference in this experiment.
76
Figure 29. The segmentation results for the digitally generated images. A: reference, B-F digitally generated images varying the illuminations with Gaussian distributed grayscale ranges with standard deviation = 90 and means from
20-100.
In total, there are 237 holes with a total occupied surface of 22.31 %. From this
reference image, we generated a total of 11x9 digitally simulated images
representations, mimicking the characteristics of the images obtained in the SEM. To
this end, the image values of the holes were generated using a Gaussian distribution
centered at zero with a small standard deviation of 4 (in a normalized gray scale of 0 -
255). For the gray values of the rest of the image, a Gaussian distribution was also used
but using 11 different standard deviations (from 50 to 150) and 9 different means (from
20 to 100) to account for a wide range of illuminations. The values of the standard
deviation and the means used also correspond to the normalized grayscale range 0 - 255.
Finally, Gaussian noise was introduced to obtain more realistic image results. A set of
generated images can be seen in Figure 29 B-F.
77
The 99 generated images were then processed with the automatic segmentation
algorithm, obtaining in average, a value of area occupied of 20.80 % (+/- 0.16 %) and
number of holes detected of 201.9 (+/- 0.54). The values of area occupied and number
of detected holes obtained for all the images are shown in Figure 30A and B respectively
and the threshold values obtained by the algorithm are shown in Figure 30C. The
segmentation results are overlaid in red for several image images the Figure 29Figure 29
B-F.
The differences obtained are clearly defined due to the detection of holes in the border
of the image. The results obtained were very consistent all along the processed images
as shown by the values presented in Figure 30 and the segmentations in Figure 29, and
the low standard deviations obtained for the occupied area (0.16 %) and number of
holes detected (0.54).
78
Figure 30. A: Values of area occupied B: number of detected holes C: threshold values obtained for all the generated images. The standard deviation. and mean values characteristic of the different illuminations of the
generated images are represented in the horizontal axis (50 - 150) and as colors (20-100) respectively.
79
14.4. Study of the experimental error of the method and the dependence from
the operator
In order to evaluate the error of the method and to study the dependence from the
operator, 120 images were randomly chosen from zone 1 of 3 different specimens
before and after the treatment. The images were analyzed by 3 skilled SEM technicians.
Thereafter, the 120 images were loaded into the developed software routine. The
resulting percentage area and the number of open tubules were calculated by the
software. The determination performed by Matlab was controlled by 3 technicians
separately in order to manually correct the errors committed by the software. Further,
the automatically computed data was compared with the semi-automatic results. In the
second type of the analysis, open tubuli was first detected by the automatic
segmentation algorithm and the result was subsequently supervised by the skilled SEM
technician. All possible errors made by the software were corrected. The resulting
percentage errors were calculated:
𝐸 = (|𝑋−𝑋𝐶𝑜𝑟𝑟|
𝑋𝐶𝑜𝑟𝑟) × 100% (Eq.8)
X- number or percentage area occupied by the open tubules calculated by the software-
the automatically computed analysis
XCorr- number or percentage area occupied by the open tubules calculated with the
intervention of the technician – the semi- automatic analysis
14.4.1. Experimental error of the method
The automatically computed analysis showed an average number of 165,55 and 11,18%
of the surface area occupied by the open tubules after the demineralization process.
Whereas the semi- automatic analysis varied in 0,35 % of the average value from the
computed one, when the number of open tubules was concerned and 1,13 % for the
area occupied by the tubules that were not occluded (Table 9, Table 10, Table 11). The
difference in the number of tubules and percentage area of open tubules in the
confidence interval 95% was not significant for neither of the technicians (Supplemental
Material 2).
The comparison of two types of analysis after the remineralizing treatment revealed an
average number of open tubules of 75,55 and percentage area of 2,56 % for the
automatically computed analysis. The resulting average values of the semi- automatic
analysis varied from the automatically computed in 1,62 % (number of open tubules)
and 3,71 % (area of open tubules) (Table 9,Table 10,Table 11). The analysis of the entire
set of data showed no statistical differences in the confidence interval 95% for neither of
the technicians (Supplemental Material 2).
In general, the analysis performed without the intervention of the technician, counted
slightly higher number as well as the percentage area of open tubules. Almost all of the
80
deficiencies were located in the experimental areas were some impurities, like small
particles proceeding from the rest of the dentine or from the applied treatment, could
be detected (Figure 31).
a)
b)
Figure 31. a) Example of a picture with small impurities what results in a wrong detection of the tubules by the software b) the same picture corrected by the operator
The average error calculated for one sample for the number of tubules and area before
the remineralising treatment was of 0,01% and 0,02 % respectively. Whereas after the
treatment the error were of 0,03% and 0,06% (Table 11).
81
Table 9. Comparison of the automatically computed and semi-automatic analysis when the number of open tubules is concerned
Av.nr of open tubules detected after the demineralisation
Technician 1 Technician 2 Technician 3 St dev Average Average error [%] 165,55 165,55 165,55 165,55
X corr 165,08 165,07 164,75 0,2 164,97 0,35
Av.nr of open tubules detected after the remineralisation
X 75,55 75,55 75,55 75,55
X corr 74,92 74,85 73,27 0,9 74,34 1,62
Table 10 Comparison of the automatically computed and semi-automatic analysis when the percentage of the area of open tubules is concerned
Av.area of open tubules detected after the demineralization [%]
Technician 1 Technician 2 Technician 3 St dev Average Average error [%]
X 11,18 11,18 11,18 11,18
X corr 11,07 11,10 11,00 0,1 11,06 1,13
Av.area of open tubules detected after the remineralisation[%]
X 2,56 2,56 2,56 2,56
X corr 2,52 2,51 2,38 0,1 2,47 3,71
Table 11.Percentage errors of the software after the demineralisation and the remineralizing treatment calculated
by 3 independent skilled SEM technicians.
Error after the demineralisation [%]
Technician 1 Technician 2 Technician 3 Average Av. Error/sample
number of tubules 0,28 0,29 0,49 0,35 0,01
Area [%] 1,00 0,74 1,64 1,13 0,02
Error after the remineralizing treatment[%]
number of tubules 0,85 0,94 3,12 1,63 0,03
Area [%] 1,56 2,00 7,78 3,78 0,06
14.5. Dependence from the operator
Statistical analysis performed on the data obtained from the semi-automatic analysis
proceeding from 3 different technicians showed no significant statistical differences
between the groups within the confidence interval of 95% (Supplemental Material 2).
Overall, the standard deviations were very small in all considered cases (Table 9, Table
10). For the number of tubules calculated after the demineralization, the difference was
of 0,2 and after the remineralising treatment of 0,9. Whereas for the percentage area of
open the resulting standard deviations were of 0,1 in both cases.
Analyzed data had the same characteristics for all three technicians (Supplemental
material 3). The unique differences that could be encountered concern leptokurtic
kurtosis results of the area of open tubules after the demineralization treatment for the
82
technician 3. In general, all data showed positive asymmetry. The visual description of
the data is shown in Figure 32.
a) b)
c) d)
Figure 32. Resulting representation of the analysed data a) area of open tubules after the demineralising treatment
b) number of open tubules after the demineralising treatment c) area of open tubules after the remineralising treatment d) number of open tubules after the remineralising treatment. In black the median, in red average values were marked. Whiskers show the highest and the lowest values. Outliers were excluded from the presented sample
distributions.
14.6. Influence of the focus adjustment
To evaluate the influence of the focus adjustment on the software performance, 9
images of the same experimental point of the sample were acquired. All conditions
(Mag: 3000, Volt:1kV, contrast and brightness) beside the focus were constant. Small
adjustments in the focus adjustment were performed. Since the adjustments were not
changing the focal distance, the detected changes were only visual, this is why,
unfortunately, none numerical value could be assigned to those adjustments.
Subsequently images were analyzed by the developed software and the resulting
number and the percentage of the image occupied by the tubule cavities were
compared.
The standard deviation of the number of detected tubuli was of 7,35 and the surface of
only 0,86. The result would suggest that changes in the focus influence more the
number of the detected tubules than the detected area. Besides, out of focus images
83
involve a smaller number of open tubuli. The obtained results would suggest that some
of the cavities are not interpreted as open. Although it applies only to smaller cavities,
since the standard deviation of the percentage of the area occupied by the open tubules
is very low and the area of the better defined tubules stays unchanged.
14.7. Influence of the vacuum conditions on the measurements performance
In order to check the influence of the experimental conditions on the samples, a study of
the influence of the vacuum on the performed measurements was implemented in the
study. Three teeth samples were demineralised and further under came the usual
gradual vacuum drying (explained in point 13.5). One experimental point from the zone
1 of the teeth was measured every 10 minutes, during 1 hour and 50 minutes (the
approximate working time necessary to acquire a total area of the zone 1 of a tooth) for
all three samples. During the experiment the voltage, contrast and brightness values
stayed fixed for all of the samples. The chosen area of the picture was compared for all
resulting images of the experimental point. The percentage area occupied by the open
tubules was analyzed and compared for all three samples (Figure 33).
Figure 33. Influence of the vacuum conditions on the performed measurements. Comparison of the percentage area occupied by open tubules measured for the same experimental point during 1 hour and 50 min for 3 different
samples.
As it could be observed from the resulting data, the percentage area was constant (SD =
0.04 -0.05). Since the area measured by the software did not change during the
experimental time, it could be concluded that the vacuum conditions do not have an
important influence on the presented result. The observed slight differences between
the results for the same experimental point could proceed from the small differences in
the focus adjustment, what has been considered and included in the error of the
software (14.3.1).
0,00
0,20
0,40
0,60
0,80
1,00
1,20
1,40
0 20 40 60 80 100 120
Time[min]
are
a o
cc.
by
tub
ule
s [%
]
Tooth 1
Tooth 2
Tooth 3
84
However, the performed experiment represents only the influence of the vacuum
conditions that could be measured from the moment the sample is introduced into the
SEM chamber. In general, it could be observed that all samples were affected by the
vacuum conditions. It can be confirmed by the shape of the cavities that samples
become more elliptical when introduced into the chamber. There are also some parts of
the tooth that are squeezed together as a result of the vacuum performance. These
phenomena can be observed especially well for the samples after the remineralising
treatment application (since they are submerged twice into the vacuum). In such case,
sometimes, entire zones of the teeth are distracted. This kind of problem eliminates the
specimen from the study and force the operator to repeat the experiment.
Unfortunately, described phenomena cannot be measured since no data about the
previous state of the sample can be obtained.
14.8. Sample size determination
In order to evaluate the number of pictures representative for the teeth at each stage of
the treatment, the sample size have been calculated with the Ene 3.0 software within
the confidence interval of 95% and 1% of error. Analyzed pictures represent the
percentage area of open tubules proceeding from the zones 1 of the three different
teeth. Results for all of the analyzed samples are presented in the Table 12.
Table 12. Sample size determination after the demineralisation and remineralisation process.
Area of open tubules detected after the demineralisation
Teeth nr 1 Teeth nr 2 Teeth nr 3
number of images 300 412 350 error 1% 1% 1% st.dev 4,51 6,17 1,58 sample size 62 108 10
Area of open tubules detected after the remineralisation
number of images 80 131 135
error 1% 1% 1%
st.dev 1,53 2,46 0,84
sample size 9 20 3
As a result, in order to cover the entire variability of the calculated area occupied by the
open tubules, the highest encountered sample size should be taken into consideration.
Therefore, to represent the area occupied by open tubules, approximately 110 pictures
should be taken after the demineralisation treatment, while 20 should be employed for
the samples previously treated with the remineralising paste.
85
14.9. Comparison of the obliterating capacity of three tooth pastes after 3 days
of treatment
After the demineralization process 15 specimens under came a treatment with three studied tooth pastes during 3 days consecutively, following the protocol described in point 13.2. Subsequently samples were observed in SEM and 110 pictures of each specimen were analyzed by the developed Matlab routine (13.6). Results for all specimens treated with its’ respective tooth pastes are presented in Table 13, Table 14 and Table 15.
Table 13. Results obtained for specimens treated with Sensitive Pro-ReliefTM
Colgate® for 3 days consecutively.
Sensitive Pro-Relief™
Tooth 1 Tooth 2 Tooth 3 Tooth 4 Tooth 5
Av % of tubuli before 16,3 20,8 11,0 21,6 18,2
Av % of tubuli after 4,6 5,8 3,8 5,0 5,6
Av % of obliterated area 71,8 71,9 65,8 77,0 69,3
Av. nr of tubules before 149,0 141,7 115,2 135,5 165,6
Av. nr of tubules after 105,9 138,9 85,6 83,4 133,2
Av nr of obliterated tubuli 28,9 2,0 25,6 38,4 19,6
Total area before [µm2] 121150,6 154936,2 81729,6 160992,4 133787,9
Total area after [µm2] 34157,3 43322,6 27936,8 37058,1 41114,2
% of open tubules 28,2 28,0 34,2 23,0 30,7
% of obliteration 71,8 72,0 65,8 77,0 69,3
Table 14. Results obtained for specimens treated with Repair and ProtectTM
Sensodyne® for 3 days consecutively.
Repair and ProtectTM
Tooth 1 Tooth 2 Tooth 3 Tooth 4 Tooth 5
Av % of tubuli before 8,4 5,7 24,4 14,7 16,4
Av % of tubuli after 1,9 0,8 4,8 1,1 2,2
Av % of obliterated area 76,8 86,6 80,4 92,5 86,4
Av. nr of tubules before 199,9 106,3 164,9 160,1 160,5
Av. nr of tubules after 61,9 25,7 94,1 35,3 47,7
Av nr of obliterated tubuli 69,0 75,8 42,9 78,0 70,3
Total area before [µm2] 62447,5 42079,3 181165,9 108654,7 120790,2
Total area after [µm2] 14472,2 5650,4 35485,7 8168,9 16417,5
% of open tubules 23,2 13,4 19,6 7,5 13,6
% of obliteration 76,8 86,6 80,4 92,5 86,4
86
Table 15. Results obtained for specimens treated with DesensinTM
Dentaid® for 3 days consecutively.
DesensinTM
Tooth 1 Tooth 2 Tooth 3 Tooth 4 Tooth 5
Av % of tubuli before 5,0 16,1 9,3 17,7 18,4 Av % of tubuli after 0,7 1,0 0,4 2,0 0,8
Av. nr of tubules before 72,6 162,8 124,4 196,6 214,0 Av. nr of tubules after 18,2 29,7 20,9 77,0 37,5
Av nr of obliterated tubuli 74,9 81,8 83,2 60,8 82,5 Total area before [µm2] 37406,0 120000,8 69046,9 131544,7 136623,1 Total area after [µm2] 5227,9 7140,6 2750,6 14586,2 5637,7
% of open tubules 14,0 6,0 4,0 11,1 4,1 % of obliteration 86,0 94,0 96,0 88,9 95,9
As a result of a 3-days treatment, the most effective toothpaste in achieving obliteration
occurred to be the n-HAP technology tooth paste (92,2% +/- 4,5) (Table 16). It is
followed by NovaMin® (84,5% +/- 6,1) , whereas the worst result was obtained for the
Sensitive Pro-Relief™ (71,2% +/- 4,1). In order to calculate the final total obliteration
capacity achieved by studied toothpastes the tubuli area from all five specimens of the
corresponding treatment were summed in order to obtain the total surface occupied by
open tubuli. The same mathematical operation was performed with data obtained after
the treatment. As a result, (Figure 34) the best obliterating capacity was obtained for
Desensin that reached (92,9%) of obliteration, followed by Repair and Protect (84,4%)
and also in this case the last one was Sensitive Pro-Relief (71,9 %). The obliterating
capacity was calculated by adding together the surface of all analyzed teeth and
comparing the resulting total surfaces before and after the remineralization.
Table 16. The average obliteration capacity derived from 15 analyzed specimens during 3 days treatment.
Sensitive Pro-Relief™ Repair and ProtectTM DesensinTM
Av. Percentage of obliteration[%] 71,2 84,5 92,2
Standard deviation 4,1 6,1 4,5
87
Figure 34. Comparison of the final obliterating capacity for three analyzed toothpastes after 3 days of treatment
14.10. Comparison of the obliterating capacity of three tooth pastes after 5 days
of treatment
The same procedure previously described in paragraph 14.9 was repeated on 15 new
bovine specimens. Results obtained for the corresponding treatment are shown in Table
17, and Table 19.
Table 17. Results obtained for specimens treated with Sensitive Pro-ReliefTM
Colgate® for 5 days consecutively.
Sensitive Pro-Relief™
Teeth 1 Teeth 2 Teeth 3 Teeth 4 Teeth 5
Av % of tubuli before 16,4 9,8 11,0 5,1 10,8
Av % of tubuli after 1,2 1,2 0,2 0,3 0,8
Av % of obliterated area 92,6 87,5 98,0 93,2 93,0
Av. nr of tubules before 200,3 142,0 148,9 101,6 141,9
Av. nr of tubules after 37,6 38,3 10,5 16,8 29,7
Av nr of obliterated tubuli 81,2 73,0 93,0 83,4 79,1
Total area before [um] 121095,0 1046875,0 81504,2 37870,0 80431,1
Total area after [um] 8996,8 9035,5 1371,1 2272,4 5392,4
% of open tubules 7,4 0,9 1,7 6,0 6,7
% of obliteration 92,6 99,1 98,3 94,0 93,3
Sensitive Pro-Relief™ Repair and
Protect™ Desensin™
71,9 84,4 92,9
Obliterating capacity [%]
88
Table 18. Results obtained for specimens treated with Repair and ProtectTM
Sensodyne® for 5 days consecutively.
Repair and ProtectTM
Teeth 1 Teeth 2 Teeth 3 Teeth 4 Teeth 5
Av % of tubuli before 12,2 12,8 9,2 11,8 3,6
Av % of tubuli after 4,5 4,8 2,0 3,1 0,9
Av % of obliterated area 63,5 62,3 78,0 73,4 75,6
Av. nr of tubules before 181,3 169,0 161,3 158,5 88,9
Av. nr of tubules after 100,1 101,2 75,7 89,4 32,2
Av nr of obliterated tubuli 44,8 40,1 53,1 43,6 63,8
Total area before [um] 90876,0 94968,1 68437,6 87564,5 26524,1
Total area after [um] 32906,8 35467,7 15037,2 23315,4 6459,6
% of open tubules 36,2 37,3 22,0 26,6 24,4
% of obliteration 63,8 62,7 78,0 73,4 75,6
Table 19. Results obtained for specimens treated with DesensinTM
Dentaid® for 5 days consecutively.
DesensinTM
Teeth 1 Teeth 2 Teeth 3 Teeth 4 Teeth 5
Av % of tubuli before 17,9 17,5 10,8 9,8 11,2
Av % of tubuli after 1,4 3,4 0,4 0,5 0,7
Av % of obliterated area 92,2 80,6 96,0 94,8 93,3
Av. nr of tubules before 197,1 159,9 199,5 156,5 149,4
Av. nr of tubules after 55,2 94,2 12,9 8,5 9,1
Av nr of obliterated tubuli 72,0 41,1 93,5 94,6 93,9
Total area before [um] 131945,5 128897,8 80434,9 72609,8 82949,4
Total area after [um] 10277,1 24961,0 2119,3 3601,0 5537,6
% of open tubules 7,8 19,4 2,6 5,0 6,7
% of obliteration 92,2 80,6 97,4 95,0 93,3
After 5 – day treatment, the highest average obliteration percentage was achieved by
the Sensitive Pro-Relief™ tooth paste (95,5% +/- 3,0) followed by the Desensin™ (93,3%
+/- 6,5) (Table 20). The worst average obliteration was calculated for the Repair and
Protect™ (70,7% +/- 7,0). When it comes to a final total obliteration 98,0 %, 90,6 % and
69,3 % were calculated for the Colgate®, Dentaid® and Sensodyne® tooth pastes
respectively (Figure 35). Comparing the final obliterations after 5- day treatment to the
results after 3 days treatment, the NovaMin® (Repair and ProtectTM ) based product
reviled a huge drop in the obliterating capacity from 84,4% (3 days) to 69,3% (5 days).
Whereas the Sensitive Pro-Relief™ obliteration raised from 71,9% to 98%. When it
comes to n-HAP based tooth paste a slight drop was observed (from 92,9 to 90,6%).
89
Table 20. The average obliteration capacity derived from 15 analyzed specimens during 5 days treatment.
Sensitive Pro-Relief™ Repair and Protect™ Desensin™
Av. Percentage of obliteration[%] 95,5 70,7 93,3 Standard deviation 3,0 7,0 6,5
Figure 35. Comparison of the final obliterating capacity for three analyzed toothpastes after 5 days of treatment
14.11. Experimental error of the applied Matlab routine
Results derived from all the analyzed specimens during the experiment were further
used in order to calculate the experimental error of the automatic segmentation
algorithm. In total, 3300 images (110 images each specimen) resulting from the 3 days
treatment and the same number from the 5 day treatment, were used in order to
calculate the experimental error in both cases: before and after the remineralising
treatment (Table 21, Table 22, Table 23 and Table 24).
Sensitive Pro-Relief™ Repair and
Protect™ Desensin™
98,0
69,3
90,6
Total obliteration [%]
90
Table 21. Experimental error of the automatic segmentation algorithm for the area of detected open tubuli of samples treated during 3 days with the corresponding treatments.
Area of open tubuli
Tooth paste Av. error after dem. [%] Av. error after rem. [%]
Sensitive Pro-Relief™ Tooth 1 0,07 13,06
Tooth 2 0,24 3,58
Tooth 3 0,17 1,24
Tooth 4 0,67 1,50
Tooth 5 0,97 0,00
Repair and Protect™ Tooth 1 0,75 1,26
Tooth 2 0,32 0,00
Tooth 3 0,74 0,43
Tooth 4 0,18 1,60
Tooth 5 0,20 0,00
Tooth 1 1,20 0,00
Desensin™ Tooth 2 0,04 0,46
Tooth 3 0,36 3,28
Tooth 4 0,14 0,04
Tooth 5 0,15 3,04
Average [%] 0,41 1,97
St.dev. 0,36 3,31
Table 22. Experimental error of the automatic segmentation algorithm for the number of detected open tubuli of samples treated during 3 days with the corresponding treatments.
Nr.of open tubuli
Tooth paste Av. error after dem. [%] Av. error after rem. [%]
Sensitive Pro-Relief™ Tooth 1 0,03 10,92
Tooth 2 0,37 2,76
Tooth 3 0,22 1,13
Tooth 4 1,47 0,86
Tooth 5 0,50 0,00
Repair and Protect™ Tooth 1 0,37 0,64
Tooth 2 0,15 0,00
Tooth 3 1,38 0,52
Tooth 4 0,22 1,01
Tooth 5 0,10 0,00
Desensin™ Tooth 1 1,35 0,00
Tooth 2 0,02 3,13
Tooth 3 0,35 2,59
Tooth 4 0,00 0,35
Tooth 5 0,77 0,78
Average [%] 0,49 1,65
St.dev. 0,52 2,77
91
Table 23. Experimental error of the automatic segmentation algorithm for the area of detected open tubuli of samples treated during 5 days with the corresponding treatments.
Area of open tubuli
Av. error after dem. [%] Av. error after rem. [%]
Sensitive Pro-Relief™ Tooth 1 0,00 5,62
Tooth 2 0,00 0,70
Tooth 3 0,14 5,75
Tooth 4 0,38 8,59
Tooth 5 0,09 0,67
Repair and Protect™ Tooth 1 0,61 0,99
Tooth 2 0,28 8,21
Tooth 3 0,08 1,74
Tooth 4 0,33 1,66
Tooth 5 0,38 0,62
Desensin™ Tooth 1 0,00 0,89
Tooth 2 2,13 8,63
Tooth 3 0,84 0,21
Tooth 4 0,39 1,57
Tooth 5 0,74 0,23
Average [%] 0,43 3,07
S.d 0,54 3,27
Table 24. Experimental error of the automatic segmentation algorithm for the number of detected open tubuli of samples treated during 5 days with the corresponding treatments.
Nr.of open tubuli
Av. error after dem. [%] Av. error after rem. [%]
Sensitive Pro-Relief™ Tooth 1 0,00 2,10
Tooth 2 0,00 0,33
Tooth 3 0,05 3,19
Tooth 4 0,10 1,98
Tooth 5 0,01 1,94
Repair and Protect™ Tooth 1 0,80 0,74
Tooth 2 0,12 0,15
Tooth 3 0,02 0,32
Tooth 4 0,14 0,00
Tooth 5 0,04 0,62
Desensin™ Tooth 1 0,00 0,41
Tooth 2 1,69 9,51
Tooth 3 0,49 0,07
Tooth 4 0,02 0,00
Tooth 5 0,25 0,10
Average [%] 0,25 1,43
S.d 0,46 2,44
92
After 3 as well as 5 days treatment, the calculated error was higher after the
remineralising treatment than after the demineralization procedure. In case of 3 days
experiment, an error of 1,97 % was observed, comparedto 0,41% before the applied
treatment when the area of the open tubuli was considered. The figures rise when the
treatment was prolonged to 5 days (0,43 and 3,07% before and after the treatment
respectively). On the other hand, when the number of not obliterated tubuli is analyzed,
the error was of 0,49% ; 1,65% for the 3 days and 0,25%; 1,43% for the 5 days treatment.
15. Discussion
In the presented study, a methodology based on the dentin disc model was developed
and optimized. The entire set of experiments was performed in order to develop a
suitable routine that would allow studying the mechanism of the tubule obliteration and
to compare the efficacy of various dental products. In comparison to Ciocca et al. (82),
the method was also applied on the dentin surface treated with commercial toothpaste
in order to see the performance for samples that undergo a remineralising /desensitizing
treatment.
Once the proper magnification for the image analyses was selected (3000 X), the error of
the automatic segmentation was evaluated. Very low values of the standard deviation
for both: detected number of tubules (0,54) as well as the calculated percentage area of
open tubules (0,16%), indicated that the performance of the routine on the designed
images was correct and almost all of the present orifices, were detected. The resulting
differences come mostly from the tubules that were detected at the edge of the image,
since that number varied depending from the analyzed generated photos. On the other
hand, the calculated experimental error of the performance of the developed MATLAB
routine (0,01% per sample for number of tubules; 0,02% per sample for the area of
tubules) was also low when pictures after the demineralization process were concerned.
Slightly higher errors were found after the application of the remineralising treatment
(0,03% per sample for number of tubules; 0,06% per sample for the area of tubules)
occurred mostly due to impurities detected on the surface of the dentin. Those
impurities proceed from the applied toothpaste and are impossible to eliminate. The
results obtained by the automatic algorithms were corrected by technicians to perform
the comparison, although these corrections consist only on the elimination of the
impurity zone. It is worth highlighting that difference between the automatic and semi –
automatic analysis are not statistically significant within a confidence interval of 95% for
both types of obtained pictures, after the demineralizing and remineralising treatment.
Consequently, the presented method can be implemented on the edged/demineralised
dentin surfaces almost without any intervention from the technician. Meanwhile, the
study performed on the samples treated with the agent that has capacity to occlude
dental tubules should be supervised by the skilled SEM technician. Although, the analysis
93
performed by the developed routine facilitates the identification of the zone of
impurities or other erroneous detection performed.
The present method is independent from the operator since the standard deviations for
the detected area for three independent technicians were very low before and after the
treatment (0,1%). Furthermore, there were no significant differences between the
technicians within the interval of 95%. Therefore, the automatic method reduces the
variability that comes from the human operator and guarantees the correct
identification of the detected open tubules.
A very important conclusion that should be extracted from the performed
measurements is the careful selection of the ROI when the analysis of open dentinal
tubules is performed. A perpendicular cut of teeth can be clearly divided into two type
of dentin surface: zone 1 where tubules are cut perpendicularly and are well exposed for
its further observation and zone 2 where tubules are cut longitudinal what makes the
observation of the orifice impossible. It has been clearly demonstrated that the average
number and area of open tubules is bigger for the zone 1 respect to zone 2, due to the
distribution of the dentinal tubuli in the tooth (what has been explained in section Error!
eference source not found. page Error! Bookmark not defined.). It indicates that
developed routine performs better on the zone 1. As a result, in order to properly
perform the study and obtain images with dentinal tubules that can be easily observed,
to evaluate the content of the orifice and calculate its area, the analyst should always
perform the acquisition of images on the central (zone 1) of the tooth.
In order to represent the variability of the zone 1 it has been calculated that
approximately 110 pictures should be taken. It means, that in order to study changes in
the characteristics derived from the developed routine of the examined dentinal surface,
110 pictures after the demineralization should be compared with the same number of
pictures after the occluding treatment performance. In such a way, the comparison of
the number of open tubules and area occupied by open tubules will facilitate the
necessary information about the applied treatment and enable the comparison between
various occluding methods.
On the other hand, the limiting point of the present method that would be the influence
of the vacuum on the tubules area contour should be considered. We have
demonstrated, that once the sample is immersed into a vacuum chamber of the
Scanning Electron Microscope during approximately two hours, the conditions of the
environment does not change the number or the detected area of tubules. Although the
most impacting factor, which is the influence of the first immersion at the vacuum
conditions could not be measured, since the dimensions of the orifice could not be
measured without the vacuum conditions. However, during the performed study it could
be observed that some parts of the teeth undercame destruction due to the dehydration
provoked by the vacuum. When the distracted part is also the studied region of interest,
the sample has to be eliminated from the study and repeated. In order to avoid the
influence of the severe vacuum conditions on the study, the new FEG-SEM technology,
94
where experiments are performed in low vacuum conditions (162), could be
implemented.
Taking into consideration all above mentioned points, as well as the fact that the
developed routine is also independent from the focus adjustment; the present method
appears to be a robust approach in order to characterize quantitatively and qualitatively
the dentinal surface. For demonstrative purposes, it was applied in order to study the
mechanism of the occlusion of three remineralising/desentitizing treatments as well as
to compare their efficacy.
The average percentage as well as a number of open tubules before the treatment in
case of all analyzed specimens (30 tooth samples) varies a lot between samples (Table
25). It resembles very well a big variance between teeth in general. Even a very careful
selection of specimens does not allow obtaining samples of exactly the same
characteristics. Although, the method makes the problem of the variability in the
tubules density and distribution irrelevant, since the observation of the same region of
interest of the same samples before and after the treatment, concentrates on the final
obliteration of the specimens.
Table 25. Average area and number of open tubules detected after the demineralisation process for all 30
specimens analyzed in the study.
Average [%] St.dev
Av % of tubuli before 13,13 5,2
Av. nr of tubules before 154,17 34,3
It is also interesting to notice, that the main information about the efficacy of the
obliteration, is delivered by the calculation of the area of open tubuli rather than by the
number of detected tubuli. In fact, the last value sometimes can deliver confusing
results as in case of Tooth 2 treated with the Sensitive Pro-ReliefTM tooth paste (Table
13). Clearly, the resulting average number of obliterated tubuli is smaller than for the
rest of the samples. The source of the confusion comes from the fact that the number of
tubules does not deliver entire information about the nature of the surface, since the
dimensions and density of the tubuli orifice varies depending on its location (163). What
is more, its dimensions also vary among different teeth. Since it is hard to control the
homogeneity of the characteristics of teeth specimens, the obliteration capacity should
be evaluated rather by the calculation of the area of the obliterated tubuli than by its
number, which should be taken into consideration as additional, supporting information.
Comparing results obtained for each toothpaste (
Figure 36) after 3 and 5 days treatment the n-HAP based product of Dentaid ® revealed
to be stable in the studied range of time. The average obliteration capacity varied from
92,2% +/- 4,5 to 93,3% +/- 6,5. It could suggest that the product reached its maximum
occlusion capacity of tubuli that did not change when the treatment was prolonged. On
the other hand, the Sensitive Pro-ReliefTM tooth paste that contains arginine revealed
95
much smaller average obliteration after 3 days (71,2% +/- 4,1) comparing to 5 days
(95,5% +/- 4,1). In this case, the highest obliteration was reached later than in case of
Desensin® product, although the final obliteration, taking into consideration the
standard deviations values, had reached an almost complete obliteration of the dentinal
tubuli. A different phenomenon was observed for the Sensodyne® Repair and ProtectTM
toothpaste. The obliteration dropped from the 84,5 +/- 6,1 to 70,7 +/- 7,0 . Probably, the
sealing of the tubuli was washed away during the prolonged treatment or the final
obliteration capacity contributing to the oscillation between the calculated numbers.
Although comparing the final results with two other studied tooth paste, Sensodyne®
product appears to be less efficient in enhancing as well as in maintaining the
obliteration of the dental tubuli. Nevertheless, all of presented conclusions apply to the
studied conditions and period of time. In order to confirm the assumptions derived from
the performed study a more prolonged treatment with bigger number of samples should
be performed.
Figure 36. Comparison of average obliteration enhanced by all three studied products during 3 and 5 days treatment.
The analysis of the error resulting from the experiments performed after 3 and 5 days of
treatment revealed, that in both cases, the error from the images acquired after the
demineralizing treatment is smaller than for the images after the application of tooth
pastes. The automatic segmentation algorithm has a very low error values before the
treatment performance mostly because of the absence of impurities. The surface of the
teeth after the demineralization process is usually clean what makes the detection and
interpretation of the images easier than in case of the samples previously treated with
the remineralising agent. Applications of any toothpastes a part form sealing the tubules,
leaves the rest of the treatment on the surface of the specimen. Sometimes, the shade
of the impurities can be detected by the automatic routine as a darker spot on the
71,2
92,2 84,5 95,5 93,3
70,7
Sensitive Pro-Relief™ Desensin™ Repair and Protect™
Av. obliteration [%]
3 days 5 days
96
image, and when its shape is close to round one, it can be classified as an unsealed
obliteration. Since the presence of the impurities is independent from the treatment,
and impossible to avoid, the analysis performed on the treated samples should be
always supervised by the skilled SEM technician. Meanwhile, the specimens that under
came only the desmineralisiation process do not need such intervention.
The prolonged treatment accumulates more impurities on the surface of the sample
what is causing the misleading detection by the developed routine. In this sense, an
increase of the error of the automatic segmentation algorithm after the 5 days of the
treatment was observed.
It is worth mentioning that the error derived from the analysis of the number of tubuli is
smaller than the error of the area of the open tubuli. Such fact would suggest that the
automatic segmentation algorithm is not detecting a wrong presence of the tubules but
is instead detecting additional shape that is generated by the shade of the impurities
that normally have bigger area than the dentinal tubuli. As a result, the percentage of
the detected area increases whereas the number of detected tubuli varies less from the
corrected value.
Nevertheless, it should be highlighted that the calculated error that remains in the range
of 0,41-0,43 % after the demineralization process and 1,97-3,07% after the
remineralising treatment represent a very low number and very good detection of the
open dentinal tubuli at the same time. The number of pictures analyzed in both cases is
of 1650, what makes the error negligible, taking into consideration such a big sampling.
Consequently, the presented method can be considered as a reliable tool for the
detection of the open dentinal tubuli and comparison of various obliterating treatments.
16. Conclusions
As a result of the performed study, the following conclusions can be presented:
1. A robust method for the dentin characterization has been developed and
optimized.
2. An automatic segmentation algorithm for the data analysis has been applied and
optimized.
3. The method is operator independent; it can be implemented on the
edged/demineralised dentin surfaces almost without any intervention from the
technician.
4. Developed routine facilitates the observation and characterization of the dentin
surface treated with the occluding agent.
5. The method is independent from the focus adjustment or influence of the
vacuum conditions during the performed observation.
6. The proper way to establish the ROI of the method has been evaluated.
7. The sample size number of the studied ROI was evaluated.
8. The obliterating capacity of three different commercial toothpastes were studied
and compared.
97
9. The experimental error of the automatic segmentation algorithm resulting from
the performed study represented a very low number and very good detection of
the open dentinal tubuli at the same time.
98
A NOVEL HSI APPROACH FOR THE
EVALUATION OF THE EFFICACY OF THE
REMINERALISING TREATMENT
99
Summary of the study
The problem of demineralization has been occupying the interest of many dentists and
scientists, since it is the most common reason of dental caries creation. Various agents
with different chemical approach designed for teeth restoration have been evaluated
and are still being developed. However, there still exists some controversy concerning
the remineralisation efficacy of recently developed chemical approaches. Therefore, it is
crucial to understand the role of fluoride concentration on the remineralisation efficacy
or the influence of novel approaches including the use of protein applications and the
durability of such treatments, which will be focus of the present study. In this context,
suitable analytical techniques for evaluation of teeth remineralization are urgently
needed.
In the presented study, a novel complementary analytical approach, based on Hyper
Spectral Imaging (HSI) with two types of NIR cameras (161 and 256 channels) and
confocal Raman microscopy (CRM) was applied for analysis of teeth before and after
application of different remineralizing agents. As a result, the novel NIR HSI MCR
method that allows differentiating remineralised tissue from the demineralized was
developed, facilitating the comparison of the efficacy of various remineralizing
treatments and characterization of the enamel surface that undercame the
remineralization process. Additionally, it also shows the distribution of the deposited
fluorapatite on the tooth surface. As an example, Raman measurements confirmed the
creation of fluorapatite in case of samples treated with Sensodyne as well as mixture III.
Obtained results were carefully analyzed and compared by the implementation of a
Matlab routine that applies the correlation coefficient or MCR multivariate data analysis
to obtain necessary information from the acquired spectra of dental samples. The
resulting correlation of various samples with the pure hydroxyapatite and fluorapatite
crystals was evaluated and discussed. Obtained results were compared with the
characterization performed with Raman Spectroscopy.
In overall, the study of the influence of the fluoride on the remineralisation process
showed clear differences in samples treated with mixtures of different concentration of
that ion. However, the application of the protein occurred not to improve the process of
remineralisation.
100
Introduction
The mineral composition of dentine and enamel is a mixture of compounds. The primary
one is hydroxyapatite that is a crystalline calcium phosphate. Among others are
carbonated apatites and fluoroapatites. The remineralization process is assisted by
fluoride and bases on calcium and phosphate delivery into cavities remaining after the
process of demineralization (11).
The problem of demineralization has been occupying the interest of many dentists and
scientists, since it is the most common reason of dental caries creation. Table 1 depicts
an overview of different approaches, which are nowadays used for teeth restoration.
Without any doubt, the most popular agent that enhances the remineralization is
fluoride. Besides its antibacterial properties at low concentrations, fluoride stops the
demineralization and favours the opposite-remineralizing process on the tooth surface.
At higher concentrations, it creates the calcium fluoride layer that protects the enamel
from the formation of caries (11), (12). It reacts with hydroxyapatite and forms
fluorapatite, which is less soluble. The chemical equations describing the
0,4) in order to obtain the optimal consistence for its further application on the enamel
surface. In case of amelogenin application, the NMTD was mixed with the solution of
amelogenin in artificial saliva. The concentration of the amelogenin was 40 µg/ml and
the pH was of 6,8 ± 0,4 (187). The coating was changed every 12 hours and the
treatment lasted 4 days. The NMTD agent was renewed by carefully washing the
specimens with artificial saliva and applying a fresh portion of NMTD. During the time of
the experiment, samples were placed in the incubator in order to maintain it in the
natural temperature of the mouth (37 ̊C). Once the treatment was finished, the samples
were stored under a relative humidity of 100% in a 0,5% chloramine –T solution in the
refrigerator.
Together with those studies addressed to test the effect of different concentrations of
NMTD and the presence of the protein, the influence of the duration of the treatments
was studied. In order to do that, the above-described procedure was performed in the
same way for 8 and 12 days on 10 specimens treated with mixture I.
The daily monitoring of the treatment was performed by making the applications of the
above-mentioned mixtures and acquiring the spectral data each day after two
applications. For each treatment, five teeth were used. After 3 days of consecutive
applications samples were stored in the refrigerator in a 0,5% chloramine –T solution
and measured again after 7 days.
As reference samples, two commercially available toothpastes were applied:
Sensodyne® Repair and Protect with the NovaMin® technology and SensiLacer® from
Lacer. The application procedure was the same as for the remineralising NMTD product
(4 days treatment changed every 12 hours). The total number of studied teeth was of 10
samples for each toothpaste.
Table 30. Treatments performed during the study. Samples were divided into 3 groups were the applied mixture
was changing. Each group was analyzed with 10 replicates.
Group 1 Group 2 Group 3
Blank Blank Blank
I mixture II mixture III mixture
I Mixture + protein II Mixture + protein III Mixture + protein
108
Figure 38. Scheme of the specimens’ treatment
17.7. Specimen Preparation for Raman measurements
Daily monitoring of the remineralising treatments was performed with Sensodyne and
mixture III applications. A human tooth free from caries was cut in two sections by a
diamond saw. All parts were at first etched with 1M HCl for 30 seconds to simulate the
early stage caries creation. Further, the treatment was performed as previously
described in paragraph 17.6. Three experimental spots of the analyzed samples were
measured before etching, after etching with the acid, and after each day of the daily
treatment routine (after two remineralizing applications). Treatment was performed for
four subsequent days.
17.8. Software
Correlation coefficients and histograms were computed by using custom developed m-
files in Matlab 7.1 (The Matworks, Massachusetts). Spectral treatments were applied by
using PLS-Toolbox 6.0 (Eigenvector Research, Wenatchee, WA, USA). Hyperspectral
images were also analyzed with MCR-ALS (141).
109
17.9. Data processing
Figure 39. Scheme of the presented method for the evaluation of the remineralisation treatment efficacy
Figure 39 illustrates the experimental procedure applied in presented study. Teeth
sample of various treatments were acquired with the HSI NIR camera. Prior to
application of any spectral treatment or algorithm to extract the needed information,
the three way data array (M x N x ) was unfolded into a two-dimensional matrix. Most
of the available treatments and algorithms have been developed for two-dimensional
data – where M and N represent spatial dimensions and denotes spectral information.
Two different spectral treatments were used: standard normal variate (SNV) and
Savitzky–Golay smoothing with and 11 points window and fitting to a second-order
polynomial. These treatments were followed by application of correlation coefficient
and MCR method in order to assess the best approach to extract information from HSI of
samples.
In the case of correlation coefficient, spectra obtained in the measurement were
compared to the one of the pure components of hydroxyapatite and fluorapatite. As a
result, a correlation map that represented the distribution of those components was
constructed. The correlation coefficient was calculated from the subsequent equation:
𝑐𝑜𝑟𝑟𝑐𝑜𝑒𝑓 = ∑ 𝑥𝑚𝑛𝜆𝜆 𝑦𝜆
√∑ 𝑥𝑚𝑛𝜆 2 ∑ 𝑦𝜆
2𝜆𝜆
(Eq.5)
where, for each wavelength, xmnλ is the spectrum for the mn-th pixel and yλ the pure
spectral profile for one analyte. Similarity is the greatest for two identical spectra, i.e.
with corrcoef = 1 (142), (143).
The other parameter employed in the present study is based on the MCR-ALS (141)
algorithm consists in the decomposition of spectral matrix X (MN x ) in two matrices, C
(MN x F), which contains the concentration profiles, and ST (F x ), which contains the
spectral profiles for each F constituent.
110
𝑋 = 𝐶𝑆𝑇 + 𝐸
Being E (MN x ) the residual matrix related to experimental error. MCR-ALS works by
iteratively optimizing the matrices C and ST with the help of constraints based on
chemical knowledge or on mathematical features of the data (188).
17.10. Statistical analysis
Basic statistical data were evaluated and compared using statistical software (Microsoft
Excel 2007). Xlstat (Addinsoft) and SigmaPlot 13 (Systat) software were also employed
for data analysis purposes. Outliers were determined applying Grubbs Test within a
confidence interval of 95%. In order to evaluate the difference in the variance of various
sample groups the ANOVA test was implemented. The differences between the series of
results of various categories were compared using t- Test along with Tukey’s Test (HSD)
and Dunet’s test within a confidence interval of 95%.
18. Results
18.1. Spectral differences between FA and HA implementing 2 cameras (121
and 256 channels)
Comparing the absorbance spectra of HA and FA pure powders acquired by two cameras
of 121 and 256 channels (
), a peak at 1420 nm for the HA was clearly identified with both cameras. This peak is
related to -OH groups (189) and is not observed in the FA spectrum, probably due to
influence of the F ion. When the second derivative is applied (Figure 40 b and c), in
mentioned region, a negative peak with the following positive peak is observed. The lack
of such signature for the FA sample could allow the differentiation of the two apatite
species. Another spectral difference useful for differentiation can be observed in the
second derivative at 1360 nm. There is a negative peak for the FA and positive for the
HA sample with the 121 channels camera. Interestingly, there is a lack of this peak in the
256 channels camera instead a positive peak more intense in case of HA and less intense
for the FA sample appears.
Another spectral region where differences could be found is located around 2130 nm for
the 256 camera. A negative peak for the FA and much less intense one for HA could be
differentiated. In the second derivative it results in the presence of the negative peak for
the FA and the lack of it in the HA signature. The same situation was encountered
around 1955 nm where a positive peak for the FA and the absence of such one for HA
was observed.
111
Figure 40. Absorbance hydroyapatite and flouroapatite pure spectra and its SNV with second derivative (Savitzky – Goley) mode with two NIR cameras with 121 (a and b) and 256 channels (c and d).
As observed, the 256 channels camera can deliver more information in comparison to
the 121 channels camera. Due to the wider wave range (942 to 2542 nm) and higher
resolution we can obtain more information from the 256 channels camera. Moreover, in
the 121 camera some peaks are overlaid whereas in the 256 channels camera those
peaks are better resolved (region 1400-1500 nm), what facilitates the differentiation of
the two species. It explains the differences in the results obtained for both cameras and
presented in the following results sections.
18.2. Results obtained for the samples treated with commercial products
18.2.1. Application of the correlation coefficient method and the comparison
between two cameras (121 and 256 channels)
An increase in the number of pixels correlated with HA was observed for the treated
samples comparing to the blank samples (
Figure 41). The observed tendency is the same for data acquired with both cameras
although for the camera with 256 channels the correlation with HA for all samples were
moved to lower values. It means that the correlation with hydroxyapatite where the
highest number of pixels were classified is of 0,5-0,55 for all of the samples (reference
sample and treated samples) in the camera with 121 channels. In the case of the 256
channels camera, the peak for blank sample is moved to 0,35-0,4 whereas for the
treated samples it is located between 0,4-0,45 correlation (Table 28). In both cases,
112
when comparing the different commercial toothpaste, Sensodyne is the one that leads
to the strongest increase in HA correlated pixels.
Table 31. Position of the maximum peak for the samples treated with commercial toothpastes and blank sample acquired with the camera with 121 and 256 channels.
Figure 41. Distribution of pixels obtained for samples treated with commercial products compared with the blank samples and acquired with both 161 and 256 channel camera.
The remineralised zones can be observed also in the hyperspectral images ( Figure 72). Samples that were only treated with acid resemble a homogeneous distribution of HA among the observed teeth, whereas in treated samples pixels correlated with HA are concentrated in zones what could indicate a possible influence of the applied treatment.
113
Figure 42. a) Teeth treated with the commercial toothpaste with a zone of pixels highly correlated with HA b) tooth only etched where the correlation with HA is distributed homogenously images acquired with the camera of 256
channels
The results of the correlation with the FA showed no differences between blank and
treated samples. There was almost no correlation with the FA detected applying this
method.
18.2.2. Application of the MCR method
An increase in the concentration of FA comparing to blank samples has been detected
with the simultaneous drop in the concentration of HA (Table 32) when the MCR
analyses was applied for the acquired samples treated with the commercial toothpastes.
The highest concentration was registered for the Sensodyne toothpaste. At the HSI
images observed changes are visible in form of small areas where an increase in the
concentration of fluorapatite (decrease in the concentration of HA) could be
differentiated (Figure 43).
Table 32. Average concentrations of HA and FA for samples treated with commercial toothpastes and blank sample
Concentration of HA Concentration of FA
Sensodyne Lacer Blank Sensodyne Lacer Blank
Average 92,2% 93,3% 95,1% 7,8% 6,7% 4,9%
SD 0,02 0,03 0,01 0,02 0,03 0,01
Figure 43 Example of a tooth treated with the remineralising agent (Sensodyne) where an area of the increased
concentration of FA (a) with the simultaneous decrease of the HA concentration (b) in that region could be observed.
In Figure 44 five samples treated with Sensodyne paste are illustrated, most of them
were detected as increasing content of HA, although the concentration of detected FA
pixels can go up to 20%.
114
Figure 44 Example of the images ilustrating concentration levels of a) HA and b) FA calculated by MCR method for five sample treated with the Sensodyne product.
18.3. Influence of the fluoride concentration
18.3.1. Application of the correlation coefficient method and the comparison
between two cameras (121 and 256 channels)
The comparison of the distribution of pixels correlated with HA for all three mixtures
with growing concentration of the fluoride applying the camera of 121 channels reveals
the mixture II to have more correlation with the poor HA than the rest of samples.
However, it could not be confirmed by the camera with 256 channels where mixture III
showed the highest correlation and mixture II the lowest. What is more again for the
256 channels camera the peak of the maximum correlation is moved to the smaller
values (Table 33).
There is a clear difference between samples treated with the remineralising treatment
when compared with the blank samples. The distribution of the pixels correlated with
the HA gets wider when the treatment is applied (
Figure 45), although there were no significant differences between groups when ANOVA
test within a confidence interval of 95% was implemented.
Table 33. Position of the maximum peak for the samples treated with mixtures with growing concentration of fluoride acquired with the camera with 161 and 256 channels.
MI 161 MII 161 MIII 161 MI 256 MII 256 MIII 256
Position max. peak 0,55-0,6 0,55-0,6 0,55-0,6 0,45-0,5 0,45-0,5 0,4-0,45
115
Figure 45. Distribution of pixels obtained for samples treated with mixtures with growing concentration of fluoride acquired with both 161 and 256 channel camera.
18.3.2. Application of the MCR method
The comparison of the concentrations of HA for all the samples treated with the
remineralising product with the growing concentration of the fluoride revealed mixture
II to have reached the highest concentrations of the FA (16,1%) (Table 34, Figure 46).
Comparing to the blank samples only in case of mixture III the concentration of FA did
not increase.
Table 34. Concentrations levels of HA and FA for samples treated with remineralising mixtures of the growing
concentration of fluoride.
Concentration of HA Concentration of FA
Blank MI MII MIII Blank MI MII MIII
Average 95,1% 92,7% 83,9% 95,4% 4,9% 7,3% 16,1% 4,6%
SD 0,01 0,03 0,05 0,01 0,01 0,03 0,05 0,01
116
Figure 46. Example of the images with its respective histograms of the FA concentration calculated by MCR method for samples treated with a) Mixture I b) Mixture II c) Mixture III
The distribution of the data is the widest for mixture II (
Figure 47) comparing to the rest of the samples but still remains with the leptokurtic
kurtosis as the rest of the analyzed data. Comparing the resulting data with the ones
obtained for the correlation method, exactly the same observations were encountered
for the camera with 121 channels.
Figure 47. . Distribution of pixels obtained for samples treated with remineralising mixtures of the growing concentration of fluoride.
Wide range of the obtained data for the Mixture II can cause an overestimation of the
obtained average for this mixture. An example of histograms obtained for the
117
concentrations of FA detected for various samples treated with mixture (Figure 48),
shows that the average of the obtained data does not reflect well the general influence
of the performed remineralisation when compared to other treatments, although, there
are no outliers detected by Test of Grubbs in the confidence interval of 95%. Presented
data should be first carefully analyzed with the obtained images and histograms rather
than with the average derived from of all samples. After doing so, it was observed that
mixture number II is more effective in the fluorapatite creation than mixture I, although
the observed difference is not as big as 8,8% as it suggests the average value
consideration. Moreover, the mixture III is the less efficient in enhancing
remineralization.
Figure 48. Representative samples with histograms of FA distribution obtained for four different samples treated with Mixture II.
Comparing the developed remineralising mixture to the commercial samples the
concentrations of the detected FA are much higher (4,6- 16,1 % and 6,7-7,8%
respectively). The increment of FA is localized in zones where the increment of the
fluoride concentration is correlated with the drop in the concentration of the HA (
Figure 49).
Figure 49. Example of a tooth treated with the remineralising agent where an area of the increased concentration of FA (a) with the simultaneous decrease of the HA concentration (b) in that region could be observed for the
samples treated with mixture I.
118
18.4. Influence of the protein in remineralising treatments of various
concentrations of fluoride
18.4.1. Application of the correlation coefficient method and the comparison
between two cameras (121 and 256 channels)
For samples acquired with the camera of 121 channels there is an increment in the
number of pixels correlated with HA when the protein is applied for mixtures I and II (
). The observed effect reveals to be the strongest for the mixture III. In case of camera
with 256 channels, such behavior could be observed only for mixture II whereas in case
of mixture I and III the effect is the opposite one: a drop in the number of pixels
correlated with HA was observed when the protein was applied.
When analyzing the position of the peak that represents the biggest amount of pixels
classified in the same range of the correlation with HA it could be observed that in case
of both cameras mixture I has the highest correlation when the protein is applied ( 161
channels: 0,6-0,65; 256 channels 0,45-0,5)
Table 35. Position of the maximum peak for the samples treated with mixtures and the protein application with
growing concentration of fluoride acquired with the camera with 161 and 256 channels.
Figure 50. Distribution of pixels obtained for samples treated with mixtures and the protein application with growing concentration of fluoride acquired with both 161 and 256 channel camera.
119
18.4.2. Application of the MCR method
The distribution of data for samples treated in the presence of the protein reveals the
same leptokurtic kurtosis and positive asymmetry as for the samples treated in absence
of the protein (
Figure 51). However, in case of samples treated in presence of the protein the detected
concentration of FA is much lower than in case of the treatment performed without the
protein application (4,3-5,9% and 4,6-16,11% respectively).
Figure 51. Distribution of pixels obtained for samples treated with remineralising mixtures of the growing concentration of fluoride and the protein
Table 36. Concentration levels detected for samples treated with remineralising mixtures of the growing concentration of fluoride with the simultaneous application of protein
Concentration of HA Concentration of FA
Blank MI + P MII + P MIII + P Blank MI + P MII + P MIII + P
Average 95,1% 93,3% 95,7% 94,3% 4,9% 5,9% 4,3% 5,1%
SD 0,01 0,03 0,02 0,02 0,01 0,02 0,02 0,02
Samples treated with mixture I and the protein revealed the higher concentration of the
concentration of FA and the lowest of HA. The lowest concentration of FA (even lower
than for the blank samples) was detected for samples treated with the mixture II in
presence of protein. Observed behavior was not similar to the data obtained for the
correlation coefficient method.
18.5. Influence of the prolonged remineralising treatment
18.5.1. Application of the correlation coefficient method and the comparison
between two cameras (121 and 256 channels)
There are no significant statistical differences between samples treated during 0,4,8 and
12 days within the confidence interval of 95% when ANOVA was applied. The lack of
120
difference between the analyzed samples is well seen at the histograms representing
the distribution of pixels for the camera with 121 and 256 channels respectively (Figure
52, Figure 53)
Figure 52. Histograms of the correlation coefficient of HA for samples treated with mixture I during 0,4,8 and 12
days consecutively, acquired with the spectral camera of 121 channels.
Figure 53. Histograms of the correlation coefficient of HA for samples treated with mixture I during 0,4,8 and 12 days consecutively, acquired with the spectral camera of 256 channels.
18.5.2. Application of the MCR method
The same samples acquired with the 256 channels camera and analyzed with the MCR
data treatment reveals differences between the samples (Table 37). Comparing, teeth
treated with the remineralising mixture I to the blank samples, the concentration of FA
increases and HA decreases with the applied treatment. Once again, as in case of
previously discussed treatments, observed fluoridation of teeth was detected in
concentrated areas with the simultaneous drop of the HA concentration. In case of blank
0,00
5,00
10,00
15,00
20,00
25,00
30,00
35,00
Av.
nu
mb
er
of
pix
els
Correlation
MI 12 days
MI 4 days
MI 8 days
Blank
0,00
5,00
10,00
15,00
20,00
25,00
30,00
35,00
40,00
0-0
,05
0,0
5-0
,10
,1-0
,15
0,1
5-0
,20
,2-0
,25
0,2
5-0
,30
,3-0
,35
0,3
5-0
,40
,4-0
,45
0,4
5-0
,50
,5-0
,55
0,5
5-0
,60
,6-0
,65
0,6
5-0
,70
,7-0
,75
0,7
5-0
,80
,8-0
,85
0,8
5-0
,90
,9-0
,95
0,9
5-1
Av.
nu
mb
er
of
pix
els
Correlation
Blank
MI 4 days
MI 8 days
MI 12 days
121
samples, there were almost no FA pixels detected (Figure 54). Surprisingly, the highest
concentration of FA was detected after 4 days of treatment, whereas the lowest for 12
days.
Figure 54. Example of histograms of concentrations of FA for two samples a) treated for 4 days with mixture I b)
blank
Although, closer interpretation of the obtained histograms for samples treated during
12 days consecutively (Figure 55) shows that once again the average of the obtained
result does not reveal the real characteristics of the obtained results. First five samples
reveal low concentrations of the FA whereas another five show much higher (up to 20%
of fluoridation degree). It would suggest that maybe there was some experimental error
in the treatment performed on those samples and in order to obtain reliable results the
experiment should be repeated.
Table 37. Concentration of FA and HA detected for samples treated with mixture I during 0,4,8 and 12 days
consecutively, acquired with the spectral camera of 256 channels
Concentration of HA Concentration of FA
Blank MI 4 days
MI 8 days
MI 12 days
Blank MI 4 days
MI 8 days
MI 12 days
Av. 94,7% 80,9% 86,8% 88,1% 5,3% 19,1% 12,7% 11,9%
SD 0,02 0,06 0,01 0,06 0,02 0,06 0,02 0,06
122
Figure 55. a) Histograms obtained for all samples treated with mixture I for 12 days consecutively b) average percentage concentrations for FA for all 10 samples.
18.6. Daily monitoring of the sample and the durability of the treatment
In order to test how daily treatment is affecting the sample, spectral data of the teeth
treated with mixture I,II and III were acquired daily (after performing the entire daily
cycle of applications) with the camera of 121 channels.
As a result, it could be observed that for mixture I and III the maximum number of pixels
with the same correlation with HA is the lowest before the treatment (at day 0). As a
result of the performed applications, this correlation increases and reaches the
maximum value of 0,55-0,6 at second day of the treatment. In case of the mixture II, no
differences between the blank sample and the treated sample could be observed (
Figure 56).
123
Figure 56. Daily monitoring of the samples treated with mixture I,II and III. Data were gathered at day 0, 1,2 and 3rd
with the camera of 121 channels.
Subsequently, the samples were left in the 0,05% chloramine-T solution in the
refrigerator for 7 days and again measured. The data revealed a considerable drop in the
number of pixels correlated with HA in the measurement delayed in time. The resulting
correlations were even smaller than for the sample before the treatment (at day 0) for
mixture MI and MII (Figure 57)
Figure 57.Daily monitoring of the samples treated with mixture I,II and III and the result for the same samples after
7 days without any treatment. Samples were left in the fridge submerged in the solution of antibacterial chloramine-T. Data were gathered with the camera of 161 channels.
18.7. Raman measurements for the evaluation of the fluoridation degree of
human enamel
In order to confirm the creation of fluorapatite as a result of the applied treatments, which was detected with NIR Hyper Spectral Imaging, confocal Raman microscopy measurements were performed. Teeth were investigated before and after the treatment followed by a daily monitoring of the treated samples.
0,00
0,10
0,20
0,30
0,40
0,50
0,60
0,70
0,80
0,90
1,00
MI MII MIII
day 0
day 1
day 2
day 3
0,00
0,10
0,20
0,30
0,40
0,50
0,60
0,70
0,80
0,90
1,00
MI MII MIII
day 0
day 1
day 2
day 3
after 7 days
124
18.7.1. Raman measurements of the human enamel
Tooth enamel was successfully detected using Raman microscopy. A spectrum assigned
to the etched human enamel, presented in
Figure 58, shows peaks specific for the different stretching and bending vibrations of PO4
and CO3 groups of hydroxyapatite. The most prominent peak is represented by the ν1
PO43- stretching vibration at 960 cm-1. In addition, further peaks and their spectral
assignments are presented in Table 38.
Figure 58 Raman spectrum of the etched human enamel
Table 38. Prominent peaks in the Raman spectrum of the etched human enamel and their spectral assignments
Peak position (cm-1
) Assignment
960 ν1 symmetric stretching mode of PO43-
431, 446 ν2 symmetric bending mode of PO43-
1023, 1043, 1052, 1069 ν3 asymmetric stretching mode of PO43-
579, 590, 608, 614 ν4 asymmetric bending mode of PO43-
1069 ν1 symmetric stretching mode of type B CO32-
18.7.2. HA and FA differentiation
Spectra obtained by recording the etched enamel surface as well as magnified
prominent peak region are presented in Figure 59. Differentiation of HA and FA is
possible based on a peak shift from 960.14 (HA) to 962.81 (FA).
125
Figure 59. Raman spectra of HA and FA detected on the etched tooth enamel(a) and magnified prominent peak region (b).
18.7.3. Surface topography analysis
Since the tooth enamel has a structured surface, the sampling area needs to be
topographically analyzed prior to Raman mapping. One representative topography map
which is subsequently used for Raman analysis is presented in
Figure 60.
Figure 60. Representative topography map of the tooth surface
18.7.4. Raman analysis of the tooth treated with the commercial toothpaste
Daily monitoring of the samples treated with the commercial toothpaste Sensodyne®, as
described in paragraph 17.7, was performed using confocal Raman microscopy. Based
on the spectral assignment depicted in
126
Figure 58, each sampling pixel can be assigned to either HA or FA. Figure 61 visualizes
the spatial distribution of HA and FA. Measurement performed before the etching
procedure revealed both FA and HA ν4PO43- stretching vibrations.
Figure 61. Raman maps of the experimental areas obtained a) before etching, b) after etching procedure and after c) 1 day, d) 2 days and e) 4 days of treatment with Sensodyne.
However, naturally it was not possible to image exactly the same sampling area in the
tooth surface after each treatment. Consequently, the degree of fluoridization differs.
This could potentially explain the increased fluoridation degree after the first day of
treatment compared to the etched sample. However, the overall trend is evident, as the
treatment is followed by increase in fluorapatite, confirming the results obtained with
NIR HSI MCR.
Based on the distribution maps in Figure 61, the fluoridation degree was calculated
applying the following equation:
𝐹𝐴𝑟𝑎𝑡𝑖𝑜 =𝑛𝑟 𝑜𝑓𝐹𝐴 𝑎𝑡𝑡𝑟𝑖𝑏𝑢𝑡𝑒𝑑 𝑝𝑖𝑥𝑒𝑙𝑠
𝑡𝑜𝑡𝑎𝑙 𝑛𝑢𝑚𝑏𝑒𝑟 𝑜𝑓 𝑝𝑖𝑥𝑒𝑙𝑠𝑥100% (Eq.9)
127
Table 39. Fluoridation degree obtained for all analyzed sampling areas treated with Sensodyne toothpaste (day -1
indicates the tooth before etching, whereas day 0 represents the data after etching).
Day of the treatment Map Fluoridation degree [%]
-1
1 53.1 2 51.8 3 33.8
0
1 49.1 2 17.0 3 46.6
1
1 1.8 2 1.8 3 0.3
2
1 25.2 2 16.9 3 16.3
4
1 68.3 2 73.7 3 61.9
18.7.5. Raman analysis of the tooth treated with the remineralizing mixture III
The same experimental procedure was performed daily on the second half of the same
tooth treated with the remineralizing mixture III. Once again, the spatial distribution of
HA and FA was visualized (Figure 62) and the fluoridation degree was calculated for all
sampling areas (Table 40). Again, as already shown for the treatment with Sensodyne,
the overall trend of increase in FA after treatment with the mixture III could be detected.
Once again, comparing the data after day 3 and after day 4 of the treatment, the slight
decrease in FA concentration could be attributed to sampling slightly different spots on
the tooth surface (Figure 62). However, the final fluoridation is comparable to the
Sensodyne treatment, indicating the fluorapatite creation as a consequence of the
applied treatment.
128
Figure 62. . Raman maps of the experimental areas obtained a) before etching, b) after etching procedure and after c) 1 day, d) 2 days, c) 3 days, d) 4 days of treatment with the remineralizing Mixture III.
Table 40. Fluoridation degree obtained for all analyzed sample areas for sample treated with the mixture III.
Day of the treatment Map Fluoridation degree [%]
-1
1 42.2 2 4.3 3 56.3
0
1 3.4 2 7.8 3 51.9
1
1 50.4 2 65.8 3 53.8
2
1 54.6 2 59.3 3 51.2
3
1 4.3 2 8.3 3 8.7
4
1 61.2 2 60.7 3 68.4
129
18.7.6. Comparison of the commercial Sensodyne toothpaste and the
remineralizing mixture III
The comparison of the fluoridation of the tooth enamel after applying Sensodyne and
mixture III shows the increment of the fluoridation degree comparing to the etched
samples (Figure 63).
Faster fluoridation was achieved with the mixture III, although after 4 days of treatment
the fluoridation degrees of both treatments are at almost the same level. Based on
these data, the two products can be considered as equivalent.
Figure 63. Comparison of the fluoridation degree between two applied treatments
19. Discussion
The main obstacle in the presented work is the differentiation of the fluorpapatite in
presence of hydroxyapatite with the NIR methodology. FA is a common substitution of
HA. During the creation of the dentine and enamel, fluoride fixes calcium and creates
fluorapatite (FA) - a different type of apatite that from the crystallographic point of view
differs from hydroxyapatie only in the substitution of the ion OH- by the F-. To this
structural change, FA can attribute its increased stability that results for example in the
bigger resistance to the acid attacks than HA (20). With NIR spectroscopy, the visible
vibrations are based on OH- group; whereas calcium, phosphate or fluoride ions have no
relevant signal in NIR region. Thus, the only difference between two apatite species is a
change (or a lack) of the OH- stretching where the group is substituted with the fluoride
ion. Consequently, the HA spectra has more intense bands than FA what makes the
detection of the FA more difficult.
When it comes to real tooth sample, the differentiation between the etched surface
(blank samples) and remineralised one is facilitated due to the favoring scattering effect.
The acid treatment changes the enamel structure by dissolving the surface and leads to
the mineral loss. As a result, the porosity of the treated surface is greater than in case of
130
the remineralised one (where the raise in the mineral content occurs). Since the
increased porosity increments the scattering effect of the incident light, the reflectivity
of the sample changes. Consequently, the detected spectra also change. Described
phenomena facilitate the differentiation of the etched surface from the remineralised
one (183).
As it was explained, the scattering can have a favorable influence on the detection.
However, in this work, also a negative aspect of the phenomena have been encountered.
Scattering is the process in which the incident light changes its direction without the loss
of the energy. It is deviated from its original straight path as a result of the interaction
with irregular surface (183) (Figure 64). In this sense, the negative scattering effect was
encountered on the edges of some teeth samples or in other small irregularities
(hollows). In those locations, an increase in the fluorapatite detection was encountered
what could be cause by a scattering effect. However, it could also be induced by the fact
that in the irregularities or at the edges of the sample, a bigger amount of the
remineralised agent is gathered and that could result in more efficient remineralization
of those zones. Nevertheless, in order to better study the described finding further
experiments should be performed.
Figure 64. Scheme of some common interactions of the light with the tooth. A) a rebound of the incident light, b)Light enters the tooth and photons are deviated inside of it. Photons then leave the tooth as backscattering (leave from the same surface as it entered) or with another surface (diffused transmission), c) transmission, d)
absorption with heat production, e) absorption with fluorescence
Due to the described difficulty, the MCR method appears to be more suitable than
correlation coefficient for the FA determination in presence of HA. Correlation method is
using the reference spectra (HA and FA apatite powders) and is trying to detect the
similarity between the sample spectra and the pure reference spectra (133). Since the
spectra of the teeth differ from the pure apatite, due to its additional constituents, this
131
type of differentiation is more difficult. Moreover, the similarity of FA and HA spectra is
not facilitating the differentiation either. With the MCR method, on the other hand, one
can find the estimated spectra in the model that is the most similar, but not exactly the
same as the reference one. Unlike in the correlation coefficient method the pure spectra
are not necessary but can help in the initial estimates (137). With a well selected
number of components necessary for the calculation, an MCR analyses can easily be
performed. In the presented approach, most of the times, FA is detected indirectly. That
means that where the HA could not be found the rest of the detected pixels can be
classified as the one proceeding from fluorapatite signal.
Another problem encountered during the data treatment was the influence of the
embedding polymer on the spectra classification. The signal that came from the polymer
was strong and affected the differentiation of the apatite species making the detection
of FA even more difficult (Figure 65). Once again, the MCR method occurred to be more
reliable in the separation of the polymer spectra from the sample proceeding signals.
The correlation coefficient method is more sensible to the side effects such as scattering
or interferences from other spectral species such as structural elements or polymer.
Presence of the additional spectra is not so disturbing when the pure spectra are
considered but when the sought spectra are not pure the differentiation is once again
interrupted.
Figure 65. a)An example of spectra extracted from the tooth image b) Comparison of spectra of the pure reference
apatites and the embedding polymer
When it comes to the comparison of two spectral cameras used during the
measurements, the one that appears to be more suitable for the teeth study is the 256
channel SisuChema Hyperspectral ScannerTM due to its technical characteristics. It has
132
better spectral resolution and wavelength range than 121 channels camera. As it is
demonstrated at Figure 40, the 256 channels camera delivers more information
facilitating the differentiation of the two apatite species. Another important aspect is
the possibility to control the distance of the camera from the conveyor belt. It is
important for small samples such as teeth where the studied region is small, since
shorter distance to the detector facilitates acquiring more detailed image. Therefore,
the 256 channels is more suitable for the teeth study when detailed analyses needs to
be performed. The 121 channels camera can be used for the FA and HA determination
although the differentiation becomes more difficult.
When the correlation coefficient was applied for both cameras, a higher correlation with
HA for treated samples than for the blank samples was generally observed. On the other
hand, for the MCR method it is the opposite: the concentration of HA diminishes for
treated samples and concentration of FA increases, whereas there is almost no
detection of FA for the correlation method. Such phenomena are possibly caused by the
fact that with the correlation method most of the FA stays undetected and is classified
as HA pixels due to previously described problems in the FA determination (influence of
polymer, additional structural elements, scattering and similarity of the apatite spectra).
We suspect that the increase in the HA pixels in the correlation method can be
attributed to an increase of the number of FA spectra that were wrongly classified as HA
spectra. Nevertheless, this type of classification can lead to misleading results what is a
huge weakness of the method.
Another common observation for the correlation coefficient method is a shift in the
pixels histograms when the 256 channels camera is applied. These phenomena can be
explained with the additional information that is delivered when this camera is applied.
Most of all, because of the wider wave range, spectra contains more information what
changes the final classification of pixels.
Raman measurements confirmed the creation of fluorapatite in case of samples treated
with Sensodyne as well as mixture III as a more accurate approach in high spatial
resolution. Here, the complementary aspect of using two analytical techniques is
highlighted, as NIR HSI cannot provide the required spatial resolution and chemical
selectivity as Raman microscopy, but due to the bigger pixel size can be used to acquire
scans of the full tooth surface with minimal time effort, thus minimizing misleading
results due to overestimation of local artifacts.
Data obtained from samples treated with the commercial toothpaste revealed less
concentration of FA than data of samples treated with the remineralising mixture III. The
most effective remineralising product among the commercial toothpastes was
Sensodyne that reached an average of 7,8% fluoridation after 4 days of applications. In
comparison, the most effective among the remineralising ion exchange resins was
mixture II that contained a medium dose of the fluoride applied (16,1% of fluoridation).
The less effective was mixture III that did not reveal any changes comparing to blank
samples. With Raman measurements, we could observe that although the etching
133
procedure diminishes the level of the FA present on the tooth surface, FA is not
eliminated completely. The same conclusion can be derived from the NIR HSI MCR
analysis. With this methodology, mixture III is less effective in enhancing the
remineralization process, whereas in Raman measurements show an increase in the
fluoridation degree. Here, strengths and limitations of the two methods play a role again.
NIR HSI can sample bigger areas with low spatial resolution, whereas Raman microscopy
can sample small areas with high resolution. The experimental spots areas analyzed
within Raman spectroscopy are limited in size, due to the applied spatial resolution. As a
result, this method cannot be absolutely reliable from the quantitative aspect and
performed measurements are not representative for the entire sample. NIR HSI MCR
measurement, on the other hand, cover the entire sample and the results obtained with
this method can be by such considered representative for the applied treatment efficacy,
although it is limited by the artifacts proceeding from the complexity of the applied data
treatment and surface irregularities.
The fact that the overall fluoridation degree obtained with sample treated with mixture
III is even smaller than for the blank sample (etched sample) is possible since the
analyzed tooth was not the same one and the obtained data are of approximately the
same degree (4,9% for the blank and 4,6% for the mixture III). In the applied mixtures
the mass ratios of the phosphate and calcium ion stays the same (3:2 respectively)
whereas the concentration of the fluoride raises from mixture I to III (paragraph 17.5).
The raise in the fluoridation degree for the mixture I and II is caused by the creation of
the fluorapatite on the surface of the teeth as a result of the applied treatment. The
small amount of fluorapatite detected for the mixture III could be explained by the
possible co-precipitation of the calcium fluoride preventing the formation of fluorapatite.
Very interesting conclusion that could be made after performed experiments is that
observed changes (increment of the HA correlated pixels for the correlation method and
rise of the concentration of FA with the simultaneous drop in the HA concentration for
the MCR method) are detected in concentrated areas. Samples that were only treated
with acid on the other hand resemble a homogeneous distribution of HA among the
observed teeth. We suppose that the remineralization process, understood in here as a
creation of fluorapatite, proceeds in zones. The fluoride substitution does not appear to
be a homogenous process where fluorapatite is distributed all over the treated sample.
It is rather concentrated in small, remineralised areas. It can be confirmed by the Raman
measurements, where small dislocation of the experimental spot leaded do detection of
different FA or HA concentrations.
In case of the experiment that implemented the application of mixture III (paragraph
18.3.2) and the prolongation of the treatment (paragraph 18.5.2), the analyzed
histograms of obtained samples did not coincide with the information extracted from
the average fluoridation degree. In our opinion, the average value should be treated as
an indicator of the efficacy of the treatment and not as a general conclusion. In order to
better represent the information about the changes that causes the application of each
134
treatment, all images and histograms of samples should be analyzed and compared
separately.
The application of the protein revealed a smaller fluoridation degree than in case of
samples treated without the protein application. According to Y. Fan (190) et al. the
optimal conditions for the fluorapatite growth controlled by the amelogenin are pH 6.8 ±
0.4 Outside this range, crystals are loose nanorods or plate-like shape that because of
their porous characteristics would not facilitate the remineralization process of teeth
(187), (23), (172). As to the presence of amelogenin, the concentration range was of 40
± 10 µg/ml and the fluoride concentration of 1.5 ± 0.5 mg/l. In the mentioned study,
florapatite is created in solution, whereas in the presented study fluorapatite is growing
on the surface of the teeth with artificial saliva as a unique solvent. Although all other
conditions (pH and concentration of the protein) were maintained, the fluoride level
could not be maintained due to different environment evolution during the experiment.
Since the best result was achieved for the lowest concentration of the fluoride, probably,
the applied fluoride concentration was too big for proper functioning of the amelogenin.
Thus, in our opinion, the experiment should be performed with lover levels of fluoride
ions to be delivered during the process to observe the influence of the protein.
The experiment with the treatment prolongation, revealed the highest concentrations of
the fluorapatite after 4 days of treatment. Surprisingly, the extension of the treatment
interval to 12 days did not result in growth of the remineralised zone. Since a possible
experimental error was detected for some samples, additional daily monitoring of the
remineralising treatments at the same dental sample should be performed in order to
get better knowledge of the characteristics of the process of remineralization.
Daily monitoring of the samples showed an increment of the HA correlated pixels for
mixture I and III throughout the days when the treatment was performed. Since for the
correlation method the pixels with increased correlation with HA can be identified as a
possible FA creation, such an increment would suggest the remineralization of measured
samples. The measurement performed on the same samples after 7 days without
treatment revealed a drop in the HA correlated pixels. It could be suggested that the
created remineralised layer was washed away with time, although further experiments
should be performed preferably with the 256 channels camera and the MCR as a data
treatment approach in order to confirm such a hypothesis.
20. Conclusions
As a result of the performed study the following conclusions can be presented:
NIR HSI is a method that allows differentiating remineralised tissue from the
demineralized one
NIR HSI with the MCR multivariate data analysis allows comparing the efficacy of
various remineralizing treatment and characterization of the enamel surface that
135
undercame during the remineralization process. It also shows the distribution of
the deposited fluorapatite on the tooth surface
Correlation coefficient method is not a suitable method for the determination of
fluorapatite on the dentinal tissue since it did not differentiate the fluorapatite
from the hydroxyapatite and it is influenced by the embedding polymer
contribution
256 channels camera delivers more information about the sample due to its
wider spectral range and better spectral resolution
Raman measurements confirmed the creation of fluorapatite in case of samples
treated with Sensodyne as well as mixture III
Since Raman microscopy can sample small areas with high resolution it properly
detects the fluorapatite. However, it does not give the information about its
distribution over the sample. Thus it can be applied as a verifying methodology
but it cannot be used for quantitative studies.
As a result of the performed NIR HSI MCR study it could be observed that:
o the most effective remineralising product among the commercial
toothpastes was Sensodyne;
o the most effective among the remineralising ion exchange resins was
mixture II that contained a medium dose of the fluoride;
o the extension of the treatment interval to 12 days did not result in growth
of the remineralised zone although there was a probable experimental
error encountered in this study;
o The application of the protein revealed a smaller fluoridation degree than
in case of samples treated without the protein. Probably, the fluoride
concentration was too high for the proper functioning of the amelogenin
The application of the correlation coefficient for the daily monitoring of the
remineralising process showed an increment of the HA correlated pixels for
mixture I and III throughout the days when the treatment was performed. An
experiment repeated after 7 days without treatment suggest that created
remineralised layer was washed away with time.
136
137
STUDY OF THE REMINERALISED HUMAN
DENTAL TISSUES BY THE SYNCHROTRON
INFRARED SPECTROSCOPIC
ELLIPSOMETRY: OPTICAL CONSTANTS
DETERMINATION
138
Summary of the study
Objectives
Although multiple studies were performed on human dental tissue, still the influence of
the remineralization process on the structure and chemical composition of enamel and
dentin is not fully discovered. In present study, Infrared Spectroscopic Ellipsometry
(IRSE) and synchrotron ellipsometry are proposed for the determination of the optical
constants of human dental tissues.
Methodology
Human teeth were treated with the remineralising agent (NMTD) and analyzed with the
synchrotron IR ellipsometer. A cross section of the tooth was acquired and analyzed.
Reference samples were measures with the laboratory ellipsometer of the internal
source of light and FTIR spectrometer at ISAS facility.
Results
Differences in the spectral signature depending on the position of the experimental
point in the tooth were observed when synchrotron IRSE was implemented.
In order to construct an experimental model for the synchrotron data interpretation two
types of reference samples were measure: pure apatites (hydroxyl and fluorapatite) and
etched human teeth.
Optical constants derived from the powder reference apatites could not be applied in
order to compare them with the experimental data of the real tooth sample due to
spectral differences between reference and experimental samples. However, similarities
between spectra of teeth reference samples and synchrotron measurements were
encountered. It could be concluded that a sample where traditional demineralisation
was performed (acid etching) corresponds to the upper part of the enamel whereas
severely demineralized samples correspond to deeper parts of the tooth.
Conclusions
Performed simulations revealed high similarity of the obtained reference spectra to the
experimental synchrotron spots. That allows suspecting that once reference samples are
analyzed with the synchrotron IRSE method, valuable information about the influence of
the remineralising treatment on the dental tissue structure and composition will be
revealed.
139
Introduction
Dental caries are defined as localized damages of the hard tissue caused by the acids
produced during the bacterial activity in the buccal plaque. The process begins in the
bacterial biofilm by the fermentation of the carbohydrates and starts to be visible on the
hard tissue. Dental caries are the most common reason of the oral pain and the tooth
loss (7).
The process of demineralisation and remineralisation takes place constantly during the
day in the oral cavity. The balance between those two processes stop, reverse or
maintains the progress of the creation of caries. Without any doubt the most popular
agent that enhances the remineralization is fluoride. Beside the antibacterial properties
at low concentrations, fluoride stops the demineralization and favours the opposite-
remineralizing process on the tooth surface (section 5).
In order to characterize the tooth surface a big number of methodologies have been
applied (section 7).
Although multiple studies were performed on human dental tissue, still the influence of
the remineralization process on the structure and chemical composition of enamel and
dentin is not fully understood. In present study, Infrared Spectroscopic Ellipsometry
(IRSE) and synchrotron ellipsometry are proposed for the determination of the optical
constants of human dental tissues.
Ellipsometric studies are getting popular nowadays especially in composition, thickness
or roughness determination of organic films and multilayers (191). When determined
properties are changing along the probed material, the polarization degree is affected,
and very sophisticated models are required to process the obtained data. In order to
apply a reasonably defined angle, the spot size of the probed sample has to be limited.
Sometimes, it has to be set close to the diffraction limit. It means that IR ellipsometry is
limited by the degree of the brightness of the light. In order to improve it, the
synchrotron storage rings have been applied (126).
Nowadays there are three instruments that apply the IR synchrotron radiation in
ellipsometric measurements: NSLS in Brookhaven (New York), ANKA in Karlsruhe
(Germany) and IRIS at BESSY II in Berlin. The last one, constructed as a micro-focus
mapping ellipsometer, was applied in present work. The experimental set up allows to
scan the area of 50x50mm, has a spectral range of 2,5-30µm (4000-333 cm-1) (126) and
lateral resolution below 1 mm2 whereas the traditional ellipsometers are of around 50
mm2 (127).
Although there is a big increment of the noise produced by accelerator source, the
sensitivity improves enormously thanks to the brilliance provided by the synchrotron
light, that is twice the magnitude of the Globar source instrumentation. Its first
commissioning was performed in 2003 and since than it has been applied in many
investigations but mainly in the area of thin films (126). In the present work the
140
synchrotron ellipsometry was applied to determine optical constants of the
remineralised human dental tissue what would allow to explore the changes in the
dental structure caused by such treatment.
In order to extract all necessary data from the synchrotron ellipsometric measurements
well matched reference samples are indispensable. In the present study, a series of
experiments to evaluate the characteristics of an adequate dental reference sample for
the synchrotron ISRE measurements are presented.
141
Experimental Section
21. Methodology
21.1. Specimen preparation
Human teeth extracted from patients of age between 20-50 years old were extracted
and carefully selected to obtain specimens lacking any defects like cementoenamel
defects or dental caries that could affect results of the study. After the extraction,
specimens were stored in a 0,05% Chloramine-T solution that besides its antibacterial
properties also prevents the precipitation of ions.
Subsequently, the teeth were immobilized in a Triplex Cold ® polymer (Ivoclar Vivadent,
Liechtenstein) and Epofix™ Cold-Setting Embedding Resin (Struers, USA) once the
remineralising treatment was performed. Subsequently, samples were longitudinally cut
using the diamond saw (Southbay Technology Inc., USA.) to obtain a cross section of the
tooth (excluding the root).
21.2. Reference apatite samples
Reference sample of the hydroxyapatite (HA) were of analytical grade and was used as
received without any further purification (>90%, Fluka, Sigma-Aldrich, Germany).
The fluorapatite (FA) reference powder was synthetized in the solid phase reaction (192).
Calcium fluoride (95%, Riedel de Haen, Sigma-Aldrich ,Germany) and tricalcium
phosphate (35-40% (Ca), Panreac, Spain) were mixed in the agate miller at the ratio of
1.67 Ca/P. Subsequently, the reagents were placed in the electric oven (Selecta 366 PE,
Spain) and heated to 1200˚C during 2 hours. The solid FA was then grounded during 15
min. into powder.
21.3. Reference teeth samples
Three different teeth samples were at first etched with 1M HCl for 30 seconds to
simulate the early stage caries creation. Another three samples were etched with 1M
HCl for 30 seconds with a constant flow of the nitrogen gas through the acid solution.
21.4. Treatment performance
Previously etched teeth were treated with the NMTD remineralising agent (48).
Approximately 0.5 g of the product was mixed with few drops of artificial saliva (KCl
0,625 g/l; CaCl2 ∙ 2H2O 0,166 g/l, K2HPO4 0,804 g/l; pH 6,8 ± 0,4) to obtain the optimal
consistence for its further application on the enamel surface. The coating was changed
every 12 hours and the treatment lasted 4 days. The NMTD agent was renewed by
142
carefully washing the specimens with artificial saliva and applying a fresh portion of
NMTD. During the time of the experiment, samples were placed in the incubator to
maintain it in the natural temperature of the mouth that is in 37 ̊C. Once the treatment
was finished the samples were stored under a relative humidity of 100% in a 0,5%
chloramine –T solution in the refrigerator.
21.5. Instrumentation
The samples were analyzed by using IR spectroscopic ellipsometry in the laboratory and
at the synchrotron BESSY facility in Berlin. In the laboratory, IR spectroscopic
ellipsometry measurements were performed on a custom-build ellipsometric set-up in
the mid-IR spectral range (4000-400 cm-1) attached to a Bruker Tensor 37® (Germany)
Fourier transform spectrometer. Measurements were performed with a spectral
resolution of 4 cm-1 using a photovoltaic mercury cadmium telluride (MCT) detector
cooled by liquid nitrogen. Incidence angles in the range between 50-70° were used.
At the synchrotron facility, a mapping ellipsometer attached to a BRUKER IFS 66/v was
used. The mapping system provided a lateral resolution below 500 µm2 using a
The principle of ellipsometry is the following: Incident linearly polarized radiation is
reflected from the sample surface as elliptically polarized radiation described via the
ellipsometric parameters: tanΨ and Δ. tanΨ is the amplitude ratio and Δ for the phase
shift difference of the orthogonally p- and s- polarized components of the reflected
waves (rs and rp). The ellipsometric parameters are defined by the quantity ρ, which is
the ratio of the complex reflection coefficients rp and rs:
i
s
pe
r
rtan (Eq.10)
For the reference measurements of bulk samples, the measured ellipsometric
parameters could be directly converted to the complex optical constant �̃� defined by the
real refractive index n and the absorption index k:
�̃� = 𝑛 + 𝑖𝑘 (Eq.11)
For these bulk samples (half space samples neglecting any surface contributions), the
complex optical constant can be calculated directly at certain angle of incidence (193).
�̃�2 = 𝑠𝑖𝑛2 (𝜑) [1 + (1−𝜌
1+𝜌)2 tan (𝜑)2] (Eq.12)
For all other evaluations, where layered samples need to be considered, the simulations
were performed with optical layer models (see 1.7.)
Microscopic measurements were performed with a Bruker Hyperion 3000 FTIR
microscope using a Cassegrain objective (15x) with numerical aperture of 0.4 (f). In order
143
to ensure best linearity of the detected signals, the microscope was equipped with a
photovoltaic mercury cadmium telluride detector. All spectra were taken with a spectral
resolution of 4 cm-1.
21.6. Data processing
The ellipsometry software, SpectraRay/3 from SENTECH Instruments GmbH Germany
was used for optical modeling.
22. Results and Discussion
22.1. Measurements of the reference apatite samples
In order to understand the ellipsometric spectra of the measured teeth, reference
apatite samples were studied. For this purpose, hydroxyapatite and fluorapatite
powders were compressed with the KBr powder in order to obtain the corresponding
pellets. Measurements were performed at the laboratory ellipsometer at the incidence
angle of 70˚.
By the comparison of the resulting refractive index (n) and absorption index (k) of the
two reference apatites it could be observed that the main difference between the two
reference samples could be encountered in the 1000-1100 cm-1 region (
Figure 66,
Figure 67) where phosphate vibrations are located. For both optical constants, the band
around 1080 cm-1 is more intense in case of the HA (n=0.82 , k=1) comparing to the FA
(n=0.57 , k=0.81) . Moreover, for the absorption index (k) a sharp peak could be
differentiated: for the FA powder at 1084 cm-1, whereas a broader one and located at
1088 cm-1 for HA spectra.
Figure 66. Resulting refractive indexes of the reference HA and FA powders measured at the laboratory ellipsometer.
144
Figure 67. Resulting absorption indexes of the reference HA and FA powders measured at the laboratory ellipsometer.
22.2. Determination of the possible contributions of the embedding polymers
In order to ascertain whether there are spectral contributions of the embedding
polymers used during the sample preparation with the apatite reference samples, a
comparison of all four spectra was performed. It could be observed that in the region
where the two species could be differentiated (1000-1100 cm-1) no important
contribution from the embedding polymers could be distinguished for both refractive
and absorption index(Figure 68, Figure 69). Larger bands could be encountered around
1400 cm-1 and 1750 cm-1, however, since in those regions there are no important bands
for neither HA nor FA, discussed contributions could be neglected in case of the
differentiation of the reference apatites, in presence of the embedding polymers.
Figure 68. Resulting refractive index of the embedding polymers compared with the reference HA and FA powders measured at the laboratory ellipsometer.
145
Figure 69. . Resulting absorption index of the embedding polymers compared with the reference HA and FA powders measured at the laboratory ellipsometer.
Comparison of the synchrotron IRSE measurements the previous laboratory experiments
In order to obtain a cross – section line of a human tooth a sampling of the longitudinally
cut teeth was performed with the synchrotron IR mapping ellipsometer. One spectrum
was acquired every 0,5 mm. As a result, 14 spots in a line that included the spectra
proceeding from the embedding polymer, enamel and dentin were obtained(Figure 70,
Figure 71)
.
Figure 70. Experimental spots acquired at the synchrotron IRSE experiment on the remineralised tooth sample
146
Figure 71. Ellipsometric linescan polymer-enamel-dentin. Baseline shifted for convenience, line scan 0,5 mm steps. Spot 14: polymer, 13: interface, 12:enamel, 11- 2 dentin.
As a result of the calculated tan spectra, on base of the reference optical constants
determined for the laboratory samples, it could be observed that the polymer spectra
showed similar behavior in both laboratory and synchrotron (Figure 72). Such a
coincidence, allows us to claim that the measurements performed at both experimental
set-ups coincide and can be further compared.
Figure 72. Comparison of the embedding polymer spectra obtained during the synchrotron (black) and laboratory (red) experiments.
For the following spots, four spectra: the synchrotron spectra and the calculated HA, FA
and polymer spectra were overlapped in order to compare them. As a result of such a
comparison some differences could be encountered.
A clear contribution of the polymer peaks at around 1500 and 1250 cm-1 into the tooth
spectra was detected. Probably due to the imperfect surfaces, since the probed spot
147
areas, partially included part of the polymer matrix. Described contribution could be
found in all of the resulting spots (Figure 72).
There are differences in the number of bands and its positions when the tooth spot is
compared with the reference (Figure 73). A doublet around 1000-1200 cm-1 can be
differentiated for the HA and FA powders whereas for the tooth spots the spectra vary.
In case of the spot 12, that represents the enamel spectra, a similar broad peak in that
region could be differentiated, although it is moved into the smaller wavelengths
comparing to the spectra of the reference apatites (Figure 73 b)Moreover, it is not as
well separated as in case of the reference samples. On the other hand, in case of the
spot 11, a completely different shape of the discussed peaks could be observe (Figure 73
a). Such difference confirms that the spot was acquired at the dentin of the tooth. Also,
a presence of a band around 1680 cm-1, where the amide I vibrations are detected,
indicates the presence of the protein, that has been already encountered in the human
dentin. The main protein present in the dentin is collagen type I. It has a form of
elongated fibrils that are covered with glycoproteins and proteoglycans (31). Mature
enamel, on the other hand, is almost without the protein, its content is up to 1% of
weight (17), (30).
Figure 73. Comparison of the a) dentin and b) enamel spectra obtained at the synchrotron ellipsometer.
Going deeper into the dentin, the main band maintains its previous shape and reveals
the similarity to the spot 11 (Figure 74). The protein band is seen also for deeper regions
of the dentin at almost constant level.
148
Figure 74. Spectra of the deeper parts of the dentin obtained at the synchrotron ellipsometer.
22.3. Measurements of reference teeth samples with defined treatments
Since there were clear spectral differences encountered between reference apatite samples and the tooth spectra at each experimental spot of the tooth, additional measurements at the laboratory ellipsometer were performed. In order to obtain an adequate reference samples for the synchrotron experiment, two type of teeth samples were prepared: first etched with traditional acid etching procedure and the second one, etched with more aggressive oxidant (acid + nitrogen) (three duplicates of each treatment) ( paragraph 21.3). Both treatments were employed to simulate the process of desmineralisation of a dental tissue: first traditional one, second severe one. Described samples were then measured at the 50˚ and 70˚ incidence angle ( Figure 75).
149
Figure 75. Ellipsometric tan measurements of the traditionally desmineralised (blue) and severely desmineralised (black) reference samples at 50˚ (a), b),c)) and 70˚ (d),e),f)) incidence angle.
As a result of the performed comparison, some similarities between etched samples
were encountered. For all analyzed teeth, a clear two bands, first at about 1050 cm-1 and
second at 1125 cm-1 could be differentiated. On the other hand, in case of the severely
demineralized samples, the 1125 cm-1 band is slightly moved to the lower wavelengths.
In case of the 1125 cm-1 band, the observed peak is sharper for the etched samples
comparing to severely etched teeth. Moreover, for these samples the discussed bands
are more intense than for the traditionally etched teeth.
150
Figure 76. Normalized referenced spectra (the same intensity at 1046 cm-1
and 1156 cm-1
) for traditionally desmineralised (1,2,3) and severely desmineralised (1’,2’,3’) teeth samples at the 50˚ incidence angle.
Comparing obtained results with the reference apatite powders, no similarity in the
calculated k constants can be observed. The phosphate sharp band, in case of HA and FA,
is located around 1080 cm-1 (Figure 67)whereas for the teeth samples, the two band are
located around 1050 cm-1 and 1125 cm-1.
In order to compare better the variations for the three sets of samples, the normalized
spectra of the teeth etched only with hydrochloric acid in the previous figure were
rationed to the normalized spectra of the (Figure 77).
Figure 77. Spectra of the three traditionally etched teeth samples normalized to the polymer spectra
As a result of the performed normalization, obtained spectra are almost the same. The
sharp peak at 1125 cm-1 is common for all of three samples. Observed differences
151
among the analyzed spectra come from the contribution of the embedding polymer.
These contributions are different in the individual spectra since the spot size of the lab-
ellipsometer is slightly larger than the probed sample spot. Thus, the bands around 1300
cm-1 and 1500 cm-1 are clearly proceeding from the polymer and have contribution in
each sample spectra, although contributions are of various intensity. Also, the band
around 1000 cm-1 can be classified as such. Moreover, negative peak around 1150 for
sample number one can also be interpreted as a small overlapping contribution of the
polymer. Again, the performed calculation does not reveal similarities between the
optical constant obtained for reference apatite powders.
22.4. Modelling of the IR data
In order to reach better lateral resolutions in ellipsometric measurements further
synchrotron ellipsometric experiments would be needed. However, having the obtained
reference optical constants for the apatites and polymers also a quantitative
interpretation of IR microscopic measurements is possible with optical modelling. In
order to confirm that the previously discussed teeth samples are suitable references for
the obtained synchrotron data further measurement with the IR microscopy were
performed. Obtained simulations were then compared and the similarities were
discussed.
Figure 78 presents the microscopic measurements obtained for traditionally and
severely etched sample number 3. The clear differences in the number and shape of
peaks are once again confirmed. Severely demineralized sample presents two well
defined bands around 1000-1100 cm-1 whereas for the etched sample the peak around
1100 cm-1 is less defined, consequently difference in the reflectivity of the two peaks is
bigger than for the severely etched sample (Figure 79). For the peak around 1110 cm-1 it
is of about 0,07.
The obtained spectral differences in the reflectivity between samples have the same
characteristics as in case of the optical constants in the ellipsometric (Figure 79) where
the difference was of 0,1.
152
Figure 78. FTIR spectra for sample treated only with acid (black) and decarbonised sample (blue).
Figure 79. Difference in the reflectivity and optical constants of the two types of etched samples
Subsequently, the microscopic reflection spectra and ellipsometric spectra were
modelled with (except a small offset for the baseline of the microscopic spectra) the
same simulation parameters applying a harmonic oscillator model. The revealed optical
constants are presented in Figure 80
153
Figure 80. Optical constants applied in the modelling of the reference samples
Figure 81 presents the experimental FTIR data compared with the simulation of the
same spectra. There is an overall similarity between experimental and simulated spectra.
Moreover, the spot 12 proceeding from the enamel reveals the similarity with the
reference sample etched only with acid, whereas spot 11 looks more like severely
demineralized sample (Figure 81).
Taking into consideration that samples etched only with acid simulate less invasive
procedure of caries creation, consequently, less hydroxyapatite is dissolved during the
treatment. It would suggest that measured part of the teeth proceeds from upper
(closer to the edge) section of the enamel. The other type of sample (etched with acid
and nitrogen) suffered a more severe deterioration since the applied treatment is more
oxidative and by dissolving the enamel it goes deeper into its structure (closer to the
DEJ) thus the observed part of the teeth proceeds from deeper parts of the enamel.
Figure 81. a) Comparison of the measurement of sample etched with acid and the spot number 12 from the synchrotron-ellipsometric measurements b) Sample treated with acid and nitrogen compared with spot number 11
(synchrotron-ellipsometric measurement). With red simulation spectra, with black real measurement are presented.
154
23. Conclusions
In the present study, synchrotron IRSE was applied to evaluate the structural changes
that under come human teeth when treated with the reminearalising agents. Since the
influence can vary depending on the zone of the teeth, a cross section line going from
the enamel into the pulp chamber was performed. As a result, differences in the spectral
signature depending on the position of the experimental point were observed. The spot
localized at the enamel, differed in the shape and the position of the bands in the region
of the phosphate vibrations from the spots localized in the dentin region of the tooth.
Also, the amide I bands revealed to be present in the dentine regions whereas they
could not be encountered in the enamel.
The comparison of the resulting IRSE synchrotron measurements with the previously
obtained reference HA and FA samples revealed various spectral differences between
the samples. Consequently, the optical constants derived from the powder reference
apatites could not be applied in order to compare them with the experimental data of
the real tooth sample. Dentinal apatite differs from the pure HA and FA. The size of the
dentinal crystals is of approximately 5nm×30nm×100nm and they are not as reach in
calcium as the synthetic ones. Moreover, the stoichiometric apatite contains around 4-
5% less carbonate than the biological apatite. Increase in carbonate and the lower
content of calcium of the dentin leads to higher acidic solubility and less resistance to
acid conditions (194). We presume that the spectral difference encountered in this
experiment proceed from mentioned differences in the chemical composition.
In order to obtain more suitable reference samples, two types of differently etched
human teeth were measured and compared with the experimental results. The first
type of sample etched only with acid represent more gentle demineralization. The
surface of the teeth is dissolved exposing the upper part of the enamel. The second type
of the applied demineralization generates the creation of N2O4 that is a powerful oxidant.
As a consequence, with this type of treatments, the demineralization is more severe and
exposes deeper parts of the enamel. The phenomenon was confirmed in present
measurements. Samples treated with different demineralization procedure revealed
different spectral characteristics. Moreover, when the data were compared to previous
synchrotron IRSE measurements, the samples treated only with acid were similar to the
enamel spectra whereas samples treated with more oxidative demineralization agent,
revealed more similarity to the deeper parts from the analyzed teeth.
In all of the analyzed samples, the contribution of the embedding polymers was studied.
It shows bands common for all of the obtained spectra in the 1300 and 1500 cm-1.
Luckily, in the phosphate and amid I vibrations that are the key regions in the study, the
contributions are very small and do not influence significantly the interpretation of the
data.
Selected synchrotron measurement spots can be simulated with reasonable agreement
in the same optical model as microscopic measurements of adequate reference samples.
155
From the similarity of the spectra, it is concluded that a reference sample etched only
with acid (gentle demineralization) corresponds to the upper part of the enamel, and a
sample more strongly oxidized (severe demineralization), corresponds to lower parts of
the enamel. The simulated spectra revealed high similarity to the experimental
synchrotron spots what allows to suspect that once both type of samples are analyzed
with the synchrotron IRSE method, more detailed information about the influence of the
remineralising treatment on the dental tissue will be revealed.
156
APPLICATION OF FTIR SPECTROSCOPY
FOR THE DENTAL TISSUE
CHARACTERIZATION: A CURVE FITTING
APPROACH
157
Abstract
Objectives
The aim of the present work is to investigate structural changes in the human enamel
and dentin induced by the remineralization process. The spectra from various points
proceeding from different locations of the tooth were compared and studied applying
Principal Component Analysis (PCA) and curve-fitting. Spectroscopic results presented in
this work are based on the deconvolution of the phosphate band. Obtained results were
compared to the reference hydroxyl and fluorapatite powders and scientific literature.
Methodology
Deconvolution of the pure apatites was performed on the spectra proceeding from the
synchrotron FTIR measurements. Curve fitting and PCA analysis were performed on the
spectra acquired with the Nicolet FTIR spectroscope with the Grobal source of light.
Deconvolution was carried out by the OMNIC® scientific software whereas for the PCA
Uncrambler® was implemented.
Results
Performed curve fitting of the pure apatite sample did not give clear results that could
be confirmed in the bibliography. However, curve fitting of the real samples as well as
the comparison of the spectra points and PCA analysis showed clear differences
between various points proceeding from different locations in the enamel. In general
the first point from the edge resembled the FA spectra whereas the rest of the point
could be attributed to the HA.
PCA of various remineralising mixtures showed separated populations for different
treatments, especially when samples that undercame protein assisted remineralization
and commercial agents were compared to the remineralising equivalents of NMTD
material.
Conclusions
Scattering effects and the general difficulties connected with the curve fitting
performance leads to serious doubts about the interpretation of the obtained
calculations and the interpretation of the bands. In order to confirm the statements the
experiment should be performed on bigger number of the samples at many
experimental points.
158
Introduction
As it was previously described FTIR spectroscopy is a powerful approach for the
characterization of dental tissue. It delivers valuable information about the chemical
structure of the dental tissues (97), (90), (98), (99). The careful analysis of the spectra
proceeding from the teeth allows observing the nature of the sample and its changes
depending on the applied treatment or the stress agent. It allows examining inorganic
and organic materials of the sample and has been successfully applied for the
quantitative analysis of the mineralized composition and the determination of the
physical properties of the dental tissue (98). Moreover it was also applied in order to
determine the CI (crystallinity index) of the teeth that delivers the information about the
percentage of the crystalline material in the sample (97).
The aim of the present work is to investigate structural changes in the human enamel
and dentin induced by the remineralization process. The spectra from various points
proceeding from different locations of the tooth were compared and studied applying
Principal Component Analysis (PCA) and curve-fitting. Spectroscopic results presented in
this work are based on the deconvolution of the phosphate band. Obtained results were
compared to the reference hydroxyl and fluorapatite powders and scientific literature.
Spectral curve fitting is a mathematical procedure which generates a series of individual
peaks that when added together match the original spectra. The process of curve fitting
is called convergence and is performed by the scientific software. In presented work,
OMNIC software with the Fletcher-Powell-McCormnik algorithm was implemented. The
points are determined by the RMS (root mean square) of the residuals of the sum of the
created peaks to the RMS noise (195) .
Curve fitting is performed in three steps: fixing the initial profile where line shapes and
baselines has to be chosen. Constant, linear, quadratic or cubic baseline can be applied
in order to minimize the residuals. The choice highly affects the final result and has to be
made very wisely (195).
Next step is to fix the initial parameters (width, height, location). The user can manually
fix the certain peak at expected position and adjust its height and width (195). The
selection of the position of the peaks can be guided by the position of the minimums in
the second derivative of the spectrum and also by the bibliographic suggestions.
Once all the information is set the minimization procedure is performed in order to
reflect the implemented set ups. As a result peaks are generated. The success of the
final fit depends on the fixed parameters, the better initial parameters the better final
deconvolution is obtained (195).
Since the performed operation is a mathematical equation generated peaks can have no
spectral meaning. Sometimes large amount of selected peaks give better peak, although
they are meaningless in the interpretation. That is why the entire procedure tends to be
a very difficult and highly dependent from the scientists personal judgment.
159
Experimental Section
24. Methodology
24.1. Instrumentation
Curve fitting experiments of the teeth samples were performed on the spectra acquired
with a Thermo Scientific Nicolet iN10 FT-IR Microscope, Spectra were recorded in the
reflection mode at spectral resolution of 8 cm-1 in the range between 2000-900 cm-1
,
after recording a background from Au reference sample. The step size applied in the
measurement was of 100x100 µm.
Pure apatite reference spectra and specific areas of the enamel and dentin where
performed at the synchrotron infrared microscopy at the SMIS beamline (SOLEIL,
France). Continuum IR microscope (Thermo Nicolet, USA) coupled to a NEXUS FTIR
spectrometer bench Nicolet 5700 (Thermo Nicolet, USA) and a liquid nitrogen cooled
mercury cadmium telluride (MCT-A) detector was implemented. The microscope was
equipped with a computer-controlled x/y stage allowing acquisition of profiles or maps
of the sample. Spectra were collected in reflection mode, at 6 cm-1 spectral resolution
over the range between 3000-800 cm-1 and step size 10x10 µm, using Atlμs software
(Thermo Nicolet Instruments).
24.2. Specimen preparation
Specimen preparation was performed as described in Section 21.1 page 141.
24.3. Reference apatite samples
Reference apatite samples were prepared as described in Section 21.2 page 141.
(200), (202) Poorly crystaline apatite, disordered phosphate phase located outside from the crystal line
1068 18,49 1077 13,40
ν3PO43- (198), (202) Poorly crystaline apatite
1092 19,81 1095 2,82 ν3PO43- (198), (201),
(200), (202) Stoichiometric apatites
1110 12,74 1101 7,57 ν3PO43- (199)
1113 18,53
HPO42 (198), (202) In newly precipitated apatites
1144 5,65 1133 7,56 HPO42 (198), (199),
(197), (202) HPO4
2- containing apatites
1164 2,49
In the present study in both apatites the band is present, although it is not well defined,
in fluorapatite it is in the form of a very wide peak (957 cm-1), whereas in hydroxyapatite
it is slightly better defined (958 cm-1). It would lead us to the conclusion that measured
apatites are poorly crystallised ones. Since the percentage area of the peak representing
the ν1PO43- stretching in fluorapatite case represents bigger value than in hydroxyapatite
165
that would indicate that fluorapatite has smaller crystal size. What would contradict the
Pleshko et al who claimes that fluorapatites have slightly larger size of the crystals than
the hydroxyapatite or it would suggest that measured samples are poorly crystallised
ones and to derived its crystallinity indices peaks around 1020 and 1050 cm-1 should be
taken into consideration instead of the ν1 band discussion (199).
On the other hand Uysal (201) et al. that was studying the spectral differences between
pure and F doped hydroxyapatites among others didn’t observe any differences in
discussed peak when the fluoride was introduced into the lattice. Neither A.Antonakos
et al. (200) observed such a relation.
When the width of the peak is considered the apatites that are doped with the fluoride
atoms had slightly larger value of the width of the peak. That would correlate with the
results obtained in this study (958HA cm-1= 19.75 and 957FA cm-1= 43.50). A comparison
of the widths shows the higher crystallinty or increased atomic ordering when the width
of the peak is smaller (200). In case of this study it is smaller for hydroxyapatite. That
would indicate that it has higher crystallinity (or increased atomic ordering) than
fluorapatite.
Pleshko et al found the correlation betwen the frequency of the 1020 cm-1 component
and the crystal size of the apatite. According to that work the frequency is not greater
than 1027 cm-1 for the crystal sizes smaller than 166 Å. An increase in the frequency
from 1028-1032 cm-1 was correlated with an increase in the crystal size 160-190 Å. The
frequency of the component at 1020 is reduced when the crystallinity is diminished.
That parameter right after the percentage area of the band at 1050 cm-1 was considered
the secondary indicator of the crystal size for poorly crystallized specimens (199).
According to Magne et al. the crystallinity of the biological samples can be established
by the value of the intensity of two peaks 1020/1030 cm-1. 1020 cm-1 are the stretching
arising from the nonstoichiometric apatites with HPO42- and CO3
2- with their vacancies
and 1030 cm-1 come from the stoichiometric apatites.
In the preset study the peak 1020 cm-1 was generated only in the hydroxyapatite spectra.
Its absence in the fluorapatite spectra could indicate the lack of carbonate ions
incorporated into the lattice. Taking into consideration the lack of the bands around
1420 – 1465 cm-1 and 1545 cm-1 that information could be confirmed with this study.
In case of fluorapatite the peak 1030 cm-1 was moved to 1043 cm-1. I have not found
bibliographic information whether this shift in the frequency represents some changes
in the crystallinity or crystal size of the apatite.
The relationship between the percentage area of the band at 1050 cm-1 and crystal size
was encountered. The percentage area drops from 45-5 % as the crytal size increases
from 135-190 Å. That behavior comes from the disordered phosphate phase that is
located outside from the crystal line (199). According to Pleshko et al. this can be a very
good indicator of the crystal size of the studied apatite. In case of fluorapatite in the
present study this band was found at the 1060 frequency and shown the increase in the
percentage area comparing to HA spectra. It would suggest that fluorapatite measured
166
in this study has a smaller crystal size than HA (the same information was concluded
from the band 958 and it was contradicting the Pleshko et al. statements.)
Uysal et al. (201) have discovered that when the Fluor is incorporated into the lattice the
shift into the higher wave numbers of the bands at 1090 cm-1 and 1045 cm-1 could be
observed. In case of this study the same tendency was encountered. For fluorapatite the
shift of the 1090 cm-1 band was of 4 cm-1 comparing to hydroxyapatite. When it comes
to the band at 1045 cm-1 in case of fluorapatite it was present at 1043 cm-1 and for
hydroxyapatite at 1035 cm-1.
1111 and 1144 cm-1 bands indicate the presence of the HPO43- in the lattice. In case of a
dental sample it can indicate the degree of maturation of the certain point of the teeth
since the decrease in its intensity means the loss of HPO43- and as a result indicates the
maturation of the apatite (202). In case of the present study both band where find in
hydroxyapatite as well as fluorapatite sample. Since both apatites are synthetic ones
obtained information suggests that analyzed apatites refer to early stage apatites.
25.4. FTIR analysis of the human teeth
25.4.1. Reference sample (etched with acid)
25.4.1.1. Spectra comparison
Four points varying in the distance from the edge of the enamel were carefully studied
and compared. 10 spectra located at the same distance were chosen and further the
average spectrum was generated in order to create the representative spectra for each
point. The first one was taken exactly from the edge of the enamel, second and third
one at 150 µm and 900 µm respectively. The fourth one was located 300 µm from the
DEJ (dentine enamel junction). Figure 6 shows the general comparison of the four
spectra.
Bands that could be differentiated in all spectra come from phosphate and carbonate
groups. The comparison of the intensities of those bands in various locations of the
enamel is presented in Table 2. Phosphate ν3A represents the peak between 1050 and
1070 cm-1 whereas ν3B the one at 1090-1110 cm-1.
167
Figure 88. Resulting average spectra from 4 different locations in the enamel: violet - 1 point (the edge of the enamel), blue - 2nd point (150 µm from the edge), green - 3rd point (900 µm from the edge), red – 4th point (300 µm from DEJ).
Table 42. Comparison of the intensities of the carbonate and phosphate bands of all 4 points of interest proceeding from the enamel
Position of the peak
Intensity
Carbonate Phosphate
ν3CO32- type A
(aprox.1545 cm-1)
ν3CO32- type B
(aprox.1465 cm-1)
ν3CO32- type A
(aprox.1450 cm-1)
ν3CO32- type B
(aprox.1420 cm-1)
ν3PO43- ν1PO4
3-
(aprox.950-970cm-1)
ν3A ν3B
At the edge
0,03 0,02 0,03 0,73
0,93 0,04
150 µm 0,02
0,02
1,00
0,82
0,02
900 µm 0,04
0,03
1,00
0,84
0,02
300 from DEJ
0,07
0,07
0,99
0,88 0,02
As a result of the comparison of 4 selected points it could be concluded that in the
spectra from the edge of the enamel, among others, the bands with the maxima at 1509,
1564 and 1554 cm-1 could be resolved. All bands represent the stretching proceeding
from the both A and B type carbonate. Respect to the rest of the spectra only in this
one well defined bands at 1509 cm-1 and 1564 cm-1 could be observed. In the rest of the
points carbonate bands were present around 1450 cm-1 and 1420 cm-1 with the
intensities of the peaks increasing in the direction from the edge of the enamel toward
the DEJ.
When it comes to the comparison of the ν3PO43- bands there is a big difference in the
intensity ratio of the peak ν3A/ ν3B (Table 3). The point at the edge of the enamel has
168
the smallest value of the intensity ratio comparing to the rest of the points. In this case
peak ν3A has bigger intensity than ν3B band whereas in the rest of the points this
relation is the opposite one: ν3B band represent higher absorbance. Beginning from the
2 point (150 µm from the edge) the ratio is diminishing toward the dentine enamel
junction (Absorbance: 2nd point>3rd point >4th point).
Table 43. ν3PO4
3- band : comparison of the frequencies of peaks ν3A and ν3B and its intensities ratio for all 4
analyzed point.
Position of the peak Wave numbers [cm-1] Intensity ratio ν3A / ν3B
Also the positions of the bands are worth mentioning. The frequency of the ν3PO43-
bands in the point located at the edge of the enamel are moved towards higher
wavelengths comparing to the rest of the points (Table 3). Referring this information to
the position of the peaks in the FA and HA the point from the edge of the enamel shows
an incredibly strong resemblance to the FA spectra considering the position of the ν3A
and ν3B bands whereas the rest of the point are similar to the HA spectra. Since the
intensity ratio of those two bands is smaller for the FA than for the HA spectra a
resemblance can also be considered in this aspect.
This clear difference that was encountered when the ν3PO43- was considered is well
illustrated by the map resulting from the Principal Component Analysis (Figure7). In the
analysis the area between 900-1200 cm-1 was applied. As a result it can be concluded
that the biggest variance proceeds from the points located at the edge of the enamel. Figure 89. a) map resulting from the PCA analysis (second component) b) 3D map resulting from the PCA analysis
169
Considering the ν1PO43- band all the points beside the point proceeding form the edge of
the enamel has the same intensity of the peak. First point has higher intensity of the ν1
band but it could be caused by the Kramers-Kroning transformation (spectra has a bit
derivative shape after the KK what has been corrected with the baseline correction).
Another factor that can have a huge influence on the shape of the peak and its further
transformation with the Kramers –Kroning algorithm are the characteristics of the
surface. Although sample was very carefully prepared in order to prepare a flat surface,
it is possible that at the edge of the sample where tooth meets with the embedding
polymer the area is not perfectly flat. Local micro slops and imperfections of this area
may cause a scattering effect that lead into the misleading results. It is worth noticing
that the same type of spectra was encountered in a place where a micro fissure is
crossing the sample (Figure 89). This kind of fissure can be created during the
preparation of the sample but also during patience live. Whatever the cause, the spectra
coming from this location resemble the spectra from the edges of the tooth.
25.4.1.2. Curve fitting of tooth spectra
Points described in paragraph 4.1.1 of this work have been subsequently deconvoluted.
Figure 8 shows the results of the curve fitting of all 4 points and Table 4 includes the
resulting bands and its percentage areas of the peaks.
In general for the point at the edge of the enamel 7 peaks were necessary for the
satisfactory fit, 2nd point needed 6 peaks whereas 3rd and 4th points were both
deconvoluted into 8 peaks.
170
Figure 90. Curve fitting of a) 1st point b) 2nd point c) 3rd point d) 4th point
a) b)
c) d)
Table 44. Bands resulting from the curve fitting of spectra proceeding from 4 different locations in the enamel
Accoring to Pleshko et al. theory the presence of the ν1 band in not well definded form is
caracteristic for poorly crystalised apatites and is commonly encountered in this form in
biological samples such as bone or teeth (199). The percentage area of the peak is
diminishing for the points located farther from the edge. Only the first point represents
a high value of this peak ,but again it can be due to the scattering effect.
171
Since the width of the peak at 958 cm-1 is growing in the dirrection 4th (12,2)< 3rd
(13,4) <2nd (17,6) < 1st (61,6) point it would suggest that there is more fluoride -
dopped type of crystals for the points that are closer to the edge of the enamel (200).
What is more the crystallinity would grow from edge to DEJ (200).
1015 and 1035 cm-1 bands were encoutered only for the points located in deeper
enamel (3rd and 5th). What would indicate that the size of the crystals in this parts are
less than 166 Å (199).
The percentage area of 1050 cm-1 band clearly grows from the edge of the enamel
toward the deeper enamel, than again drops to smaller value in the DEJ zone. According
to Pleshko et al. (199) the percentage area drops from 45-5 % as the crystal size
increases from 135-190 Å. It would indicate that the crystal size of the points closer to
the edge is bigger than in deeper enamel and that there is a change when approaching
the DEJ zone.
Uysal et al. have discovered that when the Fluor is incorporated into the lattice the shift
into the higher wave numbers of the bands at 1090 cm-1 and 1045 cm-1 could be
observed. In case of this study the point at the edge of the enamel represents the higher
frequencies for the peak at 1090 cm-1 (1095 cm-1) comparing to the deeper in the
enamel located points. This tendency on the other hand could not be attributed for the
band at 1045 cm-1.
1145 cm-1 bands indicate the presence of the HPO43- in the lattice. In case of a dental
sample it can indicate the degree of maturation of the certain point of the teeth since
the decrease in its intensity means the loss of HPO43- and as a result indicates the
maturation of the apatite (202). That can be confirmed in this study since the point at
the edge of the enamel represents the highest intensity for this band comparing to the
points in deeper enamel. Since enamel starts to grow from the DEJ the less matured
point should be the one at the edge.
25.4.2. Principal Component Analysis
In order to see whether there are spectral differences between the groups of specimens
that undercame different treatments a PCA analysis was performed on prepared
samples (section 24.5 ). In all cases experimental spots where extracted from the point
being the closest to the enamel external edge. Localization was carefully chosen since,
as it was previously demonstrated, the inequalities in the sample surface that were
observed at the edges of the teeth may give confusing results.
25.4.2.1. PCA analysis of remineralising mixture III
In order to find differences between samples treated with remineralising mixture III obtained
FTIR spectra were organised into four groups:
1. Spectra proceeding from sample treated with remineralising mixture III
172
2. Spectra proceeding from sample treated with protein assisted remineralising mixture III
3. Spectra proceeding from sample treated with commercial remineralising product
4. Spectra proceeding from sample etched with acid (Blank sample)
All compared spectra undercame the same pre-treatment. In order to diminish the
scattering effect a MCR (Multiplicative Scatter Correction) analysis was applied. MCR
transformation was designed to eliminate the multiplicative effect of the scattering. It
bases its calculations on the mean spectrum of all analyse spectra: offset (displacement)
(a) and the slope (b) are calculated. Subsequently the original spectra are corrected with
the calculated correction coefficient (a and b) (203).
Subsequently Savitsky-Goley (SG) derivative was applied on the compared data. In
general derivatives are used in order to correct the baseline and remove effects that
come from nonchemical sources. They also resolve overlapped bands in the analysed
raw data. SG derivative applies the information from a certain spectra region in order to
calculate the derivative at the certain wavelength. It avoids the influence of the noise
and smooths the data (203).
The PCA analysis performed on the pre-treated spectra is presented in Figure 91.
Figure 91. PCA analysis on spectra proceeding from the first point close to the edge of the enamel of four types of samples: treated with mixture III, protein assisted remineralization with mixture III, commercial remineraliser, blank sample.
173
It could be observed that spectra proceeding from samples treated with commercial
product and with protein assisted treatment with mixture III represent the similar
spectral characteristics and as a result were grouped together. They were separated
from the blank samples and mixture III. The last ones also formed two different
populations, although resembling more similarities than with the first two groups
(commercial and MIII + protein).
25.4.2.2. PCA analysis of various remineralising mixtures
Principal Component Analysis was also performed on spectra proceeding from six
different remineralising mixtures that varied in the concentration of the fluoride and
calcium ion (section 24.5).
As a pre-treatment of the data the SNV (Standard Normal Variate) was applied in order
to eliminate the scattering effect. This transformation centres and scales each individual
spectrum. Practically it gives the same effect as the MCR transformation. In SNV each
spectrum is standardised basing on the data from that spectrum whereas the MCR uses
the mean spectrum values. This time the SNV transformation was applied since it
separated more efficiently the data.
Subsequently the SG derivative was used and the PCA analysis was performed. The
result is shown in Figure 92. As it can be observed almost all of the spectra have the
same spectral characteristics beside the mixture I that formed separated spectral group.
Figure 92. PCA analysis on spectra proceeding from the first point close to the edge of the enamel of six types of samples treated with remineralising mixtures varying in the concentration of fluoride and calcium ions.
174
26. Conclusions
Performed curve fitting of the pure apatite sample did not give clear results that could
be confirmed in the bibliography. Some of the encountered information are
contradictory. For example the comparison of the 958 cm-1 band in both apatites
indicates that FA had smaller crystals than HA apatite, what contradict the
biblioghaphical information (199) that FA has bigger crystals than HA. The analysis of the
1050 cm-1 band on the other hand revealed that fluorapatite measured in this study had
smaller crystal size than HA.
Curve fitting of the real samples as well as the comparison of the spectra points and PCA
analysis showed clear differences between various points proceeding from different
locations in the enamel. In general the first point from the edge resembled the FA
spectra whereas the rest of the point could be attributed to the HA. However, the
possible scattering effects allow me to have serious doubts about the interpretation of
the obtained calculations and the interpretation of the bands. In order to confirm the
statements the experiment should be performed on bigger number of the samples in
many experimental points. Moreover, I have observed that curve fitting procedure is
very difficult to perform and can be easily influence by the technician. The treatment
performed on the spectra depends from the personal judgment of the scientist and can
be easily manipulated. That also makes me uncertain whether this type of the data
analysis is suitable for the analyzed type of samples. Performed calculations can be
taken into consideration however should be confirmed with further experiments. One of
the possible approach is the comparison of the CI (crystallinity index) obtained with the
FTIR measurements with the CI derived from the ellipsometric measurements. If the
obtained data coincide the continuation of the performed approach can be performed.
The Principal Component Analysis performed on samples with various treatments shows
spectral differences between the analyzed populations. The future investigation should
be centered on the samples treated with the remineralising mixture and the protein
assisted remineralization since clear differences between those groups were
encountered. The curve fitting procedure could be a choice in order to investigate the
source of the encountered spectral differences. However, since the deconvoluted
spectrum is the average one, all analyzed spectra proceeding from the same samples
should represent close and compact populations. Since it is not the case, in future,
better polishing of the sample should be performed and the resulting spectra should
proceed from a bigger number of samples in order to obtain a representative average
spectrum. Once again the IR ellipsometry is suggested as another approach in order to
investigate the source of the encountered differences.
There were no clear spectral differences between various remineralising mixtures. It
could suggest that the concentration of fluoride and ion did not change the dental tissue.
The only difference encountered for the mixture I could indicate that the fluoride
concentration was too small to initiate the remineralization process.
175
Supplemental material
Supplemental material 1 Test ANOVA within a confidence interval of 95% between zone 1 and
zone 2 of three analyzed teeth
Table 45. Test ANOVA performed on zone 1 and zone 2 when the average percentage of the area occupied by open tubules is considered.
Tooth F P-value
1 168,27 1,27E-35
2 22,56 2,65E-06
3 28,12 1,48E-07
F crit 3,85
Table 46. Test ANOVA performed on zone 1 and zone 2 when the average number of open tubules is considered.
Tooth F P-value
1 187,09 4,25E-39
2 24,33 1,1E-06
3 20,86 5,72E-06
F crit 3,85
Supplemental material 2 Evaluation of the statistical differences of variances derived from the results obtained in automatically computed analysis and semi-automatic ones performed by three independent
technician on 120 pictures randomly chosen (60 images after the demineralization and 60 images after the remineralising treatment), proceeding from the zone 1 of the teeth.
Table 47. Analysis of variance automatically computed analysis vs semi-automatic performed by three independent technicians when the percentage of area of open tubules after the demineralizing treatment is concerned.
ANOVA
Source of Variation SS df MS F P-value F crit
Between Groups 2,372485 3 0,790828 0,049796 0,985275 2,642851
Within Groups 3748,035 236 15,8815
Total 3750,408 239
176
Table 48. Technician / Tukey (HSD) / Analysis of the differences between the categories with a confidence interval of 95% for the percentage area of open tubules after the demineralizing treatment
Contrast Difference Standardized difference
Critical value
Pr > Diff Significant
Software vs Technician 1 0,263 0,362 2,587 0,984 No
Software vs Technician 3 0,188 0,258 2,587 0,994 No
Software vs Technician 2 0,089 0,123 2,587 0,999 No
Technician 2 vs Technician 1
0,174 0,239 2,587 0,995 No
Technician 2 vs Technician 3
0,098 0,135 2,587 0,999 No
Technician 3 vs Technician 1
0,076 0,104 2,587 1,000 No
Tukey's d critical value: 3,659
Table 49. Technician / Dunnett (two sided) / Analysis of the differences between the control category: software and the other categories with a confidence interval of 95% for the percentage area of open tubules after the demineralizing treatment
Category Difference
Standardized difference
Critical value
Critical difference
Pr > Diff
Significant
Software vs Technician 1
0,263 0,362 2,364 1,720 0,969 No
Software vs Technician 3
0,188 0,258 2,364 1,720 0,988 No
Software vs Technician 2
0,089 0,123 2,364 1,720 0,999 No
Table 50. Analysis of variance automatically computed analysis vs semi-automatic performed by three independent technicians when the number of tubules is concerned after the demineralizing treatment
Source of Variation
SS df MS F P-value F crit
Between Groups 510,4333 3 170,1444 0,109202 0,954665 2,642851
Within Groups 367703,3 236 1558,065
Total 368213,7 239
Table 51. Technician / Tukey (HSD) / Analysis of the differences between the categories with a confidence interval of 95% for the number of tubules after the demineralizing treatment
Contrast Difference
Standardized difference
Critical value
Pr > Diff
Significant
Software vs Technician 1 3,817 0,530 2,587 0,952 No
Software vs Technician 3 0,983 0,136 2,587 0,999 No
Software vs Technician 2 0,667 0,093 2,587 1,000 No
177
Technician 2 vs Technician 1
3,150 0,437 2,587 0,972 No
Technician 2 vs Technician 3
0,317 0,044 2,587 1,000 No
Technician 3 vs Technician 1
2,833 0,393 2,587 0,979 No
Tukey's d critical value: 3,659
Table 52. Technician / Dunnett (two sided) / Analysis of the differences between the control category: software and the other categories with a confidence interval of 95% for the number of tubules after the demineralizing treatment
Category Difference
Standardized difference
Critical value
Critical difference
Pr > Diff
Significant
Software vs Technician 1
3,817 0,530 2,364 17,039 0,913 No
Software vs Technician 3
0,983 0,136 2,364 17,039 0,998 No
Software vs Technician 2
0,667 0,093 2,364 17,039 0,999 No
Table 53. Analysis of variance automatically computed analysis vs semi-automatic performed by three independent technicians when the percentage of area of open tubules after the remineralising treatment is concerned.
ANOVA
Source of Variation SS df MS F P-value F crit
Between Groups 1,07901 3 0,35967 0,107329 0,955753 2,642851
Within Groups 790,8566 236 3,351087
Total 791,9357 239
Table 54. Technician / Tukey (HSD) / Analysis of the differences between the categories with a confidence interval of 95% for the percentage area of open tubules after the remineralizing treatment
Contrast Difference
Standardized difference
Critical value
Pr > Diff
Significant
Software vs Technician 3 0,180 0,540 2,587 0,949 No
Software vs Technician 1 0,106 0,317 2,587 0,989 No
Software vs Technician 2 0,050 0,150 2,587 0,999 No
Technician 2 vs Technician 3
0,130 0,390 2,587 0,980 No
Technician 2 vs Technician 1
0,056 0,166 2,587 0,998 No
Technician 1 vs Technician 3
0,075 0,223 2,587 0,996 No
Tukey's d critical value: 3,659
178
Table 55. Technician / Dunnett (two sided) / Analysis of the differences between the control category: software and the other categories with a confidence interval of 95% for the percentage area of open tubules after the remineralizing treatment
Category Difference
Standardized difference
Critical value
Critical difference
Pr > Diff
Significant
Software vs Technician 3
0,180 0,540 2,364 0,790 0,908 No
Software vs Technician 1
0,106 0,317 2,364 0,790 0,979 No
Software vs Technician 2
0,050 0,150 2,364 0,790 0,998 No
Table 56. Analysis of variance automatically computed analysis vs semi-automatic performed by three independent technicians when the number of open tubules after the remineralising treatment is concerned.
ANOVA
Source of Variation SS df MS F P-value F crit
Between Groups 205,3 3 68,43333 0,024171 0,994903 2,642851
Within Groups 668162,6 236 2831,198
Total 668367,9 239
Table 57. Technician / Tukey (HSD) / Analysis of the differences between the categories with a confidence interval of 95% for the number of open tubules after the remineralizing treatment
Contrast Difference Standardized difference
Critical value
Pr > Diff Significant
Software vs Technician 3 2,283 0,235 2,587 0,995 No
Software vs Technician 1 1,950 0,201 2,587 0,997 No
Software vs Technician 2 0,700 0,072 2,587 1,000 No
Technician 2 vs Technician 3
1,583 0,163 2,587 0,998 No
Technician 2 vs Technician 1
1,250 0,129 2,587 0,999 No
Technician 1 vs Technician 3
0,333 0,034 2,587 1,000 No
Tukey's d critical value: 3,659
Table 58. Technician / Dunnett (two sided) / Analysis of the differences between the control category: software and the other categories with a confidence interval of 95% for the number of open tubules after the remineralizing treatment
Category Difference
Standardized difference
Critical value
Critical differenc
e
Pr > Diff Significant
Software vs Technician 3
2,283 0,235 2,364 22,968 0,991 No
Software vs Technician 1
1,950 0,201 2,364 22,968 0,994 No
179
Software vs Technician 2
0,700 0,072 2,364 22,968 1,000 No
Supplemental material 3 Evaluation of the representation of the data analysed by 3 skilled technicians derived from the results obtained in semi-automatic analysis performed on 120 pictures randomly chosen
(60 images after the demineralization and 60 images after the remineralising treatment), proceeding from the zone 1 of the teeth.
Table 59. Results obtained after the desmineralising treatment