29
ADWEST MEDIA USAGE SURVEY 2013 HOW GEOGRAPHY IMPACTS LIFESTYLE, SHOPPING HABITS AND MEDIA USAGE Communities 100K+
| Date post: | 02-Jan-2016 |
| Category: |
Documents |
| Upload: | farrah-head |
| View: | 47 times |
| Download: | 0 times |

ADWEST MEDIA USAGE SURVEY
2013 HOW GEOGRAPHY IMPACTS LIFESTYLE, SHOPPING HABITS AND MEDIA USAGE
Communities 100K+

HOW GEOGRAPHY IMPACTS LIFESTYLE AND MEDIA USAGE ON THE PRAIRIES
STUDY OBJECTIVES:
1. To determine what impact ‘community’ has on the types of news and information that people are interested in and the sources they use to seek out that information.
2. To identify influences and factors that could play a role in how people in different types of communities access information.
3. Use the information to quantify the differences between populations living in rural areas and smaller communities against those living in larger cities and metropolitan areas.
4. How does media accessibility influence the sources people use to get information.
Communities 100K+

THE STUDY• Commissioned by AdWest Marketing Inc and conducted by Totum
Research Inc.
• Survey: 8-Page Mailed Questionnaire. Sample was selected by SM Research split into 1,000 random addresses within each of the 5 geographic groups for a total of 5,000 addresses in Alberta, Saskatchewan, Manitoba and Northwest Territories/Nunavut
• Communities: Under 5,000 Population and Rural• Communities: 5,000 to 10,000 Population• Communities: 10,000 to 50,000 Population• Communities: 50,000 to 100,000 Population• Communities: Over 100,000 Population
• Surveys addressed to the resident of the household 18 years of age or older and the next to celebrate a birthday in the household.
• Timing: Mid November 2013 – Mid January 2014
Communities 100K+

SAMPLE SIZES AND RESPONSE RATES
The maximum margin of error for 1,015 responses is ±3.1% at the 95% confidence level. For 200 responses it is ±6.9% at the 95% confidence level.
Communities 100K+

COMMUNITY ENGAGEMENT
Communities 100K+

2%6%
19%
17%45%
12%
Length of Time Lived in Your Community
Length of time in this community Less than 1 year 1 to 5 years 6 to 10 years 11 to 20 years
More than 20 years All your life
Respondents in medium-sized cities (50-100K) were less likely to have lived in the community their entire life than were respondents in smaller cities and rural areas
Communities 100K+
Totum Research November/December 2013: How Media Habits Vary by Community Size and Type, N=1,015

38%
60%
2% 1%
Do You Know the Names of Neighbours Who Live Close to You
Yes, know them all
Yes, know only some
No, don't know any
Do not have neighbours close by
Respondents in medium-sized cities were less likely to know the names of their
neighbours than were the respondents in smaller communities. This suggests that the interests and lifestyles of residents in
different community sizes vary
Communities 100K+
Totum Research November/December 2013: How Media Habits Vary by Community Size and Type, N=1,015

ENGAGEMENT WITH NEWS AND SOURCES OF NEWS
Communities 100K+

More time per day About the same amount of time Less time per day0%
10%
20%
30%
40%
50%
60%
70%
80%
90%
100%
29%
65%
6%
Time Personally Spent With News Compared to 2 Years Ago
Respondents in the 50-100K population sample group were more likely to be spending More Time per Day with the news than they did 2 years ago than any of the other community
sizes included in the study. Fully, 94% of re-spondents indicated that they spend at least the
same amount of time with the news.
Communities 100K+
Totum Research November/December 2013: How Media Habits Vary by Community Size and Type, N=1,015

Inte
rnat
iona
l New
s
Most o
f the
tim
e
Only
whe
n so
met
hing
is h
appe
ning
Seld
om o
r Nev
er
Not st
ated
Natio
nal N
ews
Most o
f the
tim
e
Only
whe
n so
met
hing
is h
appe
ning
Seld
om o
r Nev
er
Not st
ated
Loca
l New
s
Most o
f the
tim
e
Only
whe
n so
met
hing
is h
appe
ning
Seld
om o
r Nev
er
Not st
ated
0
10
20
30
40
50
60
70
80
90
100
47.9
36
10.45.8
64
27.1
7.11.8
66.9
26.9
4.1 2.1
How Closely Do You Follow Specific Types of News
Respondents were engaged with local news more than any other news type. They were also the least engaged with national and international news of the three
city sizes sampled
Communities 100K+
Totum Research November/December 2013: How Media Habits Vary by Community Size and Type, N=1,015

0%10%20%30%40%50%60%70%80%90%
100%
60%47%
65% 60%
10%20%
10% 6% 11%3%
21%10%
35%
Frequency of Media Use at Least Once Per Week
Traditional Media
As was the case in smaller communities, traditional
media was reported as the media most likely to be
referred to at least once per week for information about
the community
Communities 100K+
Totum Research November/December 2013: How Media Habits Vary by Community Size and Type, N=1,015

Blog
abou
t you
r loc
al com
mun
ity
Your
city
or t
own'
s web
site
Loca
l prin
ted
com
mun
ity n
ewsp
aper
Loca
l com
mun
ity n
ewsp
aper
web
site
Loca
l sto
re w
ebsite
Loca
l rad
io sta
tion
Socia
l med
ia e
.g. F
aceb
ook,
Twitt
er, M
yspa
ce e
tc.
Loca
l TV st
atio
n
Other
None
of th
e ab
ove
0%
10%
20%
30%
40%
50%
60%
70%
80%
90%
100%
1% 1%
20%
2% 1%
19%
2%
52%
1%6%
Favourite Source for Local News
As was the case across all community types, traditional media was entrenched as the
favourite source for local news and information. Large
cities were the only community type where
television was favoured over the local printed community
newspaper and radio
Communities 100K+
Totum Research November/December 2013: How Media Habits Vary by Community Size and Type, N=1,015

0%
10%
20%
30%
40%
50%
60%
70%
80%
90%
100%
14%19%
33%
4%
16%
6% 7%4%
20%
12%
19%
Sources Relied on For Information About Local Topics of Interest
City/Town Website
Printed Lo-cal Com-munity Newspaper
Daily Newspaper or its Web-site
Radio
TV
Store Website
Social Media
Other
Never Seek This Info
The Local Printed Community News-paper was listed as the #1 source for in-
formation on community or neigh-bourhood events. It was reported as one of the top sources for information on a variety of local topics of interest
Communities 100K+
Totum Research November/December 2013: How Media Habits Vary by Community Size and Type, N=1,015
Communities 100K+
Totum Research November/December 2013: How Media Habits Vary by Community Size and Type, N=1,015
Fede
ral P
oliti
cs, C
ampa
igns
and
Pro
gram
s
Prov
incial
Pol
itics
, Cam
paig
ns a
nd P
rogr
ams
Loca
l Pol
itics
, Cam
paig
ns a
nd P
rogr
ams
Health
Info
rmat
ion
and
Serv
ices
Taxe
s an
d Ta
x Issu
es
Build
ing,
Dev
elop
men
t and
Zon
ing
Social
Ser
vice
s, H
ousing
, Foo
d, C
hild
Car
e
Publ
ic N
otices
Oth
er Fed
eral
Gov
ernm
ent A
ctiv
ities
Oth
er P
rovi
ncia
l Gov
ernm
ent A
ctiv
ities
Oth
er Loc
al G
over
nmen
t Act
iviti
es0%
10%
20%
30%
40%
50%
60%
70%
80%
90%
100%
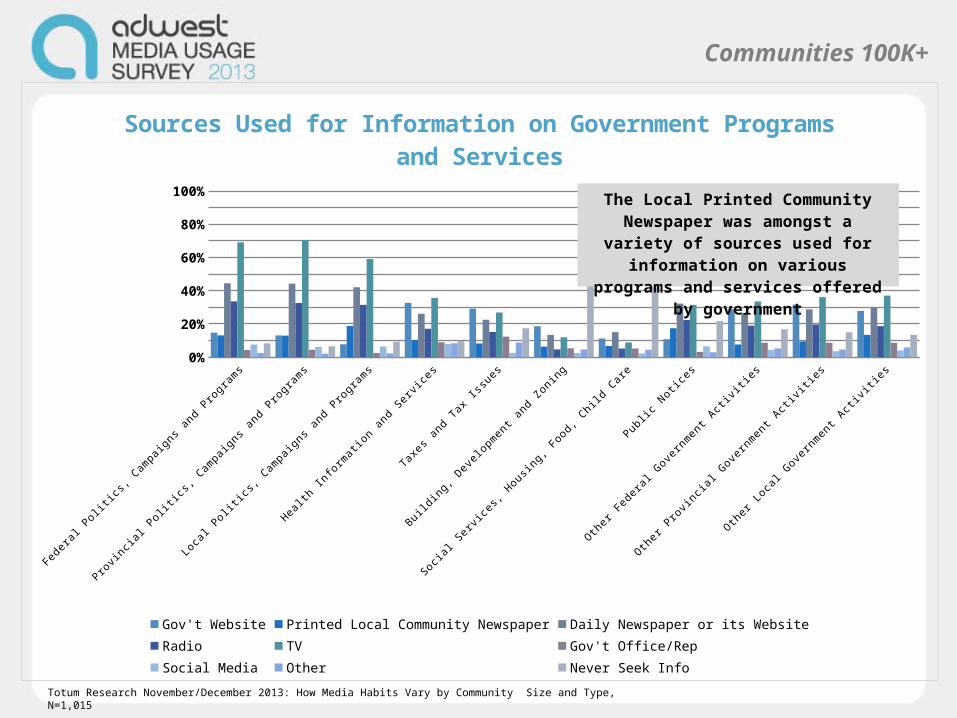
Sources Used for Information on Government Programs and Services
Gov't Website Printed Local Community Newspaper Daily Newspaper or its WebsiteRadio TV Gov't Office/RepSocial Media Other Never Seek Info
The Local Printed Community Newspaper was amongst a vari-ety of sources used for informa-
tion on various programs and services offered by government

0%
10%
20%
30%
40%
50%
60%
70%
80%
90%
100%
23% 20%
6% 8%
32%
11%
35%
16%
5% 6%
Statements Regarding Media Engagement, Connection and Sharing
City/Town Website Printed Local Community Newspaper Daily Newspaper or its Website Radio TV Store Website
Social Media None of Them
Ads in the Print Media are the best source to find advertising for local stores and services according to
respondents in cities with 100K+ population. Re-spondents in large cities were far more engaged with
social media than those living in any of the smaller communities sampled
Communities 100K+
Totum Research November/December 2013: How Media Habits Vary by Community Size and Type, N=1,015

ONLINE ACCESSIBILITY, ENGAGEMENT AND USE
Communities 100K+

Dial-u
p te
leph
one
line
DSL-e
nabl
ed p
hone
line
Cable
TV m
odem
Cellu
lar o
r mob
ile con
nect
ion
Fibre
opt
ic co
nnec
tion
e.g.
FIO
S, T
-1 e
tc.
Sate
llite
Don't
know
whi
ch con
nect
ion
we ha
ve
Don't
have
inte
rnet
con
nect
ion
Not st
ated
0%
10%
20%
30%
40%
50%
60%
70%
80%
90%
100%
9%
23%
48%
25%
6% 6%
5%
10%
4%
Internet Connectivity: Internet Connections You Have at Home
Like respondents of medium-sized and small cities, residents living in cities with population of
100K+ were more likely to have a high-speed internet
connection than those living in towns and rural areas.
Cable TV modems were used by nearly half of
respondents
Communities 100K+
Totum Research November/December 2013: How Media Habits Vary by Community Size and Type, N=1,015

Net: A
ny a
ctivity
Beca
me
awar
e of
a p
rodu
ct o
r ser
vice
Clicke
d on
the
ad to
lear
n m
ore
Used
an o
nlin
e se
arch
to le
arn
mor
e ab
out t
he p
rodu
ct o
r ser
vice
Boug
ht som
ethi
ng a
s ad
vertise
d
Refe
rred
the
ad to
som
eone
you
kno
w
Visit
ed a
sto
re o
r a sho
wro
om
I gen
erally ig
nore
ads
that
app
ear o
n web
sites
I do
not h
ave/
use
a co
mpu
ter o
r tab
let
0%10%20%30%40%50%60%70%80%90%
100%
55%
34% 31%42%
15%8%
16%
38%
16%
Activities Taken in the Past 30 Days as a Re-sult of Seeing an Advertisement on a Website
Just over half of respondents (55%) in large cities undertook Any Activity based on seeing an ad on a website. Respondents in this group were more likely than
those in any other community size to click on an ad to learn
more about the product or service
Communities 100K+
Totum Research November/December 2013: How Media Habits Vary by Community Size and Type, N=1,015

22%
56%
22%
Mobile/Tablet Use: Have 'Apps' That Help You Get In-formation About the Local Community
Yes
No
Do not have a cell phone or tablet computer
78% of respondents in large cities don’t use ‘apps’ to get information about the local community. 22% said it’s because they do not own an app-compatible cell
phone or a tablet computer
Communities 100K+
Totum Research November/December 2013: How Media Habits Vary by Community Size and Type, N=1,015

38%
61%
2%
Cellular Phone Use: Use of Device
Use cell phone only to make or receive phone calls
Also use it for other things
Not stated
Of cell phone owners in communities 100K+, 38% of respondents indicated that they used their device for making
and receiving phone calls only. The re-spondents in this group were the least likely of all the city groups to use their
device for other things
Communities 100K+
Totum Research November/December 2013: How Media Habits Vary by Community Size and Type, N=1,015

0%
10%
20%
30%
40%
50%
60%
70%
80%
90%
100%
0%
42%35%
25%20%
18%
32%
62%
47%
23%
31%
Mobile/Tablet Owners: Purposes for Which You Ever Use Your Device
As was the case across all community sizes the #1 other use for a mobile device was to check
local weather reports
Less than half said they used the device to get information
about the community
Nearly 50% of respondents used their device for
information on local bars and restaurants
Communities 100K+
Totum Research November/December 2013: How Media Habits Vary by Community Size and Type, N=1,015

COMMUNITY NEWSPAPER ENGAGEMENT
Communities 50K to 100K
0%
10%
20%
30%
40%
50%
60%
70%
80%
90%
100%
29.6
38
67.6
30.6
2.9
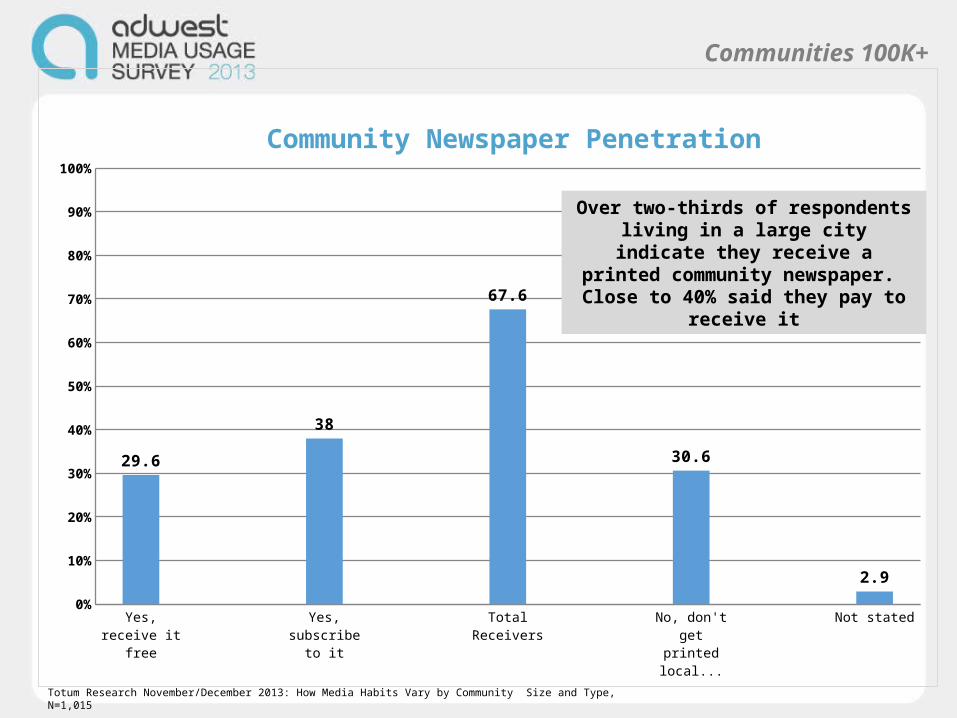
Community Newspaper Penetration
Over two-thirds of respondents living in a large city indicate
they receive a printed community newspaper. Close to 40% said they pay to receive it
Communities 100K+
Totum Research November/December 2013: How Media Habits Vary by Community Size and Type, N=1,015

More time About the same amount of time Less time0%
10%
20%
30%
40%
50%
60%
70%
80%
90%
100%
10%
74%
16%
Time Personally Spent With Local Printed Community Newspaper Compared to 2 Years
Ago
Community newspaper engagement is very
strong in this sample group. 84% of
respondents said they spend at least the same
amount of time with their community newspaper as
they did 2 years ago
Communities 100K+
Totum Research November/December 2013: How Media Habits Vary by Community Size and Type, N=1,015

13%
36%
31%
4%
2% 14%
Level of Agreement: My Local Newspaper is a Source of Pride for the Community
Agree strongly
Agree somewhat
Neutral
Disagree somewhat
Disagree strongly
Do not receive a local printed community newspaper
Nearly half of respondents agree either strongly or somewhat that the Local News-paper is a Source of Pride for their commu-
nity
Communities 100K+
Totum Research November/December 2013: How Media Habits Vary by Community Size and Type, N=1,015

13%
44%16%
8%
4%15%
Level of Agreement: I Get Most of the Informa-tion About Activities in my Community From the
Local Newspaper
Agree strongly
Agree somewhat
Neutral
Disagree somewhat
Disagree strongly
Do not receive a local printed community newspaper
The majority of respondents in cities of more than 100,000 population agreed either strongly or somewhat that they Get Most of the Informa-tion About Activities in Their Community from
the Local Newspaper
Communities 100K+
Totum Research November/December 2013: How Media Habits Vary by Community Size and Type, N=1,015

48%
20%
12%
4%
7% 9%
Level of Agreement: I Would Much Rather my Local Newspaper Remain in Printed Form as Op-
posed to Online Only
Agree strongly
Agree somewhat
Neutral
Disagree somewhat
Disagree strongly
Do not receive a local printed community newspaper
As was the case across all community sizes sampled, respondents clearly preferred that their local community newspaper remain in
printed form
Communities 100K+
Totum Research November/December 2013: How Media Habits Vary by Community Size and Type, N=1,015

12%
28%
24%
13%
12%11%
Level of Agreement: If I Miss an Issue of the Local Newspaper I Feel I am Missing Information That is
Important to MeAgree strongly
Agree somewhat
Neutral
Disagree somewhat
Disagree strongly
Do not receive a local printed community newspaper
40% of respondents in large cities agreed that if they missed an issue of the local newspaper, they felt like they were missing important in-
formation
Communities 100K+
Totum Research November/December 2013: How Media Habits Vary by Community Size and Type, N=1,015

33%
39%
22% 5%
Level of Agreement: Impact That Losing the Local Newspaper Would Have on Your Ability to Keep
up With Information About the Community
Losing the local community newspaper would have:
A MAJOR impact
A MINOR impact
NO impact at all
Have no local community news-paper
While slightly less than was the case in medium-sized cities, 72% of respondents said they’d feel
some impact on their ability to keep up with infor-mation about the local community if they no longer
had a community newspaper
Communities 100K+
Totum Research November/December 2013: How Media Habits Vary by Community Size and Type, N=1,015


