82


(Ae 'Ymuh/i /<HIA <:/
<&; ommtSi toner [fynance
The Municipality of Metropolitan Toronto,
185 Bloor Street East, Toronto 5, Ontario, Canada.

Vv.^'tioO% t;buca*lr ■ *

A\ T 0 >? "61> ■ Tr&txory /// /
Government
Publication*
THE
MUNICIPALITY OF
METROPOLITAN TORONTO CANADA
ANNUAL REPORT OF THE
COMMISSIONER OF FINANCE
1956

9
OFFICIAL SEAL OF
THE MUNICIPALITY OF METROPOLITAN TORONTO
EXPLANATION
Winged Cogwheel—Represents Industry.
Open Books—Stand for Education.
The Imperial Crown—Commemorates Coronation Year of Her Majesty
Queen Elizabeth II, in which year the Municipality was incorporated.
The Chevron—One of the well-known heraldic ordinaries derived from the
gable of a house—suggests housing.
The Caduceus or Staff of Mercury, The Roman God of Commerce.
CC‘7A.S4
<*.M. SI

3 n ov^rnTIfnl
Publication*
FREDERICK G. GARDINER, B.A., Q.C.
Chairman—Metropolitan Council
Reeve of the Village of Forest Hill - - 1938-1949
Warden of the County of York ... 1946
Appointed Chairman of the Metropolitan Toronto Council
on April 15th, 1953 by the Lieutenant-Governor in Council.
Elected Chairman by the Metropolitan Council for 1955,
Re-elcctcd 1956 and 1957.

4
G. ARTHUR LASCELLES
Commissioner of Finance and Treasurer
Entered Civic Service, City of Toronto (Treasury Department), April 1, 1913. Appointed Commissioner of Finance and Treasurer,
October 1,1941.
Appointed Commissioner of Finance and Treasurer of The
Municipality of Metropolitan Toronto, May 26, 1953.

5
INDEX
Administration—general
Area.
Assessment.
Balance Sheets—
The Municipality of Metropolitan Toronto:
Capital and Loan Fund
Pension Fund.
Revenue Fund
Sinking Fund
Trust Fund.
The Metropolitan School Board:
Capital
Revenue Fund
Waterworks (Current and Capital)
Auditor’s Certificate
Capital Expenditures.
Comments of Commissioner of Finance
Council (Metropolitan).
Debenture Debt
Department Heads
Education
Expenditures 1956 (Current)
1 lealth
Levy—Metropolitan
General.
Education.
Map—Metropolitan Area
Park cs Photographs
Population.
Protection to Persons and Property (Police, Courts, etc.)
Provincial Government Grants
Revenues 1956 (Current).
Roads.
Sinking Funds re Debenture Debt .
Seal.
School Board (Metropolitan).
Sewage System.
Statistics—Metropolitan Area.
Surplus:
General.
Education.
Sinking Fund.
Waterworks.
Tax Levies and Collections—Area Municipalities
Toronto Transit Commission
Gray Coach Lines.
Unclassified Expenditures (Civil Defence, etc.).
Waterworks. .
Welfare .
PAGES 17
73 60, 73
34
43
36
40
39
47
48
44
. 33
28, 61
11-29
6 23, 67-72
7
12, 18, 47-50
12, 52-55
13 60
17
18
8
16
8, 9, 30, 31, 32, 51, 66.
73, 74
14
12, 17
12, 56-59
13
27, 40-42
2
18, 47-50
14
10
17,38
19, 50
41
20, 46
75, 76
20, 62
23, 64
16
12, 19, 44-46
13

6
METROPOLITAN COUNCIL—1956
CHAIRMAN
FREDERICK G. GARDINER, Q.C.
REPRESENTATIVES
CITY OF TORONTO
MAYOR NATHAN PHILLIPS, Q.C.
CONTROLLER FORD G. BRAND
CONTROLLER F. JOSEPH CORNISH, Q.C.
ALDERMAN KENNETH G. WATERS Wan
ALDERMAN WILLIAM DENNISON War.
ALDERMAN ROSS D. PARRY Wan
SUBURBAN
REEVE HARRY G. SIMPSON .
REEVE W. BEVERLEY LEWIS .
REEVE LAURIE T. SIMONSKY (a)
MAYOR CHARLES H. HISCOTT
REEVE (MRS.) MARIE CURTIS
MAYOR W. A. EDWARDS
MAYOR D. R. RUSSELL ....
REEVE FREDERICK J. McMAHON, Q.C
REEVE AUGUSTUS HARRIS .
REEVE (MRS.) DOROTHY HAGUE .
MAYOR HARRY CLARK ....
ACTING REEVE CHRIS. A. TONKS (b)
EXECUTIVE COMMITTEE
FREDERICK G. GARDINER. Q.C., Chairman
NATHAN PHILLIPS, Q.C. FORD G. BRAND
(MRS.) MARIE CURTIS (c) F. J. McMAHON, Q.C.
(a) Elected Reeve by acclamation May 4, 1956, Vice Charles O. Bick—resigned. (b) Appointed Acting Reeve by Township Council August 27, 1956. Vice Fred W. Hall—resigned. (c) Elected by Metropolitan Council May 1, 1956, as member of the Executive Committee. Vice Charles O. Bick—
resigned.
ALDERMAN HERBERT ORLIFFE Ward 4
ALDERMAN PHILIP G. GIVENS Ward 5
ALDERMAN (MRS.) MAY ROBINSON W ard 6
1 ALDERMAN WILLIAM C. DAVIDSON, Q.C. Ward 7
2 ALDERMAN DONALD D. SUMMERVILLE Ward 8
5 ALDERMAN (MRS.) JEAN D. NEWMAN Ward 9
Township of East York
Township of Etobicoke
Village of Forest Hill
Town of Leaside
Village of Long Branch
Town of Mimico
Town of New Toronto
Township of North York
Township of Scarborough
Village of Swansea
Town of Weston
Township of York

7
HEADS OF DEPARTMENTS—1956
(a) LESLIE B. ALLAN, B.A.Sc., P.Eng. Commissioner of Roads
S. CASS, B.A.Sc., P.Eng. . Traffic Engineer
F. D. CAVILL. Director of Property
(b) ROSS L. CLARK, B.A.Sc., P.Eng. . Commissioner of Works
WILBERT W. GARDHOUSE . Clerk
GEORGE H. GLENNIE, B.A., E.C.A. Auditor
A. J. B. GRAY . Assessment Commissioner
G. ARTHUR LASCELLES . Commissioner of Finance and Treasurer
J. A. R. MASON, Q.C. . Commissioner and Co-ordinating Officer
of the Court of Revision
C. FRANK MOORE, Q.C. . Solicitor
G. W. NOBLE. Personnel Officer
R. J. SMITH . Commissioner of Welfare and Housing
T. W. THOMPSON, B.S.A. . Parks Commissioner
(a) Leslie B. Allan, B.A.Sc., P.Eng., appointed Commissioner of Roads, July 16, 1956; was Commissioner of Roads and Works, January 1 to July 15, 1956.
(b) Ross L. Clark, B.A.S.c., P.Eng., appointed Commissioner of Works, July 16, 1956.

MUNICIPALITIES FORMING METROPOLITAN TORONTO
(Showing years of Incorporation)
LAKE ONTARIO
DOWNTOWN TORONTO SKYLINE

9
METROPOLITAN TORONTO JUVENILE AND FAMILY COURT
(Approximate Cost, $1,900,000—Officially Opened, June 1957)

10
PRINCIPAL STATISTICS
OF
METROPOLITAN TORONTO
Population (1956 Census of Canada). 1,358,028
Area. 240 sq. miles
Assessment:. $3,183,122,850
Industrial, Commercial, etc. $1,412,242,925
Residential. 1,770,879,925
Building Permits—1956:
Number. 20,801
Value. $534,656,000
Schools (Public and Secondary). 330
Paved Roads:. 1,294 miles
Metropolitan. 281 miles
Area Municipalities. 1,013 miles
Streetcar and Subway Track and Bus Routes. 470 miles
Motor Vehicle Registrations—1956. 429,322
Sewers:. 2,216 miles
Metropolitan. 68 miles
Area Municipalities. 2,148 miles
Watermains:. 2,098 miles
Metropolitan. 137 miles
Area Municipalities. 1,961 miles
Water Consumption—1956. 52,755,563,000 gallons
Telephone Installations. 640,000
Manufacturing Establishments:
Number. 4,685
Number of Employees. 200,352
Bank Clearings—1956. $5,525,000,000
Stock Exchange—Average Number of Shares Traded Daily, 1956. 5,389,309
Harbour Cargo Tonnage—1956. 5,500,000

ANNUAL REPORT
OF THE
Government
Publication*
COMMISSIONER OF FINANCE
THE MUNICIPALITY OF METROPOLITAN TORONTO
1956
Mr. Frederick G. Gardiner, Q.C., Chairman, Toronto, September 27, 1957.
and Members of the Council of
The Municipality of Metropolitan Toronto,
Toronto, Ontario.
Ladies and Gentlemen:
I am pleased to submit the Annual Report on the financial affairs of The Municipality of
Metropolitan Toronto for the year ended December 31, 1956.
The Municipality of Metropolitan Toronto Act, 1953 (Statutes of the Province of Ontario,
2 Elizabeth II, Chap. 73), provided for the federation of the Municipalities in the Toronto Metro¬
politan Area for certain financial and other purposes. By this Act the inhabitants of the following
Municipalities were constituted a body corporate, under the name of “The Municipality of Metropolitan
Toronto”:
City of
Township of East York
Township of Etobicoke
Village of Forest Hill
Town of Leaside
Village of Long Branch
Town of Mimico
Toronto
Town of New Toronto
Township of North York
Township of Scarborough
Village of Swansea
Town of Weston
Township of York
The above Municipalities are referred to in this report as the “Area Municipalities” and The
Municipality of Metropolitan Toronto as the “Metropolitan Corporation”.
In previous Reports the administrative organization, functions and powers of the Metropoltan
Corporation, The Metropolitan School Board and the Toronto Transit Commission (as set out in
The Municipality of Metropolitan Toronto, Act, 1953) were described in considerable detail. In
this Report such information in this regard is given only to the extent required to provide a proper
understanding of 1956 operations; but special reference is made to significant extensions of responsi¬
bilities and powers which have come into effect in 1956 through amendments to the Act.
12
REVENUES AND EXPENDITURES
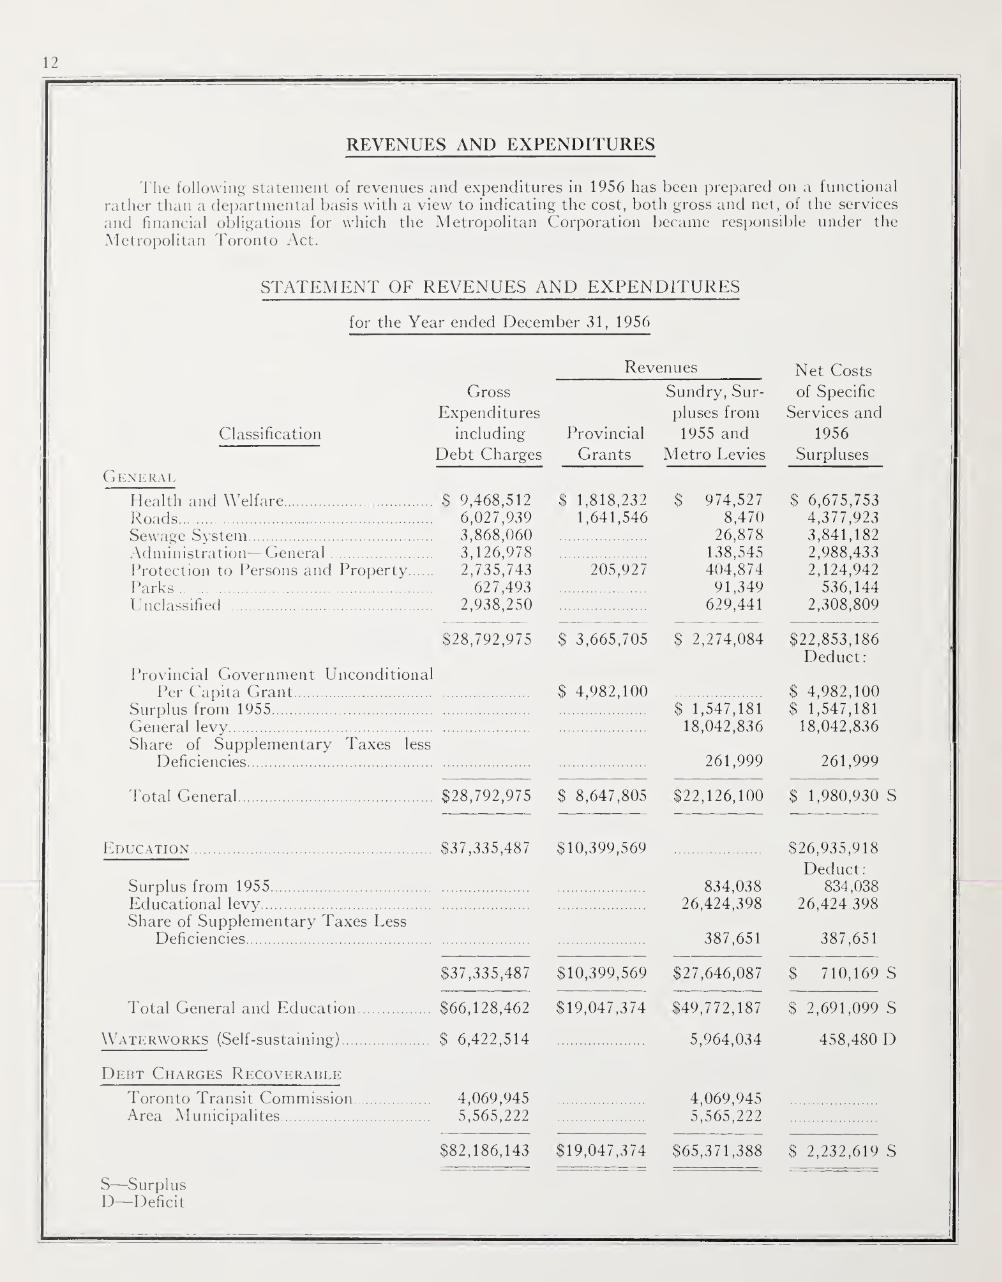
The following statement of revenues and expenditures in 1956 has been prepared on a functional rather than a departmental basis with a view to indicating the cost, both gross and net, of the services and financial obligations for which the Metropolitan Corporation 1 )ecame responsible under the Metropolitan Toronto Act.
STATEMENT OF REVENUES AND EXPENDITURES
for the Year ended December 31, 1956
Revenues Net Costs
Gross Sundry, Sur- of Specific
Expenditures pluses from Services and
Classification including Provincial 1955 and 1956
Debt Charges Grants Metro Levies Surpluses
General
Health and Welfare. $ 9,468,512 $ 1,818,232 $ 974,527 $ 6,675,753 Roads. 6,027,939 1,641,546 8,470 4,377,923 Sewage System. 3,868,060 26,878 3,841,182 Administration—General. 3,126,978 138,545 2,988,433 Protection to Persons and Property. 2,735,743 205,927 404,874 2,124,942 Parks. 627,493 91,349 536,144 Unclassified. 2,938,250 629,441 2,308,809
$28,792,975 $ 3,665,705 $ 2,274,084 $22,853,186 Deduct:
Provincial Government Unconditional Per Capita Grant. $ 4,982,100 $ 4,982,100
Surplus from 1955. $ 1,547,181 $ 1,547,181 General levy. 18,042,836 18,042,836 Share of Supplementary Taxes less
Deficiencies. 261,999 261,999
Total General. $28,792,975 $ 8,647,805 $22,126,100 $ 1,980,930 S
Education. $37,335,487 $10,399,569 $26,935,918
Deduct: Surplus from 1955. 834,038 834,038 Educational levy. 26,424,398 26,424 398 Share of Supplementary Taxes Less
Deficiencies. 387,651 387,651
$37,335,487 $10,399,569 $27,646,087 $ 710,169 S
Total General and Education. $66,128,462 $19,047,374 $49,772,187 $ 2,691,099 S
Waterworks (Self-sustaining). $ 6,422,514 5,964,034 458,480 D
Debt Charges Recoverable
Toronto Transit Commission. 4,069,945 4,069,945 Area Municipalites. 5,565,222 5,565,222
$82,186,143 $19,047,374 $65,371,388 $ 2,232,619 S
S—Surplus D—Deficit
. |

13
Health and Welfare (See Pages 52 and 56)
Though the term Health has been adopted as part of the caption for the classification of expendi¬
tures herein, it should be noted that as a Metropolitan function it refers generally to hospitalization,
rather than Public Health services, such as medical and dental services, public health nursing, food
inspection, etc., which remain the responsibility of the Area Municipalities.
Approximately 50% of hospitalization net expenditures in 1956 of $4,020,041 was a statutory
obligation with respect to indigent patients. The balance was made up of grants to hospitals of
$1,937,901 ($990,901 on account of operating deficits and $947,000 as aid in building construction)
and administrative costs of $66,457. Grants on account of operating deficits include a grant to the
City of Toronto to cover the 1955 deficit with respect to the Riverdale Isolation Hospital. On
January 1, 1957, this hospital became vested in the Metropolitan Corporation under the Corporation’s
authority to establish and operate a public hospital and an isolation hospital. Extensive alterations
and renovations now in progress will be completed in 1958.
Payments to Children’s Aid Societies amounted to $2,647,682 of which $2,420,873 represented
payments in accordance with statutory requirements. This cost was abated by recoveries of $44,137
from parents and grants of $1,029,463 from the Provincial Government based upon 40% of the net
expenditure established in accordance with the statutory rate. By amendment in 1957 to The Child
Welfare Act, 1954, the grants payable by the Provincial Government were increased from 25% to
40% effective January 1, 1956.
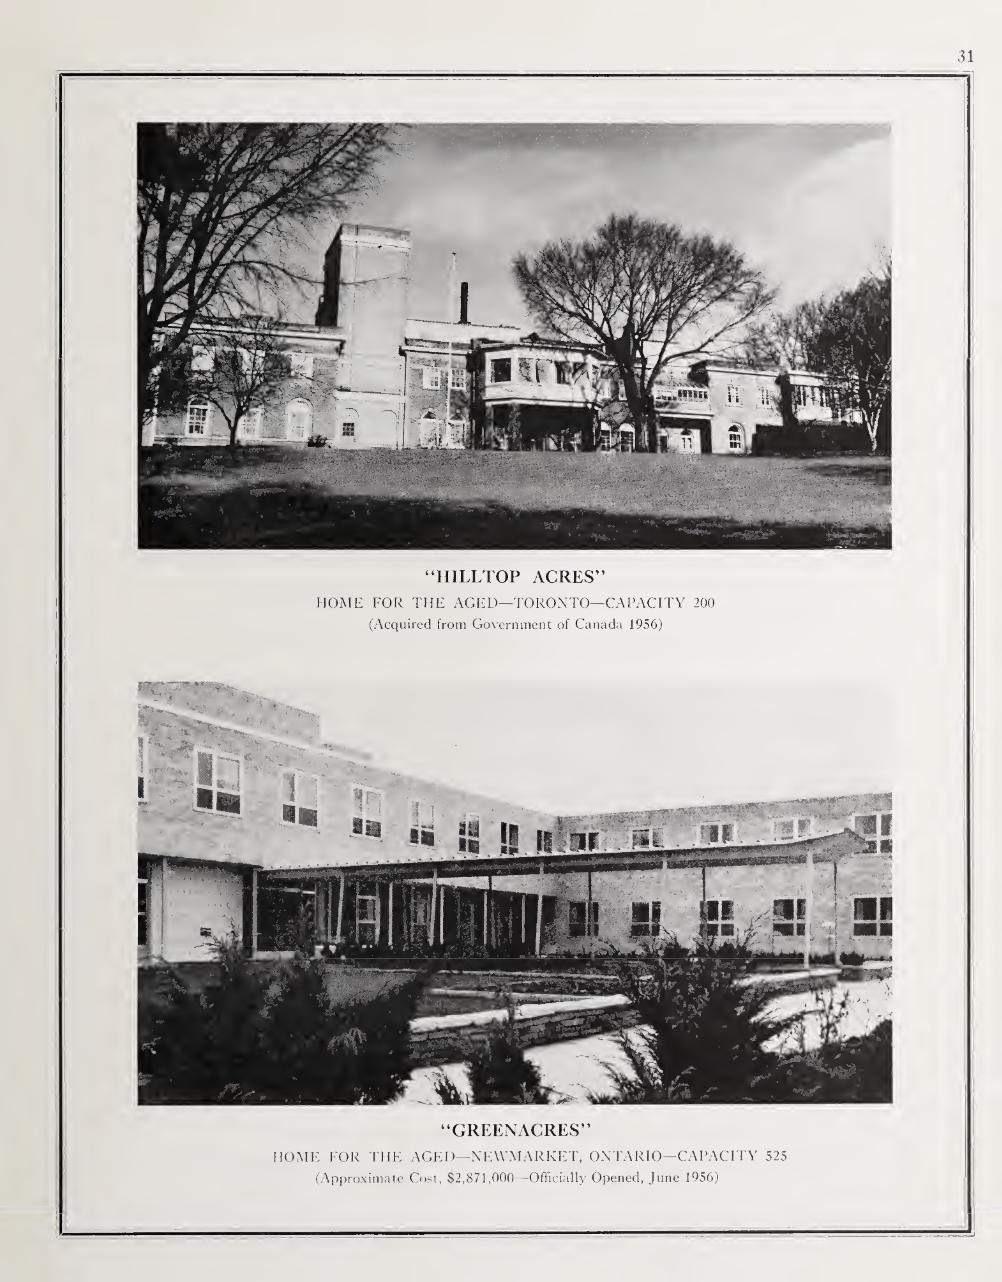
The Metropolitan Corporation is statutorily required to erect and maintain Homes for the Aged
and is empowered to do so either within or outside the Metropolitan Area. The gross expenditure
on this account in 1956 amounted to $2,099,950. After recoveries of $459,463 from residents, $63,052
sundry revenues and $788,769 from Provincial Government Grants, the Metropolitan Corporation
was responsible for raising $788,666 by levy against the Area Municipalities. During 1956 the Metro¬
politan Corporation operated three Homes for the Aged, viz., “Lambert Lodge’’ and “Hilltop Acres’’
in the City of Toronto and “Greenacres” located at Newmarket, Ontario. These homes have a total
capacity of approximately 1,485. In addition, sites have been acquired for three more homes each
having a capacity of 250. Tenders for the first of these will probably be called in the fall of 1957.
Under the auspices of the Metropolitan Toronto Housing Company Limited, formed in 1954, the
Westacres apartments in Etobicoke for the housing of elderly persons were completed and rented in
1957. A similar project has been started in North York and by December 31, 1957, should be partly
built and occupied. These projects are subsidized by the Metropolitan Corporation with respect to
taxes only.
Roads (See Pages 52 and 56)
The Metropolitan Corporation is responsible only for roads designated as part of the Metropolitan
Roads System and generally speaking these roads are major traffic arteries.
Current expenditures in 1956 amounted to $6,027,939 of which $4,279,160 was for maintenance
and $1,748,779 for principal and interest charges with respect to assumed and new debenture debt.
It may be noted that the maintenance expenditures of $4,279,160 include $52,769 for items of a
capital nature and $409,686 for the Corporation’s share of operating costs of the Toronto and York
Roads Commission, (25% of the construction and maintenance costs of County Roads, and a portion
of administrative expenses).
The Provincial Grant of $1,641,546 represents 50% of approved maintenance expenditures on
roads. Such approved expenditures exclude the Corporation’s share of County Roads, cleaning
costs and certain administrative expenses.

14
Capital expenditures on all roads projects in 1956 were $15,567,954 of which recoveries (chiefly
from the Provincial Government) amounted to $8,623,132. In order to complete works now in
progress it is estimated that future capital expenditures of $96,900,000 will be required of which
approximately $48,450,000 will be recovered by way of Provincial Government subsidy. These
works include the Lakeshore Expressway, Don Valley Parkway, Lawrence Avenue East Extension,
Dundas Street West Widening (including Overpass at Royal York Road), Queen Street West Extension
and Eglinton Avenue East Extension.
Sewage System (See Pages 53 and 56)
The Metropolitan Corporation is responsible for the operation of all permanent sewage treatment
plants and the necessary trunk sewers for the collection and disposal of sewage. Current expenditures
on this account amounted to $3,868,060 in 1956 of which $2,108,622 was for ordinary operating costs
and $1,759,438 was for principal and interest charges with respect to assumed and new debenture debt.
Capital expenditures in 1956 amounted to $4,554,953 and in order to complete works now in
progress it is estimated that future capital expenditures of $52,800,000 will be required. Two major
projects provided for therein are:
(a) Main Sewage Treatment Plant Enlargement—On completion, plant will have capacity of
120,000,000 gallons per day and permit removal of 95% of solids, as compared with present
capacity of 84,000,000 gallons per day and removal of 55% of solids.
(b) Humber Sewage Treatment Plant—The initial plant will have a capacity of 50,000,000
gallons per day and the ultimate plant a capacity of 100,000,000 gallons per day. Provision
is being made for the removal of 95% of solids.
Included in this estimate is a considerable amount for the construction of major sanitary trunk sewers
embracing eight feet six inch diameter tunnels as well as various other conduits ranging down to four
feet.
In addition to the above it is estimated that approximately $12,393,000 will be spent on plants,
trunk sewers and other sewage facilities now in the course of construction which will be financed in
the main by charges against the subdividers of residential and industrial lands. Major items in this
category are:
(a) Extension of the Highland Creek Sewage Treatment Plant to double its present capacity.
This plant, having a capacity of 4,000,000 gallons per day and providing for removal of 95%
of solids, commenced operations in 1957.
(b) Construction of the East Don Trunk Sewer, extending for approximately 6.5 miles and
embodying conduits ranging from 8 feet to 4 feet, due to be completed by 1959.
Protection to Persons and Property (See Pages 53 and 57)
Under this section are included Police, Licensing, Magistrates’ Courts, Administration of Justice,
Registry Offices, Traffic Control and Air Pollution Control. By amendment to the Metropolitan
1 oronto Act, 1955, the Corporation was empowered to establish on January 1, 1956, an Air Pollution
Control Division.

15
By a further amendment in 1956, the Metropolitan Corporation assumed the following
responsibilities:
(a) Police administration as at January 1, 1957, under a new Metropolitan Board of Commis¬
sioners of Police.
(b) Costs of providing accommodation, maintenance, equipment and supplies for Magistrates’
Courts from January 1, 1957. The fines and penalties imposed by such Courts became
revenues of the Metropolitan Corporation on that date.
(c) Licensing, generally, as at January 1, 1957, under a new Metropolitan Licensing Commission
and receives the relative revenues.
Though these functions were not assumed until January 1, 1957, the Board of Commissioners of
Police and the Licensing Commission were established in 1956, and certain organizational expenses,
including items of a capital nature, were incurred with respect to all three functions in 1956.
Expenditures in 1956 for Protection to Persons and Property were as follows:
Police—Sundry organizational expenses. S 92,241
36,779
65,438
507,279
290,349
550,989
81,957
338,426
558,339
96,483
117,463
$2,735,743
In abatement of the above expenses, the Metropolitan Corporation received $205,927 from the
Provincial Government, chiefly admittable maintenance costs of prisoners charged under the Criminal
Code but also on account of Crown Witnesses’ and Coroners’ Fees. Other revenues amounted to
$404,874, including $331,509 received by way of surplus fees and the County’s share of expenses of the
Licensing—Sundry organizational expenses.
Magistrates’ Courts—Acquisition of portion of Building:
Sundry expenses.
General Courts and Inquests—Provision of accommodation; fees re
witnesses, jurors, sheriffs and coroners; conveyance of prisoners,
etc.
Juvenile and Family Courts (including Children’s Observation Home)
—Provision of accommodation and salaries (including judges’).. .
Jail—Full cost of operation and maintenance of Toronto Jail vested in
Metropolitan Corporation under Act.
Boys’ and Girls’ Training Schools—Statutory per diem payments
toward maintenance and education.
Registry Office Buildings—Maintenance and operating costs; payment
on account of addition to registry office building (Richmond Street)
Traffic Control—Maintenance of Traffic signals, markings and signs,
etc., re Metropolitan Roads.
Air Pollution Control—Cost of enforcing smoke abatement regulations;
organizing divisions and training staff for full Air Pollution Control
Operations.
Debenture Debt Charges re new Juvenile and Family Court building
and Jail Extension.

16
Registry and Land Titles Offices, $8,607 from Court Fines and Fees, $22,443 from the County of York
(share of Administration of Justice expenses) and $24,384 from the Area Municipalities (use of Jail
for lock-up purposes).
In order to complete works now in progress it is estimated that future capital expenditures of
$2,276,000 will be required. These works include extensions to the Metropolitan Toronto Jail, New
Juvenile and Family Court and additional Police Stations in the Toronto Metropolitan Area. The
Provincial Government has agreed to contribute one-half of the cost of Jail extensions up to a
maximum contribution of $1,000,000.00.
Parks (See pages 54 and 58)
Metropolitan park lands at present approximate 875 acres and include the Toronto Islands,
Don Valley Golf Course (opened August, 1956), and the Riverdale Zoo. The assumption of the
Island lands by the Metropolitan Corporation is subject to the expiry or purchase of existing leases.
Current expenditures in 1956 amounted to $627,493 of which $451,309 was for maintenance
and $176,184 for principal and interest charges with respect to assumed and new debenture debt. It
may be noted that the maintenance expenditure of $451,309 included $109,979 for items of a capital
nature.
Capital expenditures in 1956 amounted to $1,799,110 of which recoveries amounted to $228,858.
Of the recoveries $171,199 was received from the Federal and Provincial Governments in respect of
acquisition of properties for demolition in the flood danger areas.
LJnclassified (See Pages 54 and 58)
Expenditures and revenues dealt with under this heading for various reasons cannot be grouped
for broad functional classification. In 1956 there were three principal items in this category, namely,
a grant made by the Metropolitan Corporation to the Toronto Transit Commission, the Metro¬
politan Corporation’s cost with respect to the Civil Defence Organization and the cost of temporary
financing.
The Corporation, under authority given by amendment to the “Metropolitan Toronto Act” in
1956, made a grant of $2,300,000 to the Toronto Transit Commission on account of losses incurred
by the Commission during the extension and re-organization of the system in 1954 and 1955.
Operations in 1956 resulted in a surplus and further enabling legislation in this regard was not required.
The Metropolitan Toronto Civil Defence Organization, formed April 1, 1955, was considerably
expanded during 1956. Expenditures in this connection for 1956 amounted to $194,365 of which
$151,519 was recovered from the Federal and Provincial Governments.
Financial items amounted to $443,885. This amount represents mainly the cost of temporarily
financing current expenditures pending payments from the Area Municipalities on account of the
Metropolitan levy and capital expenditures pending debenture issuance. It should be noted that this
amount includes temporary interest costs in connection with current expenditure of the Metropolitan
School Board and capital advances to the local Boards of Education, but does not include such costs
with respect to the operations of the Toronto Transit Commission and the Metropolitan waterworks
system. I hese financial costs were offset by revenues of $471,005, made up chiefly of interest charges
to Area Municipalities with respect to capital advances.

17
Administration—general (See Pages 53 and 57)
Expenditures of $3,126,978 under this heading represent the cost of overall administration
exclusive of such costs specifically relating to the services previously discussed. Of the total expenditure,
58% was required for assessment of properties within the Toronto Metropolitan Area, for which
the Metropolitan Corporation became exclusively responsible under the Act. The balance is made up
of costs for general administrative Departments such as Treasury, Cleric’s, Audit and Legal as well
as the Metropolitan Toronto Planning Board and sundry other expenses. Revenues of $138,545
derived chiefly from the general administrative charge of $100,000 to waterworks operations have been
considered as an abatement of the costs of administration.
While most of the accommodation required for the work of the Metropolitan Corporation is at
present rented at various locations, the Municipal Building of the County of York, located in the
City of Toronto, was purchased during 1954 and is used chiefly for Council and Committee meetings
and related administrative offices. Debenture Debt charges in respect of such building amounted to
$29,750. Eventually, Metropolitan Departments will be centralized in a proposed new Municipal
Building.
Provincial Government Unconditional Per Capita Grant
For the year 1956, the Provincial Government paid unconditional grants to all Municipalities
ranging from $1.50 per capita in the case of very small Municipalities to $4.00 per capita in the case
of Municipalities having a population of over 750,000. This grant is for the purpose of assisting
Municipalities in the provision of Welfare Services, Social Services, Administration of Justice and
other services. In 1956, the Metropolitan Corporation on the basis of $4.00 per capita received a
grant of $4,982,100.
By legislation enacted in 1957 the unconditional per capita grants to Municipalities were
increased. In the case of the Metropolitan Corporation such grant was increased from $4.00 to $5.50
per capita ($1.00 re Administration of Justice and $4.50 re Welfare and other services). The grant
for 1957 is to be applied to benefit residential assessment only rather than both residential and com¬
mercial assessment as in prior years.
Metropolitan General Levy (See page 60)
In 1956, the net amount (i.e., after Provincial Government grants and other revenues) levied for
the purposes of the Metropolitan Corporation other than schools was $18,042,836. In accordance with
the Act, each Area Municipality was required to levy against its taxpayers and pay over to the
Metropolitan Corporation the proportion of this amount that the assessed value of property in that
municipality bore to the total assessed value of property in the whole Metropolitan Area.
Under The Assessment Act, the Metropolitan Corporation is entitled to receive its proportion of
supplementary taxes levied by the Area Municipalities but is required to pay its share of all tax
deficiencies. Included in revenues for 1956 are supplementary taxes amounting to $380,404 and tax
deficiencies of $118,405 are treated as contra thereto which results in a net revenue of $261,999.
General Surplus (See page 38)
The Surplus for 1956 on general account amounted to $1,980,930, which arose from the fact that
revenues were in excess of estimates by $782,783 and expenditures were below estimates by $1,198,147.
Credited to Surplus Account in 1956, this amount together with a credit of $129,861 for unexpended

18
funds arising from Hurricane Damage Reserves established in 1954 resulted in a total surplus of
$2,110,791 to be carried forward as a revenue item to abate the 1957 Metropolitan Levy.
Education (See pages 54 and 59)
Gross expenditures on account of Education amounted to $37,335,487 of which $31,072,502
represents maintenance assistance payments by The Metropolitan School Board to local Boards of
Education within the Metropolitan Area and $6,158,619 principal and interest payments with respect
to assumed debenture debt of the Area Municipalities and new debentures issued by the Metropolitan
Corporation.
Maintenance assistance payments are made on a per pupil basis of average daily attendance
according to the type of instruction at the following rates—Public Elementary $150, Academic
Secondary $250, Commercial Secondary $300 and Technical Secondary $400. Additional amounts
are paid in respect of handicapped children in special classes to cover approximate full maintenance
costs in those cases. Under 1957 legislative amendments such payments are now based on the average
daily attendance of the current year rather than the preceding year which serves to assist Boards
whose enrolments are increasing rapidly.
Provincial Government grants received by The Metropolitan School Board amounted to
$10,399,569 in 1956. Each local Board of Education applies for all Provincial grants but with the
exception of any special grants such as the per pupil grant of $6.00 in 1956, and those in respect of milk
for pupils, night schools and books, payments are made to the Metropolitan School Board. In this
connection, it may be noted that the amount of teachers’ gross salaries in the public elementary schools
eligible for grant in 1956 was limited to $75.00 per pupil of average daily attendance whereas in 1957
the limit was raised to $100.00 per pupil, which it is estimated will increase grants by approximately
$1,220,000. Furthermore the local boards, it is estimated, will benefit in 1957 to the extent of approxi¬
mately $1,075,000 by increase in the per pupil grant from $6.00 to $11.00, $25.00 and $30.00 for
elementary, academic, secondary and vocational secondary pupils respectively. In 1956, the net
amount (i.e., after Provincial Government grants, previous year’s surplus, etc.) levied for the require¬
ments of The Metropolitan School Board and for principal and interest payments with respect to
assumed and new debenture debt was $26,424,398. This levy of $26,424,398 was made up of
$17,508,540 for Public School purposes and $8,915,858 for Secondary School purposes. In accordance
with the Metropolitan Toronto Act, each Area Municipality was required to levy against its taxpayers
and pay over to the Metropolitan Corporation a proportion of these amounts determined as follows:
(a) In the case of the levy for Public School purposes—an amount representing the proportion
that the assessed value of property rateable for Public School purposes in that municipality
bore to the total assessed value of property rateable for Public School purposes in the whole
Metropolitan Area.
(b) In the case of the levy for Secondary School purposes—an amount representing the pro¬
portion that the assessed value of property rateable for Secondary School purposes in that
municipality bore to the total assessed value of property rateable for Secondary School
purposes in the whole Metropolitan Area.
Upon reference to the statement on page 60, it will be seen that the Public School levy was distributed
on an assessment of $2,777,917,360 and the Secondary School levy on an assessment of $2,928,331,830.
I he difference between these two assessments represents property rateable for the requirements of
Roman Catholic Primary Schools rather than Public Elementary Schools. In this connection, it
should be noted that the Roman Catholic Primary Schools in the Metropolitan Area are practically

19
all under the jurisdiction of the Metropolitan Separate School Board although two other Separate
School boards function within the area. The Separate School boards are independent of both the
Metropolitan Council and The Metropolitan School Board with respect to debenture issuance and
all other matters.
As pointed out in the discussion of the General levy, the Metropolitan Corporation is entitled
to receive its proportion of supplementary taxes levied by the Area Municipalities but is required to
pay its share of all tax deficiencies. These taxes amounting to $577,350 with respect to education less
deficiencies of $189,699 resulted in a net revenue for 1956 of $387,651.
A surplus of $710,169 on 1956 operations was carried forward as a revenue item to abate the 1957
Metropolitan levy for education purposes. (See Surplus Account page 50.)
While, subject to the approval of The Metropolitan School Board, the local boards continue to
be responsible for the construction of their schools, the Metropolitan Corporation has exclusive power
to issue any debentures required for financing of the cost. The following table shows the new school
projects which during the past three years have been approved by the Metropolitan School Board and
the Metropolitan Council:
N ewr Buildings
(including
additions
and sites)
Public Schools Secondary Schools Sites Total
No.
Approximate
Cost No.
Approximate
Cost No.
Approximate
Cost
Approximate
Cost
1954 62 $11,710,000 14 $ 7,700,000 13 $ 443,000 $19,853,000
1955 71 15,147,000 10 4,779,000 50 2,846,000 22,772,000
1956 45 13,659,000 6 3,538,000 74 5,963,000 23,160,000
178 $40,516,000 30 $16,017,000 137 $9,252,000 $65,785,000
Debenture issues for new capital expenditures to the extent that they are eligible for legislative
grants are repayable by annual levies against all the Area Municipalities and the balance by levies
against the particular Area Municipalities in which the respective local Boards of Education have
jurisdiction. Of the $23,160,000 capital expenditures approved in 1956, approximately 40% is eligible
for Provincial Government grants. It should be noted that such grants representing about 17.4%
of the total cost, wall be received annually over the lifetime of the respective debenture debts.
The Metropolitan School Board and the Metropolitan Council have agreed upon a formula
(revised from time to time since 1954) establishing maximum amounts for which debentures will be
issued wdth respect to various classes of schools. Any capital costs in excess of the limits fixed by this
formula must be met as a current charge by the respective local Boards of Education. These restric¬
tions on capital costs operate toward accomplishing adequate basic educational facilities throughout
the Toronto Metropolitan Area.
Waterworks (See pages 55 and 59)
The Metropolitan Corporation is responsible for the production, treatment, storage and wholesale
distribution of water to the Area Municipalities. Rates fixed by the Metropolitan Council are required
to be sufficient to make the system self-sustaining after providing for such maintenance, renewals,
depreciation, debt charges and reserves as the Council deems proper and any surplus revenues not
required for such purposes must remain at the credit of the System.

20
Current expenditures in 1956 with respect to the waterworks system amounted to $6,422,514,
of which $2,845,800 was for operation and maintenance of pumping stations, filtration plants, reservoirs,
intakes, trunk mains, etc. and treatment of water, $2,645,770 for principal and interest charges with
respect to assumed debenture debt and Metropolitan debentures, $470,438 for general administration
and $460,506 for taxes payable to Area Municipalities.
Revenues for 1956 amounted to $5,964,034, derived almost entirely from wholesale water charges
to the Area Municipalities. The deficit for the year of $458,480 after being charged against the
surplus brought forward at January 1, 1956, of $279,021, resulted in a net deficit of $179,459 as at
December 31, 1956, (see page 46). Increased rates established in 1957 it is estimated will provide
for full operating costs as well as the net deficit from 1956.
Capital expenditures for additional waterworks plant, extensions to existing works and provision
of trunk mains in 1956 amounted to $13,750,986. In order to complete works in progress it is estimated
that future capital expenditures of $15,167,000 will be required. These works include:
(a) Extension to R. C. Harris Water Purification and Pumping Plant to increase capacity from
100,000,000 to 200,000,000 gallons per day.
(b) Extensions to Scarborough Water Purification Plant to increase capacity from 14,000,000
gallons per day to 24,000,000 gallons per day.
(c) Construction of Lawrence Reservoir—having a capacity of 30,000,000 gallons.
(d) Rehabilitation and extension to John Street Pumping Station.
By the end of 1957 a significant stage in the development of Metropolitan Toronto water
facilities will be reached. Compared to 1954, water filtration capacity will be increased from 245
million to 355 million gallons daily, trunk mains will have been extended from 94 to 154 miles,
capacity of pumping stations from 618 million to 1,015 million gallons daily and capacity of reservoirs
from 93 million to 123 million gallons.
Toronto Transit Commission
Prior to January 1, 1954, public passenger transportation in the Toronto Metropolitan Area,
other than steam railways and taxis, was provided in the City of Toronto by the Toronto Transporta¬
tion Commission and in the other Area Municipalities either by the Commission under agreements or
by privately-owned companies. By The Municipality of Metropolitan Toronto Act the new Transit
Commission was given exclusive power in this regard and in accordance therewith acquired all assets
of the former Commission without compensation and purchased the four privately-owned bus lines
operating in the Toronto Metropolitan Area.
The Toronto Transportation Commission, over the whole period of its operation since 1921,
was fully self-sustaining after adequately providing for depreciation, all operating contingencies and
principal and interest charges with respect to debentures issued by the City of Toronto for the System.
The Toronto Transit Commission, which is appointed by the Metropolitan Council, is an
independent body except for the fact that capital expenditures to be financed by the issuance of
debentures of the Metropolitan Corporation must be approved by the Metropolitan Council. The
System is required to be self-sustaining after providing for all operating costs including principal and
interest charges with respect to previously existing debenture debts assumed and any new debentures
issued for transit purposes by the Metropolitan Corporation.

The following statistics as at the end of 1956 are of interest:
Single track. 222.34 miles
Trolley coach and bus routes. 247.39 miles
Vehicles:
Street cars. 882
Subway cars. 134
Trolley coaches 140
Buses. 467
Service vehicles. 144
Ferryboats operating between mainland and Toronto
Island (4 passenger and 2 freight). 6
On March 30, 1954, the Yonge Street Rapid Transit project was officially opened for passenger
traffic. This project, commenced in 1949, consists of 4.56 miles of double track (2.88 in subway and
1.68 in open cut). At the present time rush-hour traffic on this route frequently exceeds 30,000
passengers per hour which compares with a designed capacity of 40,000 passengers per hour.
In 1946 the voters of the City of Toronto approved a general plan for twro subways, including
the north-south Yonge Street Rapid Transit Project now in operation. The other was an east-west
subway. Plans presently under consideration contemplate an east-west subway, together with a
parallel extension of the Yonge Street line on University Avenue to take care of the anticipated in¬
creased traffic which will result from the east-west subway. In view of the fact that such projects will
form a part of the over-all transportation facilities within the Toronto Metropolitan Area, the financial
responsibility for them as between the Commission and the Metropolitan Corporation has not been
determined.
The first two years of operation on a Metropolitan basis presented many problems in the co¬
ordination and consolidation of the system particularly in view of the fact that the new Commission
had to provide transportation services in an area of 240 square miles, including certain non-self-
sustaining services, as compared with 35 square miles in the case of the former Commission. Despite
fare structure changes during that time made with a view to making the whole system self-sustaining,
these problems together with substantially increased operating costs resulted in deficits being sustained
in the first two years of operation.
In June, 1956, the Metropolitan Corporation, under authority given by amendment to The
Municipality of Metropolitan Toronto Act, made a grant of $2,300,000 to the Commission on account
of losses suffered by the Commission during the extension and re-organization of its system in the
Toronto Metropolitan Area. However, faced with steadily increasing costs and a deficit of more than
S2 million in the year 1955, the Commission decided to raise fares effective July 1, 1956. For the
great majority of riders this has meant an increase in the basic zone fare from 10c. to I2J2C. Largely
because of this fare increase the financial results for 1956 showed a net income of $837,747 and it is
expected that the Commission’s operations for 1957 will also result in a surplus.

22
TORONTO TRANSIT COMMISSION
CONDENSED STATEMENT OF INCOME
Operating Revenue.
Dividend from Gray Coach Lines, Limited
Interest.
Sundry.
Total.
Operating Expenses (including Depreciation and Debt
Charges of Island Ferries).
Balance.
Provisions for:
Depreciation*. .
Interest and Amortization of Discount on Debentures..
Public Liability.
Surplus or (Deficit) for year
Year Ended December 31
1954 1955 1956
$28,373,297 $30,217,834 $34,197,181
60,000 60,000 60,000
41,525 67,492 110,924
1,104,929 1,282,701 1,309,769
$29,579,751 $31,628,027 $35,677,874
26,937,684 27,567,502 28,260,771
$ 2,642,067 $ 4,060,525 $ 7,417,103
$ 2,843,030 $ 3,567,557 $ 3,774,334
1,774,004 2,341,379 2,369,371
380,953 460,152 435,651
$ 4,997,987 $ 6,369,088 $ 6,579,356
($ 2,355,920) ($ 2,308,563) $ 837,747
*During the year 1954 a thorough review was made of the depreciation rates previously used by the Toronto Transportation Commission, and adjustments in these rates were made in the light of the experience of that Commission and a review of rates used by other transportation authorities. As a result of these changes in rates the provision for depreciation in 1954 was decreased by approximately $755,000.

23
TORONTO TRANSIT COMMISSION
STATEMENT OF ACCUMULATED DEFICIT
1954
Balance January 1.
Add-
Loss for the year.
Other non-recurring charges and credits (net).
2,355,920
22,428
1955
51,929,363
2,308,563
1956
$4,056,069
$2,378,348 $4,237,926 $4,056,069
Less-
Grant received from the Municipality of Metropolitan
Toronto under authority of Metropolitan Toronto
Amendment Act, 1956.
Less—
Net Income for the year.
Profit realized on sale of property no longer required.
Net foreign exchange gain realized on debenture debt
payable in United States funds retired in year.
Adjustment of prior year’s municipal taxes.
. 2,300,000
$2,378,348 $4,237,926 $1,756,069
837,747
240,901 384,650 55,639
64,335 86,209
40,009
101,901
$1,929,363 $4,056,069 $ 575,520
Gray Coach Lines, Limited, a wholly-owned subsidiary, operates outside the Toronto Metro¬
politan Area. The revenues and expenditures with respect to this subsidiary are not included in the
foregoing statements, although dividends received by the Commission from it are shown. Net income
of this subsidiary before such dividends amounted to $217,116, $339,752 and $312,010 in the years
1954, 1955 and 1956 respectively.
Debenture Debt
The obligation of the Metropolitan Corporation with respect to debenture debt divides into two
categories, namely:
(a) the obligation to provide funds to the Area Municipalities for payment of all outstanding-
debenture debt issued by them for school purposes and for works now vested in the Metro¬
politan Corporation. (Debenture Debt in this category is referred to as “Assumed”.)
(b) the obligation to holders of debentures issued by the Metropolitan Corporation for its own
purposes, including the Toronto Transit Commission, and for the purposes of the Area
Municipalities, including their local Boards of Education. (Debenture Debt in this category
is referred to as “Issued”.) In this connection it should be noted that since January 1, 1954,
no Area Municipality has had the power to issue debentures.
The following statement indicates such debt position as at December 31, 1956:

24
DEBENTURE DEBT
Area Municipalities Debentures— Metropolitan Toronto Debentures— Assumed Issued
Amount Total (From and Outstanding Amount Outstanding Outstanding including Matured as at (Since Matured as at as at
Jan. 1, 1954) Dec. 31, 1956 Jan. 1, 1954) Dec. 31, 1956 Dec. 31, 1956
General: $ $ $ $ $ $ $
Welfare—Homes for the Aged 1,740,403 1,740,403 1,740,403 Roads. 9,870,470 3,025,115 6,845,355 13,960,828 73,000 13,887,828 20,733,183 Sewage System. 12,097,628 (a)2,803,341 9,294,287 (b)23,755,293 128,073 23,627,220 32,921,507 Administration—
General—Building. 427,000 31,000 396,000 396,000 Protection to Persons and Property— Juvenile and Family Court
Building, Toronto Jail. 2,338,612 2,338,612 2,338,612 Parks—property acquisitions, etc. 512,814 82,448 430,366 1,328,319 36,000 1,292,319 1,722,685
Miscellaneous. 103,595 103,595 103,595
Total General. 22,480,912 5,910,904 16,570,008 43,654,050 268,073 43,385,977 59,955,985
Education—(To be met by levies over whole Metropolitan Area)
Public Schools. 34,033,877 (c)7,394,476 26,639,401 (d)22,567,618 670,909 21,896,709 48,536,110 Secondary Schools. 17,349,995 (e)3,205,745 14,144,250 (f)6,313,636 130,709 6,182,927 20,327,177
Total Education. 51,383,872 10,600,221 40,783,651 28,881,254 801,618 28,079,636 68,863,287
Total General and Education.... 73,864,784 16,511,125 57,353,659 72,535,304 1,069,691 71,465,613 128,819,272 Waterworks. 19,321,988 (g)6,342,651 12,979,337 (h)22,707,500 238,534 22,468,966 35,448,303 Toronto Transit Commission. 65,647,600 4,437,200 61,210,400 8,649,000 161,000 8,488,000 69,698,400 Specific Area Municipalities (in-
eludes share of schools). (i) 7 7,804,322 4,341,299 73,463,023 73,463,023
158,834,372 27,290,976 131,543,396 181,696,126 5,810,524 175,885,602 307,428,998
Note : Amounts included with respect to refinancing in 1954 and 1955 of Township of Scarborough Debentures-
(a) 579,226; (b) 588,628; (c) 2,052,500; (d) 1,984,600; (e) 174,000; (f) 167,000; (g) 2,984,771; (h) 5,046,372; (i) 1,496,000 (Hydro-Electric System, Local Sewers, watermains, etc.).

It will be seen that $178,609,726 of the total debt outstanding at the end of 1956 represents debt
assumed or issued for the purposes of the Waterworks System and the Toronto Transit Commission
and debt issued for the purposes of specific Area Municipalities. Funds for the payment of the debt
assumed or issued on account of the waterworks and transit systems will be provided from the
revenues of these utilities. Funds for the payment of debt issued for specific Area Municipalities will
be provided by them either by tax levies or other revenues. The balance of the debt amounting to
$128,819,272 will be repaid by Metropolitan General and Education levies against all Area Munici¬
palities on the basis of their relative assessments. It should be pointed out that in addition to the
$28,079,636 debt shown in the statement as issued for schools repayable by Metropolitan levies,
$15,663,364 for schools is included in the amount of $73,463,023 shown as issued and repayable by
specific Area Municipalities.
Though not forming part of Metropolitan Corporation debt, it is of interest to add to the above
figures the debenture debt of the Area Municipalities for which the Metropolitan Corporation has
not become responsible for repayment and thereby present a consolidated debenture debt statement
with respect to the whole Toronto Metropolitan Area. In this connection, a very comprehensive
statement is submitted on pages 70 and 71 of this report showing the municipalities which have issued
the debentures and the amounts thereof for which each is required to specifically levy after deduction
of the debts on account of Waterworks, Transit and Hydro-Electric Systems.
The following tables show:
(a) a summary of the information contained in this statement together with comparative figures
as at January 1, 1954, December 31, 1954 and December 31, 1955, and
(b) Debenture Debt of the Metropolitan Corporation and the Area Municipalities as at
December 31, 1956 according to places of payment.

TOTAL DEBENTURE DEBT OF THE TORONTO METROPOLITAN AREA
Outstanding as at
Area Municipalities’ Debentures
Assumed by Metropolitan Corporation.
Not Assumed.
January 1
1954
December 31
1954
December 31
1955
December 31
1956
$ 158,251,105
78,397,605
$ 149,229,930
70,585,377
$ 138,436,681
62,387,017
$ 131,543,396
55,744,881
Total. $ 236,648,710 $ 219,815,307 $ 200,823,698 $ 187,288,277
Metropolitan Corporation Debentures. 56,779,126 114,007,944 175,885,602
Total Debt of Metropolitan Toronto Area ... 236,648,710 $ 276,594,433 8 314,831,642 $ 363,173,879
Less Self-Liquidating Debentures—
Toronto Transit Commission. 65,600,000 68,507,400 68,849,000 69,698,400
Waterworks. 22,188,146 26,489,870 30,184,638 39,237,250
Hydro-Electric Systems. 12,335,114 24,149,646 25,658,658 27,968,361
Basic 3% Sinking Funds re Debts other
than above. 1,896,087
Total Net Debt of Metropolitan Toronto
Area. $ 136,525,450 $ 157,447,517 $ 190,139,346 $ 224,373,781
Population. 1,173,000 1,252,000 1,304,000 1,358,000
Net Debt per Capita. $ 116.39 $ 125.76 $ 145.81 $ 165.22
Assessment—As determined for apportion-
ment of Metropolitan levy against Area
Municipalities. 2,474,696,765 2,705,146,554 2,952,196,368 3,183,122,850
Net Debt as percentage thereof. 5.52 5.82 6.44 7.05
Metropolitan
Toronto Debentures of Area Municipalities Debentures
Assumed Not Assumed Total
Total Debt of Metropolitan Toronto Area
as at December 31, 1956 $175,885,602 $131,543,396 $ 55,744,881 $363,173,879
Payable in:
Canada. $139,431,602 $ 69,905,348 $ 51,121,929 $260,458,879 Canada, Lhiited States, England. 2,449,454 1,006,546 3,456,000 United States. 36,454,000 59,188,594 3,616,406 99,259,000
$175,885,602 $131,543,396 $ 55,744,881 $363,173,879

27
The Metropolitan Corporation has power to issue either instalment debentures or sinking fund
debentures. The Act provides that upon the issue of sinking fund debentures a specific annual
sinking fund amount shall be raised which with the estimated interest at a rate not exceeding 3% per
annum capitalized yearly will be sufficient to repay such debentures in full at maturity. All assets
of the Sinking Fund are under the sole control and management of a Sinking Fund committee composed
of the treasurer of the Metropolitan Corporation and two members appointed by the Lieutenant-
Governor in Council. The committee is required to keep one or more consolidated bank accounts in
which sinking fund monies and earnings and proceeds of sinking fund investments are deposited.
Sinking Fund investments are limited to securities which are trustee investments under The Trustee
Act (Ontario)—including debentures of the Metropolitan Corporation—although certain temporary
advances and loans may be made from the Sinking Fund to the Metropolitan Corporation. (See
pages 67 and 40-42 for outstanding Sinking Fund Debentures and Sinking Fund financial statements.
The public offerings of debentures made by the Municipality of Metropolitan Toronto from its
inception on January 1, 1954, to the recent New York offering in June, 1957, may be summarized as
follows:
METROPOLITAN TORONTO DEBENTURE ISSUES
Interest
Year and Month Amount Interest Rate Average Term Cost
% %
1954- -June $ 30,235,000 334; 3J4 13 years 11 months 3.64
November 26,155,000 334; 334 9 years 10 months 3.55
1955- --April. 31,714,000 3; 3J4; 3J4; 3^4 18 years 4 months 3.58
November. 28,169,000 3%; i'A', 3% 18 years 10 months 3.88
1956- — May. 28,580,000 434 20 years 4.65
August *36,454,000 4; 4y% 19 years 5 months 4.47
1957- —January. 20,090,000 5 16 years 11 months 5.43
June *39,372,000 4.34; 474 19 years 5.10
$240,769,000
’Issued in New York and payable in U.S. dollars.

28
General Comment
Since 1953, in the Metropolitan Toronto area, approximately $441,000,000 of new buildings
and structures assessment has been added, population has increased by 184,000 and motor vehicle
registrations have increased about 81,000. When consideration is given to these growth statistics
in conjunction with the fact that over a previous period of from 10 to 20 years the provision of such
services as water treatment and distribution, sewage collection and disposal and arterial roads, for
financial, jurisdictional and other reasons, had been decidedly inadequate, it is not surprising that
a large programme of capital works is now envisaged. As all capital requirements of the Metropolitan
Corporation including the Toronto Transit Commission, the Area Municipalities and their Boards
of Education can only be financed since January 1, 1954, by the issuance of Metropolitan Corporation
debentures which are direct, joint and several obligations of the Metropolitan Corporation and the
Area Municipalities, it is obvious that the responsibility with respect to the capital programme rests
largely with the Metropolitan administration.
With the “tight money” conditions and the increase of approximately 2% in interest costs which
have developed since 1954 the importance of regular and frequent review of the long term capital
programme was accentuated. No particular concern was occasioned by the largeness of the aggregate
capital expenditure set forth in the programme, as it was recognized that such amount varies accord¬
ing to ideas as to the period to be considered, e.g., 5 years, 10 years or 15 years and as the specific
works and relative expenditures were, to some extent, a forecast of anticipated rather than actual
requirements. On the other hand it was realized that the current year’s estimates of capital expendi¬
tures and the extent to which immediate future years’ estimates became firm commitments required
very careful consideration under money market conditions as exist at present.
Early this year (1957) under the direction of the Executive Committee the Capital Programme
for the whole Metropolitan Area was reviewed and the following very constructive action taken:
(a) Reduced 1957 Capital provision—
Metropolitan Works.
Schools—new approvals for debenturing.
Area Municipalities—new approvals for debenturing
From
50,152,000
25,000,000
47,780,000
To
$43,311,000
20,000,000
30,224,000
$ 122,932,000 $93,535,000
(b) Increased Metropolitan 1957 Current Tax Levy by $6,366,000 (equivalent to 2 mills) to
provide funds to that extent for Metropolitan Corporation capital works and relieve de¬
benturing.
It is worthy of note that based on present interest rates a cash payment on account of a
work being debentured for a 30-year term will relieve the burden of taxation in aggregate
over that period by approximately twice the amount. Furthermore, such a cash payment
in any year provides a flexibility to the next year’s tax levy by varying the amount, if
necessary, which together with the elimination of future fixed charges and an improved
credit position may be material factors in assuring the provision of capital works as required
during any period of less favourable economic conditions that exist at that time.

29
In May 1957, the Lieutenant-Governor in Council of the Province of Ontario appointed a com¬
mission:
(1) to inquire into and report upon—
(a) the composition, organization and methods of operation of the Metropolitan Council
and the Metropolitan School Board established pursuant to The Municipality of
Metropolitan Toronto Act, 1953, as amended;
(b) the extent to which the metropolitan municipal government and organization
established by the said legislation has succeeded in meeting the need for a better form
of local government in the said area and accomplishing the objectives for which it
was established;
and
(2) to make such recommendations with respect to the matters inquired into as may be con¬
sidered desirable.
Factual reports on the operations of the Metropolitan Corporation and related Boards and
Commissions have been prepared and submitted to the Commission. The assessment by the
Commission of the progress made by Metropolitan government since January 1, 1954, in meeting the
municipal needs of the Metropolitan Toronto Area, with any recommendations in respect thereto,
undoubtedly will be of great value to all administrative bodies concerned.
Respectfully submitted,
Commissioner of Finance.

30
EGLINTON AVENUE EAST EXTENSION
TOTAL LENGTH 3% MILES
(Approximate Cost, $4,250,000—Officially Opened, August 1957)
EDWARDS GARDENS
(Twenty-six Acres—Suburban Area—Acquired 1955)
31
“GREENACRES”
HOME FOR THE AGED—NEWMARKET, ONTARIO—CAPACITY 525
(Approximate Cost, $2,871,000—Officially Opened, June 1956)
“HILLTOP ACRES”
HOME FOR THE AGED—TORONTO—CAPACITY 200
(Acquired from Government of Canada 1956)
S*Sjst:
I
I •-) | 1
% * C '
*' *
.
9ft

32
R. C. HARRIS WATER PURIFICATION AND PUMPING PLANT
(Showing new east wing filter gallery, completed 1957, which with equipment and intake cost approxi¬ mately $7,500,000—increasing capacity from 100,000,000 to 200,000,000 gallons per day.)
HIGHLAND CREEK SEWAGE TREATMENT PLANT
(First stage, having capacity of 4,000,000 gallons per day, completed 1957 at approximate cost of $4,500,000. Ultimate capacity of proposed plant, 40,000,000 gallons per day.)

33
AUDITOR’S CERTIFICATE
I have completed my audit of the books and accounts of The Municipality of
Metropolitan Toronto, of The Metropolitan Waterworks System and of The Metro¬
politan School Board for the year ended 31st December, 1956, and subject to my
report thereon, I certify that, in my opinion:
(1) All the explanations and information required by me have been obtained.
(2) The financial transactions which have come under my notice are in order.
(3) The audit has been conducted in accordance with the instructions of the
Department of Municipal Affairs.
(4) The balance sheets as listed below have been properly drawn up so as to
exhibit true and correct statements of the affairs, according to their books,
of The Municipality of Adetropolitan Toronto, The Metropolitan Water¬
works System and The Metropolitan School Board, respectively:—
The Municipality of Metropolitan Toronto—
Capital and Loan Fund Balance Sheet
Revenue Fund Balance Sheet
Trust Fund Balance Sheet
Sinking Fund Balance Sheet
Pension Fund Balance Sheet
The Metropolitan Waterworks Balance Sheet
The Metropolitan School Board—
School Capital Balance Sheet
School Revenue Fund Balance Sheet
Toronto, Ontario
May 17, 1957.
GEO. H. GLENNIE, F.C.A.,
Metropolitan Auditor.

THE MUNICIPALITY OF
CAPITAL AND LOAN
December 31,
ASSETS
General Fixed—(completed works valued at the amount of related miniatured
debenture debt, less actuarial sinking fund requirement).
Works in Progress
Works for which debentures have been issued on account $26,280,016.44
Works for which debentures have not been issued on account ... 6,206,207.02
Receivable for Debentures: Assumed
Metropolitan School Board—
Issued Total
Public. $ 26,639,401.14 $ 21,532,568.46 $ 48,171,969.60
Secondary. 14,144,250.08 6,112,932.57 20,257,182.65
$ 14,009,481.85
32,486,223.46
$ 40,783,651.22 $ 27,645,501.03 $ 68,429,152.25
Public Utilities—
Metropolitan Waterworks $ 12,979,337.06 $ 22,202,197.41 $ 35,181,534.47
Toronto Transit
Commission. 61,210,400.00 8,431,495.59 69,641,895.59
$ 74,189,737.06 $ 30,633,693.00 $104,823,430.06
Area Municipalities $ — $ 72,495,216.09 $ 72,495,216.09
Metropolitan Sinking Fund $ — $ 2,359,431.17 $ 2,359,431.17
$114,973,388.28 $133,133,841.29 248,107,229.57
Advances to Area Municipalities pending issuance of debentures
Area School Boards re school capital projects in progress:
Advances pending issuance of debentures. $ 5,807,423.86
Less: Balance on hand of proceeds from sale of debentures. 2,541,577.41
Accounts Receivable:
Province of Ontario (Grants and Subsidies). $ 9,309,260.83
Dominion of Canada 20,024.73
Area School Boards 40,283.58
Toronto Transit Commission . 14,699.30
Sundry. 260,300.00
Inventory of Materials and Supplies for Construction Purposes—at cost
16,621,770.9 2
3,265,846.45
9,644,568.44
22,951.00
$324,158,071.69

METROPOLITAN TORONTO
FUND BALANCE SHEET
1956
Debenture Debt:
Metropolitan Purposes-
General.
Schools—
Public.
Secondary
Public Utilities—
Metropolitan
Toronto Transit
Commission
Area Municipality Purposes...
LIABILITIES
Assumed Issued
Instalment Instalment Sinking Fund
Debentures Debentures Debentures
$ 16,570,007.86 $ 4,769,472.72 $ 38,616,504.69 $ 59,955,985.27
$ 26,639,401.14 $ 6,522,120.97 $ 15,374,587.31 $ 48,536,109.42
14,144,250.08 1,599,290.90 4,583,636.44 20,327,177.42
$ 40,783,651.22 $ 8,121,411.87 $ 19,958,223.75 $ 68,863,286.84
$ 12,979,337.06 $ 5,173,470.17 $ 17,295,495.31 $ 35,448,302.54
61,210,400.00 3,839,000.00 4,649,000.00 69,698,400.00
$ 74,189,737.06 $ 9,012,470.17 $ 21,944,495.31 $105,146,702.54
$131,543,396.14 $21,903,354.76 $ 80,519,223.75 $233,965,974.65
— 37,089,246.65 36,373,776.25 73,463,022.90
$131,543,396.14 $58,992,601.41 $116,893,000.00 $307,428,997.55
Toronto Transit Commission:
Balance on hand of proceeds from sale of debentures
Accounts Payable:
Municipalities—
Area Municipalities. $ 318,192.99
Other Municipalities. 45,000.00
896,398.73
8 Toronto Transit Commission
Contractors’ Holdbacks.
Sundry.
Payable to Other Funds:
Revenue Fund
Waterworks Capital
Waterworks Current.
363,192.99
330,852.19
3,071,363.30
3,904,738.55
$ 7,563,192.01
590,622.05
8,714.32
7,670,147.03
8,162,528.38
$324,158,071.69
G. A. LASCELLES,
Commissioner of Finance and Treasurer.

THE MUNICIPALITY OF
ASSETS
Cash on Hand.
Investments—at Cost:
Municipality of Metropolitan Toronto Debentures
Levy Receivable from Area Municipalities:
Share of supplementary taxes levied, less share of tax deficiencies incurred by
Area Municipalities.
Accounts Receivable:
Municipalities—
Area Municipalities...
Other Municipalities
Province of Ontario—
Grants and Subsidies
Other.
Dominion of Canada.
$ 478,040.74
28,392.01
$ 506,432.75
$3,385,237.80
341,192.95
3,726,430.75
. 6,444.62
Local Boards and Commissions—
Metropolitan School Board. $ 8,046.50
Toronto Transit Commission 34,308.87
Metropolitan Toronto Civil Defence
Organization . 978.66
Metropolitan Toronto Planning Board.. 23.25
Sundry
43,357.28
122,028.64
Receivable from Other Funds:
Capital and Loan Fund. $7,563,192.01
Waterworks Capital. 1,199.86
Inventories of Materials and Supplies—at cost.
Prepaid Expenses:
Insurance Premiums. $ 84,225.39
Unused impressions in Unemployment Insurance Meter. 7,886.57
REVENUE FUND
December 31,
$ 21,100.00
96,500.00
75,298.40
4,404,694.04
7,564,391.87
90,244.39
92,111.96
$12,344,340.66

METROPOLITAN TORONTO
BALANCE SHEET
1956
LIABILITIES
Bank Overdraft (Net).
Debenture Coupons Due.
Accounts Payable:
Municipalities—
Area Municipalities. $ 983,081.64
Other Municipalities. 14,860.72
Province of Ontario.
Dominion of Canada.
Local Boards and Commissions:
Metropolitan School Board. $1,150,232.45
Toronto Transit Commission. 98,085.03
Metropolitan Toronto Civil Defence
Organization. 9,365.26
Metropolitan Toronto Planning Board. 695.47
Sundry
$ 997,942.36
22,329.81
56,950.37
1,258,378.21
1,717,387.01
Payable to Other Funds:
Trust Fund. $ 366,605.74
Pension Fund. 195,604.09
Waterworks Current. 8,984.59
Other Liabilities:
Amount available to reduce annual debenture debt charges:
Re assumed debenture debt—
Provincial and County grants. $ 57,307.19
Re metropolitan debenture debt—
Accrued interest received on sale. 34,036.89
Deferred income
91,344.08
105,160.02
Reserves:
Hurricane Damage—repairs to roads, bridges, sewers, etc. $ 12,000.00
Exchange Stabilization. 20,000.00
Surplus—available to reduce 1957 Metropolitan Levy
$ 5,123,028.27
257,835.00
4,052,987.76
571,194.42
196,504.10
32,000.00
2,110,791.11
$12,344,340.66
G. A. LASCELLES,
Commissioner of Finance and Treasurer.

38
THE MUNICIPALITY OF METROPOLITAN TORONTO
REVENUE FUND SURPLUS ACCOUNT
For the Year Ended December 31, 1956
Balance at Credit January 1, 1956. $ 1,547,180.60
Deduct:
Surplus used to reduce 1956 levy. 1,547,180.60
Unexpended funds from Hurricane Damage Reserves established in 1954. 129,860.79
Surplus from 1956 operations., 1,980,930.32
Balance at Credit December 31, 1956. $2,110,791.11
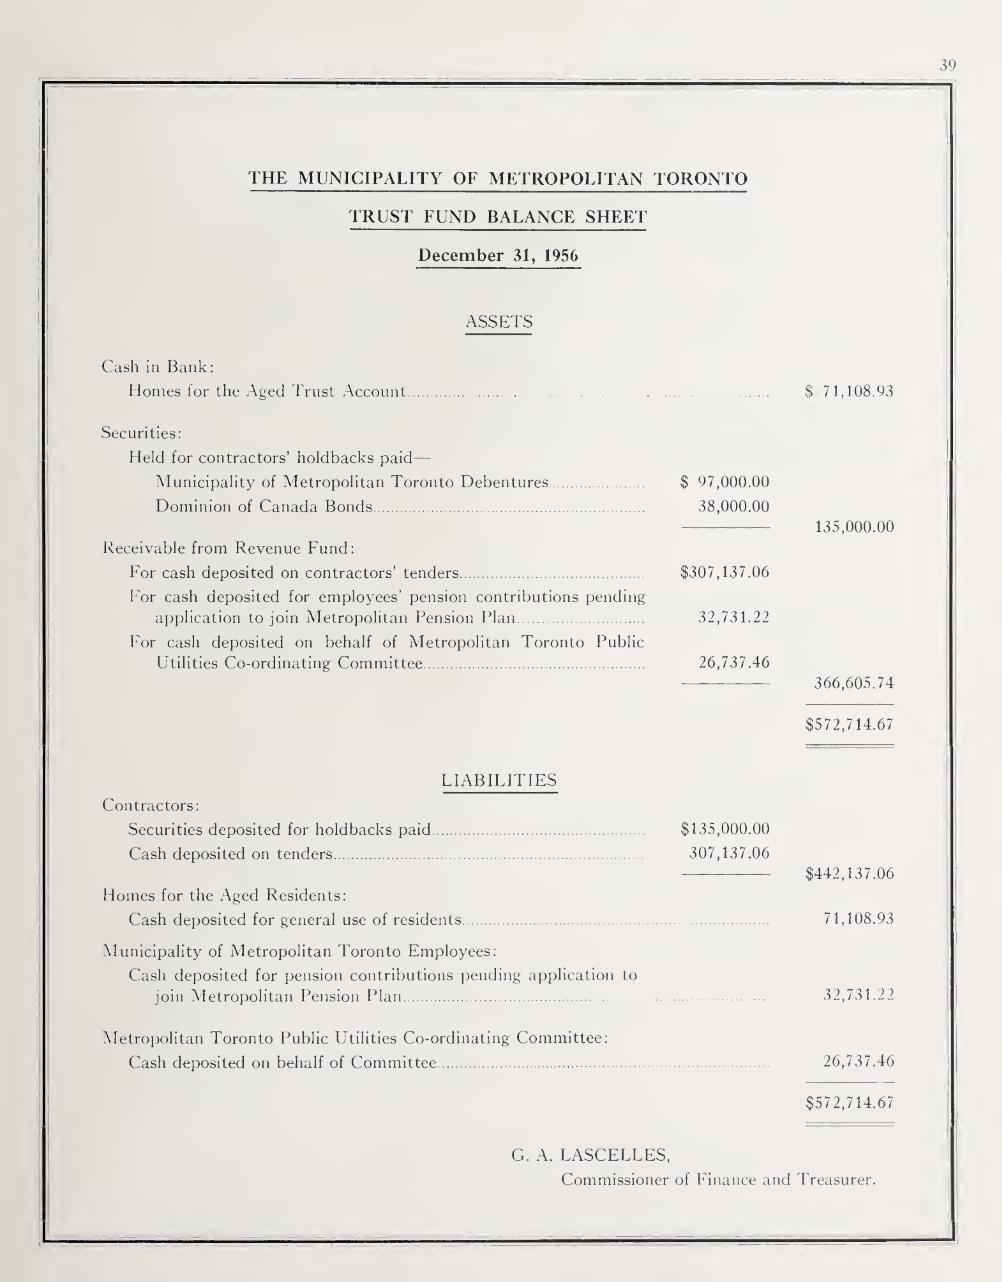
THE MUNICIPALITY OF METROPOLITAN TORONTO
TRUST FUND BALANCE SHEET
December 31, 1956
ASSETS
Cash in Bank:
Homes for the Aged Trust Account
Securities:
Held for contractors’ holdbacks paid—-
Municipality of Metropolitan Toronto Debentures $ 97,000.00
Dominion of Canada Bonds. 38,000.00
Receivable from Revenue Fund:
For cash deposited on contractors’ tenders. $307,137.06
For cash deposited for employees’ pension contributions pending-
application to join Metropolitan Pension Plan. 32,731.22
For cash deposited on behalf of Metropolitan Toronto Public
Utilities Co-ordinating Committee. 26,737.46
LIABILITIES
Contractors:
Securities deposited for holdbacks paid. $135,000.00
Cash deposited on tenders. 307,137.06
Homes for the Aged Residents:
Cash deposited for general use of residents.
Municipality of Metropolitan Toronto Employees:
Cash deposited for pension contributions pending application to
join Metropolitan Pension Plan.
Metropolitan Toronto Public Utilities Co-ordinating Committee:
Cash deposited on behalf of Committee.
$ 71,108.93
135,000.00
366,605.74
$572,714.67
$442,137.06
71,108.93
32,731.22
26,737.46
$572,714.67
G. A. LASCELLES,
Commissioner of Finance and Treasurer.

40
THE MUNICIPALITY OF METROPOLITAN TORONTO
SINKING FUND BALANCE SHEET
December 31, 1956
ASSETS
Cash in Bank.$ 1,087.02
Investments—at cost, adjusted for amortization of discount on purchase:
Municipality of Metropolitan Toronto Debentures. 2,356,722.90
Accrued Interest Receivable on Investments. 11,838.15
$2,369,648.07
LIABILITIES
Reserve for Retirement of Debentures: (payable to Capital and Loan Fund)
Metropolitan Purposes—
General. $ 634,217.29
Schools—
Public. $364,139.82
Secondary. 69,994.77
434,134.59
Public Utilities—
Metropolitan Waterworks. $266,768.07
Toronto Transit Commission. 56,504.41
323,272.48
Total Metropolitan Purposes . $1,391,624.36
Area Municipality Purposes. 967,806.81
$2,359,431.17
Surplus. 10,216.90
$2,369,648.07
G. A. LASCELLES,
Commissioner of Finance and Treasurer.

41
THE MUNICIPALITY OF METROPOLITAN TORONTO
SINKING FUND SURPLUS ACCOUNT
For the Year Ended December 31, 1956
Balance January 1, 1956
Add:
Surplus for the year.
Balance at Credit December 31, 1956
10,216.90
10,216.90

42
THE MUNICIPALITY OF METROPOLITAN TORONTO
SINKING FUND REVENUE AND EXPENDITURE STATEMENT
For the year ended December 31, 1956
REVENUE
Sinking Fund Contributions—
Municipality of Metropolitan Toronto
Metropolitan School Board:
Public.
Secondary.
$626,006.03
$360,088.43
68,893.51
Metropolitan Waterworks.
Toronto Transit Commission.
Area Municipalities.
428,981.94
261,544.34
56,227.13
955,625.49
Interest on Investments..
$2,328,384.93
41,263.14
$2,369,648.07
EXPENDITURE
Sinking Fund Provisions (Actuarial requirements for year)—
General.
Schools:
Public. $364,139.82
Secondary. 69,994.77
Metropolitan Waterworks.
Toronto Transit Commission
Area Municipalities.
$634,217.29
434,134.59
266,768.07
56,504.41
967,806.81
Surplus for Year
$2,359,431.17
10,216.90
$2,369,648.07

43
THE MUNICIPALITY OF METROPOLITAN TORONTO
PENSION FUND BALANCE SHEET
December 31, 1956
ASSETS
$ 41,430.41
17,142.50
126.31
244,084.05
$302,783.27
LIABILITIES
Accounts Payable:
Pension. $ 95.11
Death Benefit (insurance). 3,269.00
$ 3,364.11
Net Amount available to meet all liabilities including pensions and other benefits 299,419.16
$302,783.27
G. A. LASCELLES,
Treasurer.
Cash in Bank
Investments—at cost:
Municipality of Metropolitan Toronto Debentures $ 12,400.00
Other Municipality Debentures. 4,742.50
Accrued Interest Receivable on Investments
Contributions Receivable:
Revenue Fund—
Employer’s Contributions $184,927.21
Members’ Contributions 10,676.88
$195,604.09
Waterworks Current Fund—
Employer’s Contributions $ 44,527.76
Members’ Contributions. 3,298.18
47,825.94
Members—for arrears of contributions. 654.02

44
THE MUNICIPALITY OF
WATERWORKS
December 31,
Current
Cash on Hand
ASSETS
Water Rates Receivable:
Area Municipalities.
Area Municipality Public Utility Commissions
Accounts Receivable:
Area Municipalities.
Toronto Transit Commission
Sundry.
Receivable from Other Funds:
Revenue Fund
Capital and Loan Fund
Inventory of Materials and Supplies—at cost
Prepaid Insurance Premiums.
Accumulated Net Deficit—(to be met out of 1957 revenue)
773,065.00
109,011.00
11,340.47
5,491.77
5,003.78
8,984.59
8,714.32
250.00
882,076.00
21,836.02
17,698.91
138,330.51
99,818.48
179,458.78
Total Current Assets 1,339,468.70
Capital
General Fixed—(completed works valued at the amount of related debenture
debt). $16,242,089.75
Works In Progress:
Works for which debentures have been issued on account $17,697,808.05
Works for which debentures have not been issued on
account . 3,140,214.90
20,838,022.95
Receivable from Other Funds:
Waterworks Current. $ 814,255.59
Capital and Loan Fund. 590,622.05
1,404,877.64
Inventory of Materials and Supplies for Construction Purposes—at cost 559,616.10
Total Capital Assets. $39,044,606.44
$40,384,075.14 Total Assets

METROPOLITAN TORONTO
BALANCE SHEET
1956
Current
Accounts Payable:
Area Municipalities.
Toronto Transit Commission
Sundry.
LIABILITIES
45,798.69
600.00
413,632.60
Deferred Income:
Rentals received in advance .
Accrued Interest from Sale of Debentures.
Payable to Other Funds:
Waterworks Capital. $ 814,255.59
Pension Fund. 47,825.94
Reserve for Pumping Units and Appurtenances
Total Current Liabilities.
Capital
Debenture Debt: (payable to Capital and Loan Fund)—
Assumed from Area Municipalites. $12,979,337.06
Issued by the Metropolitan Corporation. 22,202,197.41
Accounts Payable:
Area Municipalities $ 65,025.15
Contractors’ Holdbacks. 2,363,223.89
Sundry. 1,433,623.07
Payable to Other Funds:
Revenue Fund.
Total Capital Liabilities
Total Liabilities.
$ 460,031.29
66.00
6,251.66
862,081.53
11,038.22
$ 1,339,468.70
$35,181,534.47
$ 3,861,872.1 1
1,199.86
$39,044,606.44
$40,384,075.14
G. A. LASCELLES,
Commissioner of Finance and Treasurer.

46
THE MUNICIPALITY OF METROPOLITAN TORONTO
WATERWORKS SURPLUS ACCOUNT
For the Year Ended December 31, 1956
Balance at Credit January 1, 1956 $279,021.08
Deduct:
Deficit from 1956 operations 458,479.86
Balance at Debit December 31, 1956 $179,458.78

47
THE MUNICIPALITY OF METROPOLITAN TORONTO
THE METROPOLITAN SCHOOL BOARD
CAPITAL BALANCE SHEET
December 31, 1956
ASSETS
Fixed Assets:
Amounts Recoverable from Future Levies of the Metropolitan
Corporation for Unmatured School Debentures:
On Debentures Issued —Public Schools. $21,532,568.46
Secondary Schools. 6,1 12,932.57
On Debentures Assumed—Public Schools. $26,639,401.14
$27,645,501.03
Secondary Schools. 14,144,250.08
Total Assets .
40,783,651.22
$68,429,152.25
LIABILITIES
Debenture Debt
Debentures issued by the Metropolitan Corporation:—
Public Schools. $21,532,568.46
Secondary Schools. 6,112,932.57
Debentures assumed by the Metropolitan Corporation:—
Public Schools. $26,639,401.14
$27,645,501.03
Secondary Schools. 14,144,250.08
Total Liabilities.
40,783,651.22
$68,429,152.25
(d. A. LASCELLES,
Treasurer.

THE MUNICIPALITY OF
THE METROPOLITAN
REVENUE FUND
December 31,
ASSETS
Cash on Hand. $ 100.00
Cash in Bank. 37,904.89
- $ 38,004.89
Due from the Metropolitan Corporation—balance of levy owing plus share of taxes
under Section 51 of The Assessment Act less tax deficiencies. 1,146,068.15
Due from the Metropolitan Corporation for accrued interest from sale of debentures
less deficiency of debenture funds. 4,164.30
Due from other School Boards—Etobicoke. $ 3,809.52
—North York. 16,727.61
- 20,537.13
Due from Province of Ontario—for estimated balance of 1956 legislative grants. 60,000.00
Other Current Assets:
Prepaid Insurance, Rent, Parking and Telephone 780.24
$1,269,554.71 Total

METROPOLITAN TORONTO
SCHOOL BOARD
BALANCE SHEET
1956
LIABILITIES
Accounts Payable:
Due to the Metropolitan Corporation
Due to the Province of Ontario
Due to general creditors.
Salaries Accrued.
$ 8,000.00 709.56
937.91
$ 9,647.47
332.30
Income Tax unremitted to Receiver General of Canada 728.68
Due to other School Boards:
For pension and group insurance. $ 572.47
For portion of 1956 non-resident fees. 201,499.61
For balance of 1956 costs of Auxiliary Classes. 321,903.53
523,975.61
Other Liabilities
Deferred Credit (to be used to abate 1957 debt charges)
Accrued Interest from sale of debentures less deficiency of
debenture funds. $ 4,164.30
Revenue from sale of assets by area school boards 20,537.13
24,701.43
Surplus—
Public Schools. $204,423.21
Secondary Schools. 505,746.01
710,169.22
Total $1,269,554.71
G. A. LASCELLES,
Treasurer.

50
THE MUNICIPALITY OF METROPOLITAN TORONTO
THE METROPOLITAN SCHOOL BOARD
REVENUE FUND SURPLUS ACCOUNT
For the Year Ended December 31, 1956
Public Secondary
Schools Schools T otal
Balance December 31, 1955 $602,716.85 $231,321.30 $834,038.15
Deduct: Amount used to reduce 1956 levy. 602,716.85 231,321.30 834,038.15
<£ <6 <J6 sP. SP. SP
Add : Surplus for the year ended December 31,
1956, per Revenue and Expenditure
Statement. 204,423.21 505,746.01 710,169.22
Balance December 31, 1956 carried to Balance Sheet $204,423.21 $505,746.01 $710,169.22
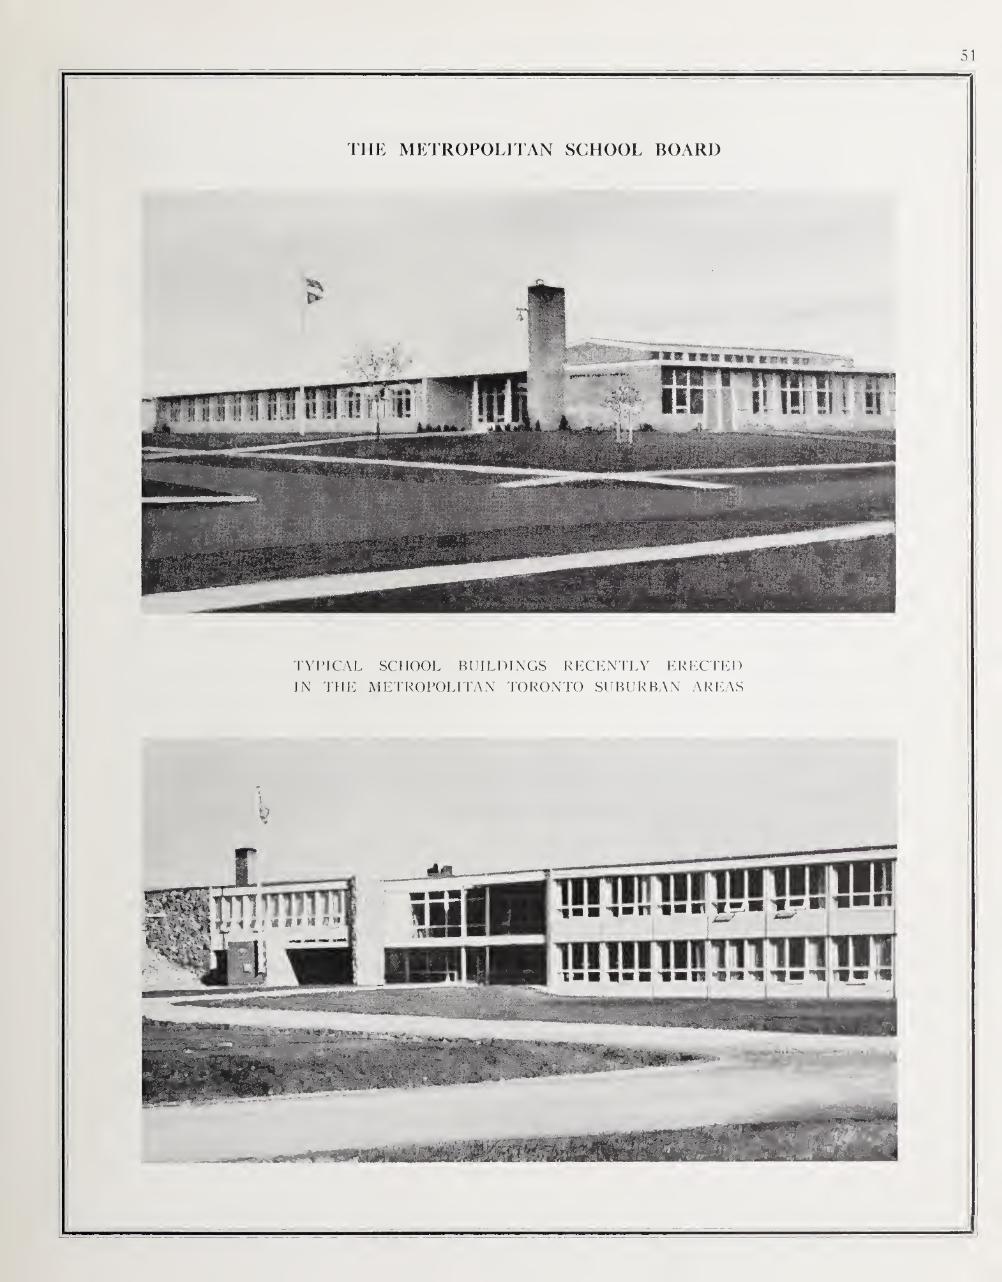
51
TYPICAL SCHOOL BUILDINGS RECENTLY ERECTED
IN THE METROPOLITAN TORONTO SUBURBAN AREAS
nnpRiRSI i.ai-n I-'
liiuiiiimiiiillT ■ ■ mmu van *m
*mM**m*(F
THE METROPOLITAN SCHOOL BOARD

52
DETAILS OF EXPENDITURES
FOR THE YEARS ENDED DECEMBER 31, 1954, 1955 AND 1956
CLASSIFIED BY FUNCTION
Expenditures
1956 1955 1954
GENERAL $ $ $
Health and Welfare
Hospitalization:
Hospitalization of Indigent Patients. . 2,248,222 2,411,668 2,221,096
Post-Sanatoria Care. 173,869 217,984 206,835
Burial of Indigent Patients. 1,467 271 539
Hosnital Deficits—Grants . 763.273 657,527
Riverdale Isolation Hospital—Grants re Deficits. 227,628 196,842 128,000
Hospital Building Grants. . 947,000 857,000 785,000
Administration. 66,457 59,473 53,123
Child Welfare:
Children’s Aid Societies—Statutory. 2,420,873 2,075,930 1,754,957
—Grants. . 226,809 186,940 283,307
Consulting Fees re Amalgamation Children Aid Societies . 27,368
Administration. 40,065 42,140 38,420
Homes for the Aged:
1 .ambert Lodge. 1,368,564 1,218,363 1,179,273
(jreenacres. 531,154 5,977
I lilltop Acres. 181,431 15,000
York County. 18,801 29,847 25,467
T.T.C. Grant re Blind and War Amputees 50,000
Administration. 64,809 69,662 55,513
9,357,790 8,044,624 6,731,530
Debenture Debt Charges. 110,722 24,332
9,468,512 8,068,956 6,731,530
Roads
Operation and Maintenance. . 3,449,278 3,255,076 2,462,538
Administration. 310,601 251,658 140,589
Toronto and York Roads Commission. 409,686 157,796 128,767
Special Items. . 52,769 113,501 116,870
Sundry. . 56,826 57,937 11,877
4,279,160 3,835,968 2,860,641
Debenture Debt Charges. . 1,748,779 1,369,680 1,343,524
6,027,939 5,205,648 4,204,165
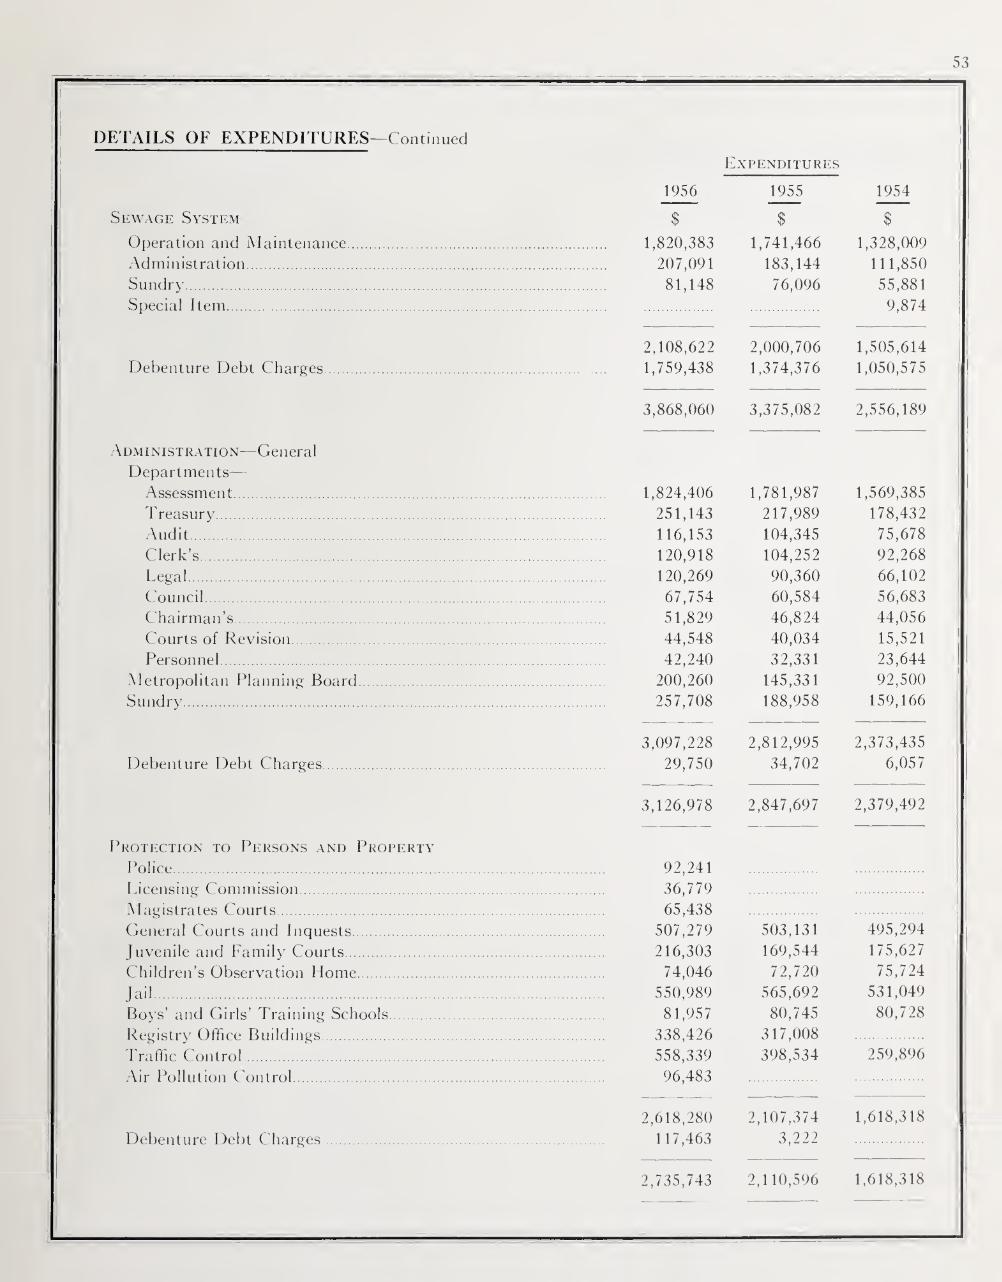
53
DETAILS OF EXPENDITURES—Continued
Sewage System
Operation and Maintenance Administration. Sundry. Special Item.
Debenture Debt Charges
Administration—General Departments— Assessment. Treasury. Audit. Clerk’s. Legal. Council Chairman’s. Courts of Revision. Personnel.
Metropolitan Planning Board Sundry.
Debenture Debt Charges
Protection to Persons and Property
Police. Licensing Commission. Magistrates Courts. General Courts and Inquests. Juvenile and Family Courts. Children’s Observation Home. Jail. Boys’ and Girls’ Training Schools. Registry Office Buildings. Traffic Control Air Pollution Control.
Debenture Debt Charges
Expenditures
1956 1955 1954
$ $ $
1,820,383 1,741,466 1,328,009 207,091 183,144 111,850 81,148 76,096 55,881
9,874
2,108,622 2,000,706 1,505,614 1,759,438 1,374,376 1,050,575
3,868,060 3,3 75,082 2,556,189
1,824,406 1,781,987 1,569,385 251,143 217,989 178,432 116,153 104,345 75,678 120,918 104,252 92,268 120,269 90,360 66,102 67,754 60,584 56,683 51,829 46,824 44,056 44,548 40,034 15,521 42,240 32,331 23,644
200,260 145,331 92,500 257,708 188,958 159,166
3,097,228 2,812,995 2,373,435 29,750 34,702 6,057
3,126,978 2,847,697 2,379,492
92,241 36,779 65,438
507,279 503,131 495,294
216,303 169,544 175,627 74,046 72,720 75,724
550,989 565,692 531,049
81,057 80,745 80,728
338,426 558,339 96,483
317,008 398,534 259,896
2,618,280 2,107,374 1,618,318
117,463 3,222
2,735,743 2,110,596 1,618,318
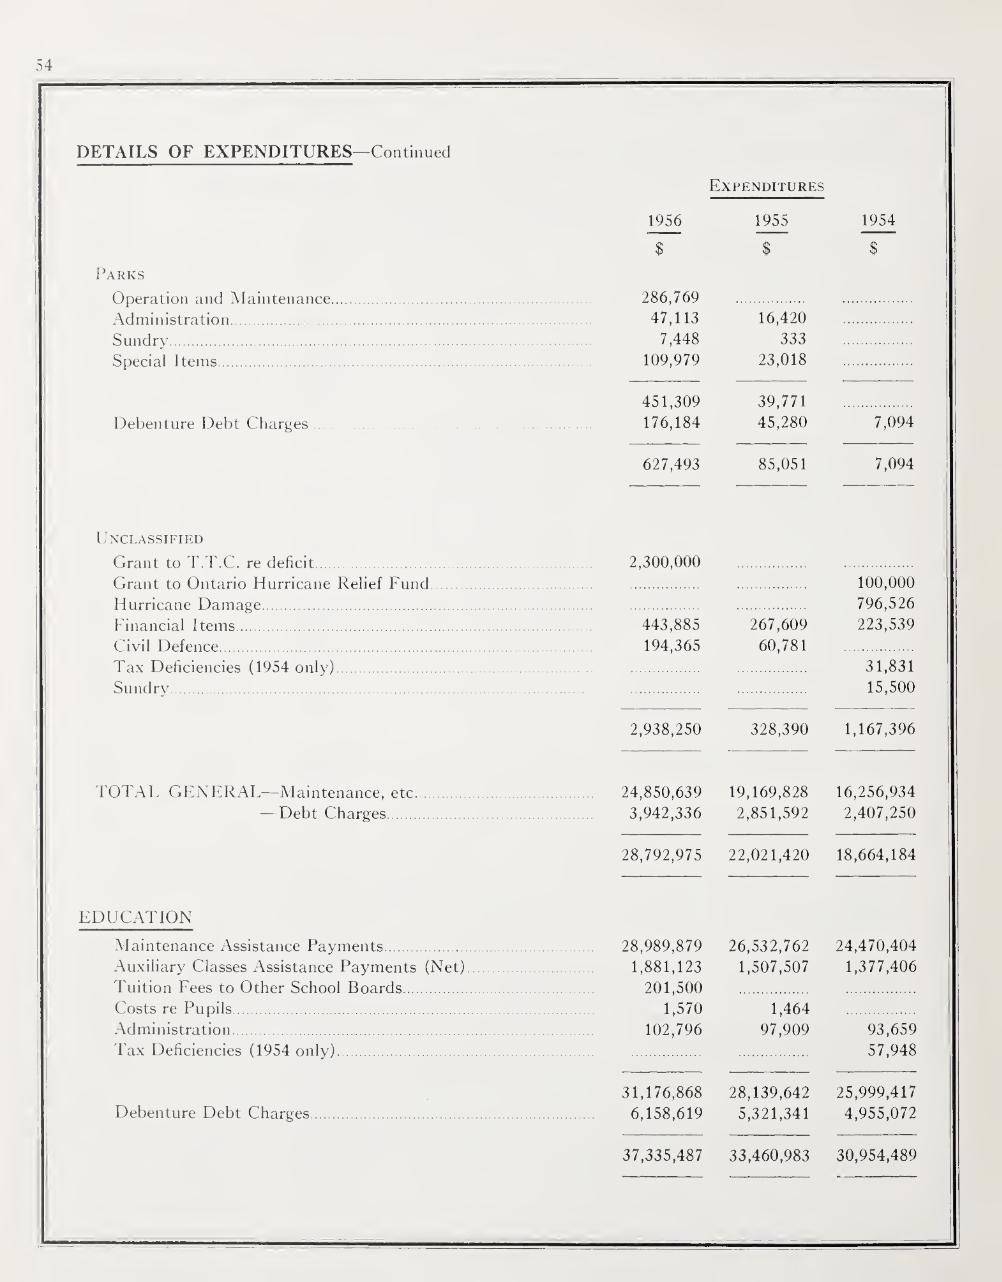
54
DETAILS OF EXPENDITURES—Continued
1956
Expenditures
1955
Parks
Operation and Maintenance. Administration. Sundry. Special Items.
Debenture Debt Charges
286,769 47,113
7,448 109,979
451,309 176,184
627,493
Unclassified
Grant to T.T.C. re deficit. Grant to Ontario Hurricane Relief Fund Hurricane Damage. Financial Items. Civil Defence. Tax Deficiencies (1954 only). Sundry.
2,300,000
443,885 194,365
TOTAL GENERAL—Maintenance, etc. —Debt Charges
EDUCATION
Maintenance Assistance Payments. Auxiliary Classes Assistance Payments (Net) Tuition Fees to Other School Boards. Costs re Pupils. Administration.
Tax Deficiencies (1954 only).
Debenture Debt Charges
16,420 333
23,018
39,771 45,280
85,051
267,609 60,781
1954
7,094
7,094
100,000
796,526 223,539
31,831 15,500
2,938,250 328,390 1,167,396
24,850,639 3,942,336
19,169,828 2,851,592
16,256,934 2,407,250
28,792,975 22,021,420 18,664,184
28,989,879 1,881,123
201,500 1,570
102,796
26,532,762 1,507,507
24,470,404 1,377,406
1,464 97,909 93,659
57,948
31,176,868 6,158,619
28,139,642 5,321,341
25,999,417 4,955,072
37,335,487 33,460,983 30,954,489

55
DETAILS OF EXPENDITURES- Continued
Expenditures
1956 1955 1954
$ $ $
WATERWORKS
Operation and Maintenance. . 2,845,800 2,697,845 2,635,237
Administration. 341,519 342,244 322,893
Taxes. 460,506 362,345 282,728
Sundry. 128,919 122,264 156,423
3,776,744 3,524,698 3,397,281
Debenture Debt Charges 2,645,770 2,265,745 2,045,776
6,422,514 5,790,443 5,443,057
DEBT CHARGES RECOVERABLE
Toronto Transit Commission.
Area Municipalities.
TOTAL EXPENDITURES
4,069,945
5,565,222
9,635,167
82,186,143
3,945,737
3,253,045
7,198,782
68,471,628
3,338,133
202,304
3,540,437
58,602,167

56
DETAILS OF REVENUES FOR THE YEARS ENDED DECEMBER 31, 1954, 1955 AND 1956
CLASSIFIED BY FUNCTION
Revenues
1956 1955 1954
$ $ $ GENERAL
Health and Welfare
Provincial Grants:
C hildren’s Aid Societies. 1,029,463 540,129 434,144 Homes for the Aged. . 788,769 456,920 425,814
Recoveries:
Hospitalization of Indigents. . 407,875 351,910 253,131 Children’s Aid Societies. . 44,137 25,087 18,381
Residents’ Maintenance Fees: Lambert Lodge. . 322,293 331,216 328,650 Greenacres. 101,707 Hilltop Acres. 26,449 York County. 9,014 10,840 11,292
Sundry:
Lambert Lodge. . 53,732 17,045 13,169 Greenacres. . 7,474 Hilltop Acres. 1,846
2,792,759 1,733,147 1,484,581
Roads
Provincial Grants. 1,641,546 1,443,815 1,272,278 Rentals. 1,496 257 Other. 6,974 8,223 1,101
1,650,016 1,452,038 1,273,636
Sewage System
Sundry:
Rentals and Concessions. . 10,958 9,073 13,554 Agreements. 6,750 7,017 6,753 Other . 9,170 1,536 1,198
26,878 17,626 21,505

57
DETAILS OF REVENUES—Continued
Revenues
1956 1955 1954
$ $ $
Administration—General
Administrative Services:
Waterworks. . 100,000 100,000 96,191 Metropolitan School Board—
Services of Treasurer. . 5,000 5,000 5,000 Services of Solicitor. . 5,000 5,000 5,000
Sundry:
Audit Fees. . 18,300 15,150 8,600 Rentals. . 9,030 15,831 6,020 Other. . 1,215 133 139
138,545 141,114 120,950
Protection to Persons and Property
Provincial Grants. . 205,927 189,962 184,726
Registry and Land Titles Offices. . 331,509 296,426
Recoveries:
County of York. . 22,443 22,276 22,975 Area Municipalities. . 24,384 22,768 22,855 Court Fines and Fees. 8,607 56,301 6,169 Police 1,287 Dominion Government re Immigrants. 1,371 2,112 3,054 Division ('ourts Jury Fund. . 3,601 3,093 2,784 Boys’ and Girls’ Training Schools. . 9,654 10,271 4,468 Children’s Observation Home.. 479 2,674
Sundry:
Rentals. . 600 600 600 Other . . 939 1,013 1,041
610,801 607,496 248,672
I1

58
DETAILS OF REVENUES—Continued
Parks:
Rentals and Concessions.
Don Valley Golf Course — Fees, etc.
Sundry.
Unclassified
Provincial Grants—Civil Defence.
—Hurricane Damage.
Financial Items.
Sundry..
Unconditional Per Capita Grant
Surplus from 1955.
General Levy.
Supplementary Taxes.
Less Deficiencies.
TOTAL GENERAL
380.404
118.405
1956
65,696
24,607
1,046
91,349
Revenues
1955
261,999 295,296
1954
151,519 39,112
183,026
57,783 471,005
6,917
185,853
6,921
629,441 231,886 240,809
4,982,100 4,982,100 4,441,028
1,547,181 621,294 .
18,042,836 13,261,355 11,454,296
30,773,905 23,343,352 19,285,477

59
DETAILS OF REVENUES—Continued
1956
Revenues
1955 1954
$ 8 $
EDUCATION
Provincial Grants. 10,399,569 9,236,177 8,739,310 Surplus from 1955. 834,038 1,275,624
22,773,201 Educational Levy. . 26,424,398 23,490,803 Supplementary Taxes.
Less Deficiencies. . 577,350
189,699 387,651 514,697
TOTAL EDUCATION. 38,045,656 33,799,699 32,230,113
WATERWORKS
Sale of Water to Area Municipalities. High Pressure Fire System. Other.
. 5,842,758 61,110
. 60,166
5,898,471 62,965 15,340
5,447,873 46,424 17,216
5,964,034 5,976,776 5,511,513
DEBT CHARGES RECOVERABLE
Toronto Transit Commission. 4,069,945 3,945,737 3,338,133 Area municipalities. . 5,565,222 3,253,045 20,2,304
9,635,167 7,198,782 3,540,437
TOTAL REVENUES. 84,418,762 70,318,609 60,567,540

60
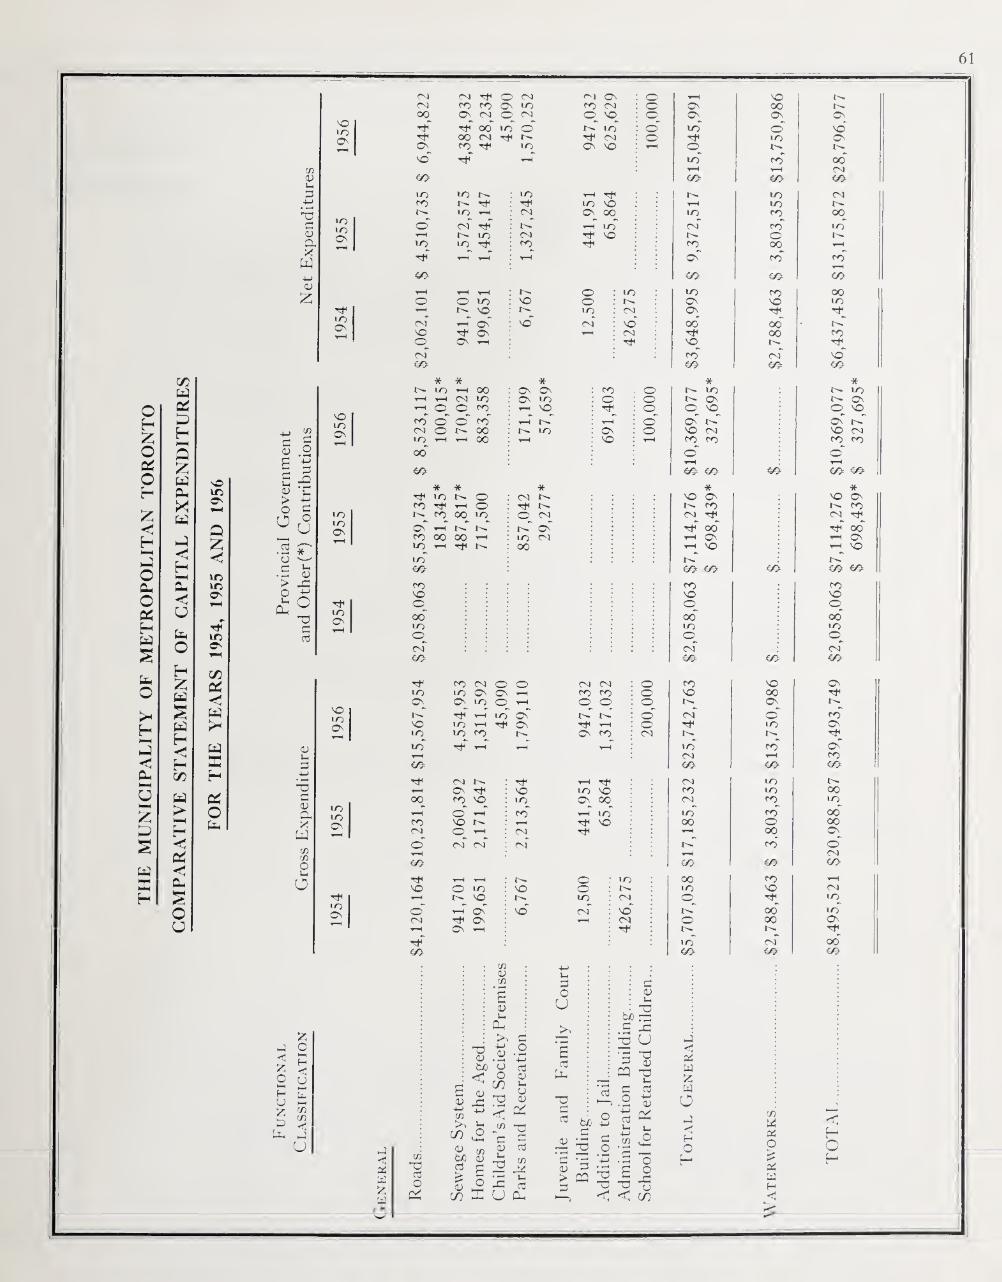
CO
MP
AR
AT
IV
E
ST
AT
EM
EN
T
OF
CA
PIT
AL
EX
PE
ND
IT
UR
ES
61
X io O'
O z < x X O'
H X O'
C/D X < W
>-
w
X
X O
cn 4> Ih 3
'3 c <u a x
W -M HI £
j_, c/3 C C
1 '2 £ £ > £ o c
c ’D ° ~u
2 o o
’> o u
Cu
u a/ j:
■o a 3
oj u 3
-M
■3 r-> 3 a x
W
cn c/3 O u,
o
£ n o
2 y H Lu U "h X ^ 3 c/3
< U- J
u
VO x Ov
>C X O'
H VO O'
VO VC o
x ic o
H X o
VO x o
VO VO o
H VO o
■3 OS w z w
OJ CM 00
V H o
VO*
45
OJ H O OJ X X Ov X Ov OJ O OJ
H 00 VO 00 OJ H X H
o tH
VO
4/5
oj vO ©_
of 4/5
o t^
»0 VO
tH ^N H O o —
* Jf N IO H 00 tH t-H OJ X -h © © x X* o' o' X* N O N M to t-h t—, 00 00*
05 -*. V
it VO N o fO Tt -H O o. to 00 VO
Ov t—i t— o» X 00 00 —I IO -H rf N VO* 05
X VO ©_
00* vo ©__
of 40
H VO
o. VO X
VO* ▼H 40 H
00
T-H
40 OJ
O* tH 40
H VO
O* OJ
H* 05
40 OV VO Ov Ov_ vo
H T-H
VO ’—i VO 40 T^l t-H
ov o. Ov H 40 VO
O T-H vo Jo © t-h
oj oi
O o»
vo VO
T-H OV
H Ov O' t-h
OJ Ov 40 OJ co vo_
o. VO H OJ Ov vo
O O O
O* O
VO to lo Hi 40 !>• to X
IO CM 00_
o* cn" ^h* t^T T-H X* •o CN X
to lo ro
vr—(
Ov Ov
VO* H ©_
vo* T-H
40
0- i <
VO
of t-H
40 Ov*
40
vO 00
©*
VO J-H
40* T-H
05
vo >o 40 40* o oo
40*
40
TJ HI bJO < 4)
_C
C/3 *o 3 O ~
£ 03
4-1
c/3 kO
C/D cn
bo 03 3
O *
C/3 03 C/3
03 t-i CL,
>. 3 -M O
• 2i O ci O 03
C/D >- L; <-> TJ 03
<rj x .to "O S 3
Ih 3 O
U
>v
E 3
: 3 : 03 • u,
bfi TO, .£ -c "O U
•a 3 3
4) CO
E o
n:
C/3
IE « U Dh
•3 xl 3 (jj
CQ X — X 3 3 ■ W O -M •“O . TZ, HI
f#3 c - iJ o
EE o ^
3 3 x ’3 § > CQ ^ _3 3=
I—. < < CO
hJ ■< Oi w z w
O
j
H O
H
C/3 bd OS o is OS u H
t'-
co
X* Ov
00*
OJ &} OJ t'- 00 VO*
40 40
: l- C : x X X 00 : X C : u- ov X X
lO Ov H H . X OJ ; O 00* 00*
: cn H oo X X u> H
X* CN X* 40 40
* * * : Ov O' X o O- X l-T IO : Ov X c o Ov t^- ov
^ NO o O X. o x N T— c Ov* t^.* Ov* tH.*
: to Ov o X OJ X CN X t-H X X X X
o* o* H rH
m 40 40 oo
* * * : cn X Ov X OV : ^ t— X t'H 40 : e CN oj H OJ H
: u- "* C\ H* 00* H* 00* : to oi t-H OV T-H Ov : 00 TH X TH VO
tH.* t-H* oo oo oo 05 40 X X X X
00* 00* X X o_ o_
of rf oo oo oo
O Oi OJ o X X OV y—i 40 X o X oo H T-H o o ■o J"» ov tH
3 Ov J^~ o* of o X* Os *-H o H X OV r^. On CO OJ o- H T-H X* X ov*
OJ t-H X 4^ CO 05
tH H OJ X VO X X X X 00 to Ov 00 OJ X X
CO T-I X X X* X* ^-H Tt< X 00 o X Ol TH 00 OV
O) rC X* o* T-H OJ CO oo 05
o to 00 X H VO o X X OJ
X Ol o H X
VO of X 00* X t-H CN o 00 Ov
H
X* of 00* oo 05 05
C H O H

TORONTO TRANSIT
BALANCE SHEET
ASSETS
CURRENT AND WORKING ASSETS:
Cash including interest bearing deposits. $
Balance of proceeds from the sale of debentures receivable from The Municipality of Metropolitan Toronto.
Accounts receivable, including accrued interest.
Gray Coach Lines, Limited—current account.
1956 dividend receivable from Gray Coach Lines, Limited.
Working funds advanced to employees and agents.
Materials and supplies valued on the basis of cost less allowance for obsolete items .
Unexpired insurance premiums and other prepaid expenses
3,692,289
896,399
859,513
613,334
60,000
371,995
2,211,142
165,683
$ 8,870,355
MORTGAGES RECEIVABLE ON PROPERTY SOLD 1,059,459
INVESTMENT IN CAPITAL STOCK OF GRAY COACH LINES, LIMITED, A WHOLLY OWNED SUBSIDIARY, at Cost. 1,000,000
CAPITAL ASSETS:
Land, buildings, subway, power distribution system, trackwork, rolling stock, buses, ferry boats, franchises, etc., at cost. $146,256,694
Less: Accumulated depreciation 56,129,541
90,127,153
UNAMORTIZED DEBENTURE DISCOUNT 1,379,594
$102,436,561

COMMISSION
DECEMBER 31, 1956
LIABILITIES
CURRENT LIABILITIES:
Accounts payable and accrued liabilities Debenture interest accrued Debentures maturing and sinking fund payments due in 1957. ..
PROVISIONS:
For tickets and tokens held by the public. For workmen’s compensation and public liability.
CAPITAL DEBT:
The Municipality of Metropolitan Toronto: For serial debentures maturing in annual instalments from 1957 to
1984 (including $49,850,000 debentures payable in United States funds).
For sinking fund debentures maturing in 1980 and 1986 (including $2,599,000 debentures payable in United States funds), less sinking fund balance of $56,504.
$ 4,318,745 374,123
1,897,656 $ 6,590,524
$ 350,0000 1,500,000
1,850,000
$65,049,400
4,592,496
Less: Debentures maturing and sinking fund payments due in 1957 shown as current liabilities.
$69,641,896
1,897,656
Foreign exchange premiums received less discounts paid on transfer of proceeds of $52,449,000 debentures issued in United States funds.
$67,744,240
2,023,584
EARNINGS RETAINED IN THE SYSTEM: 69,767,824
Balance January 1, 1954 at which date the system was acquired from the Toronto Transportation Commission. $24,803,733
Less: Accumulated deficit since January 1, 1954 per statement attached 575,520 24,228,213
$102,436,561
AUDITORS’ REPORT To the Chairman and Members
of the Toronto Transit Commission.
We have examined the Balance Sheet of Toronto Transit Commission as at December 31, 1956 and the Statement of Earnings and Statement of Accumulated Deficit for the year ending on that date and have obtained all the information and explanations we have required. Our examination included a general review of the accounting procedures and such tests of accounting records and other supporting evidence as we considered necessary.
In our opinion, the accompanying Balance Sheet and Statement of Earnings and Statement of Accumulated Deficit present fairly the financial position of the Commission as at December 31, 1956 and the results of its operations for the year ending on that date.
PRICE WATERHOUSE & CO.
Chartered Accountants. Toronto, May 29, 1957.

GRAY COACH
BALANCE SHEET
ASSETS
CURRENT AND WORKING ASSETS:
Cash including interest bearing deposits.
Treasury bills.
Accounts receivable, including accrued interest.
Working funds advanced to employees.
Unexpired insurance premiums and other prepaid expenses
$1,324,915
484,090
84,879
8,385
23,665 $1,925,934
INVESTMENTS:
Canadian Federal, Provincial and Municipal bonds including $150,000 on deposit under insurance bond, at market value. 1,054,880
MORTGAGE RECEIVABLE ON PROPERTY SOLD 36,500
CAPITAL ASSETS:
Land, buildings, motor coaches, other equipment and franchises at cost $6,824,511
Less—Accumulated depreciation. 4,166,122 2,658,389
$5,675,703
Auditors’ Report to the Shareholders of
GRAY COACH LINES, LIMITED:
We have examined the Balance Sheet of Gray Coach Lines, Limited as at December 31, 1956 and the Statement of Earnings and Retained Earnings for the year ending on that date. Our examination included a general review of the accounting procedures and such tests of accounting records and other supporting evidence as we considered necessary in the circumstances.
In our opinion, the accompanying Balance Sheet and Statement of Earnings and Retained Earnings present fairly the financial position of the company as at December 31, 1956, and the results of its operations for the year ending on that date.
PRICE WATERHOUSE & CO.
Chartered Accountants. Toronto, May 29, 1957.

LINES, LIMITED
DECEMBER 31, 1956
LIABILITIES
$ 159,322
613,334
60,000 $ 832,656
PROVISIONS:
For tickets held by the public. $ 16,000
For workmen’s compensation and public liability. 550,000 - 566,000
CAPITAL STOCK AND RETAINED EARNINGS:
Capital Stock—
Authorized and issued—
10,000 shares of $100 each $1,000,000
Earnings retained, per statement attached 3,077,047
Reserve for replacement of coaches 200,000 4,277,047
$5,675,703
CURRENT LIABILITIES:
Accounts payable and accrued liabilities.
Toronto Transit Commission—current account
Dividend payable to Toronto Transit Commission
Approved on behalf of the Board:
ALLAN A. LAMPORT, Director
W. E. P. DUNCAN, Director

66
YONGE STREET RAPID TRANSIT
ST. CLAIR AVENUE STATION
EGLINTON AVENUE TERMINAL ENTRANCE TO SUBWAY

67
DEBENTURES ISSUED IN 1956
MATURITIES AND COUPON INTEREST RATES
PUBLIC OFFERINGS
June (Canada) August (New York)
Coupon Coupon Maturity Interest Amount Interest Amount Total
Rate Rate
% $ % $ $
1957 4 205,000 205,000 1958 4 213,000 213,000 1959 4 220,000 220,000
1960 4 228,000 228,000 1961 4 744,000 744,000 1962 4 236,000 236,000 1963 4 244,000 244,000 1964 4 253,000 253,000 1965 4 262,000 262,000
1966 4 1,193,000 1,193,000
1967 4 91,000 91,000
1968 4 94,000 94,000
1969 4 97,000 97,000 1970 4 101,000 101,000
1971 4 699,000 699,000 1972 4 16,000 16,000 1973 4 17,000 17,000 1974 4 17,000 17,000 1975 4 18,000 18,000
1976 4K 28,580,000 418 27,868,000 56,448,000
1977 1978 1979 1980 1981 1982 1983 1984 1985 1986 TVs 3,638,000 3,638,000
28,580,000 36,454,000 65,034,000

68
Municipality
DEBENTURES
PURPOSES AND
Purposes of Issues
ISSUED IN 1956
TERMS OF ISSUES
Sinking Fund and Term instalment
(Years) Debentures Issued
$ $ East York Local Improvements. 15 388,588.88*
Sewage. 10 5,773.99 Waterworks (includes $918.55*).. 10 6,517.42 Highways. 10 12,723.22 Miscellaneous. . 15 222,816.35 Schools. . 20 37,831.16
674,251.02
Etobicoke Local Improvements. . 15 579,310.73* Waterworks. 10 36,970.02* Schools. . 20 914,999.33 Highways. 10 82,689.88
1,613,969.96
Leaside Local Improvements. . 10 22,013.84*
Long Branch Local Improvements. 10 7,751.82* Hospital Grant. . 5 10,285.71 Schools . . 20 30,295.55
48,333.08
Mimico Schools. . 20 43,748.28
New Toronto Schools. . 20 67,618.81
North York Local Improvements. 10 725,285.77* Sewage. 15 223,772.42 Waterworks. 10 & 15 237,760.52 Parks. 10 258,405.75 Hydro-Electric System. . 20 549,095.75 Schools. . 20 2,089,680.08
4,084,000.29
Scarborough Local Improvements. 20 755,291.99* Waterworks. 15 87,796.83* Township Garage. 5 61,714.29 Hvdro-Electric System . 20 2,730,310.37 Schools. 5 & 20 2,369,553.91
6,004,667.39
Carried Eorward. 12,558,602.67

60
Municipality
DEBENTURES
PURPOSES AND
Purposes of Issues
ISSUED IN 1956
TERMS OF ISSUES
Sinking Fund and Term instalment
(Years) Debentures Issued
$ $
Brought Forward. 12,558,602.67
Swansea Sewage. 15 62,181.31
Toronto Garbage Disposal. . 20 252,800.00 Highways. . 10 & 20 292,077.69 Local Improvements. . 15 259,071.57* Parks. . 20 303,350.00 Housing Authority. 30 1,039,000.00 Parking Authority. . 20 505,643.88 Schools. . 20 2,907,534.25
5,559,477.39
York Schools. . 20 270,362.00
Metropolitan Corporation
Administration of Justice . 20 1,011,111.11 I lighwavs. . 20 7,716,338.31 Parks. . 5 & 20 247,718.18 Sewage. 10 & 20 14,881,494.32 Welfare. 10 207,189.78 Miscellaneous. . 10 103,594.89 Schools. . 5 & 20 9,607,376.63 T.T.C. . 30 2,599,000.00
Waterworks. . 20 10,209,553.41 46,583,376.63
Total. 65,034,000.00

ANALYSIS OF TOTAL DEBENTURE DEBT
As at December 31,
(i.e. Debentures issued prior to January 1, 1954 By Area
Amount of Area Municipality Debentures For
The Payment of Which The Metropolitan
Corporation is Responsible to Provide Funds
-Area Metro- To be levied against Munici- politan
all Area Self-Liquidating pality Totonto
Municipality
Lhimatured Debentures
Munici
Education
ipalities
Sewage System
Roads-Parks and
Recreation
Toronto Transit
Commission Waterworks
Debentures
Balance
Debentures
Outstanding
$ $ $ $ $ $ $ To be levied as indicated*
East York. 7,833,017 2,522,898 699,505 106,708 4,503,906 1,387,144 Etobicoke. 13,355,428 6,602,664 969,802 366,236 5,416,726 8,379,323 Forest Hill. 2,608,760 1,572,759 146,563 889,438 509,433 Leaside. 2,645,479 1,342,160 9,382 1,293,937 83,636 Long Branch. 676,300 196,419 97,187 382,694 117,263 § Mimico. 763,740 100,130 250,204 413,406 72,179§ New Toronto ... 3,634,373 852,000 121,966 2,138,000 522,407 119,742 § North York. 19,176,226 10,604,289 755,914 444,868 7,371,155 9,488,188 Scarborough. 9,697,000 5,974,736 151,802 525,032 3,045,430 15,156,305 Swansea. 614,651 241,255 17,293 356,103 134,152 Toronto. 115,214,892 7,616,000 11,645,659 61,182,000 9,253,493 25,517,740 35,304,851 Weston. 2,021,392 864,902 388,186 28,400 145,000 594,904 301,497 York. 9,047,019 2,293,439 1,316,545 5,437,035 2,409,310
Total. 187,288,277 40,783,651 16,570,008 61,210,400 12,979,337 55,744,881 73,463,023
To be levied Metropolitan Corporation: Municipalities
Assumed Debt.. 40,783,651 16,570,008 61,210,400 12,979,337 131,543,396 Outstanding
Debt. 175,885,602 102,422,579
Total. 175,885,602 40,783,651 16,570,008 61,210,400 12,979,337 131,543,396 102,422,579
Grand Total 363,173,879 187,288,277 175,885,602
*Metropolitan Debentures are direct, joint and several obligations of the Metropolitan Corporation and the Area Municipalities notwithstanding the fact that the whole or any portion of the rates imposed for the payment thereof will be levied only against one or more of the Area Municipalities.

71
OF THE METROPOLITAN AREA
1956
Municipalities and Thereafter by Metropolitan Corporation)
Total Debt
Per Capita
Less Self-Liquidating Debts
Net Debt Before
Ded uction of
Sinking Funds
Less Basic 3% Sinking Funds
Re Debts other than
Self- Liquidating
Net Debt
Pet- Capita
Hydro- Electric Systems
Toronto Transit Com¬
mission Water¬ works
$ $ $ $ $ $ $ $ $
5,891,050 84.59 747,017 78,397 5,065,636 5,065,636 72.74 13,796,049 133.14 5,126,783 1,458,071 7,211,195 107,713 7,103,482 68.55
1,398,871 71.81 27,889 14,371 1,356,611 2,514 1,354,097 69.51 1,377,573 83.30 49,420 1,328,153 1,328,153 80.31
499,957 48.78 3,685 496,272 2,306 493,966 48.20 485,585 35.48 102,500 9,873 373,212 812 372,400 27.21 642,149 55.50 642,149 1,406 640,743 55.43
16,859,343 99.11 6,384,693 616,708 9,857,942 76,183 9,781,759 57.50 18,201,735 130.25 7,706,310 1,191,797 9,303,628 79,179 9,224,449 66.01
490,255 57.04 114,756 8,791 366,708 366,708 42.67 60,822,591 91.09 7,551,000 310,207 52,961,384 498,060 52,463,324 78.57
896,401 93.93 207,413 47,627 641,361 641,361 67.21 7,846,345 66.75 7,846,345 59,563 7,786,78 2 66.24
129,207,904 95.15 27,968,361 3,788,947 97,450,596 827,736 96,622,860 71.15
against all Area (except Self-Liquidating)
131,543,396 96.86 61,210,400 12,979,337 57,353,659 57,353,659 42.23
102,422,579 75.42 8,488,000 22,468,966 71,465,613 1,068,351 70,397,262 51.84
233,965,9751 172.28 69,698,400 35,448,303 128,819,272 1,068,351 127,750,921 94.07
363,173,879 267.43 27,968,361 69,698,400 39,237,250 226,269,868 1,896,0871 224,373,781 165.22
fEducation—$68,863,287; Sewage System—$32,921,507; Roads, etc.—$20,733,183; Parks and Recreation—$1,722,685; Toronto Transit Commission—$69,698,400; Homes for the Aged—$1,740,403; Waterworks—$35,448,303; Administrative
Building—$396,000; Administration of Justice—$2,338,612; Miscellaneous—$103,595. JNot including Sinking Funds re Self-Liquidating Debts; Hydro-Electric Systems—$138,142; T.T.C.—$56,504; Waterworks—$268,698.
§Lakeshore District Board of Education distributed on basis of revised 1956 Public and Secondary School Assessments.

72
SUMMARY OF TOTAL DEBENTURE DEBT MATURITIES OF THE METROPOLITAN
CORPORATION AND THE AREA MUNICIPALITIES
As at December 31, 1956
Metropolitan Corporation Debt of Area Total Debt Total Debt of
Direct Debt Municipalities Metropolitan Metropolitan
Assumed by Corporation Debt of Area Corporation
Sinking Metropolitan (Direct and Municipalities and the Area
Instalment Fund Total Corporation Assumed) Not Assumed Municipalities
$ $ $ $ $ $ $
1957 3,454,545 3,454,545 7,392,178 10,846,723 5,546,441 16,393,164
1958 3,553,668 3,553,668 7,318,981 10,872,649 5,206,032 16,078,681 1959 3,642,952 3,642,952 7,383,469 11,026,421 4,825,590 15,852,011
1960 3,044,280 435,000 3,479,280 7,063,569 10,542,849 4,462,774 15,005,623
1961 3,068,655 742,000 3,810,655 6,753,462 10,564,117 4,106,668 14,670,785
1962 3,184,078 190,000 3,374,078 6,463,767 9,837,845 3,571,286 13,409,131
1963 3,242,550 3,242,550 6,308,669 9,551,219 3,174,151 12,725,370
1964 3,259,075 3,259,075 6,083,746 9,342,821 2,666,822 12,009,643
1965 2,881,149 4,718,000 7,599,149 6,130,564 13,729,713 2,677,673 16,407,386
1966 2,684,154 937,000 3,621,154 6,179,188 9,800,342 2,670,182 12,470,524
1967 2,589,160 2,589,160 6,254,696 8,843,856 2,582,313 11,426,169
1968 2,631,165 2,631,165 6,206,137 8,837,302 2,544,441 11,381,743
1969 2,662,171 2,662,171 5,747,828 8,409,999 2,079,686 10,489,685 1970 2,585,000 683,000 3,268,000 5,612,857 8,880,857 2,009,316 10,890,173 1971 2,567,000 1,800,000 4,367,000 5,087,336 9,454,336 1,879,671 11,334,007 1972 2,468,000 1,694,000 4,162,000 4,480,237 8,642,237 1,791,467 10,433,704
1973 2,448,000 2,448,000 3,663,712 6,111,712 1,007,368 7,119,080
1974 2,467,000 2,467,000 2,767,000 5,234,000 323,000 5,557,000
1975 579,000 38,912,000 39,491,000 2,845,000 42,336,000 330,000 42,666,000
1976 576,000 56,448,000 57,024,000 2,920,000 59,944,000 337,000 60,281,000
1977 598,000 598,000 3,016,000 3,614,000 345,000 3,959,000
1978 618,000 618,000 3,107,000 3,725,000 353,000 4,078,000
1979 639,000 639,000 3,190,000 3,829,000 295,000 4,124,000
1980 662,000 2,050,000 2,712,000 3,274,000 5,986,000 304,000 6,290,000
1981 685,000 685,000 2,799,000 3,484,000 248,000 3,732,000 1982 710,000 710,000 1,757,000 2,467,000 237,000 2,704,000
1983 734,000 734,000 1,738,000 2,472,000 171,000 2,643,000 1984 759,000 759,000 759,000 759,000 1985 4,646,000 4,646,000 4,646,000 4,646,000 1986 3,638,000 3,638,000 3,638,000 3,638,000
58,992,602 116,893,000 175,885,602 131,543,396 307,428,998 55,744,881 363,173,879
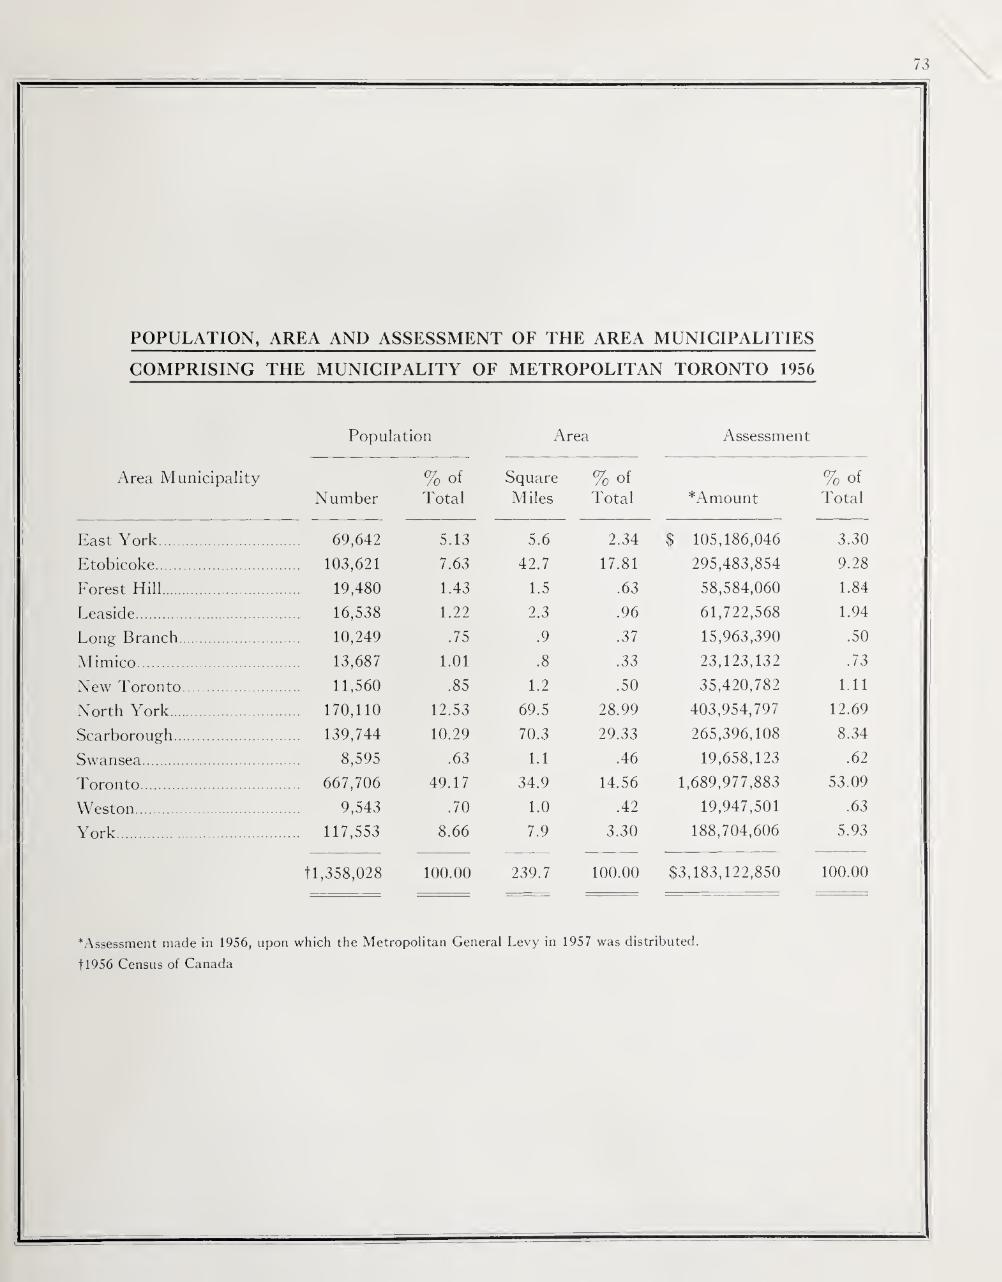
73
POPULATION, AREA AND ASSESSMENT OF THE AREA MUNICIPALITIES
COMPRISING THE MUNICIPALITY OF METROPOLITAN TORONTO 1956
Population Area Assessment
Area Municipality
Number
%of
Total
Square
Miles % of Total *Amount
%of
Total
East York. 69,642 5.13 5.6 2.34 $ 105,186,046 3.30
Etobicoke. 103,621 7.63 42.7 17.81 295,483,854 9.28
Forest Hill 19,480 1.43 1.5 .63 58,584,060 1.84
Leaside. 16,538 1.22 2.3 .96 61,722,568 1.94
Long Branch 10,249 .75 .9 .37 15,963,390 .50
Mimico. 13,687 1.01 .8 .33 23,123,132 .73
New Toronto 11,560 .85 1.2 .50 35,420,782 1.11
North York. .... 170,110 12.53 69.5 28.99 403,954,797 12.69
Scarborough 139,744 10.29 70.3 29.33 265,396,108 8.34
Swansea. 8,595 .63 1.1 .46 19,658,123 .62
Toronto .... 667,706 49.17 34.9 14.56 1,689,977,883 53.09
Weston. 9,543 .70 1.0 .42 19,947,501 .63
York. .... 117,553 8.66 7.9 3.30 188,704,606 5.93
11,358,028 100.00 239.7 100.00 $3,183,122,850 100.00
■"Assessment made in 1956, upon which the Metropolitan General Levy in 1957 was distributed.
11956 Census of Canada

74
POPULATION GROWTH OF AREA MUNICIPALITIES
IN THE TORONTO METROPOLITAN AREA
1940 1945 1950 1954 1955 1956
East York. . 38,316 43,266 60,155 68,812 69,402 69,642
Etobicoke. . 16,827 21,274 44,139 83,169 93,781 103,621
Forest Hill. . 12,172 13,960 16,191 18,664 19,139 19,480
Leaside. . 5,493 9,227 15,255 16,873 16,779 16,538
Long Branch. . 4,258 5,049 8,044 9,263 9,632 10,249
Mimico. . 7,194 8,785 10,410 12,383 13,054 13,687
New Toronto. . 7,514 8,498 10,961 9,807 11,231 11,560
North York. . 20,382 25,100 62,646 130,766 148,258 170,110
Scarborough. . 23,208 24,140 48,141 95,706 110,286 139,744
Swansea. . 6,606 7,142 7,864 8,718 8,512 8,595
Toronto. . 648,098 681,802 667,487 682,415 681,857 667,706
Weston. . 5,289 6,214 8,018 8,569 9,143 9,543
York. . 77,175 81,652 95,669 106,695 113,289 117,553
872,532 936,109 1,054,980 1,251,840 1,304,363 *1,358,028
*1956 Census of Canada

STATEMENT OF POPULATION, TAX LEVIES AND COLLECTIONS
THEREOF OF THE AREA MUNICIPALITIES COMPRISING
THE METROPOLITAN CORPORATION, 1956
Current Tax Levies
(Including Special Service Charges)
Tax Collections
as % of Current
Tax Levies
For
Purposes of
Metropolitan
Corporation
Area
Municipality Population
For Own
Purposes Total
Per
Capita Current
Current
and
Arrears
$ $ $ $ % %
East York. 69,642 3,103,651 1,565,334 4,668,985 67.04 95.12 100.25
Etobicoke. 103,621 6,504,557 3,961,403 10,465,960 101.00 94.43 97.66
Forest Hill. 19,480 1,641,668 877,624 2,519,292 129.33 96.65 98.71
Leaside. 16,538 1,187,278 924,442 2,111,720 127.69 98.37 99.94
Long Branch 10,249 483,403 229,892 713,295 69.60 89.50 95.91
Mimico 13,687 555,008 329,794 884,802 64.65 94.47 99.20
New Toronto. 11,560 745,472 539,982 1,285,454 111.20 97.44 99.76
North York. 170,110 10,096,576 5,480,245 15,576,821 91.57 90.97 98.08
Scarborough 139,744 8,148,255 3,620,715 11,768,970 84.22 89.45 97.27
Swansea. 8,595 409,726 292,451 702,177 81.70 93.72 96.82
Toronto. 667,706 49,715,632 24,515,375 74,231,007 111.17 94.16 98.73
Weston. 9,543 587,164 299,142 886,306 92.87 96.24 100.27
York 117,553 5,086,944 2,788,589 7,875,533 67.00 95.10 99.12
1,358,028 88,265,334 45,424,988 133,690,322 98.44 93.62 98.53
Note: The above figures include supplementary taxation before adjustment for tax losses.
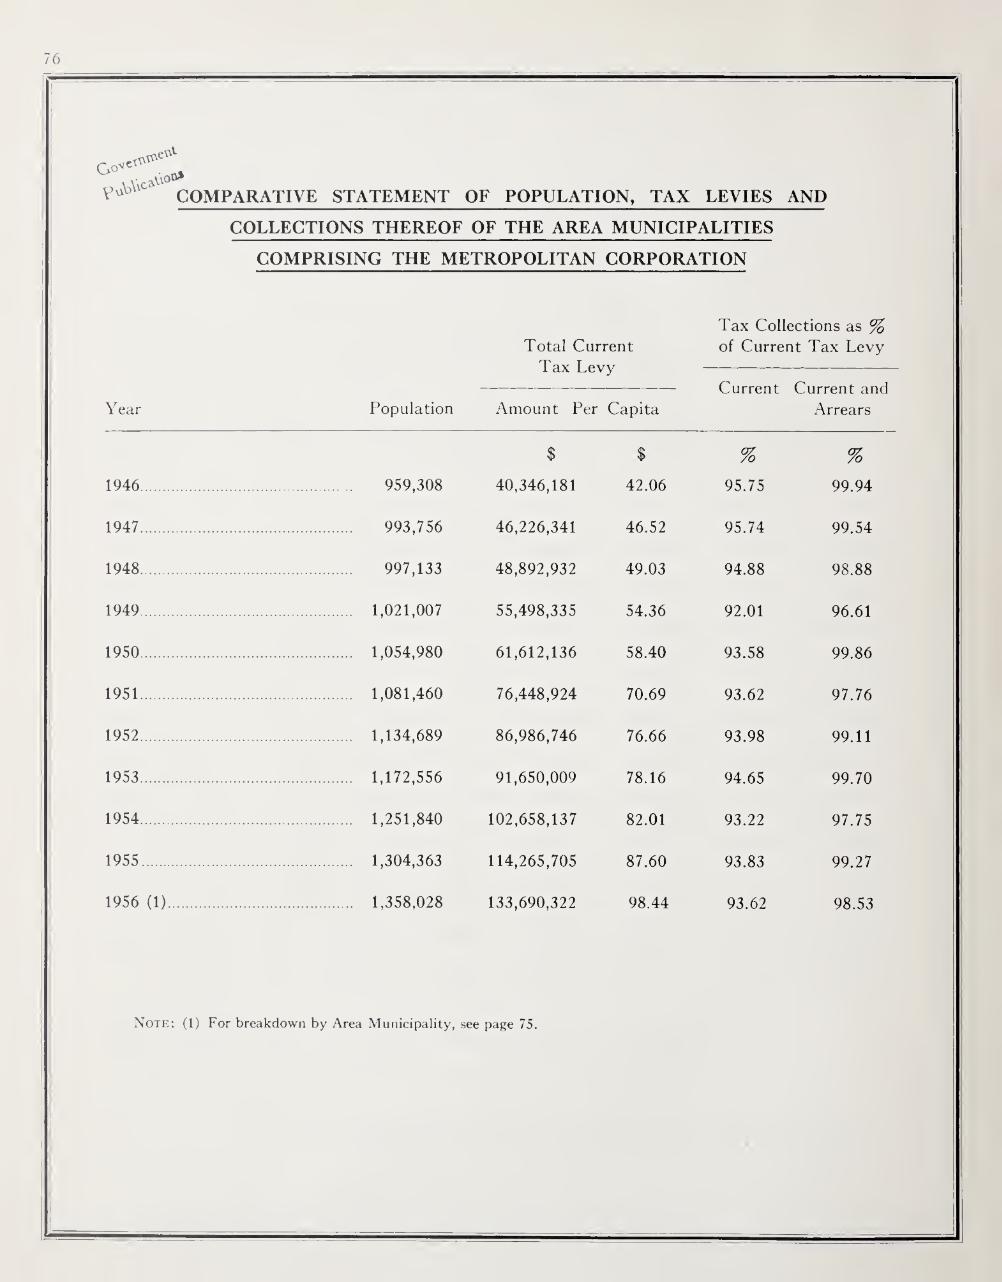
GovCt vvt
,oO>
COMPARATIVE STATEMENT OF POPULATION, TAX LEVIES AND
COLLECTIONS THEREOF OF THE AREA MUNICIPALITIES
COMPRISING THE METROPOLITAN CORPORATION
Tax Collections as % Total Current of Current Tax Levy
Tax Levy-
-Current Current and Year Population Amount Per Capita Arrears
% $ % %
1946. . 959,308 40,346,181 42.06 95.75 99.94
1947. . 993,756 46,226,341 46.52 95.74 99.54
1948. . 997,133 48,892,932 49.03 94.88 98.88
1949. . 1,021,007 55,498,335 54.36 92.01 96.61
1950. . 1,054,980 61,612,136 58.40 93.58 99.86
1951. . 1,081,460 76,448,924 70.69 93.62 97.76
1952. . 1,134,689 86,986,746 76.66 93.98 99.11
1953. . 1,172,556 91,650,009 78.16 94.65 99.70
1954. . 1,251,840 102,658,137 82.01 93.22 97.75
1955. . 1,304,363 114,265,705 87.60 93.83 99.27
1956 (1). . 1,358,028 133,690,322 98.44 93.62 98.53
Note: (1) For breakdown by Area Municipality, see page 75.

fA-- \*r
■
Fimkv vjr-* .
■" ■ -■:■ ' ■• ■,h •;,> ■ ■
-
.
■ V - ' * .i if-1 ■ , . i ?*.*»• . - ■? •••.
f, . , y./. i:g$..
&'&$■ :v TO'
■ K . .jf ... ., ' .• ; ■; • ■ ■•• . {. >•*.'.;• •-• • • J-vb
/4- :-^7- te* : : ■ .
:
.
Government
PublicaUpQf
Metropolitan Toronto. Treasury Dept.
Report of the commissioner WF
of finance wBM
■
.. ■ -M.
■ Sa ■'; j ,, .> •/ '• ••VAty,; .j
■% • ...
-■ V1'
u{-“4' * n. ■
v-ViV*’*-*
4 .y > • *■. >
J - j .
Government
Publication?
PLEASE DO NOT REMOVE
CARDS OR SLIPS FROM THIS POCKET
UNIVERSITY OF TORONTO LIBRARY
:
.
■ 15ii»p | R
.
ttfUttP •’ #..*•••> • - • • ; « .« c «
. .
’ , A'- y<>\ v ..*•
• •• ‘ . ■. ■ a • - • -.. ** »* , f :• - t ;


