19
7/26/2016 1 Vice President – Underwriting, Property AEGIS Insurance Services, Inc. GARY LADMAN PROPERTY VALUATION TECHNIQUES

7/26/2016
1
Vice President – Underwriting, Property
AEGIS Insurance Services, Inc.
G A R Y L A D M A N
P R O P E R T Y V A L U A T I O N T E C H N I Q U E S

7/26/2016
2
Program Director, Global Insurance
AES Global Insurance Company
A N D R E W B A I L L I E
P R O P E R T Y V A L U A T I O N T E C H N I Q U E S The Risk Manager’s View
P R O P E R T Y V A L U A T I O N T E C H N I Q U E S
• What was the need for an appraisal process for AES?
• The appraisal process
• Benefits derived by AES from completing and maintaining appraisals
The Risk Manager’s View

7/26/2016
3
E V O L U T I O N
Harvard Review – 1997
“AES develops and operates electric power plants all over the world and
by late 1996 has 20,000 employees. But the Corporation has no human
resources staff at Corporate Headquarters or operating facilities. Moreover,
the company has very little centralized staff at all, little or no strategic
planning, no environmental department and almost no legal staff.”
T H E A E S C O R P O R A T I O N
• AES is operating approximately 100 facilities in 22 countries
– Captive is taking primary risk on these facilities with substantial reinsurance
program supporting the captive. Insured values already $35 billion
– All policies came into the captive on an “as-is” transfer from prior arrangements
– No consistent data on development of current PD or BI values in policies
2003
Captive Formed & Global Program Bound
2004
First Risk Manager Appointed
2006
Risk Engineering Program Created
Timeline of Development of Global Insurance Program and Captive
7/26/2016
4
I M M E D I A T E N E E D S I N V A L U A T I O N
• Understand basis of current values being declared
• Ensure consistency and adequacy of reported values
• Support equitable distribution of premiums and other policy conditions
including % or $ deductibles
• Defending reputation of AES, AES Global Insurance and all insurers and
reinsurers involved in the program
• Step 1 – Initial tabletop comparisons suggested large variances of valuation
adequacy which needed to be corrected
• Step 2 – Broker study (high level / limited scope) shows variances of
-46% to +84% in outcomes comparing current values to replacement values
across fleet
P R O P E R T Y V A L U A T I O N T E C H N I Q U E S
• AA appointed in 2006 with initial schedule of 2-3 years to visit all AES key
locations in >20 countries
• Detailed reports to be provided for each location with plant and equipment
specs to agreed level of detail
• Active comparisons for similar technology across AES fleet improved
accuracy and defense of valuations
• Project grew as AES acquired and built more projects during initial phases
The American Appraisal (AA) Journey
7/26/2016
5
P R O P E R T Y V A L U A T I O N P R O C E S S
• Transparent and defendable property values across fleet allowing us to elect
RCV or other methods of valuation as appropriate
• Allows more equitable sharing of costs of risk
• Useful for NAT CAT studies and modeling
• Hugely valuable for a number of asset divestments subsequently completed
for appraised assets
• Values being updated for inflationary changes per country and also adjusted
for asset retirements and new investments
Post-Appraisal Outcomes

7/26/2016
6
Director, Insurance Services
Duff & Phelps
N I G E L P . W I L S O N ,
A S A , C E n g .
P R O P E R T Y V A L U A T I O N T E C H N I Q U E S The Valuation Perspective
P R O P E R T Y V A L U A T I O N , W H Y ?
• Are you confident that your statement of values
accurately reports all of your insurable property?
• Have you kept pace with the change in assets
within your facilities?
• Do you know where your properties’ reported
insurable values come from?
• How well was your statement of values received
when last marketed? Did you receive push back
from underwriters?
Questions that you need to ask yourself

7/26/2016
7
B E N E F I T S O F A N I N S U R A N C E A P P R A I S A L
• Determine the adequacy of insurance coverage
– Complete property listing
– Accuracy of values
– No surprises at the time of loss
• Improved risk management
– Consistent approach to quantification of risk
• Improved marketability to underwriters
• Optimizes CAT modeling performance
• Basis for equitable allocation of premiums
• Basis for preparation of a “proof-of-loss”
• Partnership – insured / insurer
I N I T I A L D I A G N O S T I C R E V I E W O F
P R O P E R T Y V A L U E S
• Appraisal
• Trended historical costs
• Standardized property values worksheets
• New construction costs
• Staff estimates
• Assistance from your broker / underwriter
• Don’t know!
What’s the source of your current property listing and values?
7/26/2016
8
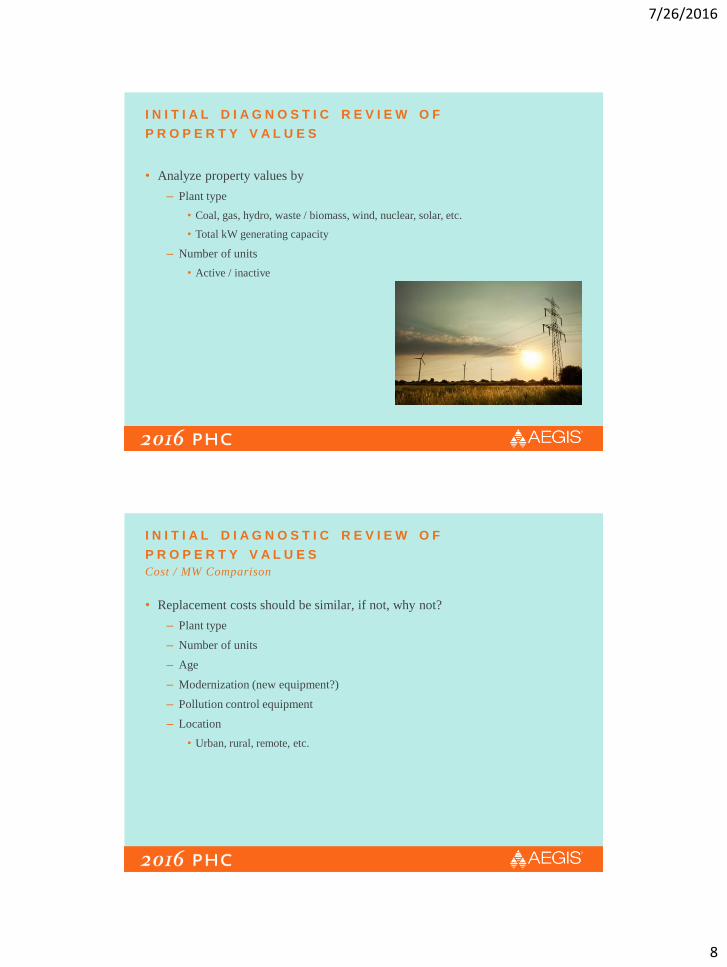
I N I T I A L D I A G N O S T I C R E V I E W O F
P R O P E R T Y V A L U E S
• Analyze property values by
– Plant type
• Coal, gas, hydro, waste / biomass, wind, nuclear, solar, etc.
• Total kW generating capacity
– Number of units
• Active / inactive
I N I T I A L D I A G N O S T I C R E V I E W O F
P R O P E R T Y V A L U E S
• Replacement costs should be similar, if not, why not?
– Plant type
– Number of units
– Age
– Modernization (new equipment?)
– Pollution control equipment
– Location
• Urban, rural, remote, etc.
Cost / MW Comparison
7/26/2016
9
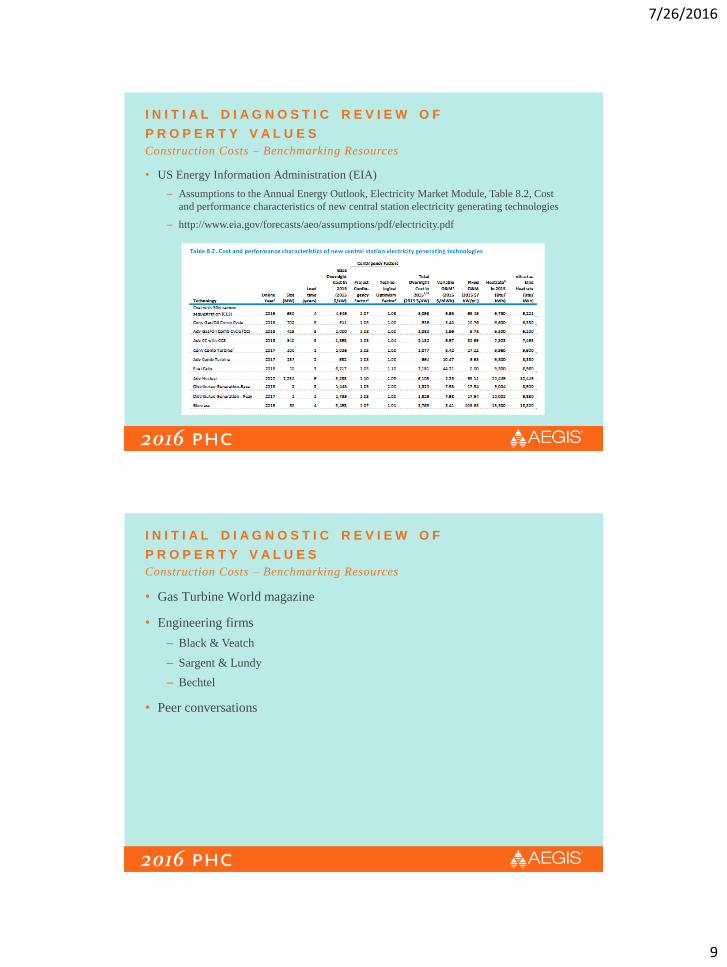
I N I T I A L D I A G N O S T I C R E V I E W O F
P R O P E R T Y V A L U E S
• US Energy Information Administration (EIA)
– Assumptions to the Annual Energy Outlook, Electricity Market Module, Table 8.2, Cost
and performance characteristics of new central station electricity generating technologies
– http://www.eia.gov/forecasts/aeo/assumptions/pdf/electricity.pdf
Construction Costs – Benchmarking Resources
I N I T I A L D I A G N O S T I C R E V I E W O F
P R O P E R T Y V A L U E S
• Gas Turbine World magazine
• Engineering firms
– Black & Veatch
– Sargent & Lundy
– Bechtel
• Peer conversations
Construction Costs – Benchmarking Resources
7/26/2016
10
C O S T T R E N D S – U S E & A B U S E
• 1986-2003 (1% to 3% per year)
• Significant construction inflation in 2004 (10.5%)
• Slowing but not back to normal in 2005 and 2006 (5.5% to 8.0%)
• A definite slowing in 2007 (2.8% to 4.7%)
• Commodities cause increases in 2008 (6.7 to 7.2%)
• Prices fall back with economy in 2009 (-7.0 to -0.3%)
• Inflation stabilizes in 2010 (-1.4% to +4.9%)
• Continued stabilization in 2011 (2.5% to 4.5%) & 2012 (1.5% to 2.8%)
and 2013 (2.2% to 3.7%)
Construction Costs Trends – United States
C O S T T R E N D S – U S E & A B U S E
• Steady in 2014 (0.5% to 2.9%) and 2015 (0.5 to 1.9%)
• Most recent 12 months sees a decline in the rate of inflation
– FM Global +1.3% (July 2015 - July 2016)
– RS Means +1.0% (April 2015 - April 2016)
– Marshall & Swift +0.1% average, range -0.2 to +0.7% (April 2015 - April 2016)
• 25% - 30% inflation in seven years
Construction Costs Trends – United States
7/26/2016
11
C O S T T R E N D S – U S E & A B U S E
100
110
120
130
140
150
160
170
180
RS Means FM Global Marshall & Swift
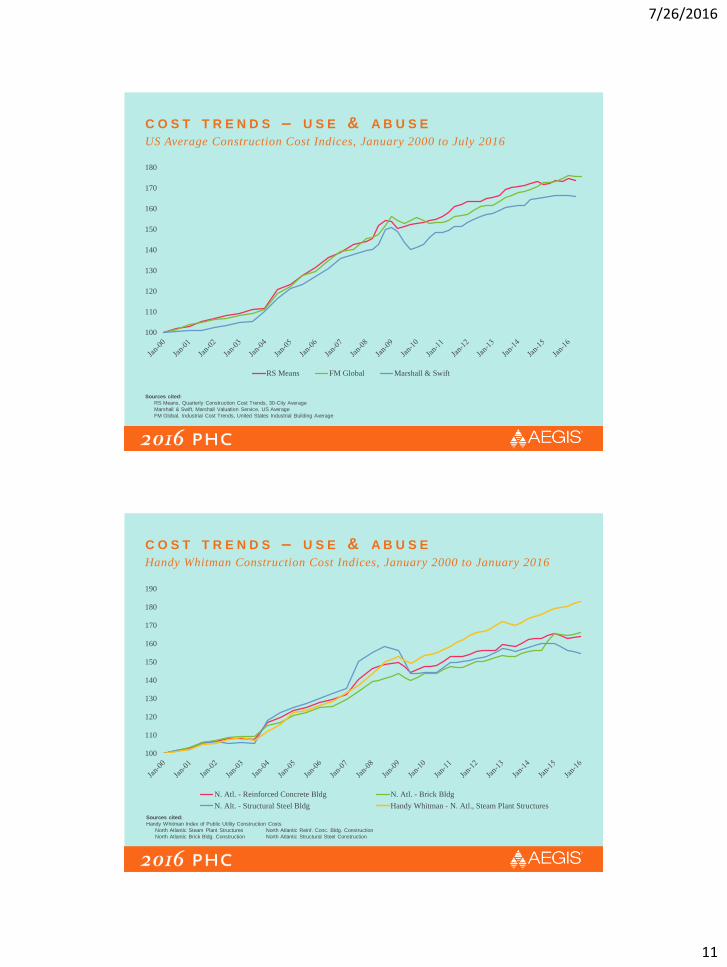
US Average Construction Cost Indices, January 2000 to July 2016
Sources cited:
RS Means, Quarterly Construction Cost Trends, 30-City Average
Marshall & Swift, Marshall Valuation Service, US Average
FM Global, Industrial Cost Trends, United States Industrial Building Average
C O S T T R E N D S – U S E & A B U S E
100
110
120
130
140
150
160
170
180
190
N. Atl. - Reinforced Concrete Bldg N. Atl. - Brick Bldg
N. Alt. - Structural Steel Bldg Handy Whitman - N. Atl., Steam Plant Structures
Handy Whitman Construction Cost Indices, January 2000 to January 2016
Sources cited:
Handy Whitman Index of Public Utility Construction Costs
North Atlantic Steam Plant Structures North Atlantic Reinf. Conc. Bldg. Construction
North Atlantic Brick Bldg. Construction North Atlantic Structural Steel Construction
7/26/2016
12
C O S T T R E N D S – U S E & A B U S E
100
110
120
130
140
150
BLS - PPI FM Global - Equipment Average M&S - Equipment Average
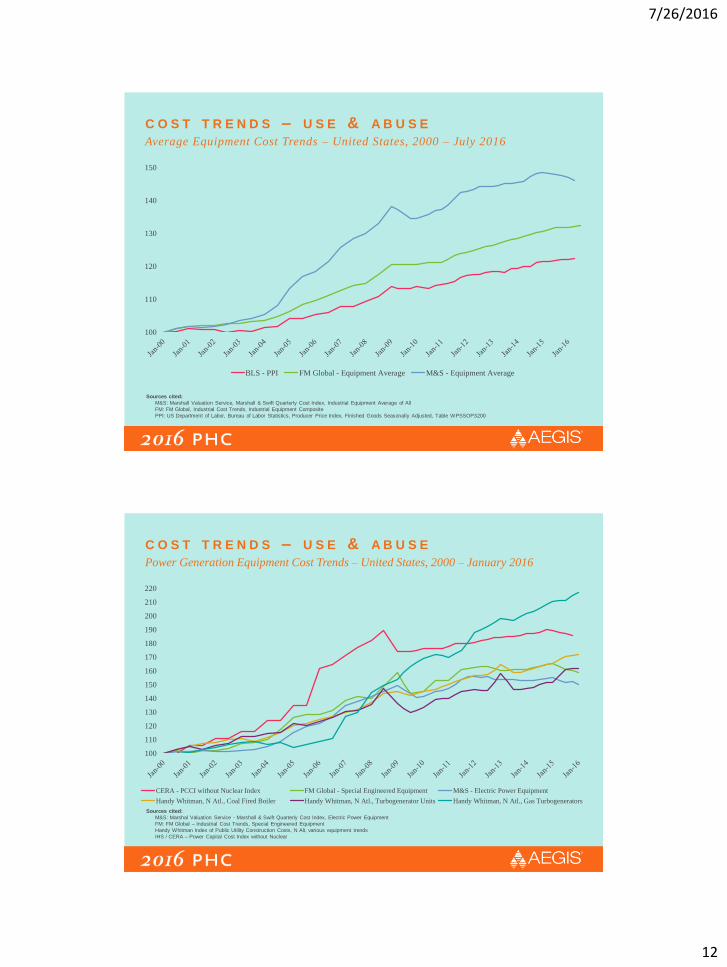
Average Equipment Cost Trends – United States, 2000 – July 2016
Sources cited:
M&S: Marshall Valuation Service, Marshall & Swift Quarterly Cost Index, Industrial Equipment Average of All
FM: FM Global, Industrial Cost Trends, Industrial Equipment Composite
PPI: US Department of Labor, Bureau of Labor Statistics, Producer Price Index, Finished Goods Seasonally Adjusted, Table WPSSOP3200
C O S T T R E N D S – U S E & A B U S E
100
110
120
130
140
150
160
170
180
190
200
210
220
CERA - PCCI without Nuclear Index FM Global - Special Engineered Equipment M&S - Electric Power Equipment
Handy Whitman, N Atl., Coal Fired Boiler Handy Whitman, N Atl., Turbogenerator Units Handy Whitman, N Atl., Gas Turbogenerators
Power Generation Equipment Cost Trends – United States, 2000 – January 2016
Sources cited:
M&S: Marshal Valuation Service - Marshall & Swift Quarterly Cost Index, Electric Power Equipment
FM: FM Global – Industrial Cost Trends, Special Engineered Equipment
Handy Whitman Index of Public Utility Construction Costs, N Alt, various equipment trends
IHS / CERA – Power Capital Cost Index without Nuclear
7/26/2016
13
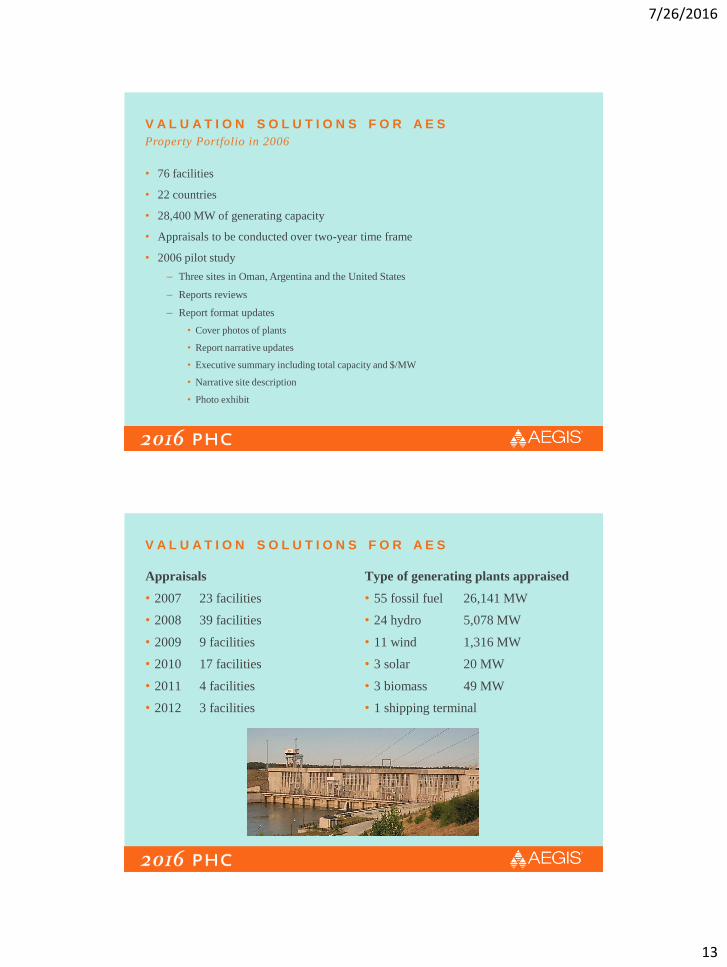
V A L U A T I O N S O L U T I O N S F O R A E S
• 76 facilities
• 22 countries
• 28,400 MW of generating capacity
• Appraisals to be conducted over two-year time frame
• 2006 pilot study
– Three sites in Oman, Argentina and the United States
– Reports reviews
– Report format updates
• Cover photos of plants
• Report narrative updates
• Executive summary including total capacity and $/MW
• Narrative site description
• Photo exhibit
Property Portfolio in 2006
V A L U A T I O N S O L U T I O N S F O R A E S
Appraisals
• 2007 23 facilities
• 2008 39 facilities
• 2009 9 facilities
• 2010 17 facilities
• 2011 4 facilities
• 2012 3 facilities
Type of generating plants appraised
• 55 fossil fuel 26,141 MW
• 24 hydro 5,078 MW
• 11 wind 1,316 MW
• 3 solar 20 MW
• 3 biomass 49 MW
• 1 shipping terminal
7/26/2016
14
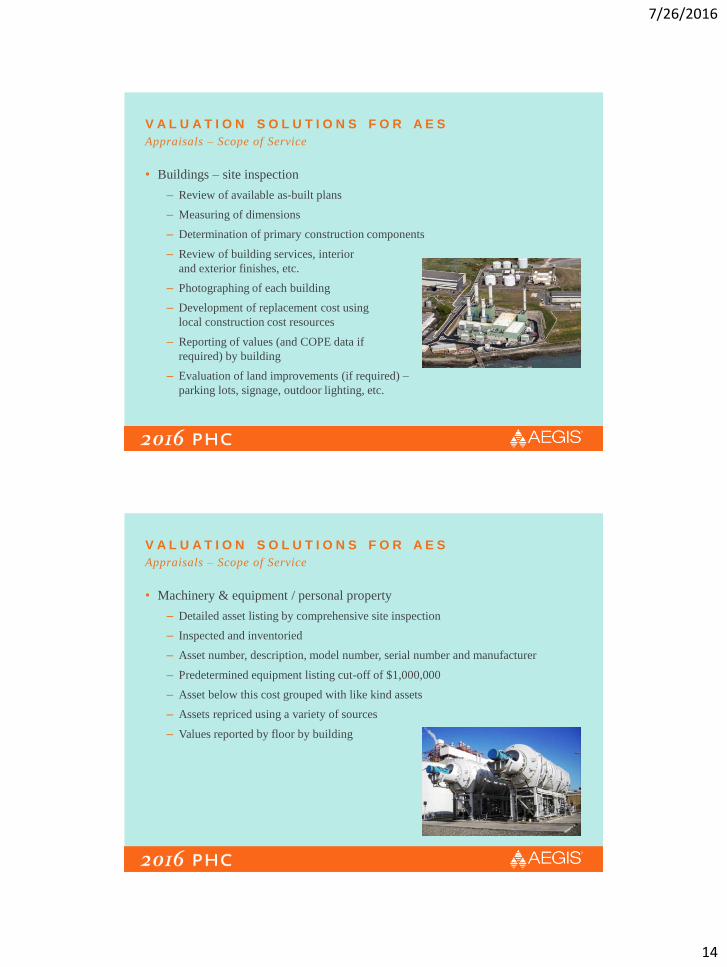
V A L U A T I O N S O L U T I O N S F O R A E S
• Buildings – site inspection
– Review of available as-built plans
– Measuring of dimensions
– Determination of primary construction components
– Review of building services, interior
and exterior finishes, etc.
– Photographing of each building
– Development of replacement cost using
local construction cost resources
– Reporting of values (and COPE data if
required) by building
– Evaluation of land improvements (if required) –
parking lots, signage, outdoor lighting, etc.
Appraisals – Scope of Service
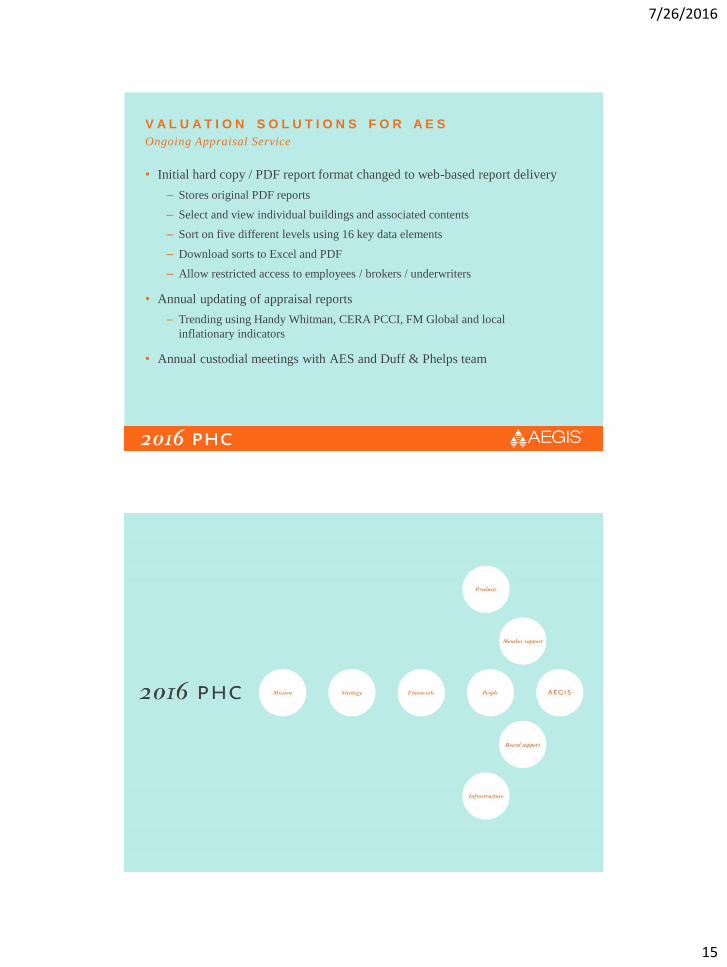
V A L U A T I O N S O L U T I O N S F O R A E S
• Machinery & equipment / personal property
– Detailed asset listing by comprehensive site inspection
– Inspected and inventoried
– Asset number, description, model number, serial number and manufacturer
– Predetermined equipment listing cut-off of $1,000,000
– Asset below this cost grouped with like kind assets
– Assets repriced using a variety of sources
– Values reported by floor by building
Appraisals – Scope of Service
7/26/2016
15
V A L U A T I O N S O L U T I O N S F O R A E S
• Initial hard copy / PDF report format changed to web-based report delivery
– Stores original PDF reports
– Select and view individual buildings and associated contents
– Sort on five different levels using 16 key data elements
– Download sorts to Excel and PDF
– Allow restricted access to employees / brokers / underwriters
• Annual updating of appraisal reports
– Trending using Handy Whitman, CERA PCCI, FM Global and local
inflationary indicators
• Annual custodial meetings with AES and Duff & Phelps team
Ongoing Appraisal Service
7/26/2016
16
Vice President – Underwriting, Property
AEGIS Insurance Services, Inc.
J U S T E N B Y R N E
P R O P E R T Y V A L U A T I O N T E C H N I Q U E S Underwriting Perspective
7/26/2016
17
P R O P E R T Y V A L U A T I O N T E C H N I Q U E S
• The basic goal behind buying insurance is to make you financially whole
following a loss. You agree to pay a fee for insurance today, causing
a certain cost to you now, in exchange for a guarantee from the insurance
company that it will bear the burden of a large but uncertain loss in
the future.
• Property valuation is important because it determines the dollar amount
that will be paid in the event of a loss. Because different types of valuation
can be used, UWs and policyholders must have the same understanding
of the policy details to clearly know what coverage is in place for premium
rating and indemnification of loss.
Underwriting Perspective
P R O P E R T Y V A L U A T I O N T E C H N I Q U E S
• Basic valuation definition / clause
– A provision in a property policy that specifies the basis of indemnification when
property is damaged or destroyed
• Actual cash value (ACV) valuation clause stipulates that the insurer will deduct
depreciation from the cost to replace the property
• Replacement cost (RC) valuation clause stipulates that there will be no deduction
for depreciation
• Property definition
– Anything that has value and includes
• Real property – i.e. buildings and permanent machinery & equipment
• Business personal property – all ‘other’ property and can be easily moved
Underwriting Perspective

7/26/2016
18
P R O P E R T Y V A L U A T I O N T E C H N I Q U E S
• Mergers / acquisitions / divestitures
– These occurrences are significant events that have meaningful impact on values
• Knowing each entity’s philosophy on valuation of the assets merged, acquired,
or divested is critical to establishment of proper valuation going forward
• New construction / additions
– Full contract value costs are a ‘marker’ that can be used for final valuation
for operational coverage upon completion
• The RCV or ACV of a project should be adjusted to accurately reflect
the final valuation at operational phase, and maybe higher or lower than
full contract value
Underwriting Perspective
P R O P E R T Y V A L U A T I O N T E C H N I Q U E S
• Schedule of values (SOV)
– UWs use the SOV to evaluate valuation based on overall experience and many of
the indices presented today
• Knowing the valuation techniques employed is reviewed at each submission, i.e.
are the values trended and by what index, last full or partial appraisal of key
assets, are values ‘flat’ year-over-year, etc.
• As a guideline; appraisals for AEGIS-specific accounts should be completed every
3-5 years, with a top end of no more than 7 years if trending methodology is
acceptable
• Engineering loss control surveys / inspections
– The AEGIS LC engineering team of management, account and field engineers all
are highly experienced and provide direct input to UWs
• Notice from our engineers upon their review that the values provided may not
align with industry / account specific experience will initiate a conversation to
fully understand and engage with our brokers & members
Underwriting Perspective

7/26/2016
19


![AEGIS: A Fast Authenticated Encryption Algorithm …2013 [31]. AEGIS-128L is introduced into this submission. 4 Chapter 2 Speci cation The speci cation of AEGIS-128, AEGIS-256 and](https://static.documents.pub/doc/80x56/5f06a2a57e708231d418f98b/aegis-a-fast-authenticated-encryption-algorithm-2013-31-aegis-128l-is-introduced.jpg)


