107
AEP & ITC Technical Study Report Proposed 765 kV Transmission Infrastructure Expansion American Electric Power & ITC Holdings July 27, 2007

AEP & ITC Technical Study Report
Proposed 765 kV Transmission
Infrastructure Expansion
American Electric Power & ITC Holdings
July 27, 2007
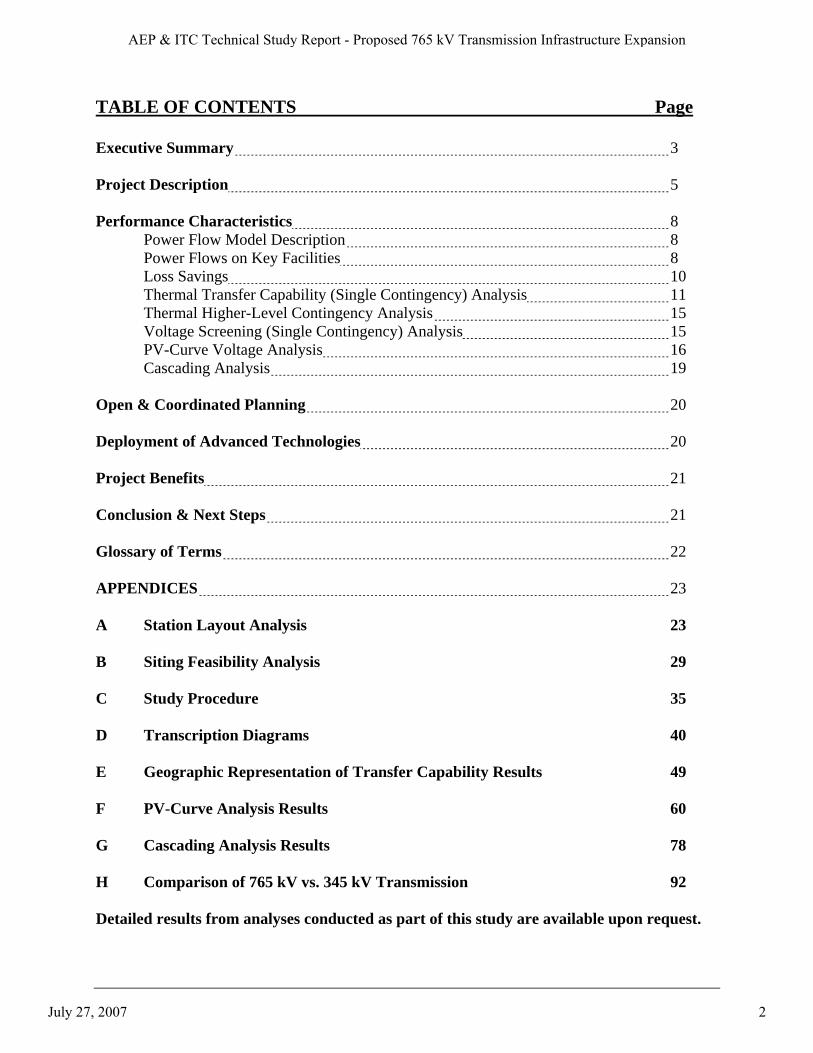
TABLE OF CONTENTS Page Executive Summary 3 Project Description 5 Performance Characteristics 8
Power Flow Model Description 8 Power Flows on Key Facilities 8 Loss Savings 10 Thermal Transfer Capability (Single Contingency) Analysis 11 Thermal Higher-Level Contingency Analysis 15 Voltage Screening (Single Contingency) Analysis 15 PV-Curve Voltage Analysis 16 Cascading Analysis 19
Open & Coordinated Planning 20 Deployment of Advanced Technologies 20 Project Benefits 21 Conclusion & Next Steps 21 Glossary of Terms 22 APPENDICES 23 A Station Layout Analysis 23 B Siting Feasibility Analysis 29 C Study Procedure 35 D Transcription Diagrams 40 E Geographic Representation of Transfer Capability Results 49 F PV-Curve Analysis Results 60 G Cascading Analysis Results 78 H Comparison of 765 kV vs. 345 kV Transmission 92 Detailed results from analyses conducted as part of this study are available upon request.
AEP & ITC Technical Study Report - Proposed 765 kV Transmission Infrastructure Expansion
July 27, 2007 2
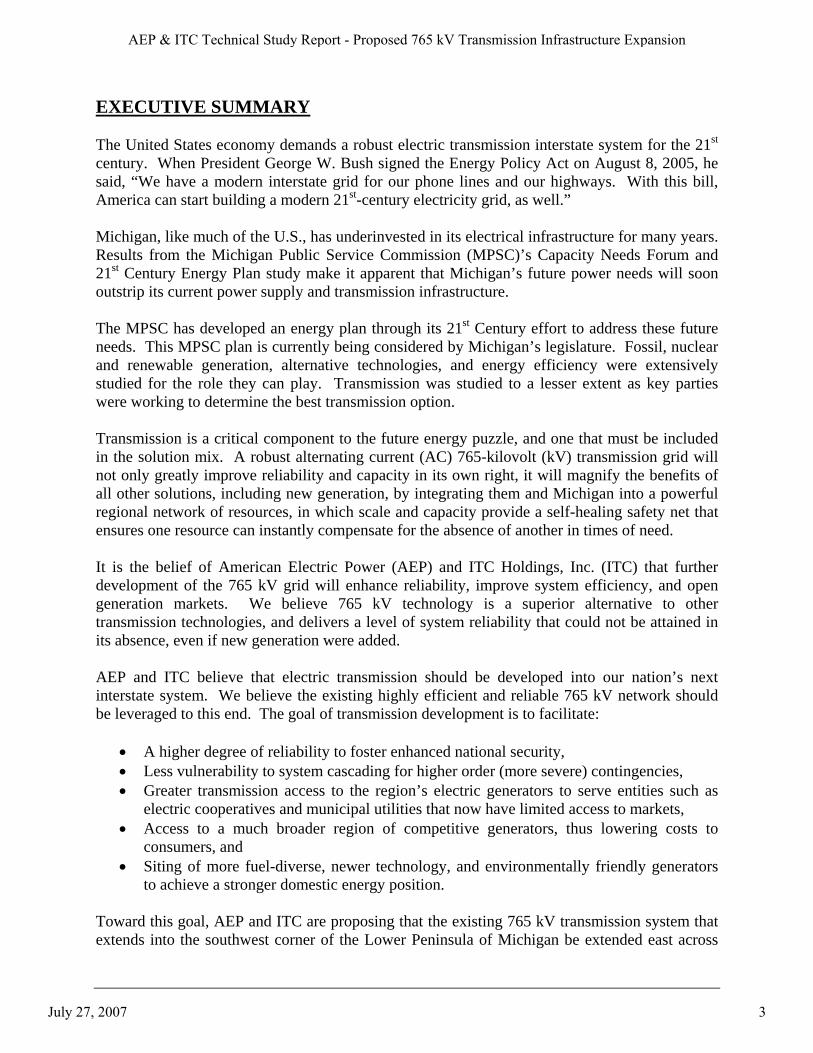
EXECUTIVE SUMMARY The United States economy demands a robust electric transmission interstate system for the 21st century. When President George W. Bush signed the Energy Policy Act on August 8, 2005, he said, “We have a modern interstate grid for our phone lines and our highways. With this bill, America can start building a modern 21st-century electricity grid, as well.” Michigan, like much of the U.S., has underinvested in its electrical infrastructure for many years. Results from the Michigan Public Service Commission (MPSC)’s Capacity Needs Forum and 21st Century Energy Plan study make it apparent that Michigan’s future power needs will soon outstrip its current power supply and transmission infrastructure. The MPSC has developed an energy plan through its 21st Century effort to address these future needs. This MPSC plan is currently being considered by Michigan’s legislature. Fossil, nuclear and renewable generation, alternative technologies, and energy efficiency were extensively studied for the role they can play. Transmission was studied to a lesser extent as key parties were working to determine the best transmission option. Transmission is a critical component to the future energy puzzle, and one that must be included in the solution mix. A robust alternating current (AC) 765-kilovolt (kV) transmission grid will not only greatly improve reliability and capacity in its own right, it will magnify the benefits of all other solutions, including new generation, by integrating them and Michigan into a powerful regional network of resources, in which scale and capacity provide a self-healing safety net that ensures one resource can instantly compensate for the absence of another in times of need. It is the belief of American Electric Power (AEP) and ITC Holdings, Inc. (ITC) that further development of the 765 kV grid will enhance reliability, improve system efficiency, and open generation markets. We believe 765 kV technology is a superior alternative to other transmission technologies, and delivers a level of system reliability that could not be attained in its absence, even if new generation were added. AEP and ITC believe that electric transmission should be developed into our nation’s next interstate system. We believe the existing highly efficient and reliable 765 kV network should be leveraged to this end. The goal of transmission development is to facilitate:
• A higher degree of reliability to foster enhanced national security, • Less vulnerability to system cascading for higher order (more severe) contingencies, • Greater transmission access to the region’s electric generators to serve entities such as
electric cooperatives and municipal utilities that now have limited access to markets, • Access to a much broader region of competitive generators, thus lowering costs to
consumers, and • Siting of more fuel-diverse, newer technology, and environmentally friendly generators
to achieve a stronger domestic energy position. Toward this goal, AEP and ITC are proposing that the existing 765 kV transmission system that extends into the southwest corner of the Lower Peninsula of Michigan be extended east across
AEP & ITC Technical Study Report - Proposed 765 kV Transmission Infrastructure Expansion
July 27, 2007 3

Michigan and south down to the existing 765 kV infrastructure in Ohio. This extension will consist of three segments comprising approximately1 700 miles of transmission infrastructure, deploy all available technological advancements to optimize corridor performance, and cost approximately2 $2.6 billion in 2007 dollars. The entire 765 kV project would be expected to take approximately eight years to build assuming three years to site and acquire rights-of-way and five years to construct. These mileage, cost, and timing estimates are based on the best information available at the time this study was conducted, and should not be viewed as being minimum or maximum values. This report outlines a three-part process to complete the project with recommendations about the order in which to complete the project segments to maximize early increases in efficiency and reliability. Specifically, construction of this 765 kV project should begin with the segment that enters Michigan from the south (the Blue Creek to Bridgewater 765 kV segment), followed by the segment that crosses Michigan from west to east (the Cook to Bridgewater 765 kV segment), and the segment that enters Michigan from the southeast (the South Canton to Bridgewater 765 kV segment). This study focused on identifying the benefits of overlaying the 765 kV project on top of the existing and currently planned lower voltage transmission system. No attempt was made as part of this study to enhance those benefits by optimizing the existing and currently planned underlying transmission system in order to get maximum utilization of the proposed 765 kV project. The benefits of the 765 kV project could be further enhanced with additional lower voltage infrastructure. The addition of the 765 kV project frees up significant amounts of transmission capacity on the existing 345 kV system throughout the Lower Peninsula of Michigan and northern Ohio. This would allow as much as 50003 megawatts (MW) of additional power to be generally transportable to and/or through these areas from more distant generation resources. In addition to providing access to a broader range of competitive generation resources, increased transfer capability through Michigan lessens the need for new generation in Michigan that would otherwise be needed to meet generation reserve requirements, while enabling more generation in Michigan to reach the MISO and PJM markets. By transporting larger amounts of power on this higher voltage system and less on the existing 345 kV system, active and reactive power losses would significantly decrease. Active power losses are projected to decrease by approximately 250 MW, while reactive losses are projected to decrease by approximately 2200 MVAR for the conditions studied. This would free up existing generation resources to both serve additional load and provide additional system voltage support. 1 All estimated line lengths are based on straight line approximations and are subject to change when actual line routing takes place. 2 All cost estimates in this report are in 2007 dollars and may vary depending on a number of factors including but not limited to; actual routing, ROW procurement, construction timing, project design, and cost of raw materials. 3 The actual increase in transfer and or import capability would depend on the location of the generation being transferred, the load being served, the severity of the contingencies being analyzed, and the type of transfer capability test being considered (i.e., thermal, voltage, or stability). For purposes of this study, transfer simulations participated all generating units within a specific study area.
AEP & ITC Technical Study Report - Proposed 765 kV Transmission Infrastructure Expansion
July 27, 2007 4

It was also shown that the addition of the 765 kV project would enhance overall system reliability by reducing the risk of cascading outages that can result from severe yet credible contingencies. This is especially true when large amounts of power are being transferred across the system. For purposes of this report, the service territories of ITCTransmission and Michigan Electric Transmission Company, both subsidiaries of ITC Holdings, Inc., will be referred to as Southeast Michigan and METC, respectively. PROJECT DESCRIPTION This section of the report provides a description and technical details on the proposed AEP & ITC 765 kV project. AEP and ITC are committed to working with MISO, PJM, neighboring transmission owners, and state and federal siting authorities to optimize the specific routing of the project.
Figure 1: Conceptual Map of Proposed AEP & ITC 765 kV Project.4
4 Line routes shown in diagram are straight line approximations. Actual line routings will be determined based on detailed siting studies to be performed subsequent to review and approval of this project under the MISO and PJM transmission expansion planning processes.
AEP & ITC Technical Study Report - Proposed 765 kV Transmission Infrastructure Expansion
July 27, 2007 5

The terminal stations for the project include one new and two existing 765 kV stations within the AEP footprint. The Cook 765 kV Station, located in Bridgman, Michigan, provides the connection at the western edge of the project along Lake Michigan. The South Canton 765 kV Station, located in Canton, Ohio, will provide the connection on the eastern edge. A new 765 kV switching station, Blue Creek, will be established along the existing Dumont-Marysville 765 kV line on the Ohio side of the Indiana-Ohio border. AEP currently owns approximately 140 acres of property at the site. This new station will terminate the central portion of this project. Within the ITC footprint in Michigan, three new 765 kV stations will be integrated into the existing 345 kV transmission network. The Bridgewater 765 kV Station will be located just west of the Detroit area, and will intersect both the existing Majestic-Milan and Majestic-Lulu 345 kV circuits. This station will connect with the Blue Creek and South Canton 765 kV Stations to the south and southeast. The Evans 765 kV Station, which will be located to the northeast of Grand Rapids, will intersect the existing 345 kV circuits originating at the Kenowa, Nelson Road, and Vergennes 345 kV Stations, and will connect to the Cook 765 kV Station to the southwest. Finally, the 765 kV project will be completed by connecting the Bridgewater and Evans 765 kV Stations to the new Sprague Creek 765 kV Station east of Lansing. Sprague Creek will integrate into the 345 kV system through the existing circuitry between the Blackfoot and Madrid 345 kV Stations. Each station is expected to be located near the existing 345 kV lines, though the exact locations have not yet been determined. Conceptual one-line diagrams for each of the proposed 765 kV stations can be found in Appendix A. Line siting information along with line length and project cost estimates can be found in Appendix B, and are summarized below. States Traversed: Michigan and Ohio. Service Territories Traversed or Near: Southeast Michigan and METC in ITC, American Electric Power (AEP), FirstEnergy (FE), and Northern Indiana Public Service Company (NIPSCO)
AEP & ITC Technical Study Report - Proposed 765 kV Transmission Infrastructure Expansion
July 27, 2007 6

Estimated Line Lengths5: Ohio Michigan Total Blue Creek – Bridgewater: 87 miles 60 miles 147 miles Cook – Evans: 138 miles 138 miles Evans – Sprague Creek: 116 miles 116 miles Sprague Creek – Bridgewater: 62 miles 62 miles South Canton – Bridgewater: 193 miles 46 miles 239 miles Total 765 kV Project: 280 miles 422 miles 702 miles Estimated Line Costs6: Total ($ millions) Blue Creek – Bridgewater: $441 Cook – Evans: $414 Evans – Sprague Creek: $348 Sprague Creek – Bridgewater: $186 South Canton – Bridgewater: $717 Total 765 kV Project: $2,106 Estimated Station Costs6: Total ($ millions) Blue Creek: $60 Bridgewater: $150 Cook: $20 Evans: $120 Sprague Creek: $110 South Canton: $60 Total 765 kV Project: $520 Recommended Construction Sequence: Based on the above information and the performance characteristics documented in the next section of this report, AEP and ITC recommend that construction of this 765 kV project should begin with the Blue Creek to Bridgewater 765 kV segment. This would be followed by the Cook to Bridgewater 765 kV segment and the South Canton to Bridgewater 765 kV segment. 5 Estimates based on straight line approximations (also refer to footnote 1 on page 2). 6 Estimates based on several assumptions that are subject to change (also refer to footnote 2 on page 2).
AEP & ITC Technical Study Report - Proposed 765 kV Transmission Infrastructure Expansion
July 27, 2007 7
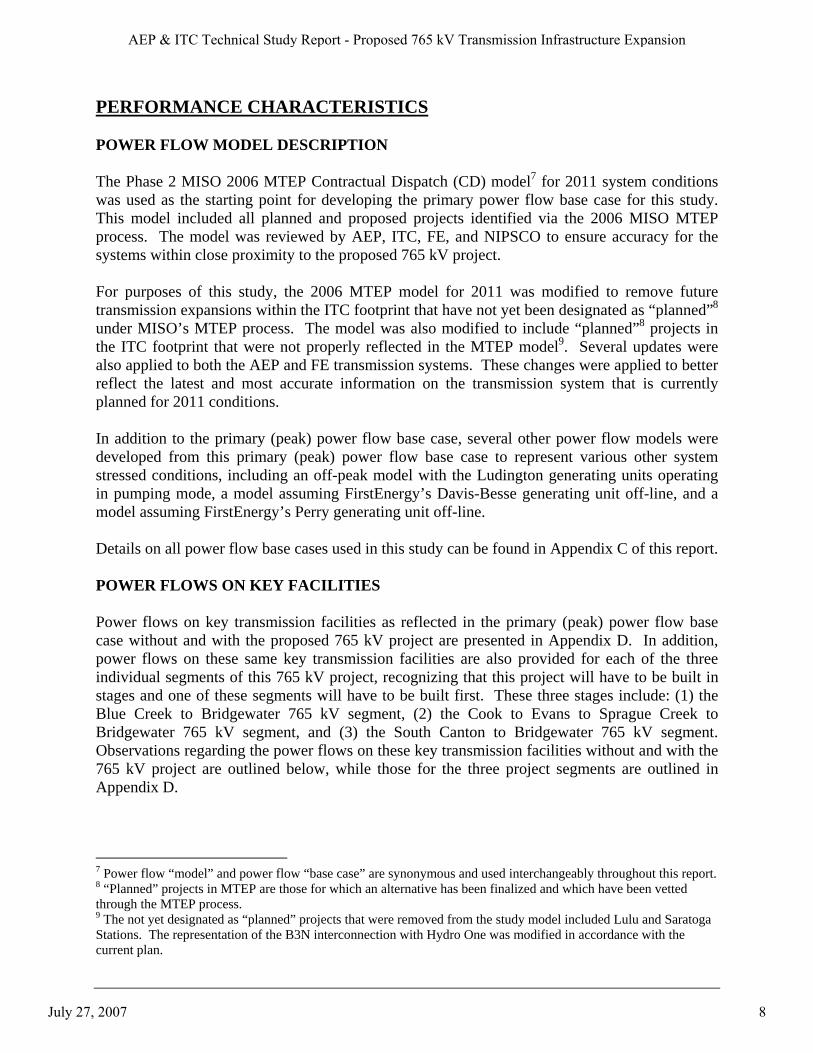
PERFORMANCE CHARACTERISTICS POWER FLOW MODEL DESCRIPTION The Phase 2 MISO 2006 MTEP Contractual Dispatch (CD) model7 for 2011 system conditions was used as the starting point for developing the primary power flow base case for this study. This model included all planned and proposed projects identified via the 2006 MISO MTEP process. The model was reviewed by AEP, ITC, FE, and NIPSCO to ensure accuracy for the systems within close proximity to the proposed 765 kV project. For purposes of this study, the 2006 MTEP model for 2011 was modified to remove future transmission expansions within the ITC footprint that have not yet been designated as “planned”8 under MISO’s MTEP process. The model was also modified to include “planned”8 projects in the ITC footprint that were not properly reflected in the MTEP model9. Several updates were also applied to both the AEP and FE transmission systems. These changes were applied to better reflect the latest and most accurate information on the transmission system that is currently planned for 2011 conditions. In addition to the primary (peak) power flow base case, several other power flow models were developed from this primary (peak) power flow base case to represent various other system stressed conditions, including an off-peak model with the Ludington generating units operating in pumping mode, a model assuming FirstEnergy’s Davis-Besse generating unit off-line, and a model assuming FirstEnergy’s Perry generating unit off-line. Details on all power flow base cases used in this study can be found in Appendix C of this report. POWER FLOWS ON KEY FACILITIES Power flows on key transmission facilities as reflected in the primary (peak) power flow base case without and with the proposed 765 kV project are presented in Appendix D. In addition, power flows on these same key transmission facilities are also provided for each of the three individual segments of this 765 kV project, recognizing that this project will have to be built in stages and one of these segments will have to be built first. These three stages include: (1) the Blue Creek to Bridgewater 765 kV segment, (2) the Cook to Evans to Sprague Creek to Bridgewater 765 kV segment, and (3) the South Canton to Bridgewater 765 kV segment. Observations regarding the power flows on these key transmission facilities without and with the 765 kV project are outlined below, while those for the three project segments are outlined in Appendix D.
7 Power flow “model” and power flow “base case” are synonymous and used interchangeably throughout this report. 8 “Planned” projects in MTEP are those for which an alternative has been finalized and which have been vetted through the MTEP process. 9 The not yet designated as “planned” projects that were removed from the study model included Lulu and Saratoga Stations. The representation of the B3N interconnection with Hydro One was modified in accordance with the current plan.
AEP & ITC Technical Study Report - Proposed 765 kV Transmission Infrastructure Expansion
July 27, 2007 8

Observations - Peak Base Case without 765 kV Project The strong reliance on the existing 345 kV network to bring outside resources into the Southeastern area of Michigan (and/or for further delivery to Ontario) is evident:
• More than 1300 MW is flowing over the four AEP-ITC ties. • Nearly 1200 MW is flowing over the three FE-ITC ties. • More than 1900 MW is flowing across the two main west-east intra-Michigan 345 kV
corridors. Observations - Peak Base Case with 765 kV Project New 765 kV facilities:
• The new 765 kV ties carry almost all of the flow into Southeast Michigan from the south. • Flows are nearly evenly divided between the three new 765 kV ties, with the line from
the proposed Blue Creek 765 kV Station in AEP to the proposed Bridgewater 765 kV Station in ITC carrying the most power; and the line from the existing South Canton 765 kV Station in AEP to the proposed Bridgewater 765 kV Station in ITC carrying the least.
• The new cross-state 765 kV path carries about 35% of the west-east power flow within Michigan.
Existing 345 kV facilities:
• Power flow over the four AEP-ITC ties is reduced to nearly zero MW, as the power demanded is now carried over the new 765 kV system.
• Power flow over the three FE-ITC ties reverses to about 100 MW toward FE. • Power flow over the west-to-east intra-Michigan corridor is reduced by more than 50% to
760 MW. • Power flow over the Ontario-ITC interface increased by 260 MW toward Ontario
reflecting the ability of the phase shifters to achieve their modeled flow targets as compared to the peak base case without the 765 kV project.
Figure 2 below graphically represents the changes in power flows on these key transmission facilities related to the addition of the proposed 765 kV project.
AEP & ITC Technical Study Report - Proposed 765 kV Transmission Infrastructure Expansion
July 27, 2007 9

Figure 2 –Change in Power Flows on Key Transmission Facilities Without vs. With 765 kV
Project (Peak Base Case as Described Above)
LOSS SAVINGS The addition of the 765 kV project significantly reduces both active and reactive power losses throughout the Midwest. Table 1 below depicts the loss savings at peak load conditions that were observed with the addition of the project. Based on the specific dispatch and topology of the model utilized, the proposed 765 kV project introduces about 250 MW (active) and 2200 MVAR (reactive) loss savings at peak10 load conditions in the Eastern Interconnection.
10 Actual peak time loss savings would vary depending on actual system dispatch and physical topology. The loss savings documented in this report are considered conservative, since the starting point power flow base case contained a minimal amount of transfers.
AEP & ITC Technical Study Report - Proposed 765 kV Transmission Infrastructure Expansion
July 27, 2007 10

AREA Area Name MW MVAR MW MVAR DELTA MWDELTA MVAR
202 FIRSTENE 367.5 5193.8 424.8 5706.7 57.3 512.9205 AEP 836.7 10359.1 923.3 11265.5 86.6 906.4208 CIN 560.5 6501.3 569.7 6588.1 9.2 86.8209 DPL 129.7 1460.3 137 1533.7 7.3 73.4217 NIPS 55.3 529.4 65.7 588.9 10.4 59.6218 METC 434.3 4739.9 511.1 5661.4 76.8 921.5219 ITC 368.3 4950.2 374.3 5013.8 6 63.6291 New 765 13.7 336.6 0 0 -13.7 -336.6292 New 345 2 186.4 0 0 -2 -186.4
Total for Selected Areas 237.9 2101.2Total for All Areas 244 2206
Losses for System with 765 kV Project
Losses for System as Planned Loss Savings
Table 1 – Loss Savings Under Primary Peak Base Case Conditions
THERMAL11 TRANSFER CAPABILITY (SINGLE CONTINGENCY) ANALYSIS There are several ways in which transfer capability results can be illustrated. Tabular results allow for significant amounts of information to be reviewed, but tend to be somewhat tedious to analyze. Even so, tabular results have been compiled for the transfer capability analysis performed as part of this study and are available upon request. From these tabular results, maps were developed in order to geographically identify each limit up to a predefined transfer test level. From these maps, it is clear that the addition of the 765 kV project significantly increases transfer capabilities throughout the area, including in the Lower Peninsula of Michigan, in northern Ohio, and in northern Indiana. Exhibits that can be found in Appendix E help to identify which of these segments should be built first, based on the various transfer limits both without and with the 765 kV project. Each map identifies the transfer capability limits for the specified transfer scenario. Limits shown in black represent the limits with the system “as currently planned,” that is, not including the proposed 765 kV project. Limits underlined in red represent limits for system conditions with either the 765 kV project in its entirety or with any of the individual project segments. In addition, limits boxed in blue represent limits that were not materially impacted by the addition of the proposed 765 kV project or any of its segments. Where several limits were located in close geographic proximity, the lowest limit is shown, but flagged with an asterisk to indicate that higher limits also exist in the area. Negative limits signify overloads that exist prior to the simulation of any transfers. Figures 3 and 4 below show the transfer capability results for the MISO to Southeast Michigan transfer scenario without and with the 765 kV project under primary (peak) power flow base case conditions.
11 “Thermal” relates to the ability of transmission lines to carry power. Therefore, “thermal transfer limits” relate to the limitations placed on transfers by the ability of these lines to carry that power. Transfers can also be limited by other factors such as system voltage and stability performance.
AEP & ITC Technical Study Report - Proposed 765 kV Transmission Infrastructure Expansion
July 27, 2007 11

400*
1400*
2100*
2300*
2300*
2300
2400*
2600
2800
2900*
3100*
3300
3400*
3800*
2900
4100
4100
4100
4100
4200
4300
4600
5400
3400*
400
200
400
Figure 3 – Transfer Capability Limits Without 765 kV Project Under Peak Base Case
Figure 4 – Transfer Capability Limits With 765 kV Project Under Peak Base Case
AEP & ITC Technical Study Report - Proposed 765 kV Transmission Infrastructure Expansion
July 27, 2007 12

Geographical representation of the results allows for a clear visual explanation of the impacts the proposed 765 kV project would have on the transfer capabilities studied. While there were a few sending end limits12 that were not appreciably impacted by the project, there were a considerable number of limits within the Lower Peninsula of Michigan, Ohio, and Indiana that were significantly impacted by the 765 kV project and each of its three individual project segments. This is easily recognized when looking at the maps in Appendix E. The primary focus of this part of the study was to analyze the impact of the 765 kV project on import capability into the Lower Peninsula of Michigan; however various other transfer scenarios were also analyzed as identified in Table 2 below.
Source Subsystems
METC WUMS MAIN TVA VACAR MAAC MISO PJM PJM East
PJM West
All Outside World
Sink SubsystemsS.E. MI X X X X X X X X X X XMECS X X X X X X X X X XFE X X X X X X X X X XNIPS X X X X X X X X X XS.E. MI & FE X X X X X X X X X XMECS & FE X X X X X X X X X XWUMS X XMAIN XTVA XVACAR XMAAC X XPJM East XPJM West X
Table 2 – Transfer Capability Scenarios Defined as Source/Sink Pairs Transfers into the Southeast Michigan Footprint Figures E1 through E5 in Appendix E give a good indication of both the magnitude and location for the various limiting facilities when transferring power into the Southeast Michigan footprint. As stated above, limits at the sending ends of the various transfers were not drastically impacted by the addition of the proposed 765 kV project; however, a significant number of limits in southern Michigan and northern Ohio were appreciably improved by the addition of the overall 765 kV project, and to a lesser, but still significant amount, by any of its three individual project segments. Figures E1 through E4 in Appendix E were all developed from the MISO to Southeast Michigan transfer scenario; however, each figure compares transfer capabilities for a different starting segment of the 765 kV project to those identified under peak base case conditions (without the 12 “Sending end limits” are those limits near the source of the transfer and are related to the transmission system being able to move the modeled transfer out of the area where generation was increased to simulate a transfer.
AEP & ITC Technical Study Report - Proposed 765 kV Transmission Infrastructure Expansion
July 27, 2007 13
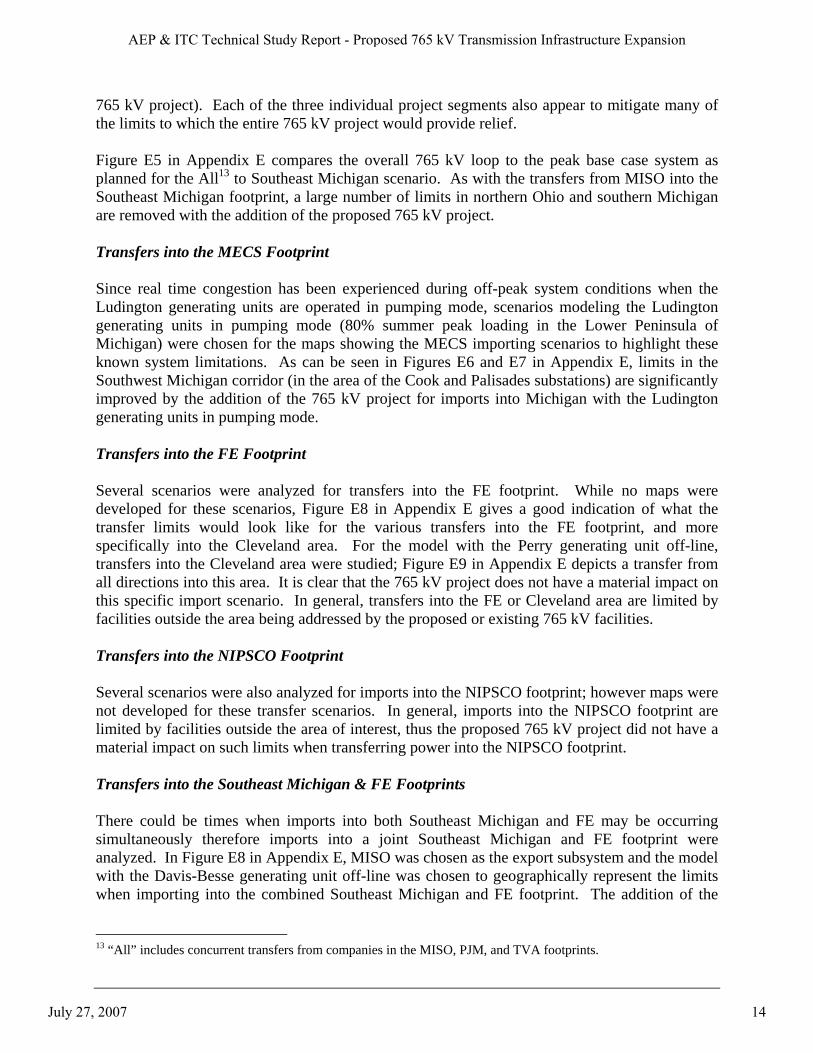
765 kV project). Each of the three individual project segments also appear to mitigate many of the limits to which the entire 765 kV project would provide relief. Figure E5 in Appendix E compares the overall 765 kV loop to the peak base case system as planned for the All13 to Southeast Michigan scenario. As with the transfers from MISO into the Southeast Michigan footprint, a large number of limits in northern Ohio and southern Michigan are removed with the addition of the proposed 765 kV project. Transfers into the MECS Footprint Since real time congestion has been experienced during off-peak system conditions when the Ludington generating units are operated in pumping mode, scenarios modeling the Ludington generating units in pumping mode (80% summer peak loading in the Lower Peninsula of Michigan) were chosen for the maps showing the MECS importing scenarios to highlight these known system limitations. As can be seen in Figures E6 and E7 in Appendix E, limits in the Southwest Michigan corridor (in the area of the Cook and Palisades substations) are significantly improved by the addition of the 765 kV project for imports into Michigan with the Ludington generating units in pumping mode. Transfers into the FE Footprint Several scenarios were analyzed for transfers into the FE footprint. While no maps were developed for these scenarios, Figure E8 in Appendix E gives a good indication of what the transfer limits would look like for the various transfers into the FE footprint, and more specifically into the Cleveland area. For the model with the Perry generating unit off-line, transfers into the Cleveland area were studied; Figure E9 in Appendix E depicts a transfer from all directions into this area. It is clear that the 765 kV project does not have a material impact on this specific import scenario. In general, transfers into the FE or Cleveland area are limited by facilities outside the area being addressed by the proposed or existing 765 kV facilities. Transfers into the NIPSCO Footprint Several scenarios were also analyzed for imports into the NIPSCO footprint; however maps were not developed for these transfer scenarios. In general, imports into the NIPSCO footprint are limited by facilities outside the area of interest, thus the proposed 765 kV project did not have a material impact on such limits when transferring power into the NIPSCO footprint. Transfers into the Southeast Michigan & FE Footprints There could be times when imports into both Southeast Michigan and FE may be occurring simultaneously therefore imports into a joint Southeast Michigan and FE footprint were analyzed. In Figure E8 in Appendix E, MISO was chosen as the export subsystem and the model with the Davis-Besse generating unit off-line was chosen to geographically represent the limits when importing into the combined Southeast Michigan and FE footprint. The addition of the
13 “All” includes concurrent transfers from companies in the MISO, PJM, and TVA footprints.
AEP & ITC Technical Study Report - Proposed 765 kV Transmission Infrastructure Expansion
July 27, 2007 14

765 kV project helps to relieve many limits in southern Michigan and northern Ohio when simultaneously transferring power into southeastern Michigan and northern Ohio. Transfers into the MECS & FE Footprints Imports into the combined MECS and FE footprints have similar limits as those for the MECS, Southeast Michigan, and combined Southeast Michigan and FE import scenarios. Maps were not developed for transfer scenarios into the combined MECS and FE footprints, since the addition of the 765 kV project or any of its three segments had similar impacts on limits when transferring power into the combined MECS and FE zones as when transferring power into the MECS, Southeast Michigan, and combined Southeast Michigan and FE zones. West-to-East and East-to-West Transfers Cross-system transfers were also analyzed. These included transfers from MAAC to MAIN, MAIN to MAAC, PJM West to PJM East, and PJM East to PJM West. Again, the addition of the 765 kV project did not have much of an impact on the limits to these transfers as they fall outside the area of interest, since most of the limiting facilities were either to the east or west of the proposed and existing 765 kV facilities. THERMAL HIGHER-LEVEL CONTINGENCY ANALYSIS Thermal higher-level14 contingency analysis was also performed for facilities throughout the Midwest. Overloads observed in the various power flow base cases were compared to those found after the addition of the 765 kV project or any of its three segments. Many of the same limits that were identified under the transfer capability analysis were also identified under this higher-level contingency analysis. In addition, while several higher-level contingency overloads were reduced by the addition of the 765 kV project, there were also some higher-level contingency violations that were aggravated by the project. It is recognized, however, that as with transfer capability results, other lower voltage projects may be required to support the off-ramps that would be created by the proposed 765 kV facilities to ensure system optimization. Except for a few higher-level contingency conditions analyzed under the PV-curve analysis and cascading analysis, this study did not address the performance of the system for higher-level contingencies under conditions other than those reflected in the power flow base cases. VOLTAGE SCREENING (SINGLE CONTINGENCY) ANALYSIS Steady-state voltage performance was monitored for all single contingencies (loss of any one generator, transmission circuit, or transformer) considered under the transfer capability analysis. Positive impacts on system voltage performance were observed throughout the area of interest, and were consistent with the improvements noted under the transfer capability analysis. These improvements in voltage and reactive performance can be best illustrated through the various PV-curve scenarios that are addressed in the next section of this report.
14 Higher level contingency analysis consisted of NERC Category C contingencies, including the loss of a bus section, circuit breaker, two circuits on a common tower, or any two circuits sequentially (with manual system adjustments permitted prior to the simulated loss of the second circuit).
AEP & ITC Technical Study Report - Proposed 765 kV Transmission Infrastructure Expansion
July 27, 2007 15

While shunt reactors will be required for most of the 765 kV circuits that comprise this project, further studies will need to be performed to properly identify and size any voltage regulating equipment that may be required. This design issue was outside the scope of this study. PV-CURVE VOLTAGE ANALYSIS In order to evaluate the impact of the proposed 765 kV project on voltage performance, fifteen scenarios known to result in significant stress on the transmission system were analyzed. A PV-curve was created for each scenario showing the relationship between observed voltage level and increasing levels of power transfers. The base cases used in this analysis were identical to those used in the thermal analysis, and voltage performance results without and with the proposed project were compared. Voltage limits for power transfers are determined by the transfer level where the observed voltage reaches the minimum voltage limit as defined by the applicable transmission owner. The decrease in generator dynamic reactive reserves15 located in the area surrounding the monitored station was also tracked and plotted against increasing transfer level. This section of the report discusses the selection of PV-curve scenarios analyzed and provides a summary of results. The complete set of PV-curve scenarios can be found in Appendix F. Selection of Scenarios All fifteen PV-curve scenarios selected for analysis involve higher level (NERC Category C or D) type contingencies. Each scenario typically involves one or more generating unit outage combined with one or more transmission facility outage. One scenario involves two generating unit outages only, with no transmission facility outages. Two scenarios involve double circuit tower outages only, with no generating unit outages. For each PV-curve scenario, an inter-regional power transfer was superimposed on the selected base case after the contingencies were modeled. Nine of the scenarios selected have been historically included in seasonal assessments performed by ReliabilityFirst or its ECAR predecessor. A few of these scenarios required some modification to adapt them to anticipated 2011 summer conditions. The remaining six scenarios were selected based on the experience of the transmission owners participating in this study. Most of the PV-curve scenarios can be grouped according to the location of the monitored and outaged facilities relative to the transmission network interfaces considered in this study. These interfaces include Indiana-Michigan, Ohio-Michigan, and West Michigan-East Michigan. A few scenarios analyzed voltage performance at locations removed from one of these interfaces but which were affected by inter-regional transfers. The latter were selected to determine effects of the proposed 765 kV project on facilities it was not designed to address but which it may impact.
15 Dynamic reactive reserves are a measure of the amount of reactive capability of generating units in an area that is not being utilized. Dynamic reactive reserves are used as an indicative measure of the ability of the generating units in an area to provide adequate voltage support under changing system conditions.
AEP & ITC Technical Study Report - Proposed 765 kV Transmission Infrastructure Expansion
July 27, 2007 16
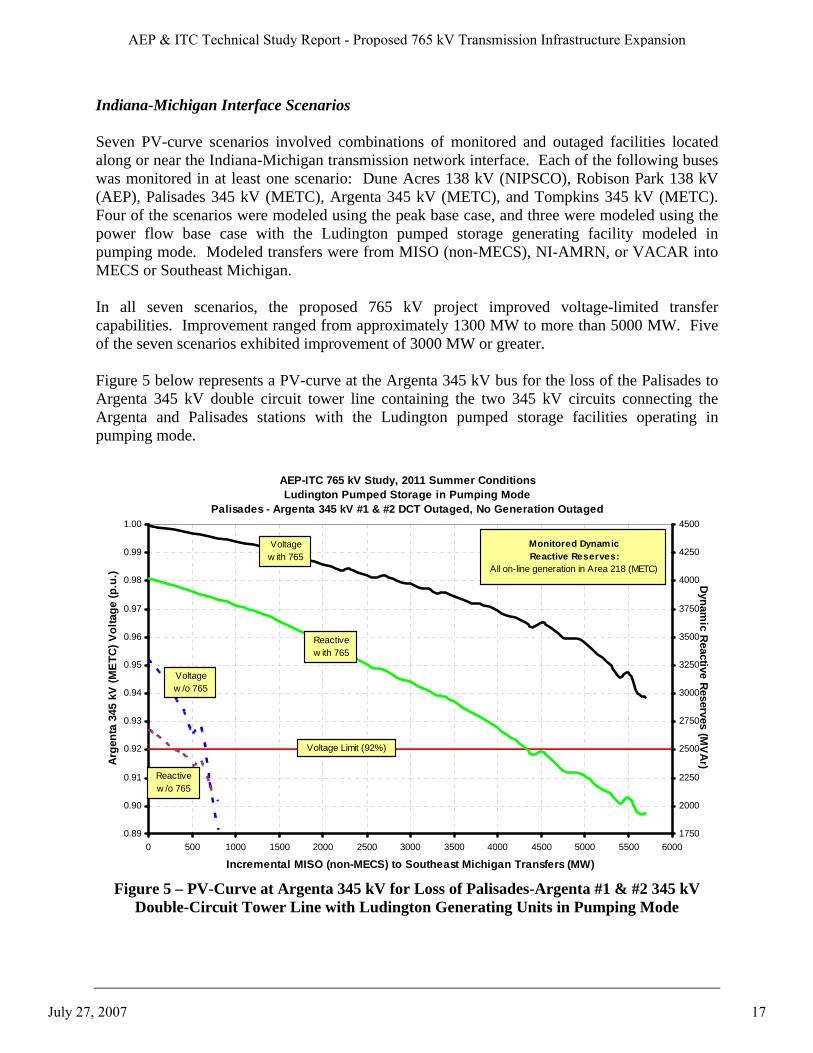
Indiana-Michigan Interface Scenarios Seven PV-curve scenarios involved combinations of monitored and outaged facilities located along or near the Indiana-Michigan transmission network interface. Each of the following buses was monitored in at least one scenario: Dune Acres 138 kV (NIPSCO), Robison Park 138 kV (AEP), Palisades 345 kV (METC), Argenta 345 kV (METC), and Tompkins 345 kV (METC). Four of the scenarios were modeled using the peak base case, and three were modeled using the power flow base case with the Ludington pumped storage generating facility modeled in pumping mode. Modeled transfers were from MISO (non-MECS), NI-AMRN, or VACAR into MECS or Southeast Michigan. In all seven scenarios, the proposed 765 kV project improved voltage-limited transfer capabilities. Improvement ranged from approximately 1300 MW to more than 5000 MW. Five of the seven scenarios exhibited improvement of 3000 MW or greater. Figure 5 below represents a PV-curve at the Argenta 345 kV bus for the loss of the Palisades to Argenta 345 kV double circuit tower line containing the two 345 kV circuits connecting the Argenta and Palisades stations with the Ludington pumped storage facilities operating in pumping mode.
AEP-ITC 765 kV Study, 2011 Summer ConditionsLudington Pumped Storage in Pumping Mode
Palisades - Argenta 345 kV #1 & #2 DCT Outaged, No Generation Outaged
0.89
0.90
0.91
0.92
0.93
0.94
0.95
0.96
0.97
0.98
0.99
1.00
0 500 1000 1500 2000 2500 3000 3500 4000 4500 5000 5500 6000
Incremental MISO (non-MECS) to Southeast Michigan Transfers (MW)
1750
2000
2250
2500
2750
3000
3250
3500
3750
4000
4250
4500
Dynam
ic Reactive R
eserves (MV
Ar)
Voltage Limit (92%)
Monitored DynamicReactive Reserves:
All on-line generation in Area 218 (METC)
Reactivew ith 765
Reactivew /o 765
Voltagew /o 765
Voltagew ith 765
Arge
nta
345
kV (M
ETC
) Vol
tage
(p.u
.)
Figure 5 – PV-Curve at Argenta 345 kV for Loss of Palisades-Argenta #1 & #2 345 kV
Double-Circuit Tower Line with Ludington Generating Units in Pumping Mode
AEP & ITC Technical Study Report - Proposed 765 kV Transmission Infrastructure Expansion
July 27, 2007 17
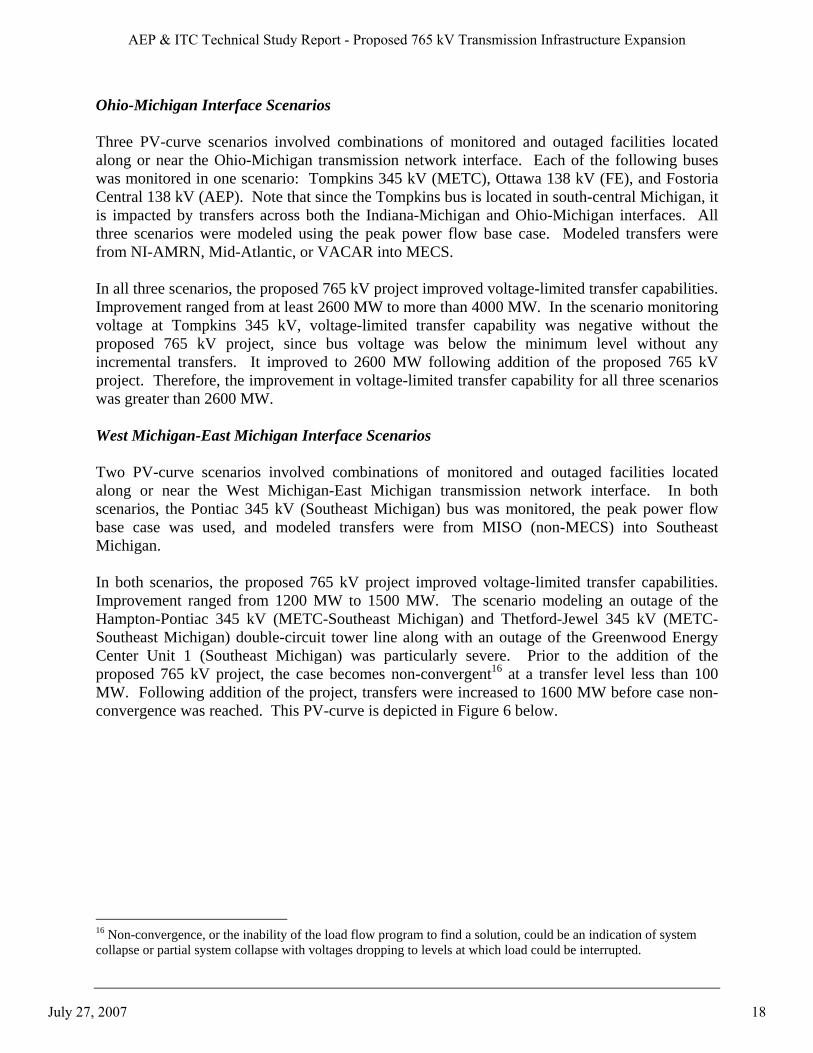
Ohio-Michigan Interface Scenarios Three PV-curve scenarios involved combinations of monitored and outaged facilities located along or near the Ohio-Michigan transmission network interface. Each of the following buses was monitored in one scenario: Tompkins 345 kV (METC), Ottawa 138 kV (FE), and Fostoria Central 138 kV (AEP). Note that since the Tompkins bus is located in south-central Michigan, it is impacted by transfers across both the Indiana-Michigan and Ohio-Michigan interfaces. All three scenarios were modeled using the peak power flow base case. Modeled transfers were from NI-AMRN, Mid-Atlantic, or VACAR into MECS. In all three scenarios, the proposed 765 kV project improved voltage-limited transfer capabilities. Improvement ranged from at least 2600 MW to more than 4000 MW. In the scenario monitoring voltage at Tompkins 345 kV, voltage-limited transfer capability was negative without the proposed 765 kV project, since bus voltage was below the minimum level without any incremental transfers. It improved to 2600 MW following addition of the proposed 765 kV project. Therefore, the improvement in voltage-limited transfer capability for all three scenarios was greater than 2600 MW. West Michigan-East Michigan Interface Scenarios Two PV-curve scenarios involved combinations of monitored and outaged facilities located along or near the West Michigan-East Michigan transmission network interface. In both scenarios, the Pontiac 345 kV (Southeast Michigan) bus was monitored, the peak power flow base case was used, and modeled transfers were from MISO (non-MECS) into Southeast Michigan. In both scenarios, the proposed 765 kV project improved voltage-limited transfer capabilities. Improvement ranged from 1200 MW to 1500 MW. The scenario modeling an outage of the Hampton-Pontiac 345 kV (METC-Southeast Michigan) and Thetford-Jewel 345 kV (METC-Southeast Michigan) double-circuit tower line along with an outage of the Greenwood Energy Center Unit 1 (Southeast Michigan) was particularly severe. Prior to the addition of the proposed 765 kV project, the case becomes non-convergent16 at a transfer level less than 100 MW. Following addition of the project, transfers were increased to 1600 MW before case non-convergence was reached. This PV-curve is depicted in Figure 6 below.
16 Non-convergence, or the inability of the load flow program to find a solution, could be an indication of system collapse or partial system collapse with voltages dropping to levels at which load could be interrupted.
AEP & ITC Technical Study Report - Proposed 765 kV Transmission Infrastructure Expansion
July 27, 2007 18

AEP-ITC 765 kV Study, 2011 Summer ConditionsHampton - Pontiac 345 kV & Thetford - Jewel 345 kV DCT Outaged,
Greenwood 1 Outaged
0.915
0.920
0.925
0.930
0.935
0.940
0.945
0.950
0.955
0 200 400 600 800 1000 1200 1400 1600
Incremental MISO (non-MECS) to Southeast Michigan Transfers (MW)
3000
3500
4000
4500
5000
5500
6000
6500
7000
Dynam
ic Reactive R
eserves (MV
Ar)
Voltage Limit (92%)
Monitored DynamicReactive Reserves:All on-line generation in
Area 218 (METC) and Area 219 (SE MI)
Reactivew ith 765
Reactivew /o 765
Voltagew /o 765
Voltagew ith 765
Pont
iac
345
kV (S
E M
I) V
olta
ge (p
.u.)
Figure 6 – PV-Curve at Pontiac 345 kV for Loss of Hampton-Pontiac 345 kV & Jewel-
Thetford 345 kV Double-Circuit Tower Line with Greenwood Unit 1 Off-Line Non-Interface Scenarios Three PV-curve scenarios involved combinations of monitored and outaged facilities at locations removed from one of the above three interfaces but affected by inter-regional transfers. These were selected based on potential impacts of the proposed 765 kV project. Each of the following buses was monitored in one scenario: Lafayette 230 kV (DEM), Saint Clair 138 kV (AEP), and Juniper 345 kV (FE). All three scenarios were modeled using the peak power flow base case. Modeled transfers were from TVA or VACAR into MECS. In all three scenarios, the proposed 765 kV project improved voltage-limited transfer capabilities. Improvement ranged from 1100 MW to 4000 MW. CASCADING ANALYSIS Several higher-level (NERC Category C) contingencies were selected for evaluation to determine whether they would indicate a possibility of widespread cascading outages. These contingencies are known to be highly sensitive to imports into Michigan, and were selected to gauge the potential benefits from the proposed 765 kV project. The results, documented in Appendix G of this report, show the considerable benefits the 765 kV project would have on system performance when considering the possibility of these more severe contingencies.
AEP & ITC Technical Study Report - Proposed 765 kV Transmission Infrastructure Expansion
July 27, 2007 19

OPEN & COORDINATED PLANNING AEP and ITC recognize that a major transmission project such as the 765 kV project being proposed in this report will impact local utilities at or near the proposed 765 kV stations. Short circuit duties on existing circuit breakers and thermal overloads on local facilities will have to be addressed through more detailed studies to be conducted in cooperation with MISO, PJM, and the impacted local utilities. AEP and ITC are committed to working with all parties through the MISO MTEP and PJM RTEP planning processes to ensure the viability of this project. AEP and ITC expect that local utilities will benefit from the knowledge that the 765 kV project will be built because they can direct improvements in the intervening years to integrate well with the eventual completion of the 765 kV project. DEPLOYMENT OF ADVANCED TECHNOLOGIES Being leaders in transmission technologies, AEP and ITC are committed to deploy state of the art technologies to maximize the performance and benefits of the proposed project. Some of the technologies that may be utilized to further improve the performance of the project may include:
1. Single-phase switching – this will enhance the availability of the 765 kV line and stability of the interconnected system by only interrupting one phase to clear temporary single line-to-ground faults, which make up over 98% of the faults experienced by 765 kV lines;
2. Single-phase static VAr compensators – this will permit phase voltage balancing, boost line loadability, and improve the overall voltage performance of the 765 kV line;
3. Fiber-optic wire(s) – these will facilitate the use of differential line protection; 4. Open-loop ground wire to reduce line losses; and 5. Switchable shunt reactors to improve voltage control.
It has been well established through engineering analysis and practice that a single 765 kV line can carry substantially more power than a similarly situated 345 kV line. Generally, about six single-circuit (or three double-circuit) 345 kV lines are required to achieve the load carrying ability, or loadability, of a single 765 kV line. Furthermore, experience indicates that transmission systems designed for 765 kV operation are inherently more reliable than those operating at lower voltage levels. With up to six conductors per phase, 765 kV lines are virtually free of thermal overload risk, even under severe operating conditions. Moreover, outage statistics show that 765 kV circuits, on average, experience significantly fewer forced outages than their 345 kV counterparts, and there have been no multi-phase faults recorded at 765 kV in normal operation in AEP. This performance record suggests a likelihood of fewer and less severe disruptions when 765 kV transmission lines are employed, and an opportunity to apply effective remedies to further improve the line (and thus system) reliability. The higher operating voltage and large thermal capacity of 765 kV offers an added advantage of markedly greater transmission efficiency relative to 345 kV. It can be demonstrated that a 765 kV line incurs only about one-half of the
AEP & ITC Technical Study Report - Proposed 765 kV Transmission Infrastructure Expansion
July 27, 2007 20

power losses of the six-circuit 345 kV alternative, when both are carrying the same amount of power. One of the most sensitive issues in siting electrical transmission lines today is their impact on the natural landscape. When comparing the impacts of 765 kV and 345 kV construction, the former clearly has numerous advantages. The right-of-way requirements for 345 kV construction are up to 4½ times greater than for a single 765 kV circuit to move the equivalent amount of power. With fewer transmission lines and less right-of-way necessary, the reduced impact of 765 kV transmission on the natural landscape is significant. When considering construction costs, electrical properties, reliability, land use and environmental impact, it is apparent that 765 kV offers significant advantages over the competing technologies for use in a modern interstate transmission system. A detailed analysis of the merits of 765 kV vs. 345 kV transmission can be found in Appendix H of this report. PROJECT BENEFITS Completion of the AEP and ITC 765 kV project will significantly improve import capability into the combined footprints of Southeast Michigan, MECS and FE. The 765 kV project, given the improvement in transfer capability and line losses, will likely reduce congestion costs substantially, thus lowering end-use consumer costs. This project will also provide a significant backbone transmission platform to integrate new technology generation having diverse fuel characteristics that may be developed across the broad geographic area traversed by the project and beyond, thus improving the area’s energy position. The AEP and ITC 765 kV project will also provide a significant opportunity to improve the reliability of local utilities along its path. This 765 kV line could be tapped to provide a strong and dependable transmission source, mitigating reliability concerns in major load centers. For example, this new line could be tapped and extended to provide additional transmission reliability to metropolitan areas to support additional load growth or to mitigate retirement of local generation that may no longer be economically or environmentally viable. CONCLUSION & NEXT STEPS AEP and ITC believe that the proposed 765 kV project will effectively address the objectives outlined in the Energy Policy Act of 2005, and the concerns outlined by the Michigan state regulators through their Capacity Needs Forum and 21st Century Energy Plan efforts. Consequently, AEP and ITC stand ready to work cooperatively with other transmission owning utilities, federal, state, and local authorities, MISO, PJM, and their stakeholders to bring this 765 kV project to fruition.
AEP & ITC Technical Study Report - Proposed 765 kV Transmission Infrastructure Expansion
July 27, 2007 21

GLOSSARY OF TERMS ACSR Aluminum Conductor Steel Reinforced AEP American Electric Power AMRN Ameren Corporation AP Allegheny Power DEM Duke Energy Midwest DOE Department of Energy ECAR East Central Area Reliability Coordination Agreement EPAct Energy Policy Act of 2005 FCITC First Contingency Incremental Transfer Capability FE First Energy (for this report the MISO First Energy companies) FERC Federal Energy Regulatory Commission HVDC High Voltage Direct Current IP Ameren Illinois Power LODF Line Outage Distribution Factor MAAC Mid-Atlantic Area Council MAIN Mid-American Interconnected Network MECS Michigan Electric Coordinated Systems MISO Midwest Independent System Operator MTEP Midwest ISO Transmission Expansion Plan NERC North American Electric Reliability Corporation NI Northern Illinois (primarily Commonwealth Edison, a unit of Exelon) NIETC National Interest Electric Transmission Corridors NIPSCO Northern Indiana Public Service Company NOPR Notice of Proposed Rulemaking OPGW Optical Ground Wire OTDF Outage Transfer Distribution Factor PJM PJM Interconnection, LLC PTDF Power Transfer Distribution Factor RFC ReliabilityFirst Corporation (formerly MAAC, and portions of MAIN and ECAR) RTEP Regional Transmission Expansion Plan RTO Regional Transmission Organization SERC Southeastern Electric Reliability Council SIL Surge Impedance Loading SVC Static VAr compensator TVA Tennessee Valley Authority VACAR Virginia Carolinas Subregion of SERC WUMS Wisconsin-Upper Michigan Systems
AEP & ITC Technical Study Report - Proposed 765 kV Transmission Infrastructure Expansion
July 27, 2007 22

Appendix A
Station Layout Analysis
AEP & ITC Technical Study Report - Proposed 765 kV Transmission Infrastructure Expansion
July 27, 2007 23

Appendix A – Station Layout Analysis
Page 2 of 6
The terminal stations for the project include one new and two existing 765 kV stations within the AEP footprint. The Cook Station, located in Bridgman, Michigan, provides the connection at the western edge of the project along Lake Michigan. This station is connected to AEP's Donald C. Cook nuclear generating facility. The South Canton Station, located in Canton, Ohio, will provide the connection on the eastern edge of the project. A new 765 kV switching station, Blue Creek, will be established along the existing Dumont - Marysville 765 kV line near the Indiana-Ohio border. AEP currently owns approximately 140 acres of property underneath this line on the Ohio side of the border. This new station will terminate the southern leg of the project. Within the ITC footprint in Michigan, three new 765 kV stations will be established and integrated into the existing 345 kV transmission network. The Bridgewater Station, located just west of the Detroit area, will intersect the existing Majestic - Milan and Majestic - Lulu 345 kV circuits. This station will provide the connections with the Blue Creek and South Canton stations from the south and east. The Evans Station, located to the east of Grand Rapids, will intersect the existing 345 kV circuits originating at the Kenowa, Nelson Road, and Vergennes stations. This terminal will connect the 765 kV line from Cook. Finally, the 765 kV loop will be completed by connecting the Bridgewater and Evans Stations to the Sprague Creek Station east of Lansing. This station will integrate into the 345 kV through the existing circuitry between the Blackfoot and Madrid Stations. Each of these station sites is expected to be located near the existing 345 kV lines, though the exact locations have not yet been determined. The major equipment for each station is listed below along with a simplified one-line diagram. The shunt line reactor sizes shown are provided for the purposes of illustration and cost estimation. The exact specifications of these reactors, as well as the other station equipment, are subject to change during subsequent study and design optimization phases of this project. In addition, only major equipment required for this project is listed. Equipment such as buswork, relays, switches, etc., are also included, and it is expected that these stations will be designed to accommodate future expansion as well. Cook Station
1-765 kV line circuit breaker 1-765 kV, 300 MVAr shunt line reactor and reactor circuit breaker (100 MVAr per phase,
individually switched)
To TR#4
Dumont
Unit #2 Evans
Existing 765 kV
New 765 kV
New 345 kV
AEP & ITC Technical Study Report - Proposed 765 kV Transmission Infrastructure Expansion
July 27, 2007 24

Appendix A – Station Layout Analysis
Page 3 of 6
South Canton Station
3-765 kV line circuit breakers 1-765 kV, 300 MVAr shunt line reactor and reactor circuit breaker (100 MVAr per phase,
individually switched)
Blue Creek Station
3-765 kV line circuit breakers 1-765 kV, 300 MVAr shunt line reactor and reactor circuit breaker (100 MVAr per phase,
individually switched)
To TR#3
Kammer Bridgewater
Existing 765 kV
New 765 kV
New 345 kV
Dumont
Bridgewater
Marysville
Existing 765 kV
New 765 kV
New 345 kV
AEP & ITC Technical Study Report - Proposed 765 kV Transmission Infrastructure Expansion
July 27, 2007 25
Appendix A – Station Layout Analysis
Page 4 of 6
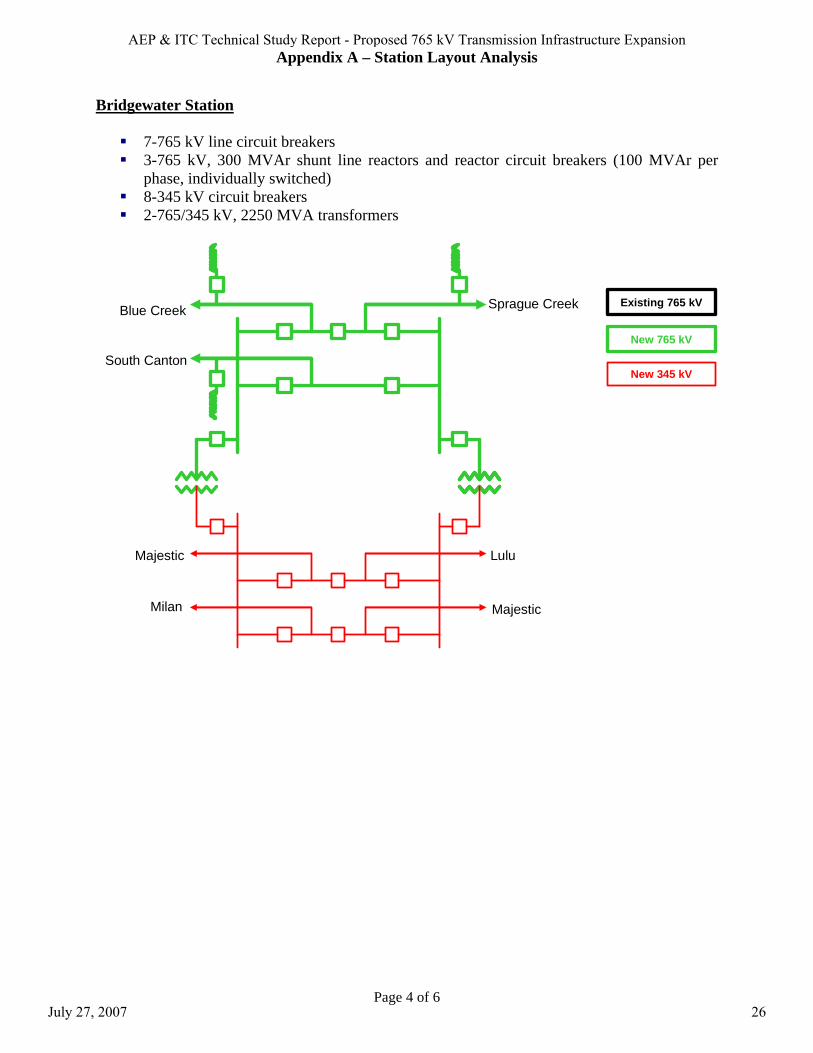
Bridgewater Station
7-765 kV line circuit breakers 3-765 kV, 300 MVAr shunt line reactors and reactor circuit breakers (100 MVAr per
phase, individually switched) 8-345 kV circuit breakers 2-765/345 kV, 2250 MVA transformers
Blue Creek Sprague Creek
Majestic
Milan Majestic
Lulu
South Canton
Existing 765 kV
New 765 kV
New 345 kV
AEP & ITC Technical Study Report - Proposed 765 kV Transmission Infrastructure Expansion
July 27, 2007 26

Appendix A – Station Layout Analysis
Page 5 of 6
Evans Station
4-765 kV line circuit breakers 2-765 kV, 300 MVAr shunt line reactors and reactor circuit breakers (100 MVAr per
phase, individually switched) 10-345 kV circuit breakers 1-765/345 kV, 2250 MVA transformer
Cook Sprague Creek
Kenowa
Nelson Rd. Vergennes
Nelson Rd.
Vergennes Kenowa
Existing 765 kV
New 765 kV
New 345 kV
AEP & ITC Technical Study Report - Proposed 765 kV Transmission Infrastructure Expansion
July 27, 2007 27

Appendix A – Station Layout Analysis
Page 6 of 6
Sprague Creek Station
4-765 kV line circuit breakers 2-765 kV, 300 MVAr shunt line reactors and reactor circuit breakers (100 MVAr per
phase, individually switched) 6-345 kV circuit breakers 1-765/345 kV, 2250 MVA transformer
Bridgewater Evans
Madrid
Blackfoot
Blackfoot
Existing 765 kV
New 765 kV
New 345 kV
AEP & ITC Technical Study Report - Proposed 765 kV Transmission Infrastructure Expansion
July 27, 2007 28

Appendix B
Siting Feasibility Analysis
AEP & ITC Technical Study Report - Proposed 765 kV Transmission Infrastructure Expansion
July 27, 2007 29
Appendix B – Siting Feasibility Analysis
Page 2 of 6
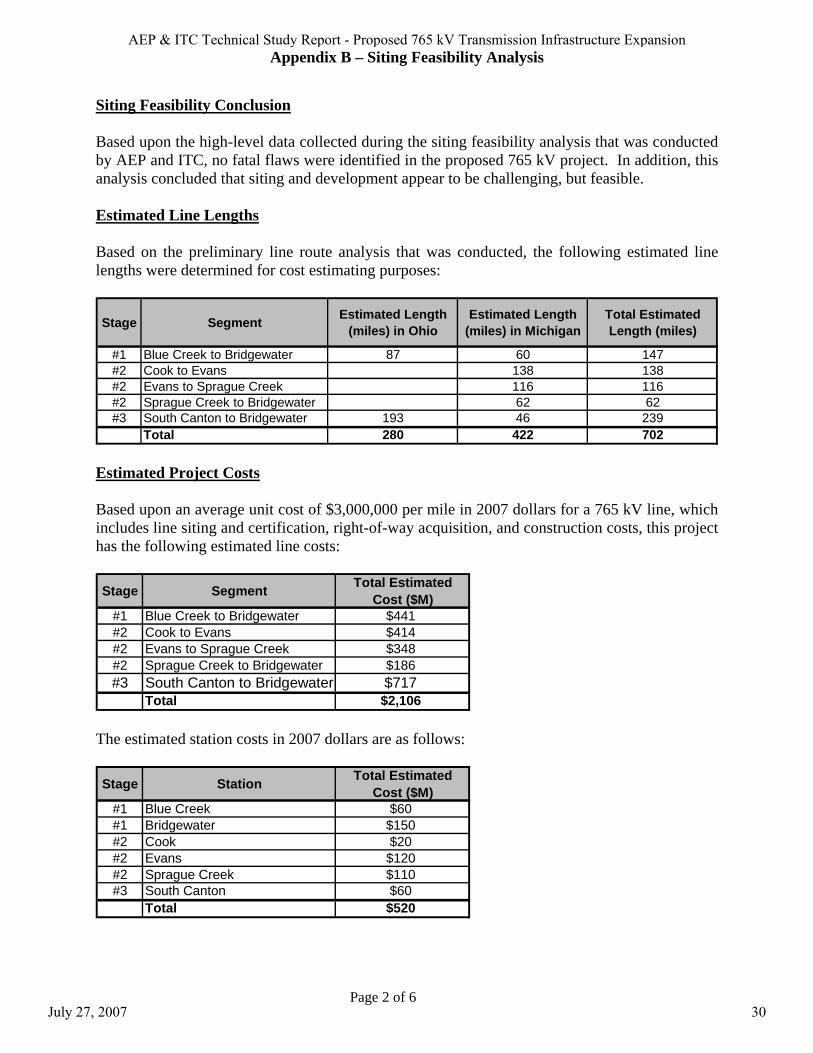
Siting Feasibility Conclusion Based upon the high-level data collected during the siting feasibility analysis that was conducted by AEP and ITC, no fatal flaws were identified in the proposed 765 kV project. In addition, this analysis concluded that siting and development appear to be challenging, but feasible. Estimated Line Lengths Based on the preliminary line route analysis that was conducted, the following estimated line lengths were determined for cost estimating purposes:
Stage Segment Estimated Length (miles) in Ohio
Estimated Length (miles) in Michigan
Total Estimated Length (miles)
#1 Blue Creek to Bridgewater 87 60 147#2 Cook to Evans 138 138#2 Evans to Sprague Creek 116 116#2 Sprague Creek to Bridgewater 62 62#3 South Canton to Bridgewater 193 46 239
Total 280 422 702 Estimated Project Costs Based upon an average unit cost of $3,000,000 per mile in 2007 dollars for a 765 kV line, which includes line siting and certification, right-of-way acquisition, and construction costs, this project has the following estimated line costs: Stage Segment Total Estimated
Cost ($M)#1 Blue Creek to Bridgewater $441#2 Cook to Evans $414#2 Evans to Sprague Creek $348#2 Sprague Creek to Bridgewater $186#3 South Canton to Bridgewater $717
Total $2,106 The estimated station costs in 2007 dollars are as follows: Stage Station Total Estimated
Cost ($M)#1 Blue Creek $60#1 Bridgewater $150#2 Cook $20#2 Evans $120#2 Sprague Creek $110#3 South Canton $60
Total $520
AEP & ITC Technical Study Report - Proposed 765 kV Transmission Infrastructure Expansion
July 27, 2007 30

Appendix B – Siting Feasibility Analysis
Page 3 of 6
Siting Feasibility Parameters The amount of work required to make a determination on a project’s feasibility is extensive. This documentation presents supportable conclusions to make that determination. It is important to understand that while AEP and ITC have drawn conclusions from this high-level study, that there are additional issues that will be identified as the formal siting study progresses. However, AEP and ITC expect to have the flexibility to effectively address these issues as the project progresses. This siting feasibility study consisted of collecting high-level data that was mapped and reviewed. From the mapping, a study boundary was identified outlining a reasonable area for review. Within this study boundary, constraint areas were identified (i.e., areas that are perceived to be incompatible with the siting of an extra high voltage transmission line). The conclusions of this siting feasibility study are based on high-level, readily available data collected without the benefit of professional siting services. Once the formal siting study begins, other significant issues may be identified. The criteria for identifying constraint areas used in this siting feasibility study are listed below. These items represent those topographical features that were identified as high-level areas that should be avoided for any 765 kV project (noted as constraint areas on the maps). Further detailed study could identify a way to cross some of these features.
1. Populated/incorporated areas 2. US Forest Service Wilderness areas 3. National recreational areas 4. National historic areas 5. National Wild & Scenic Rivers 6. National Wildlife Refuges 7. Airports (FAA safety regulations) 8. Historic Districts
With the delineation of the constraint areas, conclusions can be drawn regarding the feasibility of the project. This documentation provides an overview for each state of the issues that will have to be addressed across the broad study area during a more detailed route siting process. This siting feasibility study inventoried existing transmission assets that could be used for each 765 kV project segment. Generally, this involved the review of bulk power transmission assets. Replacement of existing facilities was not considered feasible since it would be challenging, if not impossible, to remove from service. A more detailed route siting process could identify opportunities to parallel/multi-circuit existing transmission lines. Siting Requirements Obtaining state government approval for a line route will be required for this project. The process in each state is described below. The preliminary engineering and siting process will
AEP & ITC Technical Study Report - Proposed 765 kV Transmission Infrastructure Expansion
July 27, 2007 31

Appendix B – Siting Feasibility Analysis
Page 4 of 6
require one to two years to develop an application. The states will require a year to act on the application. Michigan (website: http://www.michigan.gov/mpsc) Michigan has a formal siting process for all major transmission lines through the Electric Transmission Line Certification Act (Act 30 of 1995). A major transmission line is one that is five (5) miles or greater and has a voltage of 345 kV or higher. Construction of a major transmission line may not begin until the Michigan Public Service Commission (MPSC) issues the Certificate of Public Convenience and Necessity (CPCN). The following are the steps required to obtain the CPCN.
i. A construction plan must be filed with the MPSC with copies to each affected
municipality in which the construction of the planned major transmission line is intended. The construction plan filed with the MPSC must contain:
a. The general location and size of all major transmission lines to be constructed in the 5
years after planning commences. b. Copies of relevant bulk power transmission information filed by the independent
transmission company with any state or federal agency, national electric reliability coalition, or regional electric reliability coalition.
c. Any additional information required by commission rule or order that directly relates to the construction plan.
ii. In the 60 days before the public meetings are held, an offer must be made, in writing, to
meet with the chief elected official of each affected municipality or his/her designee. The purpose of this meeting would be to discuss the desire to build the major transmission line and to explore the routes that are being considered.
iii. Before applying for the CPCN, public meetings must be scheduled and held in each
municipality through which the proposed major transmission line would pass.
iv. An application is submitted to the MPSC for the CPCN. The application must include the following:
a. The planned date for beginning construction. b. A detailed description of the proposed major transmission line, its route, and its
expected configuration and use. c. A description and evaluation of one or more alternate major transmission line routes
and a statement of why the proposed route was selected. d. If a zoning ordinance prohibits or regulates the location or development of any
portion of a proposed route, a description of the location and manner in which that ordinance prohibits or regulates the location or construction of the proposed route.
e. The estimated overall cost of the proposed major transmission line.
AEP & ITC Technical Study Report - Proposed 765 kV Transmission Infrastructure Expansion
July 27, 2007 32

Appendix B – Siting Feasibility Analysis
Page 5 of 6
f. Information supporting the need for the proposed major transmission line, including the identification of known future wholesale users of the proposed major transmission line.
g. Estimated quantifiable and non-quantifiable public benefits of the proposed major transmission line.
h. Estimated private benefits of the proposed major transmission line to the applicant or any legal entity that is affiliated with the applicant.
i. Information addressing potential effects of the proposed major transmission line on public health and safety.
j. A summary of all comments received at each public meeting and the applicant’s response to those comments.
k. Information indicating that the proposed major transmission line will comply with all applicable state and federal environmental standards, laws, and rules.
l. Other information reasonably required by the commission pursuant to rule.
v. A publication and mailing of a Notice of Opportunity to Comment on the Application shall be made upon applying for the CPCN. It shall be published in a newspaper of general circulation in the area to be affected and shall be sent to each affected municipality and each affected landowner on whose property a portion of the proposed major transmission line will be constructed.
vi. The MPSC will grant or deny the application not later than one year after the
application’s filing date. The CPCN will be granted if all of the following criteria are met: a. The quantifiable and non-quantifiable public benefits of the proposed major
transmission line justify its construction. b. The proposed or alternative route is feasible and reasonable. c. The proposed major transmission line does not present an unreasonable threat to
public health or safety. Ohio (website: http://www.opsb.ohio.gov) Ohio has a clearly defined siting process in accordance with the Public Utilities Commission of Ohio’s (PUCO’s) Ohio Power Siting Board (OPSB) rules and regulations. This process requires a detailed siting study be prepared that will identify at least two potential routes (not corridors). These two routes, a Preferred and Alternate Route, must be presented at public information meetings. A siting application must be prepared and presented to the OPSB for completeness review and for public comment. The OPSB will then conduct public hearings and the OPSB will grant a “Certificate of Environmental Compatibility and Public Need” only after it finds and determines the following:
i. The basis for the need for the facility.
ii. The nature of the probable environmental impact.
AEP & ITC Technical Study Report - Proposed 765 kV Transmission Infrastructure Expansion
July 27, 2007 33
Appendix B – Siting Feasibility Analysis
Page 6 of 6
iii. The facility represents the minimum adverse environmental impact.
iv. The facility is consistent with regional plans for expansion of the electric power grid of the electric systems serving the state of Ohio and interconnected utility systems and such facilities will serve the interest of electric system economy and reliability.
v. The facility will comply with Chapters 3704, 3734 and 6111 of the Ohio Revised Code.
vi. The facility will serve the public interest, convenience, and necessity.
vii. The probable impact of the facility on the viability on agricultural land or any land in
an existing agricultural district established under Chapter 929 of the Ohio revised Code. Ohio requires a very detailed siting application based around specific Alternate and Preferred route centerline, (not a corridor). The study area is a minimum of 1000 feet on each side of the proposed route centerlines. These routes must be presented to the public at local public information meetings prior to submission of the application to the OPSB. The OPSB also requires written notification of all hearings be made by an applicant to all landowners located along the proposed Preferred and Alternate Routes. The OPSB will require at least 1 year approving the application as complete, holding public hearings and granting a Certificate. Indiana Indiana has no formal siting process.
AEP & ITC Technical Study Report - Proposed 765 kV Transmission Infrastructure Expansion
July 27, 2007 34

Appendix C
Study Procedure
AEP & ITC Technical Study Report - Proposed 765 kV Transmission Infrastructure Expansion
July 27, 2007 35

Appendix C – Study Procedure
Page 2 of 5
Model Development Primary (Peak) Base Case The Phase 2 MISO 2006 MTEP contractual dispatch model for 2011 system conditions was used as the starting point base case for this study. This MISO base case was titled: MTEP06_2011SumPkCD_BRP_20060405_v29.sav. This model included all planned and proposed projects via the 2006 MISO MTEP process. For purposes of this study, the proposed projects within Southeast Michigan were removed from the model. This included the 345 kV Lulu and Saratoga projects. Several other updates to the Southeast Michigan system were applied including; the new phase shifter series representation of the B3N interconnection with Hydro One, a 120 kV line was modeled from Quaker to Southfield, and the rating of the Hines 230/120 kV transformer was increased to reflect future station work at Hines. These updates were applied so that the benefits and/or impacts of the proposed 765 kV project could be better identified. This model also included 2552 MW of virtual generation within the ITC footprint to address the shortfall between forecasted load levels and committed generation resources. These virtual generators were removed from the study base case and replaced with transfers from committed generation resources in the IP, AMRN, METC, and ITC footprints. Power flows throughout Michigan are directly impacted by the amount of power flowing across the Michigan - Hydro One (US-Canada) interface. There currently exist about 1100 MW of approved transactions through Michigan into Canada. The 2006 MISO MTEP model was developed with a bias of approximately 1100 MW flowing from Michigan into the Hydro One system in attempt to allow for accommodation of these approved transactions. In order to accomplish this level of transfer across the Michigan - Hydro One interface in the MTEP model, the angle capabilities of three of the four phase shifting transformers that make up this interconnection were increased beyond their design capabilities. Typically, the flow distribution across the Michigan - Hydro One interface is modeled as 1/6, 1/3, 1/3, and 1/6 across the B3N, L4D, L51D, and J5D, respectively. For purposes of this study, the angle capabilities of these transformers were taken back down to their actual capabilities. This caused the total interface flow to back off considerably. In order to increase this flow, the phase shifters between IESO and New York were adjusted to increase flow through Canada from MISO/PJM to New York. Also, some generation re-dispatch within the Hydro One footprint was applied. The northern and southern most interconnections, the B3N and the J5D were able to control flow to around 185 MW; however the two interconnections between St. Clair and Lambton, L4D, and L51D, maxed out at around 250 MW, thus limiting the total transfer into Canada to around 850 MW. The model was reviewed by AEP, FE, and NIPSCO. Several updates were applied for both the AEP and FE systems. Generation was redispatched in the AEP footprint and a system configuration updated was supplied by FE for the FE footprint.
AEP & ITC Technical Study Report - Proposed 765 kV Transmission Infrastructure Expansion
July 27, 2007 36

Appendix C – Study Procedure
Page 3 of 5
Several other models were developed from this primary base case (Peak Base) and used for various purposes throughout this study, as outlined below. Ludington Pumping Base Case Because congestion can and does occur within the MISO market, specifically within Michigan during certain off-peak situations with the Ludington pumped storage generating uints operating in pumping mode, an 80% peak model was developed with all 6 Ludington units modeled in pumping mode. Load in Michigan was scaled back to 80% of the 21st Century Energy load forecast for 2011. Generation throughout Michigan was re-dispatched economically in order to match this lower system load level. Power was brought in from generation within the TVA footprint in order to supply the Ludington units from outside of Michigan. Davis-Besse Off and Perry Off Base Cases At the request of FE, two more models were developed. One with the Davis-Besse plant off-line and the other with the Perry plant off-line. Power was made up in the NI system for the Davis-Besse unit and in the TVA system for the Perry unit. Base Cases Modeling Entire 765 kV Project and Each of Three Radial Segments For each of the four models described above (Peak Base, Ludington Pumping, Davis-Besse Off, and Perry Off), four 765 kV options were analyzed. One considered all three segments of the proposed 765 kV project across Michigan and connecting into Ohio, and the other three considered each individual project segment in an attempt to determine which segment should be built first. The three individual segments consist of the following lines:
1) From the proposed AEP Blue Creek Station up to the proposed ITC Bridgewater Station. 2) From the AEP Cook Station north to the new ITC Evans Station to be located northwest
of Grand Rapids, southeast to the proposed ITC Sprague Creek Station, and south to the proposed ITC Bridgewater Station.
3) From the AEP South Canton Station up to the proposed ITC Bridgewater Station. Thermal Transfer Capability Analysis Transfer Scenarios First contingency incremental transfer capability (FCITC) analysis was performed on all of the models developed. Many different source/sink patterns were analyzed. Table 1 in this appendix lists the various source/sink combinations. This analysis was performed with the Siemens PTI MUST power system analysis tool. When simulating the transfers with the MUST program, a 2.5% Power Transfer Distribution Factor (PTDF) cut off was used. Transfers were made from all available generation in the source area to all on-line generation in the sink area. No attempts were made to “optimize” generation
AEP & ITC Technical Study Report - Proposed 765 kV Transmission Infrastructure Expansion
July 27, 2007 37

Appendix C – Study Procedure
Page 4 of 5
dispatch in either the sink or source subsystems. This is a typical methodology used when performing thermal transfer studies. It is recognized, however, that actual real time congestion may vary from the results seen through this analysis depending on actual real time MISO and PJM market dispatch.
Source Subsystems
METC WUMS MAIN TVA VACAR MAAC MISO PJM PJM East
PJM West
All Outside World
Sink SubsystemsS.E. MI X X X X X X X X X X XMECS X X X X X X X X X XFE X X X X X X X X X XNIPS X X X X X X X X X XS.E. MI & FE X X X X X X X X X XMECS & FE X X X X X X X X X XWUMS X XMAIN XTVA XVACAR XMAAC X XPJM East XPJM West X
Table 1 – Transfer Source/Sink Pairs Contingencies and Monitored Facilities NERC Category B contingencies were analyzed for all of the high voltage (HV) facilities in the ITC, AEP, FE, and NIPSCO systems. Contingency files for the Southeast Michigan, METC, AEP, FE, and NIPSCO systems were reviewed by each individual company. Contingencies were also analyzed for several other neighboring entities including most of the companies within the PJM footprint and most of the companies in the western and central areas of the MISO footprint. The contingency files utilized for the other MISO and PJM companies were obtained from the MISO FTP site. These files were not reviewed for accuracy by the individual companies. All HV facilities were monitored in the ITC, AEP, FE, and NIPSCO systems, along with those in neighboring systems, including but not limited to; TVA, Allegheny Power, ComEd., Ameren, and ATC. Thermal Higher-Level Contingency Analysis Only the Peak Base Case and 80% of Peak Case with the Ludington generating units operating in pumping mode were used for the NERC Category C contingency analysis. This analysis was performed in order to highlight any major issues either solved or created by the addition of the proposed 765 kV facilities. It was also used as a screening tool to identify possible cascading or PV-curve scenarios to be reviewed further.
AEP & ITC Technical Study Report - Proposed 765 kV Transmission Infrastructure Expansion
July 27, 2007 38

Appendix C – Study Procedure
Page 5 of 5
Contingencies and Monitored Facilities NERC Category C contingency files were developed for the ITC, AEP, FE, and NIPSCO systems along with the new 765 kV facilities in combination with each other and with the HV facilities from each of the other companies. The same facilities that were monitored for the thermal transfer capability analysis were monitored for the Category C contingency analysis. Voltage Screening and PV-Curve Analysis Steady state voltage screening analysis was also performed on all of the models developed. The same NERC Category B contingencies and monitored facilities that were considered for the thermal transfer capability analysis were also considered for the voltage screening analysis. Voltage limits were obtained from the individual companies and the monitored facility files posted on the MISO FTP site. Voltage drops of 5% or greater were monitored for the ITC, AEP, FE, and NIPSCO HV facilities. Several PV-curve scenarios were also considered as discussed in further detail in Appendix F. While shunt reactors were assumed for most of the 765 kV circuits modeled, further studies will need to be performed in order to properly size any voltage regulating equipment that may actually be required. It was beyond the scope of this study attempt to size any voltage regulating devices.
AEP & ITC Technical Study Report - Proposed 765 kV Transmission Infrastructure Expansion
July 27, 2007 39

Appendix D
Transcription Diagrams
AEP & ITC Technical Study Report - Proposed 765 kV Transmission Infrastructure Expansion
July 27, 2007 40

Appendix D – Transcription Diagrams
Page 2 of 9
Power flows on key transmission facilities as reflected in the primary (Peak) base case without and with the proposed 765 kV Project are presented in this appendix. In addition, power flows on these same key transmission facilities are also provided for each of the three individual segments of this 765 kV Project, recognizing that this project will have to be built in stages and one of these segments will have to be built first. These three stages include: (1) the Blue Creek to Bridgewater 765 kV segment, (2) the Cook to Evans to Sprague Creek to Bridgewater 765 kV segment, and (3) the South Canton to Bridgewater 765 kV segment. The key transmission facilities include:
• The four 345 kV circuits that run west-to-east across Michigan • The 345 kV ties between AEP and ITC • The 345 kV ties between FE and ITC • The interface between Michigan and Hydro One • The proposed 765 kV facilities
Observations regarding the power flows on these key transmission facilities without and with the 765 kV Project and for each of the three individual project segments are outlined below. Figure D1 - Observations - Peak Base Case without 765 kV Project The strong reliance on the existing 345 kV network to bring outside resources into the Southeastern area of Michigan (and/or for further delivery to Ontario) is clearly shown:
• More than 1300 MW is flowing over the four AEP-ITC ties. • Nearly 1200 MW is flowing over the three FE-ITC ties. • More than 1900 MW is flowing across the two main west-east intra-Michigan 345 kV
corridors. Figure D2 - Observations - Peak Base Case with 765 kV Project New 765 kV facilities:
• The new 765 kV ties carry almost all of the flow into Southeast Michigan from the south. • Flows are nearly evenly divided between the three new 765 kV ties, with the line from
the proposed Blue Creek 765 kV Station in AEP to the proposed Bridgewater 765 kV Station in ITC carrying the most power; while the line from the existing South Canton 765 kV Station in AEP to the proposed Bridgewater 765 kV Station in ITC carrying the least.
• The new cross-state 765 kV path carries about 35% of the west-east power flow within Michigan.
Existing 345 kV facilities:
• Power flow over the four AEP-ITC ties is reduced to nearly 0 MW, as the power demanded is now carried over the new 765 kV system.
AEP & ITC Technical Study Report - Proposed 765 kV Transmission Infrastructure Expansion
July 27, 2007 41
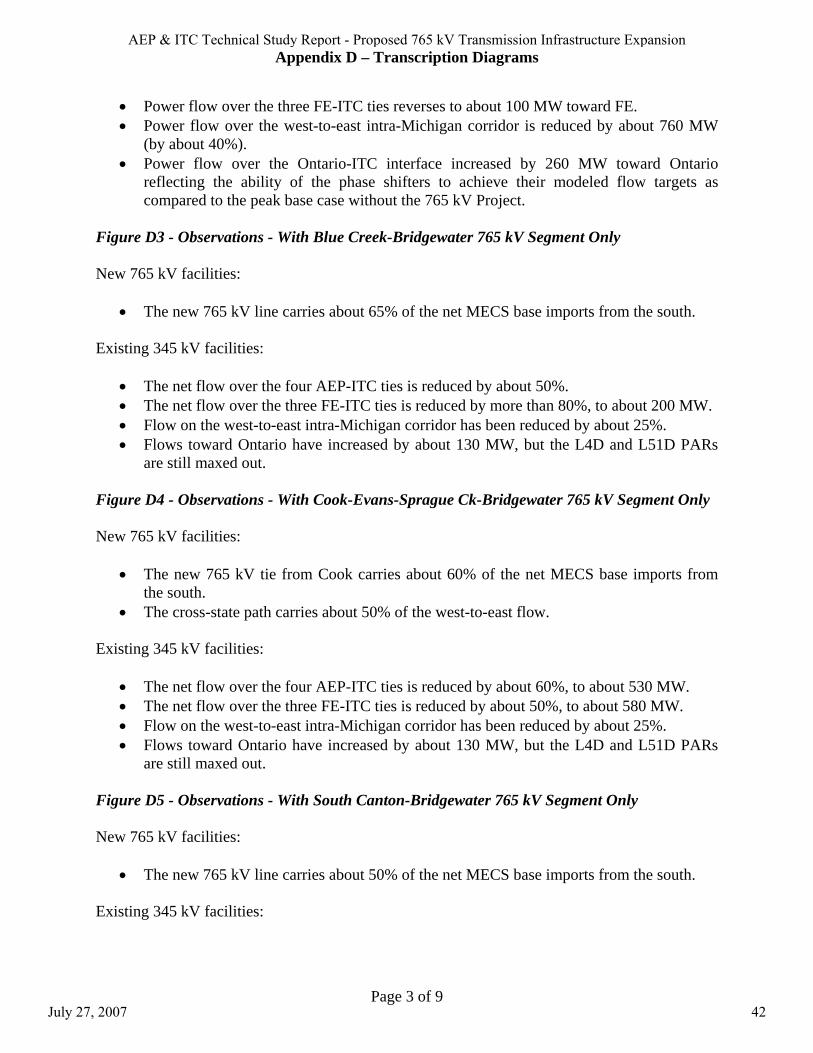
Appendix D – Transcription Diagrams
Page 3 of 9
• Power flow over the three FE-ITC ties reverses to about 100 MW toward FE. • Power flow over the west-to-east intra-Michigan corridor is reduced by about 760 MW
(by about 40%). • Power flow over the Ontario-ITC interface increased by 260 MW toward Ontario
reflecting the ability of the phase shifters to achieve their modeled flow targets as compared to the peak base case without the 765 kV Project.
Figure D3 - Observations - With Blue Creek-Bridgewater 765 kV Segment Only New 765 kV facilities:
• The new 765 kV line carries about 65% of the net MECS base imports from the south. Existing 345 kV facilities:
• The net flow over the four AEP-ITC ties is reduced by about 50%. • The net flow over the three FE-ITC ties is reduced by more than 80%, to about 200 MW. • Flow on the west-to-east intra-Michigan corridor has been reduced by about 25%. • Flows toward Ontario have increased by about 130 MW, but the L4D and L51D PARs
are still maxed out. Figure D4 - Observations - With Cook-Evans-Sprague Ck-Bridgewater 765 kV Segment Only New 765 kV facilities:
• The new 765 kV tie from Cook carries about 60% of the net MECS base imports from the south.
• The cross-state path carries about 50% of the west-to-east flow. Existing 345 kV facilities:
• The net flow over the four AEP-ITC ties is reduced by about 60%, to about 530 MW. • The net flow over the three FE-ITC ties is reduced by about 50%, to about 580 MW. • Flow on the west-to-east intra-Michigan corridor has been reduced by about 25%. • Flows toward Ontario have increased by about 130 MW, but the L4D and L51D PARs
are still maxed out. Figure D5 - Observations - With South Canton-Bridgewater 765 kV Segment Only New 765 kV facilities:
• The new 765 kV line carries about 50% of the net MECS base imports from the south. Existing 345 kV facilities:
AEP & ITC Technical Study Report - Proposed 765 kV Transmission Infrastructure Expansion
July 27, 2007 42

Appendix D – Transcription Diagrams
Page 4 of 9
• The net flow over the four AEP-ITC ties is reduced by about 35%, to 920 MW. • The net flow over the three FE-ITC ties is reduced by about 65%, to about 400 MW. • Flow on the west-to-east intra-Michigan corridor has been reduced by about 15%. • Flows toward Ontario have increased by about 150 MW, but the L4D and L51D PARs
are still maxed out.
AEP & ITC Technical Study Report - Proposed 765 kV Transmission Infrastructure Expansion
July 27, 2007 43

Appendix D – Transcription Diagrams
Figure D1 – Power Flows Under Peak Base Case Conditions Without 765 kV Project
660680
220 960
8501040
890
AEP & ITC Technical Study Report - Proposed 765 kV Transmission Infrastructure Expansion
July 27, 2007 44

Appendix D – Transcription Diagrams
Figure D2 – Power Flows Under Peak Base Case Conditions With 765 kV Project
Blue Creek
Cook
Evans
Sprague Creek
Bridgewater
South Canton
220-180
1120
460
840
6801000
-220 70
1110450
720
AEP & ITC Technical Study Report - Proposed 765 kV Transmission Infrastructure Expansion
July 27, 2007 45

Appendix D – Transcription Diagrams
Figure D3 – Power Flows Under Peak Base Case Conditions With Blue Creek to Bridgewater 765 kV Segment Only
Blue Creek
Bridgewater
420250
1690
-70 270
980640
780
AEP & ITC Technical Study Report - Proposed 765 kV Transmission Infrastructure Expansion
July 27, 2007 46

Appendix D – Transcription Diagrams
Figure D4 – Power Flows Under Peak Base Case Conditions With Cook to Bridgewater 765 kV Segment Only
Cook
Evans
Sprague Creek
Bridgewater
420110
5001420
1600
10 570
980680
770
AEP & ITC Technical Study Report - Proposed 765 kV Transmission Infrastructure Expansion
July 27, 2007 47

Appendix D – Transcription Diagrams
Figure D5 – Power Flows Under Peak Base Case Conditions With South Canton to Bridgewater 765 kV Segment Only
Bridgewater
South Canton
500420
1390
-50 450
1010770
830
AEP & ITC Technical Study Report - Proposed 765 kV Transmission Infrastructure Expansion
July 27, 2007 48

Appendix E
Geographic Representation of Transfer Capability Results
AEP & ITC Technical Study Report - Proposed 765 kV Transmission Infrastructure Expansion
July 27, 2007 49

Appendix E – Geographic Representation of Transfer Capability Results
Page 2 of 11
There are several ways in which transfer capability results can be illustrated. Tabular results allow for significant amounts of information to be reviewed, but take up a large amount of space and tend to be somewhat tedious to analyze. Even so, tabular results have been compiled for the transfer capability analysis performed as part of this study and are available upon request. From these tabular results, maps were developed in order to geographically identify each limit up to a predefined transfer test level. From these maps, it is clear that the addition of the 765 kV project significantly increases the transfer capability throughout the area, including in the Lower Peninsula of Michigan, in northern Ohio, and in northern Indiana. Exhibits in this appendix help to highlight the various transfer limits both without and with the 765 kV project and for each of the three individual project segments in an effort to identify which of these segments should be built first. Each map geographically locates the transfer capability limits identified for the specified transfer scenario. Limits shown in black represent the limits with the system “as planned”, that is, not including the proposed 765 kV project. Limits underlined in red represent limits for system conditions with either the 765 kV project in its entirety or for each of the three individual project segments. In addition, limits boxed in blue represent limits that were not materially impacted by the addition of the proposed 765 kV project or any of its segments. Where several limits were located in close “electrical” proximity, the lowest limit is shown, but flagged with an asterisk to indicate that higher limits also exist in the area. Negative limits signify overloads that exist prior to the simulation of any transfers. The model was reviewed by the neighboring utilities (ITC, AEP, FE, and NIPSCo), but no attempt was made to alter the base case dispatch to optimize the system to remove existing overloads in these or neighboring systems.
AEP & ITC Technical Study Report - Proposed 765 kV Transmission Infrastructure Expansion
July 27, 2007 50

Appendix E – Geographic Representation of Transfer Capability Results
Figure E1 – Peak Base Model – MISO to Southeast Michigan – Without & With 765 kV Project
AEP & ITC Technical Study Report - Proposed 765 kV Transmission Infrastructure Expansion
July 27, 2007 51

Appendix E – Geographic Representation of Transfer Capability Results
Figure E2 – Peak Base Model – MISO to Southeast Michigan Without & With Blue Creek to Bridgewater 765 kV Segment Only
AEP & ITC Technical Study Report - Proposed 765 kV Transmission Infrastructure Expansion
July 27, 2007 52

Appendix E – Geographic Representation of Transfer Capability Results
Figure E3 – Peak Base Model – MISO to Southeast Michigan Without & With Cook to Bridgewater 765 kV Segment Only
AEP & ITC Technical Study Report - Proposed 765 kV Transmission Infrastructure Expansion
July 27, 2007 53
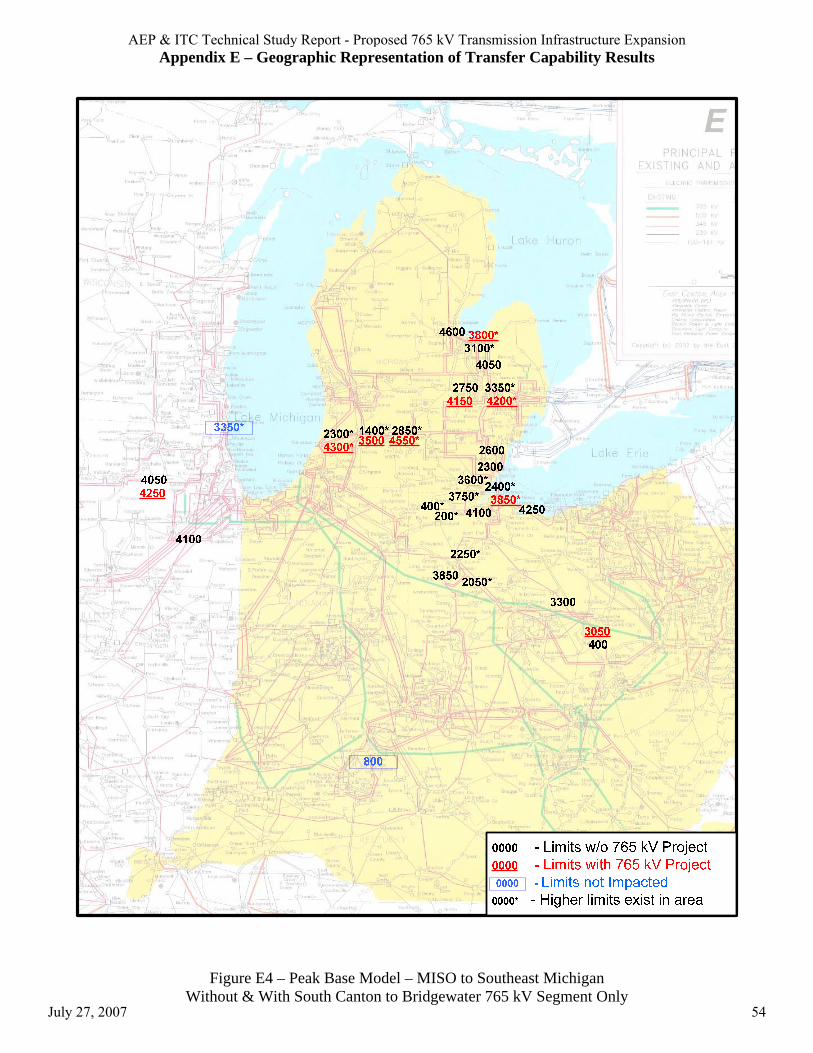
Appendix E – Geographic Representation of Transfer Capability Results
Figure E4 – Peak Base Model – MISO to Southeast Michigan Without & With South Canton to Bridgewater 765 kV Segment Only
AEP & ITC Technical Study Report - Proposed 765 kV Transmission Infrastructure Expansion
July 27, 2007 54

Appendix E – Geographic Representation of Transfer Capability Results
Figure E5 – Peak Base Model – All to Southeast Michigan – Without & With 765 kV Project
AEP & ITC Technical Study Report - Proposed 765 kV Transmission Infrastructure Expansion
July 27, 2007 55
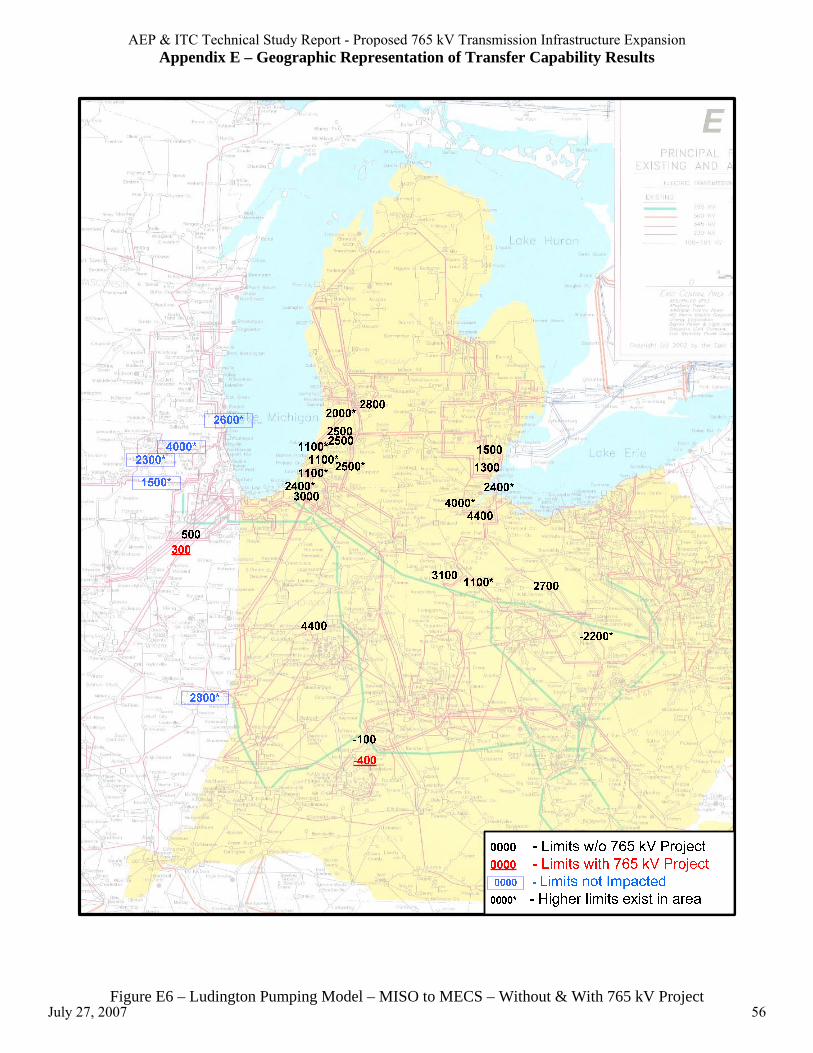
Appendix E – Geographic Representation of Transfer Capability Results
Figure E6 – Ludington Pumping Model – MISO to MECS – Without & With 765 kV Project
AEP & ITC Technical Study Report - Proposed 765 kV Transmission Infrastructure Expansion
July 27, 2007 56
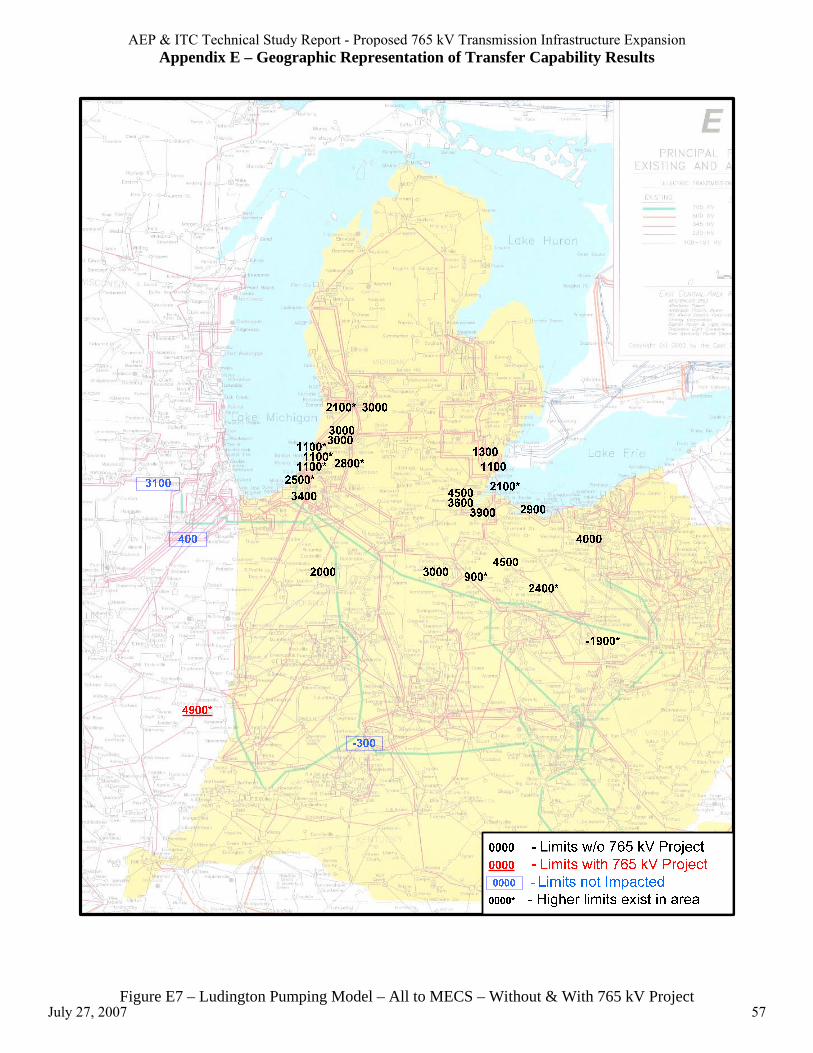
Appendix E – Geographic Representation of Transfer Capability Results
Figure E7 – Ludington Pumping Model – All to MECS – Without & With 765 kV Project
AEP & ITC Technical Study Report - Proposed 765 kV Transmission Infrastructure Expansion
July 27, 2007 57
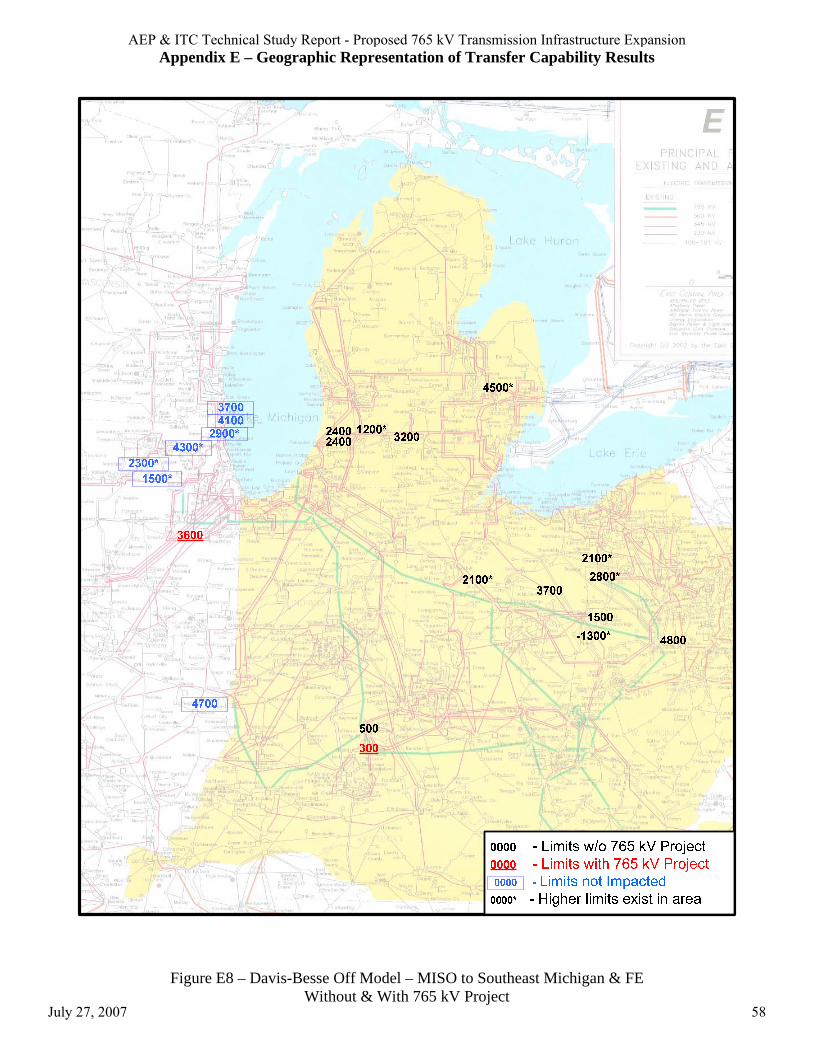
Appendix E – Geographic Representation of Transfer Capability Results
Figure E8 – Davis-Besse Off Model – MISO to Southeast Michigan & FE Without & With 765 kV Project
AEP & ITC Technical Study Report - Proposed 765 kV Transmission Infrastructure Expansion
July 27, 2007 58

Appendix E – Geographic Representation of Transfer Capability Results
Figure E9 - Perry Off Model - All to Cleveland Area – Without & With 765 kV Project
AEP & ITC Technical Study Report - Proposed 765 kV Transmission Infrastructure Expansion
July 27, 2007 59

Appendix F
PV-Curve Analysis Results
AEP & ITC Technical Study Report - Proposed 765 kV Transmission Infrastructure Expansion
July 27, 2007 60

Appendix F – PV-Curve Analysis Results
Page 2 of 18
In order to evaluate the impact of the proposed 765 kV project on voltage performance, fifteen scenarios known to result in significant transmission system stress were analyzed. A PV-curve was created for each scenario showing the relationship between observed voltage level and increasing levels of power transfers. The base cases used in this analysis were identical to those used in the thermal analysis, and voltage performance results without and with the proposed project were compared. Voltage limits for power transfers are determined by the transfer level where the observed voltage reaches the minimum voltage limit as defined by the applicable transmission owner. The decrease in generation dynamic reactive reserves located in the area surrounding the monitored station was also tracked and plotted against increasing transfer level. All fifteen PV-curve scenarios selected for analysis involve higher level (NERC Category C or D) type contingencies. Each scenario typically involves one or more generating unit outage combined with one or more transmission facility outage. One scenario involves two generating unit outages only, without any transmission facility outages. Two involve double-circuit tower outages only, without any generating unit outages. For each PV-curve scenario, an inter-regional power transfer was superimposed on the selected base case after the contingencies were modeled. Nine of the scenarios selected were historically included in seasonal assessments performed by RFC or its ECAR predecessor. A few of these scenarios required some modification to adapt them to anticipated 2011 summer conditions. The remaining six scenarios were selected based on the experience of the transmission owners participating in this study. Most of the PV-curve scenarios can be grouped according to the location of the monitored and outaged facilities relative to the transmission network interfaces considered in this study. These interfaces include Indiana-Michigan, Ohio-Michigan, and West Michigan-East Michigan. A few scenarios analyzed voltage performance at locations removed from one of these interfaces but which were affected by inter-regional transfers. The latter were selected to determine effects of the proposed 765 kV Project on facilities it was not designed to address but which it may impact.
AEP & ITC Technical Study Report - Proposed 765 kV Transmission Infrastructure Expansion
July 27, 2007 61

Appendix F – PV-Curve Analysis Results
Table F1 – Summary of PV-Curve Analysis Results
AEP-ITC 765 kV Study, 2011 Summer ConditionsPV-Curve Voltage Analysis
Without 765 kV Project With 765 kV ProjectVoltage Limited Reactive Voltage Limited Reactive
Prior Incremental Reserve Incremental ReserveBase Generation Monitored Voltage Transfer at Limit Transfer at Limit
Figure Case Transmission Contingency Outage(s) Voltage Limit Exporter Importer Capability (MW) (MVAr) Capability (MW) (MVAr) Comments
F1 Peak Dune Acres 345-138 kV Dune Acres 8 Dune Acres 96% NI-AMRN MECS 3800 70 5800+ < 200 -----138 kV (NIPS)
F2 Peak Cook 765-345 kV Cook 1 Robison Park 92% VACAR MECS 1300 0 5600 0 -----Palisades 1 138 kV (AEP)
F3 Peak Jefferson - Greentown 765 kV Cayuga 1 Lafayette 90% TVA MECS 3000 850 4200 750 -----230 kV (CIN)
F4 Peak Palisades - Argenta 345 kV #1 Palisades 1 Argenta 92% MISO MECS 2300 2200 5400 2000 -----Palisades - Argenta 345 kV #2 345 kV (METC)
(Double Circuit Tower Line)
F5 Peak Argenta - Tompkins 345 kV Palisades 1 Tompkins 97% MISO MECS 1300 4200 2600 5400 -----Argenta - Battle Creek 345 kV 345 kV (METC)
(Double Circuit Tower Line)
F6 Peak Majestic - Milan 345 kV Davis-Besse 1 Tompkins 97% NI-AMRN MECS 0 > 4500 2600 4700Outage Majestic - Bridgewater 345
kV #1 & #2Majestic - Lemoyne 345 kV Monroe 1 345 kV (METC) DCT in case with 765 kV project.(Double Circuit Tower Line)
F7 Peak Hampton - Pontiac 345 kV Greenwood 1 Pontiac 92% MISO Southeast 50 3200 1500 4100 -----Thetford - Jewel 345 kV 345 kV (SE MI) (non-MECS) Michigan
(Double Circuit Tower Line)
F8 Peak Belle Riv - Pontiac/Greenwood 345 kV Saint Clair 4 Pontiac 92% MISO Southeast 1600 1700 2900 3000 -----Belle River - Blackfoot 345 kV 345 kV (SE MI) (non-MECS) Michigan(Double Circuit Tower Line)
F9 Peak Davis-Besse - Hayes - Beaver 345 kV Eastlake 5 Ottawa 90% MID- MECS 3500 0 7200 150 -----Monroe 1 138 kV (FE) ATLANTIC
F10 Peak Davis-Besse - Lemoyne 345 kV Monroe 1 Fostoria Central 92% VACAR MECS 1900 0 6000 100 -----Monroe 3 138 kV (AEP)
F11 Peak Hanna - Juniper 345 kV Eastlake 5 Juniper 92% VACAR MECS 4000 100 6300+ < 500 -----345 kV (FE)
F12 Peak Marysville 765-345 kV Conesville 4 Saint Clair 92% VACAR MECS 2100 0 6100 0 -----Conesville 5 138 kV (AEP)
F13 Pumping None Palisades 1 Palisades 97% NI-AMRN MECS 0 > 2700 3100 2500 -----Cook1 345 kV (METC)
F14 Pumping Palisades - Argenta 345 kV #1 None Argenta 92% MISO Southeast 600 2200 5700+ < 1900 -----Palisades - Argenta 345 kV #2 345 kV (METC) (non-MECS) Michigan
(Double Circuit Tower Line)
F15 Pumping Argenta - Tompkins 345 kV None Tompkins 97% MISO Southeast 1400 4200 5500 2900 -----Argenta - Battle Creek 345 kV 345 kV (METC) (non-MECS) Michigan
(Double Circuit Tower Line)
AEP & ITC Technical Study Report - Proposed 765 kV Transmission Infrastructure Expansion
July 27, 2007 62

Appendix F – PV-Curve Analysis Results
Figure F1 – PV-Curve for Scenario Specified in Above Header
AEP-ITC 765 kV Study, 2011 Summer ConditionsDune Acres 345-138 kV Outaged, Dune Acres 8 Outaged
0.955
0.960
0.965
0.970
0.975
0.980
0.985
0.990
0.995
0 500 1000 1500 2000 2500 3000 3500 4000 4500 5000 5500 6000
Incremental NI-AMRN to MECS Transfers (MW)
Dune
Acr
es 1
38 k
V (N
IPS)
Vol
tage
(p.u
.)
0
100
200
300
400
500
600
700
800
Dynamic Reactive R
eserves (MV
Ar)
Voltage Limit (96%)Monitored DynamicReactive Reserves:
All on-line generation in Area 217 (NIPS)
Voltagew /o 765
Reactivew ith 765
Reactivew /o 765
Voltagew ith 765
AEP & ITC Technical Study Report - Proposed 765 kV Transmission Infrastructure Expansion
July 27, 2007 63

Appendix F – PV-Curve Analysis Results
Figure F2 – PV-Curve for Scenario Specified in Above Header
AEP-ITC 765 kV Study, 2011 Summer ConditionsCook 765-345 kV Outaged, Cook 1 and Palisades 1 Outaged
0.90
0.91
0.92
0.93
0.94
0.95
0.96
0.97
0.98
0.99
0 500 1000 1500 2000 2500 3000 3500 4000 4500 5000 5500 6000
Incremental VACAR to MECS Transfers (MW)
Robi
son
Park
138
kV
(AE
P)Vo
ltage
(p.u
.)
-250
0
250
500
750
1000
1250
1500
1750
2000
Dynamic R
eactive Reserves (MVA
r)
Monitored DynamicReactive Reserves:On-line generators at
Cook (AEP), Lemoyne (FE),and Covert (METC)
Voltage Limit (92%)
Reactivew ith 765
Voltagew ith 765
Reactivew /o 765
Voltagew /o 765
AEP & ITC Technical Study Report - Proposed 765 kV Transmission Infrastructure Expansion
July 27, 2007 64
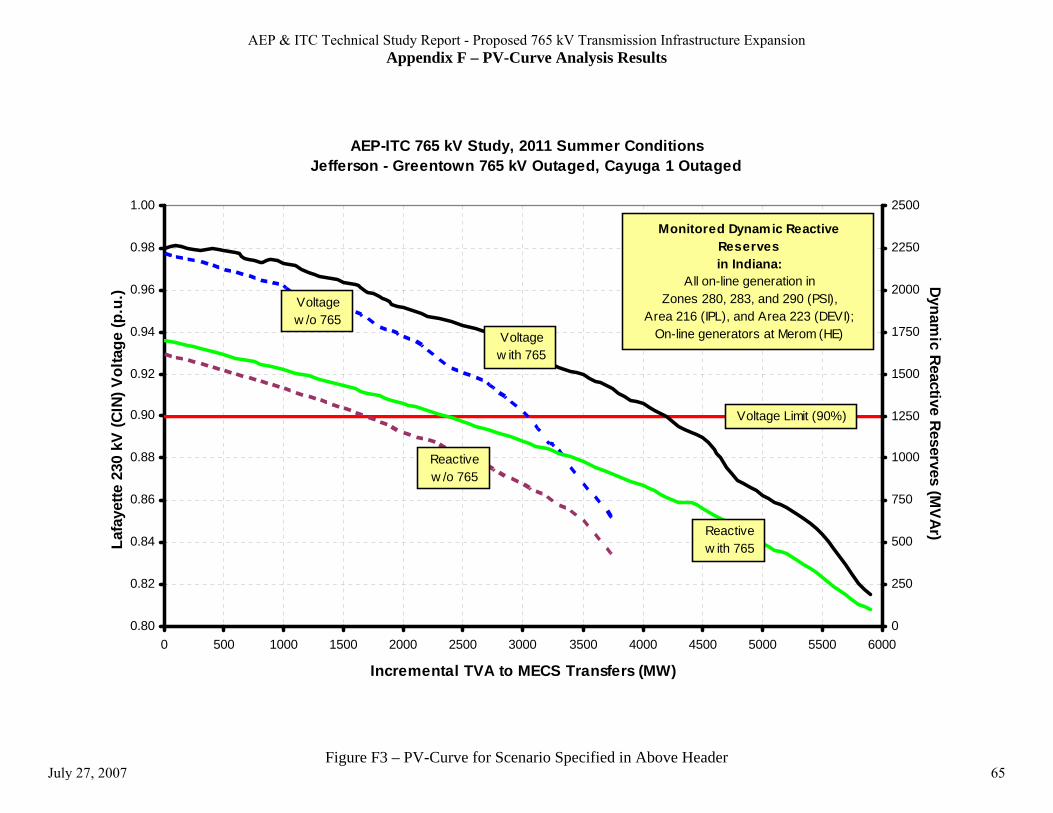
Appendix F – PV-Curve Analysis Results
Figure F3 – PV-Curve for Scenario Specified in Above Header
AEP-ITC 765 kV Study, 2011 Summer ConditionsJefferson - Greentown 765 kV Outaged, Cayuga 1 Outaged
0.80
0.82
0.84
0.86
0.88
0.90
0.92
0.94
0.96
0.98
1.00
0 500 1000 1500 2000 2500 3000 3500 4000 4500 5000 5500 6000
Incremental TVA to MECS Transfers (MW)
Lafa
yette
230
kV
(CIN
) Vol
tage
(p.u
.)
0
250
500
750
1000
1250
1500
1750
2000
2250
2500
Dynamic Reactive Reserves (M
VAr)
Voltage Limit (90%)
Voltagew /o 765
Monitored Dynamic Reactive Reservesin Indiana:
All on-line generation inZones 280, 283, and 290 (PSI),
Area 216 (IPL), and Area 223 (DEVI);On-line generators at Merom (HE)Voltage
w ith 765
Reactivew /o 765
Reactivew ith 765
AEP & ITC Technical Study Report - Proposed 765 kV Transmission Infrastructure Expansion
July 27, 2007 65

Appendix F – PV-Curve Analysis Results
Figure F4 – PV-Curve for Scenario Specified in Above Header
AEP-ITC 765 kV Study, 2011 Summer ConditionsPalisades - Argenta 345 kV #1 & #2 DCT Outaged, Palisades 1 Outaged
0.89
0.90
0.91
0.92
0.93
0.94
0.95
0.96
0.97
0.98
0.99
1.00
0 500 1000 1500 2000 2500 3000 3500 4000 4500 5000 5500
Incremental MISO to MECS Transfers (MW)
Arge
nta
345
kV (M
ETC
) Vol
tage
(p.u
.)
1800
2100
2400
2700
3000
3300
3600
3900
4200
4500
4800
5100
Dynam
ic Reactive Reserves (MVA
r)
Voltage Limit (92%)
Monitored DynamicReactive Reserves:
All on-line generation in Area 218 (METC)
Reactivew ith 765
Reactivew /o 765
Voltagew /o 765
Voltagew ith 765
AEP & ITC Technical Study Report - Proposed 765 kV Transmission Infrastructure Expansion
July 27, 2007 66

Appendix F – PV-Curve Analysis Results
Figure F5 – PV-Curve for Scenario Specified in Above Header
AEP-ITC 765 kV Study, 2011 Summer ConditionsArgenta - Tompkins 345 kV & Argenta - Battle Creek 345 kV DCT Outaged,
Palisades 1 Outaged
0.940
0.945
0.950
0.955
0.960
0.965
0.970
0.975
0.980
0.985
0 500 1000 1500 2000 2500 3000 3500 4000 4500
Incremental MISO to MECS Transfers (MW)
Tom
pkin
s 34
5 kV
(MET
C)Vo
ltage
(p.u
.)
2500
3000
3500
4000
4500
5000
5500
6000
6500
7000
Dynam
ic Reactive Reserves (MVA
r)
Voltage Limit (97%)
Monitored DynamicReactive Reserves:All on-line generation in
Area 218 (METC) and Area 219 (SE MI)
Reactivew ith 765
Reactivew /o 765
Voltagew /o 765
Voltagew ith 765
AEP & ITC Technical Study Report - Proposed 765 kV Transmission Infrastructure Expansion
July 27, 2007 67

Appendix F – PV-Curve Analysis Results
Figure F6 – PV-Curve for Scenario Specified in Above Header
AEP-ITC 765 kV Study, 2011 Summer ConditionsMajestic - Milan 345 kV & Majestic - Lemoyne 345 kV DCT Outaged Before Improvements/
Majestic - Bridgewater 345 kV #1 & #2 DCT Outaged After Improvements,Davis Besse 1 and Monroe 1 Outaged
0.90
0.91
0.92
0.93
0.94
0.95
0.96
0.97
0.98
0.99
0 500 1000 1500 2000 2500 3000 3500 4000 4500
Incremental NI-AMRN to MECS Transfers (MW)
Tom
pkin
s 34
5 kV
(ME
TC)
Vol
tage
(p.u
.)
2000
2500
3000
3500
4000
4500
5000
5500
6000
6500
Dynamic Reactive Reserves (M
VAr)
Voltage Limit (97%)
Monitored DynamicReactive Reserves:All on-line generation in
Area 218 (METC) and Area 219 (SE MI)
Reactivew ith 765
Reactivew /o 765
Voltagew /o 765
Voltagew ith 765
AEP & ITC Technical Study Report - Proposed 765 kV Transmission Infrastructure Expansion
July 27, 2007 68

Appendix F – PV-Curve Analysis Results
Figure F7 – PV-Curve for Scenario Specified in Above Header
AEP-ITC 765 kV Study, 2011 Summer ConditionsHampton - Pontiac 345 kV & Thetford - Jewel 345 kV DCT Outaged,
Greenwood 1 Outaged
0.915
0.920
0.925
0.930
0.935
0.940
0.945
0.950
0.955
0 200 400 600 800 1000 1200 1400 1600
Incremental MISO (non-MECS) to Southeast Michigan Transfers (MW)
3000
3500
4000
4500
5000
5500
6000
6500
7000
Dynamic Reactive Reserves (M
VAr)
Voltage Limit (92%)
Monitored DynamicReactive Reserves:All on-line generation in
Area 218 (METC) and Area 219 (SE MI)
Reactivew ith 765
Reactivew /o 765
Voltagew /o 765
Voltagew ith 765
Pon
tiac
345
kV (S
E M
I) V
olta
ge (p
.u.)
AEP & ITC Technical Study Report - Proposed 765 kV Transmission Infrastructure Expansion
July 27, 2007 69

Appendix F – PV-Curve Analysis Results
Figure F8 – PV-Curve for Scenario Specified in Above Header
AEP-ITC 765 kV Study, 2011 Summer ConditionsBelle River - Pontiac - Greenwood 345 kV & Belle River - Blackfoot 345 kV DCT Outaged,
Saint Clair 4 Outaged
0.910
0.915
0.920
0.925
0.930
0.935
0.940
0.945
0.950
0.955
0.960
0.965
0 250 500 750 1000 1250 1500 1750 2000 2250 2500 2750 3000
Incremental MISO (non-MECS) to Southeast Michigan Transfers (MW)
1500
2000
2500
3000
3500
4000
4500
5000
5500
6000
6500
7000
Dynamic Reactive Reserves (M
VAr)
Voltage Limit (92%)Monitored DynamicReactive Reserves:All on-line generation in
Area 218 (METC) and Area 219 (SE MI)
Reactivew ith 765
Reactivew /o 765
Voltagew /o 765
Voltagew ith 765
Note:Greenw ood generation is forced out w henBelle River - Pontiac - Greenw ood 345 kV
is outaged.
Pont
iac
345
kV (S
E M
I) Vo
ltage
(p.u
.)
AEP & ITC Technical Study Report - Proposed 765 kV Transmission Infrastructure Expansion
July 27, 2007 70

Appendix F – PV-Curve Analysis Results
Figure F9 – PV-Curve for Scenario Specified in Above Header
AEP-ITC 765 kV Study, 2011 Summer ConditionsDavis-Besse - Hayes - Beaver 345 kV Outaged, Eastlake 5 & Monroe 1 Outaged
0.89
0.90
0.91
0.92
0.93
0.94
0.95
0.96
0.97
0.98
0.99
1.00
0 500 1000 1500 2000 2500 3000 3500 4000 4500 5000 5500 6000 6500 7000 7500
Incremental Mid-Atlantic to MECS Transfers (MW)
Otta
wa
138
kV (F
E) V
olta
ge (p
.u.)
0
150
300
450
600
750
900
1050
1200
1350
1500
1650
Dynamic Reactive Reserves (M
VAr)
Voltage Limit (90%)
Monitored DynamicReactive Reserves:On-line generators at
Davis-Besse (FE), Bayshore (FE),Lemoyne (FE), Richland (FE),Fermi (SE MI), Monroe (SE MI),
and Whiting (SE MI)Reactivew ith 765
Reactivew /o 765
Voltagew ith 765
Voltagew /o 765
AEP & ITC Technical Study Report - Proposed 765 kV Transmission Infrastructure Expansion
July 27, 2007 71

Appendix F – PV-Curve Analysis Results
Figure F10 – PV-Curve for Scenario Specified in Above Header
AEP-ITC 765 kV Study, 2011 Summer ConditionsDavis-Besse - Lemoyne 345 kV Outaged, Monroe 1 & 3 Outaged
0.91
0.92
0.93
0.94
0.95
0.96
0.97
0.98
0.99
1.00
1.01
0 500 1000 1500 2000 2500 3000 3500 4000 4500 5000 5500 6000
Incremental VACAR to MECS Transfers (MW)
Fost
oria
Cen
tral 1
38 k
V (A
EP
)V
olta
ge (p
.u.)
0
125
250
375
500
625
750
875
1000
1125
1250
Dynam
ic Reactive R
eserves (MV
Ar)
Voltage Limit (92%)
Monitored DynamicReactive Reserves:On-line generators at
Davis-Besse (FE), Bayshore (FE),Lemoyne (FE), Richland (FE),Fermi (SE MI), Monroe (SE MI),
Whiting (SE MI), and Conesville (AEP)Reactivew ith 765
Reactivew /o 765
Voltagew ith 765
Voltagew /o 765
Dynamic reactive resources at Belle River andGreenw ood Energy Center (ITC) w ere increased in order
to achieve the maximum transfer test level show n.
AEP & ITC Technical Study Report - Proposed 765 kV Transmission Infrastructure Expansion
July 27, 2007 72

Appendix F – PV-Curve Analysis Results
Figure F11 – PV-Curve for Scenario Specified in Above Header
AEP-ITC 765 kV Study, 2011 Summer ConditionsHanna - Juniper 345 kV Outaged, Eastlake 5 Outaged
0.91
0.92
0.93
0.94
0.95
0.96
0.97
0.98
0.99
1.00
0 500 1000 1500 2000 2500 3000 3500 4000 4500 5000 5500 6000 6500
Incremental VACAR to MECS Transfers (MW)
Juni
per
345
kV (F
E) V
olta
ge (p
.u.)
100
200
300
400
500
600
700
800
900
1000
Dynamic Reactive Reserves (M
VAr)
Voltage Limit (92%)
Monitored DynamicReactive Reserves:On-line generators at
Ashtabula (FE), Avon Lake (FE),Eastlake (FE), Lakeshore (FE),Perry (FE), West Lorain (FE),
and Seneca (PENELEC)
Reactivew ith 765
Reactivew /o 765
Voltagew ith 765
Voltagew /o 765
AEP & ITC Technical Study Report - Proposed 765 kV Transmission Infrastructure Expansion
July 27, 2007 73

Appendix F – PV-Curve Analysis Results
Figure F12 – PV-Curve for Scenario Specified in Above Header
AEP-ITC 765 kV Study, 2011 Summer ConditionsMarysville 765-345 kV Outaged, Conesville 4 & 5 Outaged
0.78
0.80
0.82
0.84
0.86
0.88
0.90
0.92
0.94
0 500 1000 1500 2000 2500 3000 3500 4000 4500 5000 5500 6000 6500
Incremental VACAR to MECS Transfers (MW)
Sai
nt C
lair
138
kV
(AE
P)V
olta
ge (p
.u.)
-20
0
20
40
60
80
100
120
140
Dynamic Reactive Reserves (M
VAr)
Voltage Limit (92%)
Monitored DynamicReactive Reserves:On-line generators at
Conesville (AEP) and Picw ay (AEP)
Reactivew ith 765
Reactivew /o 765
Voltagew ith 765
Voltagew /o 765
AEP & ITC Technical Study Report - Proposed 765 kV Transmission Infrastructure Expansion
July 27, 2007 74

Appendix F – PV-Curve Analysis Results
Figure F13 – PV-Curve for Scenario Specified in Above Header
AEP-ITC 765 kV Study, 2011 Summer ConditionsLudington Pumped Storage in Pumping Mode
No Transmission Outage, Palisades 1 and Cook 1 Outaged
0.90
0.91
0.92
0.93
0.94
0.95
0.96
0.97
0.98
0.99
1.00
1.01
1.02
1.03
0 250 500 750 1000 1250 1500 1750 2000 2250 2500 2750 3000 3250
Incremental NI-AMRN to MECS Transfers (MW)
Pal
isad
es 3
45 k
V (M
ETC
)Vo
ltage
(p.u
.)
2300
2450
2600
2750
2900
3050
3200
3350
3500
3650
3800
3950
4100
4250
Dynamic Reactive Reserves (M
VAr)
Voltage Limit (97%)
Monitored DynamicReactive Reserves:
All on-line generation in Area 218 (METC)
Reactivew ith 765
Reactivew /o 765
Voltagew /o 765
Voltagew ith 765
AEP & ITC Technical Study Report - Proposed 765 kV Transmission Infrastructure Expansion
July 27, 2007 75

Appendix F – PV-Curve Analysis Results
Figure F14 – PV-Curve for Scenario Specified in Above Header
AEP-ITC 765 kV Study, 2011 Summer ConditionsLudington Pumped Storage in Pumping Mode
Palisades - Argenta 345 kV #1 & #2 DCT Outaged, No Generation Outaged
0.89
0.90
0.91
0.92
0.93
0.94
0.95
0.96
0.97
0.98
0.99
1.00
0 500 1000 1500 2000 2500 3000 3500 4000 4500 5000 5500 6000
Incremental MISO (non-MECS) to Southeast Michigan Transfers (MW)
1750
2000
2250
2500
2750
3000
3250
3500
3750
4000
4250
4500
Dynam
ic Reactive Reserves (M
VA
r)
Voltage Limit (92%)
Monitored DynamicReactive Reserves:
All on-line generation in Area 218 (METC)
Reactivew ith 765
Reactivew /o 765
Voltagew /o 765
Voltagew ith 765
Arg
enta
345
kV
(ME
TC) V
olta
ge (p
.u.)
AEP & ITC Technical Study Report - Proposed 765 kV Transmission Infrastructure Expansion
July 27, 2007 76

Appendix F – PV-Curve Analysis Results
Figure F15 – PV-Curve for Scenario Specified in Above Header
AEP-ITC 765 kV Study, 2011 Summer ConditionsLudington Pumped Storage in Pumping Mode
Argenta - Tompkins 345 kV & Argenta - Battle Creek 345 kV DCT Outaged,No Generation Outaged
0.955
0.960
0.965
0.970
0.975
0.980
0.985
0.990
0.995
1.000
1.005
1.010
0 500 1000 1500 2000 2500 3000 3500 4000 4500 5000 5500 6000
Incremental MISO (non-MECS) to Southeast Michigan Transfers (MW)
Tom
pkin
s 34
5 kV
(ME
TC)
Vol
tage
(p.u
.)
2000
2750
3500
4250
5000
5750
6500
7250
8000
8750
9500
10250
Dynam
ic Reactive R
eserves (MV
Ar)
Voltage Limit (97%)
Monitored DynamicReactive Reserves:All on-line generation in
Area 218 (METC) and Area 219 (SE MI)
Reactivew ith 765Reactive
w /o 765
Voltagew /o 765
Voltagew ith 765
AEP & ITC Technical Study Report - Proposed 765 kV Transmission Infrastructure Expansion
July 27, 2007 77

Appendix G
Cascading Analysis Results
AEP & ITC Technical Study Report - Proposed 765 kV Transmission Infrastructure Expansion
July 27, 2007 78

Appendix G – Cascading Analysis Results
Page 2 of 14
Introduction Several NERC category C or D contingencies were selected to illustrate the effects of the 765 kV project on system performance under higher-order contingencies. The contingencies selected have been identified in previous studies as potentially triggering cascading, or are known to be highly sensitive to imports into Michigan, and are electrically located in or near the area expected to be impacted by the 765kV project. Scenarios Selected
Summary of Results
CONTINGENCY
Without 765kV Project
With
765 kV Project
I. Cook 765/345 kV T-4 & Dumont 765/345 kV T-1
Cascading-Arrested No Cascading
II. Palisades-Cook/Palisades-BentonHarbor 345kV DCT
Non- Convergent No Cascading
IIIa. Pontiac-Hampton/Jewell-Thetford 345kV DCT-peak
Cascading-Arrested No Cascading
IIIb. Pontiac-Hampton/Jewell-Thetford 345kV DCT-with heavier METC-SE Michigan transfers
Non- Convergent
Cascading-Arrested
IV. Bayshore South Corridor Outage
Non- Convergent
Non- Convergent
V. Galion (FE) 345 kV Station Outage
No Cascading No Cascading
VI. Tidd-Canton Central 345 kV & Kammer-S Canton 765 kV
No Cascading No Cascading
VII. Marysville 765/345 kV T-1 & Ohio Central-Galion 345 kV
Cascading-Arrested No Cascading
AEP & ITC Technical Study Report - Proposed 765 kV Transmission Infrastructure Expansion
July 27, 2007 79
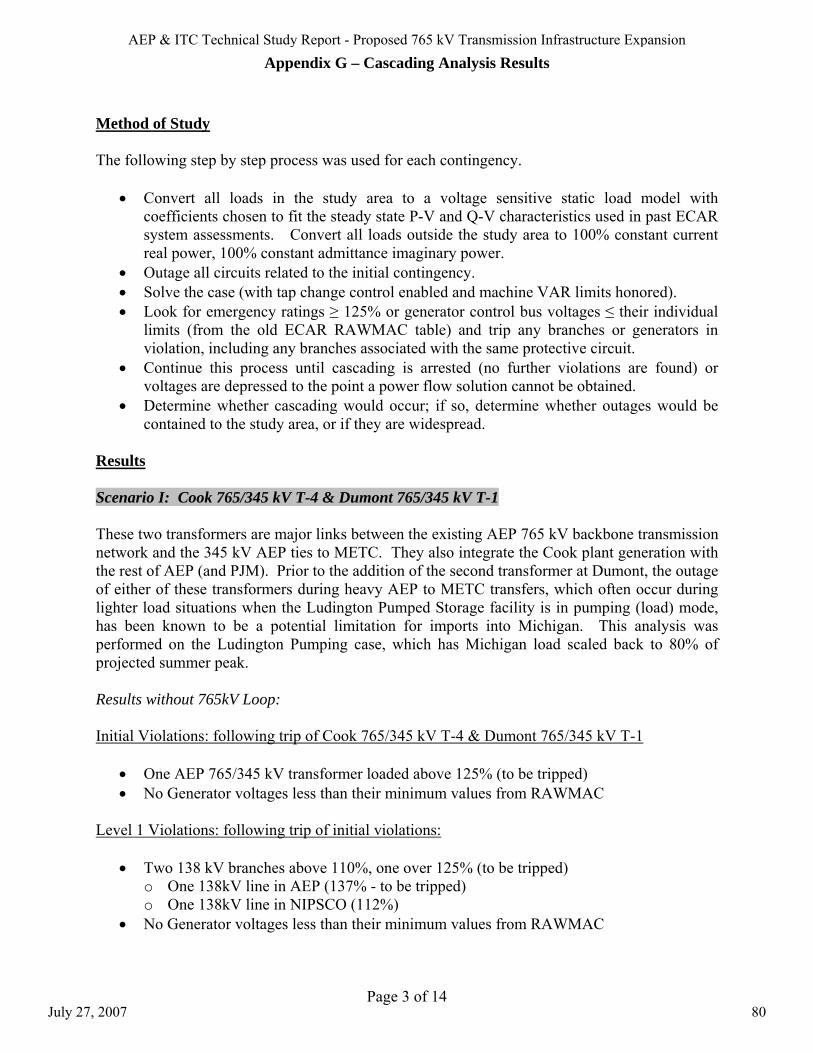
Appendix G – Cascading Analysis Results
Page 3 of 14
Method of Study The following step by step process was used for each contingency.
• Convert all loads in the study area to a voltage sensitive static load model with coefficients chosen to fit the steady state P-V and Q-V characteristics used in past ECAR system assessments. Convert all loads outside the study area to 100% constant current real power, 100% constant admittance imaginary power.
• Outage all circuits related to the initial contingency. • Solve the case (with tap change control enabled and machine VAR limits honored). • Look for emergency ratings ≥ 125% or generator control bus voltages ≤ their individual
limits (from the old ECAR RAWMAC table) and trip any branches or generators in violation, including any branches associated with the same protective circuit.
• Continue this process until cascading is arrested (no further violations are found) or voltages are depressed to the point a power flow solution cannot be obtained.
• Determine whether cascading would occur; if so, determine whether outages would be contained to the study area, or if they are widespread.
Results Scenario I: Cook 765/345 kV T-4 & Dumont 765/345 kV T-1 These two transformers are major links between the existing AEP 765 kV backbone transmission network and the 345 kV AEP ties to METC. They also integrate the Cook plant generation with the rest of AEP (and PJM). Prior to the addition of the second transformer at Dumont, the outage of either of these transformers during heavy AEP to METC transfers, which often occur during lighter load situations when the Ludington Pumped Storage facility is in pumping (load) mode, has been known to be a potential limitation for imports into Michigan. This analysis was performed on the Ludington Pumping case, which has Michigan load scaled back to 80% of projected summer peak. Results without 765kV Loop: Initial Violations: following trip of Cook 765/345 kV T-4 & Dumont 765/345 kV T-1
• One AEP 765/345 kV transformer loaded above 125% (to be tripped) • No Generator voltages less than their minimum values from RAWMAC
Level 1 Violations: following trip of initial violations:
• Two 138 kV branches above 110%, one over 125% (to be tripped) o One 138kV line in AEP (137% - to be tripped) o One 138kV line in NIPSCO (112%)
• No Generator voltages less than their minimum values from RAWMAC
AEP & ITC Technical Study Report - Proposed 765 kV Transmission Infrastructure Expansion
July 27, 2007 80

Appendix G – Cascading Analysis Results
Page 4 of 14
Level 2 Violations: following trip of Level 1 violations:
• One 138 kV branch above 110%, none over 125%. • General voltage depression across northern Indiana/southwest Michigan
o Voltages at about 20 138 kV buses are below 90% o Lowest in AEP just south of Ft Wayne at 87.9%
• No Generator voltages less than their minimum values from RAWMAC • Cascade halted for modeled conditions; due to degree of voltage depression some local
loads may be lost. Results with 765kV Loop: Initial Violations: following trip of Cook 765/345 kV T-4 & Dumont 765/345 kV T-1
• No branches above 110% • No Generators less than their minimum values from RAWMAC • Ft Wayne area 138 kV voltages > 95%
Summary of Cook 765/345 kV T-4 & Dumont 765/345 kV T-1: Without 765kV Loop
• All three Cook and Dumont 765/345 kV transformers tripped • One AEP 138 kV line tripped • Northern Indiana AEP bus voltages < 90%
With 765kV Loop
• No lines, transformers, generators or load lost subsequent to initial event Scenario II: Palisades-Cook / Palisades – Benton Harbor 345kV DCT These two circuits are interconnections between the METC and AEP systems. They are on same 345kV tower for approximately 32 miles. The outage of this tower during heavy AEP to METC transfers, which often occur during lighter load periods when the Ludington Pumped Storage facility is in pumping (load) mode, has been known as a potential limitation for imports into Michigan. This analysis was performed on the Ludington Pumping case, which has Michigan load scaled back to 80% of projected summer peak. Results without 765kV Loop: Initial Violations: following trip of Palisades-Cook / Palisades-Benton Harbor 345kV DCT:
• Two branches above 110%, one over 125% o One 345kV interconnection line between METC and AEP (125% - to be tripped)
• No Generators less than their minimum values from RAWMAC
AEP & ITC Technical Study Report - Proposed 765 kV Transmission Infrastructure Expansion
July 27, 2007 81

Appendix G – Cascading Analysis Results
Page 5 of 14
Level 1 Violations: following trip of initial violations:
• Eight branches above 110%, three over 125% o One 345kV interconnection line between METC and AEP (128% - to be tripped) o One 138kV line in AEP o One 138kV line in NIPSCO o One 69kV interconnection line between AEP and NIPSCO (125% - to be tripped) o Four 69kV lines in NIPSCO (one at 167% - to be tripped)
• No Generators less than their minimum values from RAWMAC Level 2 Violations: following trip of Level 1 violations:
• Voltage Collapse in AEP and NIPSCO. Non-convergent power flow solution. Results with 765kV Loop: Initial Violations: following trip of Palisades-Cook / Palisades-Benton Harbor 345kV DCT:
• No branches above 110% • No Generators less than their minimum values from RAWMAC
Summary of Palisades-Cook / Palisades-Benton Harbor 345kV DCT: Without 765kV Loop
• All four AEP-METC 345kV interconnection lines tripped • Five 69kV lines in AEP/NIPSCO tripped • Voltage Collapse in NIPSCO area • Cascading limited to northern AEP and NIPSCO area
With 765kV Loop
• No lines, transformers, generators or load lost
Scenarios IIIa & IIIb: Pontiac – Hampton / Jewell – Thetford 345kV DCT These two circuits are interconnections between the Southeast Michigan and METC systems. They are on same 345kV tower for approximately 17 miles. The outage of this tower during peak loads, especially during heavy METC to Southeast Michigan transfers, has been a concern and been studied for several years. This analysis was performed twice: once on the peak case, the second time with heavier transfers across the METC-Southeast Michigan interface. In the base case, METC to Southeast Michigan interface flow was approximately 1950 MW. In the high transfer case, the flow was increased to approximately 2650 MW by generation outages in Southeast Michigan along with overlaying transfers to Canada. Higher levels of transfers led to extremely depressed voltages and a divergent base case solution. Each analysis was performed
AEP & ITC Technical Study Report - Proposed 765 kV Transmission Infrastructure Expansion
July 27, 2007 82

Appendix G – Cascading Analysis Results
Page 6 of 14
without and with the 765kV looped system in place. Scenario IIIa Peak Case Results Results without 765kV Loop: Initial Violations: following trip of Pontiac – Hampton / Jewell – Thetford 345kV DCT:
• Three branches above 110%, but none over 125% o One 138/46kV transformer in METC o One 46kV line in METC o One 41.6kV line in Southeast Michigan
• Six Generators less than their minimum values from RAWMAC – to be tripped o 445 MW total in METC
Level 1 Violations: following trip of initial violations:
• Six branches above 110%, two over 125% o One 138kV line in METC (163% - to be tripped) o One 46kV line in METC (147% - to be tripped) o Three 138/46kV transformers in METC o One 41.6kV line in Southeast Michigan
• Six Generators less than their minimum values from RAWMAC– to be tripped o 86 MW total in METC o 5 MW total in Southeast Michigan
Level 2 Violations: following trip of Level 1 violations:
• Sixteen branches above 110%, six over 125% o Nine 138kV lines in METC (six between 138%-248%, to be tripped) o Three 46kV lines in METC o Three 138/46kV transformers in METC o One 41.6kV line in Southeast Michigan
• No Generators less than their minimum values from RAWMAC Level 3 Violations: following trip of Level 2 violations:
• Three branches above 110%, none over 125% o One 46kV line in METC o One 138/46kV transformer in METC o One 41.6kV line in Southeast Michigan
• No Generators less than their minimum values from RAWMAC
AEP & ITC Technical Study Report - Proposed 765 kV Transmission Infrastructure Expansion
July 27, 2007 83

Appendix G – Cascading Analysis Results
Page 7 of 14
Results with 765kV Loop: Initial Violations: following trip of Pontiac – Hampton / Jewell – Thetford 345kV DCT:
• One branch above 110%, but none over 125% o One 138/46kV transformer in METC
• No generators less than their minimum values from RAWMAC Summary of Pontiac – Hampton / Jewell – Thetford 345kV DCT – Peak Case : Without 765kV Loop
• Seven 138kV and one 46kV lines tripped • 536 MW of generation tripped offline due to low voltage • 634 MW of load tripped due to isolated circuit feeds • Cascading limited to central METC/Southeast Michigan area
With 765kV Loop
• No lines, transformers, generators or load lost Scenario IIIb Peak case with High Transfers Results Results without 765kV Loop: Initial Violations: following trip of Pontiac – Hampton / Jewell – Thetford 345kV DCT:
• Twenty two branches above 110%, three over 125% o Seven 138kV lines in METC o Four 120kV lines in ITC o Five 138/46kV transformers in METC (one at 126% - to be tripped) o Two 46kV lines in METC (one at 138% - to be tripped) o Four 41.6kV lines in Southeast Michigan (one at 145% - to be tripped)
• Thirty Four Generators less than their minimum values from RAWMAC – to be tripped o 534 MW total in METC o 5853 MW total in ITC
Level 1 Violations: following trip of initial violations:
• Voltage collapse across METC and ITC Transmission. Non-convergent power flow
solution. Results with 765kV Loop: Initial Violations: following trip of Pontiac – Hampton / Jewell – Thetford 345kV DCT:
AEP & ITC Technical Study Report - Proposed 765 kV Transmission Infrastructure Expansion
July 27, 2007 84

Appendix G – Cascading Analysis Results
Page 8 of 14
• Three branches above 110%, none over 125% o One 138/46kV transformer in METC o Two 41.6kV lines in Southeast Michigan
• Four generators less than their minimum values from RAWMAC – to be tripped. o 5 MW total in METC o 62 MW total in ITC
Level 1 Violations: following trip of initial violations:
• Three branches above 110%, none over 125% o One 138/46kV transformer in METC o Two 41.6kV lines in Southeast Michigan
• No generators less than their minimum values from RAWMAC Summary of Pontiac – Hampton / Jewell – Thetford 345kV DCT – Peak High Transfer Case: Without 765kV Loop
• Seven 138kV and two 46kV lines tripped in METC • Four 120kV and four 41.6kV lines tripped in Southeast Michigan • 6387 MW of generation tripped offline due to low voltage • Unknown amount of load tripped offline • Complete voltage collapse in Southeast Michigan and parts of METC. • Potential for cascading to other areas
With 765kV Loop
• 67 MW of generation tripped offline due to low voltage • No lines, transformers, or load lost
Scenario IV: Bayshore South Corridor Outage This corridor contingency isolates the entire Bayshore station, a significant generating plant in the vicinity of Toledo, Ohio. It is also a key point in the northwestern Ohio transmission network, with a 345 kV line to the Davis-Besse nuclear plant as well as 345 kV interconnections to AEP (Fostoria) and ITC (Monroe). The complete contingency results in outage of all 3 – 345 kV outlets, the 345/138 kV transformer, and all 8 - 138 kV outlets. Breaker to breaker switching results in outage of 17 - 138 kV line segments, as well as 2 - 138/72 kV transformers. The 4 -138 kV-connected generating units, with a combined capability of 664 MW, are trapped. Previous studies have indicated that this contingency may result in non-convergence under a variety of operating conditions. This analysis was performed on the peak load case.
AEP & ITC Technical Study Report - Proposed 765 kV Transmission Infrastructure Expansion
July 27, 2007 85

Appendix G – Cascading Analysis Results
Page 9 of 14
Peak CaseResults Results without 765kV Loop:
Initial Violations: following trip of the Bayshore South Corridor:
• Eight branches in FE above 110%, three over 125% (to be tripped)
o Two 138 kV branches (141% and 152% - to be tripped, additional branches removed due to switching configuration)
o One 72 kV branch (166% - to be tripped) • No Generators less than their minimum values from RAWMAC
o 38 -138 kV Toledo area buses below 0.90, lowest is 0.77 o 9 – 72 kV Toledo area buses below 0.90, lowest 0.78
Level 1 Violations: following trip of initial violations:
• Fourteen branches in FE above 110%, eleven over 125% (to be tripped) o One 345k/138 kV transformer (140% - to be tripped) o One 138kV bus tie (127% - to be tripped) o Five 138kV branches (129% to 176% - to be tripped, additional branches
removed due to switching configuration) o Three 138/72kV transformers at 125% - to be tripped)
• No Generators less than their minimum values from RAWMAC o 59 – 138 kV Toledo area buses below 0.90, lowest is 0.46 o 13 – 72 kV Toledo area buses below 0,90, lowest is 0.48
Level 2 Violations: following trip of Level 1 violations:
• Voltage Collapse in Toledo area of FirstEnergy. Power flow Non-Convergent. No indication of spread beyond Toledo area.
Results with 765kV Loop: Initial Violations: following trip of the Bayshore South Corridor:
• Five branches in FE above 110%, three over 125% o Two 138 kV branches (130% and 134% - to be tripped, additional branches
removed due to switching configuration) o One 72 kV branch (133% - to be tripped
• No Generators less than their minimum values from RAWMAC o 31 -138 kV Toledo area buses below 0.90, lowest 0.80 o 9 – 72 kV Toledo area buses below 0.90, lowest 0.81
AEP & ITC Technical Study Report - Proposed 765 kV Transmission Infrastructure Expansion
July 27, 2007 86
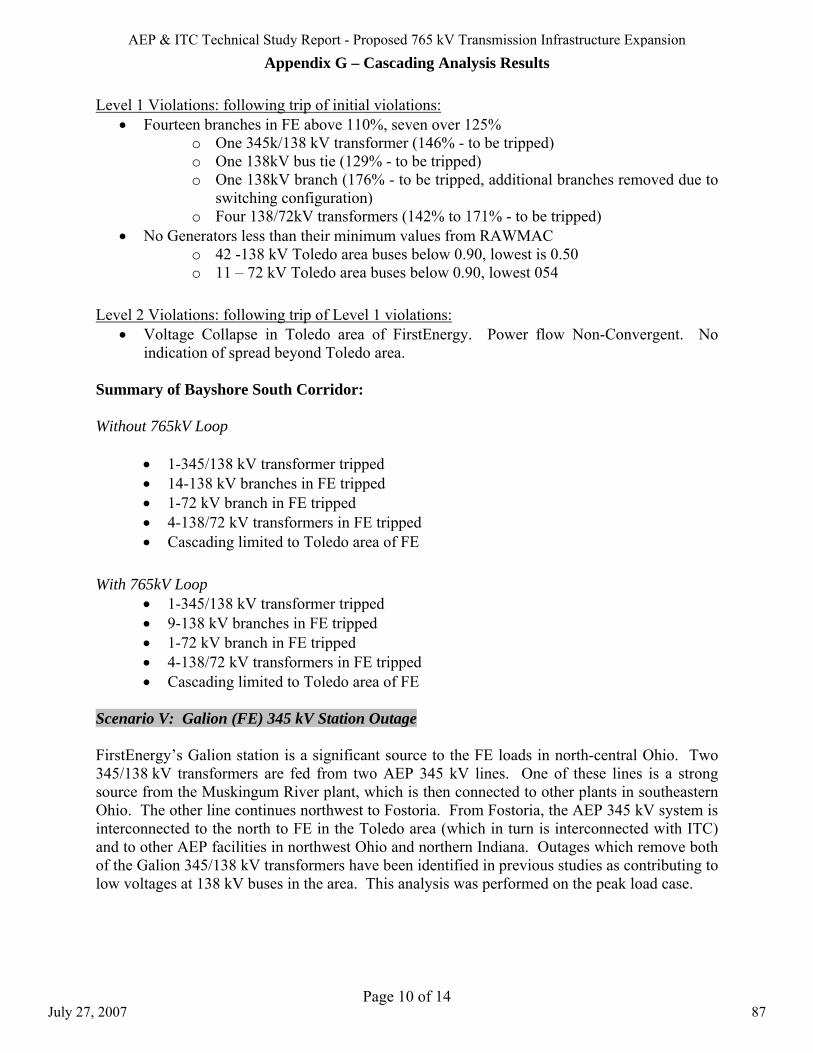
Appendix G – Cascading Analysis Results
Page 10 of 14
Level 1 Violations: following trip of initial violations: • Fourteen branches in FE above 110%, seven over 125%
o One 345k/138 kV transformer (146% - to be tripped) o One 138kV bus tie (129% - to be tripped) o One 138kV branch (176% - to be tripped, additional branches removed due to
switching configuration) o Four 138/72kV transformers (142% to 171% - to be tripped)
• No Generators less than their minimum values from RAWMAC o 42 -138 kV Toledo area buses below 0.90, lowest is 0.50 o 11 – 72 kV Toledo area buses below 0.90, lowest 054
Level 2 Violations: following trip of Level 1 violations:
• Voltage Collapse in Toledo area of FirstEnergy. Power flow Non-Convergent. No indication of spread beyond Toledo area.
Summary of Bayshore South Corridor: Without 765kV Loop
• 1-345/138 kV transformer tripped • 14-138 kV branches in FE tripped • 1-72 kV branch in FE tripped • 4-138/72 kV transformers in FE tripped • Cascading limited to Toledo area of FE
With 765kV Loop
• 1-345/138 kV transformer tripped • 9-138 kV branches in FE tripped • 1-72 kV branch in FE tripped • 4-138/72 kV transformers in FE tripped • Cascading limited to Toledo area of FE
Scenario V: Galion (FE) 345 kV Station Outage FirstEnergy’s Galion station is a significant source to the FE loads in north-central Ohio. Two 345/138 kV transformers are fed from two AEP 345 kV lines. One of these lines is a strong source from the Muskingum River plant, which is then connected to other plants in southeastern Ohio. The other line continues northwest to Fostoria. From Fostoria, the AEP 345 kV system is interconnected to the north to FE in the Toledo area (which in turn is interconnected with ITC) and to other AEP facilities in northwest Ohio and northern Indiana. Outages which remove both of the Galion 345/138 kV transformers have been identified in previous studies as contributing to low voltages at 138 kV buses in the area. This analysis was performed on the peak load case.
AEP & ITC Technical Study Report - Proposed 765 kV Transmission Infrastructure Expansion
July 27, 2007 87

Appendix G – Cascading Analysis Results
Page 11 of 14
Results without 765kV Loop: Initial Violations: following trip of Galion 345 kV station:
• No branches above 110% • No Generators less than their minimum values from RAWMAC
o Low point in Galion area – Cardington 138 kV @ 92.4% • No Cascading as studied
Results with 765kV Loop: Initial Violations: following trip of Galion 345 kV station:
• No branches above 110% • No Generators less than their minimum values from RAWMAC
o Low point in Galion area – Cardington 138 kV @ 93.7% • No Cascading as studied
Summary of Galion 345kV Station outage: Without 765kV Loop
• Two AEP-FE 345 kV ties and two FE 345/138 kV transformers tripped • No lines, transformers, generators or load lost subsequent to initial event
With 765kV Loop
• No lines, transformers, generators or load lost subsequent to initial event • Area post-contingency voltages improved compared to without loop
Scenario VI: Tidd-Canton Central 345 kV & Kammer-South Canton 765 kV (also opens South Canton 765/345 kV & South Canton 345/138 kV T-4) These two eastern Ohio facilities are elements of major paths connecting generation along the northern section of the Ohio River with loads to the north and northwest. Both respond significantly to transfers into MECS and FE. The Kammer – South Canton 765 kV line and associated 765/345 kV transformer presently do not have either a high side or dedicated low side circuit breaker, so an outage of the line or transformer is accomplished by clearing the South Canton 345 kV bus # 2. This bus outage also opens the 345 kV feed to South Canton 345/138 kV transformer T-4. Simulation of the Kammer – South Canton line outage with the new 765 kV facilities assumes that additional circuit breakers will be installed, such that each 765 kV element terminated at South Canton will switch independently. Previous studies have shown that the combined outages of the Kammer – South Canton line & transformer and the Tidd – Canton Central 345 kV line may significantly overload remaining facilities, risking subsequent cascading outages in northern Ohio. Several facilities identified as possible overloads contributing to the potential for cascading in previous studies of this outage scenario are being
AEP & ITC Technical Study Report - Proposed 765 kV Transmission Infrastructure Expansion
July 27, 2007 88

Appendix G – Cascading Analysis Results
Page 12 of 14
addressed by other upgrades prior to 2011. The analysis discussed below was performed on the sensitivity case with the Perry unit out of service. Results without 765kV Loop: Initial Violations: following trip of Tidd-Canton Central 345 kV & Kammer-South Canton 765 kV:
• Outage also opens South Canton 765/345 kV transformer and 345/138 kV T-4 • No branches above 110%, highest loading in area of interest 108% • No Generators less than their minimum values from RAWMAC • No Cascading as studied.
Results with 765kV Loop: Initial Violations: following trip of Tidd – Canton Central 345 kV & Kammer – South Canton 765 kV:
• New facilities connected to South Canton change switching; only Kammer-South Canton line opened
• No branches above 110%, facility loaded to 108% without the loop is now loaded to 88%
• No Generators less than their minimum values from RAWMAC Summary of Tidd – Canton Central 345 kV & Kammer-S Canton 765 kV: Without 765kV Loop
• Tidd-Canton Central 345 kV, Kammer – South Canton 765 kV, South Canton 765/345 kV transformer, South Canton 345/138 kV T-4 outaged
• No lines, transformers, generators or load lost subsequent to initial event With 765kV Loop
• No lines, transformers, generators or load lost subsequent to initial event • Flows reduced on heavily loaded lines compared to without loop
Scenario VII: Marysville 765/345 kV T-1 and Ohio Central-Galion 345 kV These two central Ohio facilities are elements of the primary paths connecting concentrations of generation in southern and southeastern Ohio with loads to the north and northwest. Both respond significantly to transfers into MECS and FE. The Marysville autotransformer is a unique bank of 3-1000MVA single phase units. Each phase has two windings on the 345 kV side, which terminate in separate bays. Consequently, clearing a transformer fault will also outage the Marysville-Tangy 345 kV tie to FE. Previous studies have shown that this combination of outages may significantly overload additional facilities, risking subsequent
AEP & ITC Technical Study Report - Proposed 765 kV Transmission Infrastructure Expansion
July 27, 2007 89

Appendix G – Cascading Analysis Results
Page 13 of 14
cascading outages in northern Ohio. Several facilities identified as possible overloads contributing to the potential for cascading in previous studies of this outage scenario are being addressed by other upgrades prior to 2011. The analysis discussed below was performed on the sensitivity case with the Davis-Besse unit out of service. Results without 765kV Loop: Initial Violations: following trip of Marysville 765/345 kV transformer (also trips AEP-FE Marysville-Tangy 345 kV tie) and Ohio Central- Galion 345 kV AEP-FE tie:
• Two FE 138 kV branches and one AEP 345/138 kV transformer above 110% • One of the FE branches is over 125% (to be tripped)
o The second overloaded FE branch is in series with the one to be tripped o The overloaded AEP transformer has a series reactor available to be switched by
operators to reduce flows – for purposes of this simulation this operator intervention is not used
• No Generator terminals at less than their minimum operating voltages from RAWMAC Level 1 Violations: following trip of initial violation:
• One AEP 345/138 kV transformer above 110%, none over 125% • No Generators less than their minimum values from RAWMAC • No further tripping simulated • Assumed that no further cascading would occur
Results with 765kV Loop: Initial Violations: following trip of Marysville 765/345 kV transformer (also traps AEP-FE Marysville-Tangy 345 kV tie) and Ohio Central- Galion 345 kV AEP-FE tie:
• No branches above 110% • No Generators less than their minimum values from RAWMAC
Summary of Marysville 765/345 kV T-1 and Ohio Central-Galion 345 kV: Without 765kV Loop
• Two major central Ohio facilities tripped, Marysville-Tangy 345 kV AEP-FE tie trapped • One 138 kV line in FE tripped tripped due to loading > 125% of SE rating • No other facilities reach assumed 125% tripping threshold • No generator voltages below minimum level documented in ECAR Raw Machine
database • Cascading arrested 1 level beyond initial event
AEP & ITC Technical Study Report - Proposed 765 kV Transmission Infrastructure Expansion
July 27, 2007 90

Appendix G – Cascading Analysis Results
Page 14 of 14
With 765kV Loop
• No facilities outaged beyond initial event
AEP & ITC Technical Study Report - Proposed 765 kV Transmission Infrastructure Expansion
July 27, 2007 91

Appendix H
Comparison of 765 kV vs. 345 kV Transmission
AEP & ITC Technical Study Report - Proposed 765 kV Transmission Infrastructure Expansion
July 27, 2007 92
American Electric Power AEP Interstate Project: 765 kV or 345 kV Transmission
April 24, 2007 RG/ADP 1
TM AEP INTERSTATE PROJECT:
765 kV or 345 kV Transmission
I. Executive Summary American Electric Power (“AEP”) has proposed a national vision of an advanced interstate electrical transmission system that delivers wholesale power efficiently within a competitive market while enhancing regional reliability and reducing overall environmental impact. This vision will feature proven power delivery facilities with the highest transmission capacity now available in the U.S. The result would be the launch of a "transmission superhighway" system modeled after President Eisenhower's national interstate highway transportation plan. To achieve this goal, AEP has proposed several major transmission line projects. The projects will function as a transmission backbone, strengthening existing electrical power systems both within and outside of AEP’s traditional service area. When evaluating and planning these projects, AEP carefully considered modern transmission technologies, including alternating current (“AC”) solutions, direct current (“DC”) solutions and a variety of solutions involving different transmission voltage classes. AEP’s guiding principle is to provide the reliable, efficient, environmentally acceptable transmission capacity and operating flexibility needed for a competitive electricity marketplace. This paper highlights the performance, design and cost advantages of 765 kilovolt (“kV”) as compared to 345 kV transmission. It is presented for consideration in the AEP-ITC technical study of potential 765 kV development in Michigan1. While this paper focuses on the interstate projects planned by AEP, it is relevant to any electric transmission infrastructure. Key advantages of AC transmission technology are its flexibility, expandability into a high-capacity grid and ease of integration with the existing systems. By contrast, traditional DC technology is best suited for specialized applications, such as point-to-point transmission. It has been well established through engineering analysis and practice that a single 765 kV line can carry substantially more power than a similarly situated 345 kV line. Generally, about six single-circuit (or three double-circuit) 345 kV lines are required to achieve the load carrying ability, or loadability, of a single 765 kV line. Furthermore, experience indicates that transmission systems designed for 765 kV operation are inherently more reliable than those operating at lower voltage levels. With up to six conductors per phase, 765 kV lines are virtually free of thermal overload risk, even under severe operating conditions. Moreover, outage statistics show that 765 kV circuits, on average, experience significantly fewer forced outages than their 345 kV counterparts, and there have been no multi-phase faults recorded at 765 kV in normal operation2.
AEP & ITC Technical Study Report - Proposed 765 kV Transmission Infrastructure Expansion
July 27, 2007 93

American Electric Power AEP Interstate Project: 765 kV or 345 kV Transmission
April 24, 2007 RG/ADP 2
This performance record suggests a lesser likelihood and severity of disruptions at 765 kV, and an opportunity to apply effective remedies to further improve the line (and thus system) reliability. The higher operating voltage and large thermal capacity of 765 kV offer an added advantage of markedly greater transmission efficiency relative to 345 kV. It can be demonstrated that a 765 kV line incurs only about one-half of the power losses of the six-circuit 345 kV alternative, both carrying the same amount of power. One of the most sensitive issues in siting a modern day electrical transmission line is its impact on the visual landscape. When comparing the impacts of 765 kV and 345 kV construction, the former clearly has numerous advantages. The right-of-way requirements for 345 kV construction are up to 4½ times greater than for a single 765 kV circuit to move the equivalent amount of power. With fewer transmission lines and less right-of-way necessary, the reduced impact of 765 kV transmission on the visual landscape is significant. Moreover, a typical double-circuit 345 kV structure is actually taller than a 765 kV tower. Per-mile costs of a 765 kV line and a double-circuit 345 kV line are estimated at $2.6 million and $1.5 million, respectively. With three double-circuit 345 kV lines required to match the loadability of a single 765 kV line, an equivalent cost for 345 kV construction is $4.5 million per mile. When considering construction costs, electrical properties, reliability, land use and visual impact, it is apparent that 765 kV offers significant advantages over the competing technologies for use in a modern interstate transmission system. II. Introduction The electric power grid in the eastern U.S. today is characterized by mature, heavily-loaded transmission systems. Both thermal and voltage-related constraints affecting regional power deliveries have been well documented on systems operating at voltages up to and including 345 kV and 500 kV. While various measures to mitigate those constraints are under consideration, and in some cases have been implemented, those measures are largely incremental in scope and aimed at addressing specific, localized network limitations. Incremental measures are a tactical means of shoring up an existing system in the near term. In the long term, a mature system facing continued growth demands can be strengthened most effectively by introducing a proven, higher voltage technology that can provide the transmission capacity and operating flexibility necessary to achieve the goal of a robust, competitive electric marketplace. In November 2006, AEP signed a memorandum of understanding with ITC Transmission, a subsidiary of ITC Holdings Corp (“ITC”), to perform a technical study to evaluate the feasibility of extending AEP’s 765 kV transmission system through Michigan. The study, now under way, explores the benefits of building 765 kV transmission in Michigan’s Lower Peninsula and linking it to AEP’s 2,100-mile 765 kV transmission system in the Midwest. Results of that study will be shared with the Michigan Public Service Commission, Midwest ISO, PJM Interconnection LLC and other parties to help determine the best way to serve Michigan’s future electric energy needs.
AEP & ITC Technical Study Report - Proposed 765 kV Transmission Infrastructure Expansion
July 27, 2007 94
American Electric Power AEP Interstate Project: 765 kV or 345 kV Transmission
April 24, 2007 RG/ADP 3
AEP has considered different transmission technologies for the interstate projects, including AC extra-high-voltage (EHV) transmission options from 345 kV through 765 kV and DC. Higher AC voltages, up to 2,000 kV, also received consideration based on AEP’s prior research and successful testing, but they remain unproven in commercial operation. The attributes of these technologies -- transmission loadability, reliability, losses, right-of-way requirements, line design and field construction challenges, visual impact and cost -- are discussed below. III. AC versus DC Transmission Regional system requirements and proven transmission technologies strongly influenced the conceptual design of the possible transmission development in Michigan. The existing 345 kV AC transmission system in Michigan, introduced as an overlay in the 1960s, was designed to facilitate coordinated operation of the state’s generating stations and provide interconnections for energy and capacity transactions between Michigan Electric Coordinated System and other Midwest utilities. Rising demand and infrastructure underinvestment over the years have caused Michigan’s transmission system to become congested and unable to transport low-cost Midwestern generation to large load centers, such as the Detroit metropolitan area. The system is now mature and facing challenges similar to those experienced some four decades ago. Key advantages of AC transmission technology are its flexibility and widespread use by electric utilities. AC would facilitate future additions of intermediate stations, acting like exit and entrance ramps on an interstate highway, to serve local load centers and/or provide transmission access for new generation that may locate along the way. The ease of AC connections would encourage siting of fuel-diverse, newer technology and environmentally-friendly generators. Also, the use of AC technology would enable expansion into a high-capacity transmission overlay that can be readily integrated with the existing systems where so required. Integration can be achieved using commonly available step-down autotransformers or generator step-up transformers, offering the benefits of enhanced operating flexibility and reduced system losses. By contrast, traditional DC technology is best suited for specialized applications, such as point-to-point transmission traversing sparsely populated areas or where the systems being connected do not operate in synchronism. Examples include underground/ undersea cables, long-distance overhead transmission serving as outlets for generating stations, and asynchronous links between two systems that have either no ties or very weak ties. While DC offers freedom from line charging currents and simpler line design with only one (monopolar) or two (bipolar) power conductors, it requires DC/AC conversion at each terminal to integrate with the existing system. The complexity of DC/AC converters can adversely affect station reliability, posing special concerns at critical system locations. Also, such converters consume large amounts of reactive power and produce current harmonics on the AC side (and voltage harmonics on the DC side) requiring application of remedial measures. Because of the high converter cost, DC generally is not competitive with AC for transmission distances less than 300 miles. A robust, integrated AC transmission grid with ample capacity and flexibility for future growth will provide a solid foundation for reliable service and ease of access to all users.
AEP & ITC Technical Study Report - Proposed 765 kV Transmission Infrastructure Expansion
July 27, 2007 95

American Electric Power AEP Interstate Project: 765 kV or 345 kV Transmission
April 24, 2007 RG/ADP 4
IV. Loadability To assess the loadability of a high-voltage transmission line, planning engineers commonly use the concept of Surge Impedance Loading (SIL). SIL, a loading level at which the line attains reactive power self-sufficiency, is a convenient “yardstick” for measuring relative loadabilities of lines operating at different nominal voltages. It has been shown that, when loadability is expressed in terms of SIL, a single curve known as the “St. Clair curve” can be used to estimate the maximum permissible loading for a given line length3. Reflecting practical considerations and experience, the curve has been a valuable industry tool since its publication in 1953, when the highest transmission voltage in commercial service was 330 kV. The curve was subsequently supported with analytical methods and extended to voltages beyond 330 kV, at which system parameters play an increasingly important role4. Figure 1 shows the extended St. Clair curve. The curve is accompanied by a listing of common transmission line designs and associated SIL values found on the AEP System in the 1970s. The figure does not include AEP’s latest 765 kV design with six-conductor phase bundles, employed for the 90-mile line from Wyoming Station (West Virginia) to Jacksons Ferry Station (Virginia). SIL of this new line is about 2,400 megawatts (“MW”). As shown, loadability of a 150-mile transmission line, typical of proposed line lengths in the AEP-ITC study, is approximately 1.6 SIL. For a 765 kV line (SIL=2,400 MW) the loadability would be 3,800-3,900 MW. The corresponding value for a 345 kV line built with bundled conductors (SIL=390 MW) is 620 MW, or 1,200-1,300 MW for a double-circuit design. It is apparent that a 765 kV line, 150 miles in length, can carry substantially more power than a similarly situated 345 kV line. Generally, about six single-circuit (or three double-circuit) 345 kV lines would be required to achieve the load carrying ability of a single 765 kV line. Apart from its considerably higher loadability, the low-impedance 765 kV grid would help to unload the underlying transmission system, reducing losses and providing much needed margin for local power deliveries. Building 765 kV transmission would represent a strategic decision to strengthen the system beyond near-term needs with ample capacity to accommodate both future load growth and operating uncertainties intrinsic in competitive markets. The generalized line loadability characteristic in Figure 1 incorporates a set of assumptions with regard to system parameters and performance criteria. These assumptions reflect a well-developed system at each terminal of the line and operating criteria designed to promote system reliability. As helpful as the loadability characteristic and simplified analyses are in providing estimates of the amount of power that can be transferred over a well-designed transmission system, they cannot be viewed as a substitute for detailed studies. Such studies are generally required to account for the actual structure of the network, including influence of voltage control sources, and to evaluate the system performance during contingency operation. Detailed studies are beyond the scope of this discussion.
AEP & ITC Technical Study Report - Proposed 765 kV Transmission Infrastructure Expansion
July 27, 2007 96

American Electric Power AEP Interstate Project: 765 kV or 345 kV Transmission
April 24, 2007 RG/ADP 5
Figure 1 - St. Clair Curve
AEP & ITC Technical Study Report - Proposed 765 kV Transmission Infrastructure Expansion
July 27, 2007 97

American Electric Power AEP Interstate Project: 765 kV or 345 kV Transmission
April 24, 2007 RG/ADP 6
V. Reliability A vibrant, reliable transmission system is essential to lowering the cost of electricity for all consumers. Experience shows that transmission systems designed for 765 kV operation are inherently more reliable than those operating at lower voltage levels. The 765 kV lines are constructed using up to six conductors per phase to obtain acceptable corona and audible noise performance. Summer normal rating of a typical 765 kV line, including terminal equipment, exceeds 4,000 MVA (phase conductor bundle is rated still higher), virtually eliminating the risk of thermal overloads even under severe operating conditions. Notably, even when heavily loaded, 765 kV lines operate at near-ambient temperatures minimizing the sag effect and, thus, the likelihood of tree contact. Outage statistics5 indicate that 765 kV circuits experience, on average, one forced outage per 100 mile-year. A comparable statistic for 345 kV is 1.6 forced outages per 100 mile-year. While single-phase faults are the dominant type of failures for both voltage classes, no multi-phase faults have been recorded at 765 kV in normal operation, short of tower failure. (AEP did experience 765 kV tower failures on rare occasions due to both severe icing and tornadoes.) This performance suggests a lower likelihood/severity of disruptions at 765 kV and an opportunity to apply effective mitigation measures, such as single-phase switching, to further improve the line (and thus system) reliability. Single-phase switching (SPS) is a concept advanced and successfully applied by AEP in the mid-1980s in conjunction with the Rockport Project in southern Indiana6,7. The concept has allowed integration of a 2,600 MW generating station with the system using only two 765 kV lines. SPS takes advantage of the superior outage performance of 765 kV lines by momentarily interrupting only one of three phases to clear temporary single-phase faults. This feature, made possible by the fact that 765 kV-connected station facilities (circuit breakers, shunt reactors, etc.) are built as single-phase units, enhances the line's availability and minimizes system disturbances caused by faults and associated switching operations. The advantages of 765 kV become even more apparent when considering the alternative of building multiple double-circuit 345 kV lines. With eighteen distinct phase bundles, taller structures and lower ground clearances, the 345 kV alternative would present an increased exposure to lightning strikes and tree contacts. In fact, the three double-circuit lines required at 345 kV to match the loadability of one operating at 765 kV would incur, as a group, nearly ten times more outages than the 765 kV counterpart. While these outages would only partially degrade the loadability of the 345 kV corridor, the combined outage duration in a year would be significant. Reliability of the 765 kV system is perhaps best illustrated by the blackout experience of August 14, 2003. On that day, a large segment of the interconnected grid in the eastern U.S. and Canada collapsed in a cascade that affected service to some 50 million people. It is notable that the cascade was effectively stopped at the “doorsteps” of AEP’s 765 kV transmission system, which remained intact.
AEP & ITC Technical Study Report - Proposed 765 kV Transmission Infrastructure Expansion
July 27, 2007 98
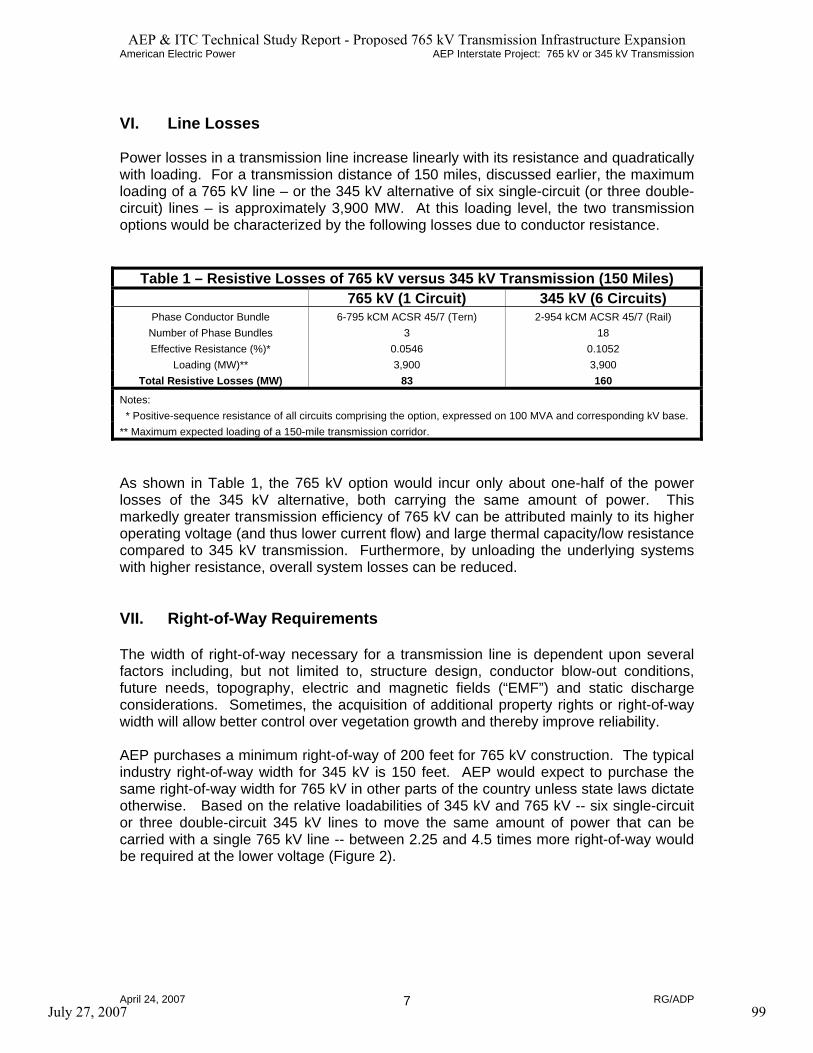
American Electric Power AEP Interstate Project: 765 kV or 345 kV Transmission
April 24, 2007 RG/ADP 7
VI. Line Losses Power losses in a transmission line increase linearly with its resistance and quadratically with loading. For a transmission distance of 150 miles, discussed earlier, the maximum loading of a 765 kV line – or the 345 kV alternative of six single-circuit (or three double-circuit) lines – is approximately 3,900 MW. At this loading level, the two transmission options would be characterized by the following losses due to conductor resistance.
Table 1 – Resistive Losses of 765 kV versus 345 kV Transmission (150 Miles) 765 kV (1 Circuit) 345 kV (6 Circuits)
Phase Conductor Bundle 6-795 kCM ACSR 45/7 (Tern) 2-954 kCM ACSR 45/7 (Rail) Number of Phase Bundles 3 18 Effective Resistance (%)* 0.0546 0.1052
Loading (MW)** 3,900 3,900 Total Resistive Losses (MW) 83 160
Notes: * Positive-sequence resistance of all circuits comprising the option, expressed on 100 MVA and corresponding kV base. ** Maximum expected loading of a 150-mile transmission corridor.
As shown in Table 1, the 765 kV option would incur only about one-half of the power losses of the 345 kV alternative, both carrying the same amount of power. This markedly greater transmission efficiency of 765 kV can be attributed mainly to its higher operating voltage (and thus lower current flow) and large thermal capacity/low resistance compared to 345 kV transmission. Furthermore, by unloading the underlying systems with higher resistance, overall system losses can be reduced. VII. Right-of-Way Requirements The width of right-of-way necessary for a transmission line is dependent upon several factors including, but not limited to, structure design, conductor blow-out conditions, future needs, topography, electric and magnetic fields (“EMF”) and static discharge considerations. Sometimes, the acquisition of additional property rights or right-of-way width will allow better control over vegetation growth and thereby improve reliability. AEP purchases a minimum right-of-way of 200 feet for 765 kV construction. The typical industry right-of-way width for 345 kV is 150 feet. AEP would expect to purchase the same right-of-way width for 765 kV in other parts of the country unless state laws dictate otherwise. Based on the relative loadabilities of 345 kV and 765 kV -- six single-circuit or three double-circuit 345 kV lines to move the same amount of power that can be carried with a single 765 kV line -- between 2.25 and 4.5 times more right-of-way would be required at the lower voltage (Figure 2).
AEP & ITC Technical Study Report - Proposed 765 kV Transmission Infrastructure Expansion
July 27, 2007 99
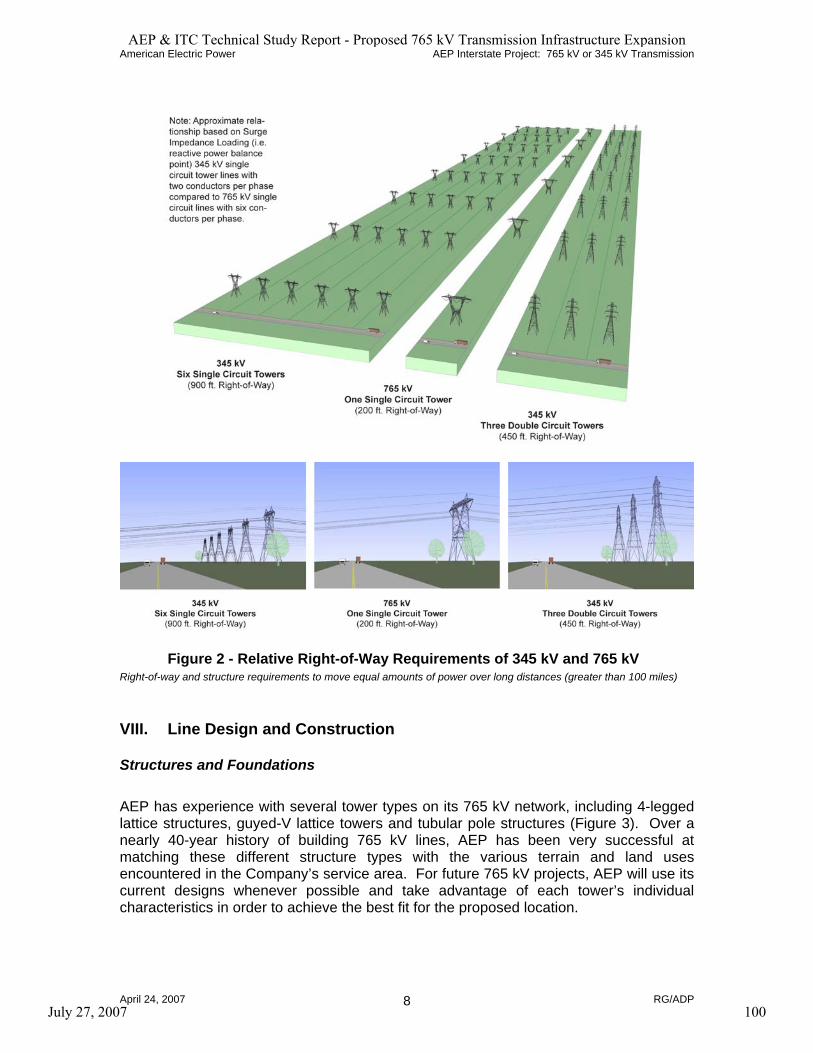
American Electric Power AEP Interstate Project: 765 kV or 345 kV Transmission
April 24, 2007 RG/ADP 8
Figure 2 - Relative Right-of-Way Requirements of 345 kV and 765 kV Right-of-way and structure requirements to move equal amounts of power over long distances (greater than 100 miles) VIII. Line Design and Construction Structures and Foundations
AEP has experience with several tower types on its 765 kV network, including 4-legged lattice structures, guyed-V lattice towers and tubular pole structures (Figure 3). Over a nearly 40-year history of building 765 kV lines, AEP has been very successful at matching these different structure types with the various terrain and land uses encountered in the Company’s service area. For future 765 kV projects, AEP will use its current designs whenever possible and take advantage of each tower’s individual characteristics in order to achieve the best fit for the proposed location.
AEP & ITC Technical Study Report - Proposed 765 kV Transmission Infrastructure Expansion
July 27, 2007 100

American Electric Power AEP Interstate Project: 765 kV or 345 kV Transmission
April 24, 2007 RG/ADP 9
(a) (b) (c)
Figure 3 - Typical 765 kV Transmission Structures on AEP System
(a) 4-legged lattice steel self-supporting tower; (b) Guyed-V lattice steel tower; (c) Tubular steel structure AEP evaluates several variables to determine the optimal structure configuration for a project, including the topography or landscape where the project will be constructed, visual impact of the structure type, structure configuration and its effect on EMF, material costs and associated lead times, and construction techniques. While AEP is capable of constructing both 345 kV and 765 kV in either tubular or lattice designs, advantages of each are highlighted below. Lattice towers and tubular poles offer different qualities and advantages when the engineering and siting teams are selecting a design. Lattice towers are designed and constructed with steel angles that can be packaged and delivered to the structure site and assembled in place. Tubular poles usually involve a single or multiple pole shaft that occupies a smaller footprint than lattice towers, and can be easily erected in the field. For a new 345 kV double-circuit line, AEP would most likely utilize a combination of lattice steel and tubular steel designs. The selection would again be based on the variables AEP considers for other transmission lines to find the best fit for the terrain at each tower location. Tubular poles have advantages over lattice towers, such as a faster design, detailing and fabrication process. Because the tubular pole is a simplified design, its capability is more predictable and full-scale tests may not be necessary. New lattice tower designs, however, always require full-scale testing to check the complex connection designs. However, once lattice tower designs are tested the tower family can be easily reused on other projects. With the testing costs spread over several projects, testing costs may become insignificant. Tubular assembly and erection is relatively simple and requires fewer labor hours overall, but it also requires expensive, heavy equipment. Depending on the terrain, a single crew can erect multiple poles in one day. As a result, tubular construction may provide a time advantage but not necessarily a cost advantage. Lattice tower assembly and erection is more complex and can take one or two weeks to erect a single tower. However, contractors erect steel based on a cost per pound and, since lattice towers are
AEP & ITC Technical Study Report - Proposed 765 kV Transmission Infrastructure Expansion
July 27, 2007 101

American Electric Power AEP Interstate Project: 765 kV or 345 kV Transmission
April 24, 2007 RG/ADP 10
generally lighter than an equivalent tubular design, using lattice towers will usually result in lower construction costs on large projects. One of the most important variables in selecting a structure type is the foundation design required for a particular structure and the accompanying topographic challenges faced in the installation of different types of foundation. Tubular pole foundations are generally reinforced concrete piers. Lattice towers can be installed on concrete piers or steel grillage foundations. Steel grillage foundations are usually advantageous in mountainous terrain when the travel time to the job site eliminates concrete as an option. If the project area is in accessible terrain and in close proximity to concrete batch plants, concrete pier foundations gain a significant advantage. Tubular poles are very successful in these areas but require an efficient means to optimize the foundation design dimensions at each structure. This can be achieved with a thorough plan to obtain appropriate subsurface soil investigations and geologic reports prior to the design phase. A comparison of the various structures needed to support each delivery system is presented below for multiple lines using a double-circuit 345 kV design with two-conductor bundles (2-954 kCM ACSR 45/7, Rail) and a single-circuit 765 kV with six-conductor bundles (6-795 kCM ACSR 45/7, Tern). Structural Loads Structural loads for a single-circuit 765 kV line and a double-circuit 345 kV line are shown in Table 2. This tabulation assumes 2,000-ft vertical and 1,300-ft transverse spans with 25 lb/ft2 wind.
Table 2 - Conductor Wind and Weight Loading 765 kV Single Circuit (A) 345 kV Double Circuit (B)
Conductor Type 795 kCM 45/7 ACSR (Tern) 954 kCM 45/7 ACSR (Rail) Conductor Diameter (in) 1.063 1.165 Conductor Weight (lb/ft) 0.896 1.075
Conductors per Phase Bundle 6 2 Bundles per Structure 3 6
Transverse Wind Load (lb)* 51,821 37,863 Vertical Weight Load (lb)** 32,256 25,800 (B)/(A) Wind Load Ratio 0.73
(B)/(A) Weight Load Ratio 0.80
Assumptions: * 1,300-ft horizontal span & 25 lb/ft2 wind (Load = Cond. diameter x #Cond./phase x #Phases x 1,300 ft x 25 lb/ft2) ** 2,000-ft vertical span (Load = Cond. weight x #Cond./phase x #Phases x 2,000 ft)
As shown in Table 2, structural loads (i.e., transverse wind load and vertical weight load) for a single-circuit 765 kV tower are higher than those for a double-circuit 345 kV structure. To withstand the higher loads, 765 kV towers are designed with more structural capacity. Nevertheless, because of the vertical layout of the phases required for a double-circuit 345 kV structure design, the 765 kV towers are shorter over the same terrain, thus reducing the overall visual impact. This is particularly significant considering that three double-circuit lines would be required in the 345 kV alternative to match the power carrying capacity of a single 765 kV line.
AEP & ITC Technical Study Report - Proposed 765 kV Transmission Infrastructure Expansion
July 27, 2007 102

American Electric Power AEP Interstate Project: 765 kV or 345 kV Transmission
April 24, 2007 RG/ADP 11
In addition to the obvious aesthetic benefit, the single-circuit 765 kV design would carry only a slightly larger cost premium for the stronger towers. The cost premium is directly proportional to the steel structure weight, which can be estimated as the cube root of the wind and weight load ratios (the cube root of the wind and weight load ratios is proportional to the section modulus of a regular polygon).
Pole weights and foundation size = (0.73) = 0.90 Arm weights and horizontal bridge weight = (0.80) = 0.93
Line construction contractors generally base their labor and equipment costs on structure weight. Therefore, the erection costs are only slightly greater for 765 kV construction compared to 345 kV construction. With three double-circuits required in the 345 kV alternative, its cost premium over 765 kV would be substantial. More details are provided in Section X (Cost). IX. Visual Impact Visibility Double-circuit 345 kV towers are historically built in a vertical phase-over-phase configuration as opposed to 765 kV towers where the phases are in a horizontal, side-by-side configuration (Figure 4). Vertical 345 kV construction produces towers that are approximately 25% taller than 765 kV towers. Clearly, three 345 kV power lines using taller structures will result in a vastly greater overall visual impact, affecting significantly more property owners and critical viewsheds, than a single 765 kV line. Figure 5 demonstrates the differences in visual impacts of 765 kV and 345 kV construction.
Figure 4 - 345 kV Double-Circuit and 765 kV Single-Circuit Lattice Structures
AEP & ITC Technical Study Report - Proposed 765 kV Transmission Infrastructure Expansion
July 27, 2007 103

American Electric Power AEP Interstate Project: 765 kV or 345 kV Transmission
April 24, 2007 RG/ADP 12
(a) (b)
Figure 5 – Visual Effects of 765 kV and 345 kV Structures
(a) Actual 765 kV tower located in Virginia; (b) Simulation of double-circuit 345 kV tower (same location) Visual Mitigation In recent years, AEP has developed a rigorous visual mitigation methodology and has implemented effective measures to minimize the visual impact of its transmission lines8. Years ago, engineers would lay out a transmission line as straight as possible (with minimum angles) in order to reduce line construction cost. Visual impacts were an afterthought, if at all. Today, the route selection and line design process at AEP receives considerable attention and resources to reduce the overall visual impact as much as practicable. For AEP’s most recent 765 kV project, the Wyoming-Jacksons Ferry line commissioned in June 2006, landscape features such as vegetation and rolling hills or mountains were utilized to weave the line through the landscape. Visual impacts were considered during all project stages including siting, design and construction. Other commitments and methods to reduce visual impacts are highlighted below. Non-Reflective Materials - Unlike transmission lines of yesteryear, AEP’s new lines feature the latest advances in material reflectivity to darken and blend the lines into the landscape. Untreated materials reflect light and contrast with the natural scenery. The darkened effect is achieved by various treatments to the tower surface and conductors during the fabrication process. These enhancements have significantly reduced the visual impact of transmission lines (Figures 6 & 7). Research - AEP researches existing visual impacts of transmission lines to identify effective mitigation measures. The findings influence the siting practice followed by AEP. For instance, paralleling the edges of treelines and fencelines reduces the line’s visibility. This and other visual mitigation guidelines are utilized to develop study corridors to be filed with state and Federal regulatory agencies.
AEP & ITC Technical Study Report - Proposed 765 kV Transmission Infrastructure Expansion
July 27, 2007 104

American Electric Power AEP Interstate Project: 765 kV or 345 kV Transmission
April 24, 2007 RG/ADP 13
Figure 6 - Darkened and Galvanized Steel Transmission Towers
Figure 7 - Darkened Steel Transmission Towers Before Wire is Installed
Landowner and Agency Input - Communication with and input from affected landowners and state and Federal agencies is crucial. During AEP’s recent 765 kV project, private landowner input was collected at public meetings to document their concerns and identify existing critical viewsheds. Later, after a preferred corridor was developed, AEP adjusted the line siting within the approved corridor to address their concerns. Also, AEP sought input from state and Federal agencies. Agency representatives possess a wealth of knowledge about the resources they administer, which can be invaluable in developing a right-of-way location that minimizes overall visual impacts. GIS Visibility Analyses - As study corridors are identified, a viewshed analysis is performed to evaluate each corridor’s visual impacts. Visibility data are generated from proposed corridor segments and key observation points using a Geographic Information System (GIS) to assess the impact on the surrounding environment. Visual Simulations – Quantifying potential visual impacts is important for the public and planners during the line siting process. Substantial public and governmental opposition can be fueled by misconceptions of the potential visual impacts. To address these misconceptions, AEP simulates these impacts (or lack thereof) and presents them to the public and relevant government agencies. Both photographs and computer models (refer to Figure 5) are used to obtain an accurate depiction of post-construction visual effects. Visual communication can alleviate unfounded fears and help planners refine line designs to mitigate impacts. Selective Right-of-Way Clearing - Once the line is designed, AEP prepares vegetation clearing plans and communicates them to field personnel. In a departure from past practices of typically clearing the entire right-of-way, different types of clearing (selective clearing) are specified in different situations. In many areas where ground-to-conductor
AEP & ITC Technical Study Report - Proposed 765 kV Transmission Infrastructure Expansion
July 27, 2007 105

American Electric Power AEP Interstate Project: 765 kV or 345 kV Transmission
April 24, 2007 RG/ADP 14
clearance exceeds 100 ft, minimal right-of-way clearing is required. Except for tower sites, clear-cutting is usually not required and low-growing compatible species, such as redbuds and dogwoods, are preserved. These minimized and selective right-of-way clearing techniques substantially decrease the line visibility. As the right-of-way is cleared and towers erected, the final stage of the visual assessment involves minimizing impacts during construction. X. Cost Cost estimates for any transmission line construction depend on many variables, with terrain conditions and right-of-way costs being key components. Accordingly, per-mile cost estimates will vary for different regions of the country. Base line cost estimates for a 765 kV line and a double-circuit 345 kV line are $2.6 million and $1.5 million, respectively, per mile of line. These costs include siting, right-of-way and construction, but exclude the cost of terminal stations. The per-mile cost will increase from this basis depending on environmental, land use and other factors. While there is a significant premium for building a 765 kV line, this cost relationship is reversed when power transfer capabilities of the two transmission designs are taken into account. Table 3 provides the details for a typical transmission corridor considered in the AEP-ITC study, capable of carrying nearly 4,000 MW over a distance of 150 miles.
Table 3 – Transmission Cost to Deliver 3,900 MW Over 150 Miles 765 kV Single Circuit 345 kV Double Circuit
Phase Conductor Bundle 6-795 kCM ACSR 45/7 (Tern) 2-954 kCM ACSR 45/7 (Rail) Number of Circuits per Line 1 2
SIL per Line* 2,400 MW 780 MW Loadability** 3,800 – 3,900 MW 1,200 – 1,300 MW
Lines Required for 3,900 MW 1 3 ROW Width Required 200 ft 450 ft
Cost per Mile for 3,900 MW*** $2.6 Million $4.5 Million (3 x $1.5 Million) Cost per MW-Mile $670 $1,150
Assumptions: * SIL, surge impedance loading, is a measure of relative line loadability at the reactive power balance point without
voltage support. Thermal capacities vary; e.g., 765 kV can carry well over 4,000 MW and 345 kV (double circuit) can carry over 2,000 MW.
** Based on maximum expected loading of a 150-mile transmission corridor (approx. 1.6 SIL). *** Average cost in 2007 dollars; rural terrain with rolling hills. Includes siting, right-of-way and construction
(but excludes station costs) for the number of lines required in each option.
The two transmission alternatives shown in Table 3 can deliver equivalent amounts of power (i.e., 3,900 MW), with only one circuit needed at 765 kV and three double-circuit lines required at 345 kV. It is notable that, on a per-MW basis, a 70% premium would be required for the 345 kV alternative ($1,150 per MW-mile) over 765 kV ($670 per MW-mile). This cost advantage of 765 kV can increase further with a line design optimized for use in flat, low-elevation terrain. Apart from the cost savings, a significant reduction in the overall right-of-way requirements is possible with 765 kV transmission.
AEP & ITC Technical Study Report - Proposed 765 kV Transmission Infrastructure Expansion
July 27, 2007 106
American Electric Power AEP Interstate Project: 765 kV or 345 kV Transmission
April 24, 2007 RG/ADP 15
XI. Conclusion AEP believes that 765 kV transmission is superior in many ways when compared to double-circuit 345 kV -- it offers unparalleled electrical performance, significant cost advantages and less environmental impact because fewer lines need to be constructed. As a proven, high-capacity technology with worldwide acceptance, 765 kV is the best platform on which to build a modern transmission superhighway system that meets the needs of America’s economy in the 21st century. XII. References 1. "AEP-ITC 765 kV Interstate Transmission Project," American Electric Power and
ITC Transmission, December 20, 2006. 2. “An IEEE Survey of U.S. and Canadian Overhead Transmission Outages at 230
kV and Above,” Working Group on Statistics of Line Outages, IEEE Transmission & Distribution Committee, Paper No. 93 WM 054-7 PWRD, IEEE-PES Winter Meeting, Columbus, OH, January/February 1993.
3. “Practical Concepts in Capability and Performance of Transmission Lines,” H.P.
St. Clair, AIEE Transactions on Power Apparatus and Systems, Vol. 72, Part III, December 1953.
4. “Analytical Development of Loadability Characteristics for EHV and UHV
Transmission Lines,” R.D. Dunlop, R. Gutman and P.P. Marchenko, IEEE Transactions on Power Apparatus and Systems, Vol. PAS-98, No. 2, March/April 1979.
5. “An IEEE Survey of U.S. and Canadian Overhead Transmission Outages at 230
kV and Above,” Working Group on Statistics of Line Outages, IEEE Transmission & Distribution Committee, Paper No. 93 WM 054-7 PWRD, IEEE-PES Winter Meeting, Columbus, OH, January/February 1993.
6. “Application of Single-Phase Switching on the AEP 765 kV System,” R.D.
Dunlop, R.M. Maliszewski and B.M. Pasternack, Proceedings of American Power Conference, Vol. 42, 1980.
7. “The Use of Reactor Switches in Single Phase Switching,” A.J.F. Keri (Fakheri),
et al., CIGRE Paper No. 13-06, August/September 1980. 8. “Proposed Land Use & Environmental Mitigations,” American Electric Power,
April 6, 2006.
* * *
U:\AEP Interstate Project - 765 kV or 345 kV Transmission.doc
AEP & ITC Technical Study Report - Proposed 765 kV Transmission Infrastructure Expansion
July 27, 2007 107


