30
Essential Energy AER Determination Project - Review of Actual Spend vs Regulatory Allowance 29 May 2014
Essential Energy
AER Determination Project - Review of Actual Spend vs Regulatory Allowance 29 May 2014

Document information
Client: Essential Energy Title: AER Determination Project - Review of Actual Spend vs Regulatory Allowance Document No: 2265002A-STC-REP-001 Rev0 Date: 29 May 2014 Rev Date Details
A 17/03/2014 Original Draft
0 01/05/2014 Second Draft
1 29/05/2014 Final Issue
Author, Reviewer and Approver details
Prepared by: David Downing
Reviewed by: Peter Walshe
Approved by: Emma Lathouras Date: 29/05/2014 Signature:
Distribution
Essential Energy, Parsons Brinckerhoff file, Parsons Brinckerhoff Library
©Parsons Brinckerhoff Australia Pty Limited 2014
Copyright in the drawings, information and data recorded in this document (the information) is the property of Parsons Brinckerhoff. This document and the information are solely for the use of the authorised recipient and this document may not be used, copied or reproduced in whole or part for any purpose other than that for which it was supplied by Parsons Brinckerhoff. Parsons Brinckerhoff makes no representation, undertakes no duty and accepts no responsibility to any third party who may use or rely upon this document or the information.
Document owner
Parsons Brinckerhoff Australia Pty Limited ABN 80 078 004 798 Level 4 Northbank Plaza 69 Ann Street Brisbane QLD 4000 GPO Box 2907 Brisbane QLD 4001 Australia Tel: +61 7 3854 6200 Fax: +61 7 3854 6500 Email: [email protected] www.pbworld.com Certified to ISO 9001, ISO 14001, AS/NZS 4801 A GRI Rating: Sustainability Report 2011

Parsons Brinckerhoff Australia Pty Limited
ABN 80 078 004 798
Level 4 Northbank Plaza 69 Ann Street Brisbane QLD 4000 GPO Box 2907 Brisbane QLD 4001 Australia Tel: +61 7 3854 6200 Fax: +61 7 3854 6500 Email: [email protected]
www.pbworld.com Certified to ISO 9001, ISO 14001, AS/NZS 4801 A GRI Rating: Sustainability Report 2011
Our ref: 2265002A-STC-REP-001 Rev1
By email [email protected]
2265002A-STC-REP-001 Rev1
29 May 2014
Jack Pike AER Determination Project Mgr Essential Energy PO Box 5730 Port Macquarie NSW 2444
Dear Jack
AER Determination Project - Review of Actual Spend vs Regulatory Allowance
Please find attached our report considering our review of Essential Energy’s actual spends versus its regulatory allowance for the current regulatory period.
If you have any queries with this document, please do not hesitate to contact me direct.
Yours sincerely
Emma Lathouras Business Analysis Lead

Parsons Brinckerhoff | 2265002A-STC-REP-001 Rev0 iv
Essential Energy AER Determination Project - Review of Actual Spend vs Regulatory Allowance
Contents Page number
Abbreviations v
1. Introduction 1
1.1 Background and purpose 1
1.2 Method and scope 2
1.3 Scope 2
2. Capital expenditure 4
2.1 Description of system CAPEX driver categories 4
2.2 Background 4
2.3 Actual and forecast system CAPEX by CAPEX driver 6
2.4 Actual and forecast non-system CAPEX 10
3. Operating expenditure 15
3.1 Description of OPEX categories 15
3.2 Network OPEX 15

Parsons Brinckerhoff | 2265002A-STC-REP-001 Rev0 v
Essential Energy AER Determination Project - Review of Actual Spend vs Regulatory Allowance
Abbreviations AER Australian Energy Regulator
CAPEX Capital Expenditure
DNSP Distribution Network Service Provider
GFC Global Financial Crisis
NER National Electricity Rules
NNSW Networks New South Wales
OPEX Operating Expenditure

Parsons Brinckerhoff | 2265002A-STC-REP-001 Rev0 1
Essential Energy AER Determination Project - Review of Actual Spend vs Regulatory Allowance
1. Introduction 1.1 Background and purpose Essential Energy engaged Parsons Brinckerhoff to provide a report considering the reasonableness of its variations in actual system and non-system expenditure from that forecast in the 2009-14 Australian Energy Regulator (AER) determination.
The report was required primarily for internal management purposes. However, Parsons Brinckerhoff understands that it may be made available to the AER if it requires further clarification as to the nature of the variances. As such, the report has been completed with reference to the requirements of the National Electricity Rules clause S6.1.1 paragraph (6) and clause S6.1.2 paragraph (7). An extract of the relevant NER clauses is attached as Appendix A.
Following a one week interview period, during which the key and parties accountable for the various types of expenditure were interviewed, Parsons Brinckerhoff looked to provide the following:
a high level explanation of the reasons behind the variations
details of relevant external and internal factors/changes that contributed to any variations
immediate responses and mitigating actions undertaken by Essential Energy to address the variations
actual outcomes achieved, despite the varying expenditure and following the immediate actions, including any impact on customers and public safety
‘Lessons learnt’ as a result of the variations occurring and need for mitigating actions
corresponding changes to be made to Essential Energy’s planning/forecasting and delivery methods to minimise variations in the future and, if applicable, achieve the original objectives/targets
strategies of other DNSP’s and the AER for addressing historic performance and expenditure variations.
Essential Energy emphasised that this review was to be undertaken at a ‘high level’ and completed within a short timeframe. As such, we consider that this report represents the first step in an analytical process through which Essential Energy could further understand the variations incurred.

Parsons Brinckerhoff | 2265002A-STC-REP-001 Rev0 2
Essential Energy AER Determination Project - Review of Actual Spend vs Regulatory Allowance
1.2 Method and scope
1.2.1 Method
Our engagement method, which is desktop review and interview based, is depicted below:
Our engagement approach and basis for our interviews was based on the expenditure amounts provided to us in Essential Energy’s last regulatory submission as well as those currently incurred. We understand however, that in order to provide an accurate picture as to the amount of the variance, the following adjustments and breakdowns were required:
The total expenses provided to us included both direct and indirect amounts. We understand that during the current reporting period, the indirect allocation method utilised by Essential Energy had changed from that used at the time the last regulatory submission was prepared. In order to ensure that our interviews were conducted on a consistent basis, we requested that the actual spend information provided to us be recast to reflect the indirect allocation policy utilised at the time of the submission.
The makeup of both the actual spend amounts as well as the regulatory allowance had to be broken down into direct and indirect amounts. As the majority of stakeholders and parties accountable for the expenses were concerned with the amounts of direct expenditure only, we had to ensure that our interviews and subsequent conversations and analysis were focused on variations in direct expenditure amounts.
We note that the interviews were completed without these adjustments being made and/or breakdowns provided to us. As such our initial interviews were limited to general discussions regarding the variations, as opposed to quantifying and validating specific variation amounts.
1.3 Scope The expenditure considered as part of this engagement is limited to that required to deliver Standard Control Services, and includes CAPEX and OPEX amounts which were incurred during the following periods:
Onsite review
• Kick off meeting• Receive all
documents from Essential Energy
• Desktop review
• Desktop review
• Complete Review
Desktop review
• Interview with relevant stakeholders
• Examine relevant processes, systems and procedures
• Analyse additional information
• Onsite review
• Complete Review
Draft report
• Develop and deliver Draft report
• Essential Energy to review Draft report
• Draft report
• Deliver Draft Report
Final report
• Essential Energy provide feedback on Draft report
• Deliver Final report
• Final report
• Deliver Final Report
Deliverable Milestone

Parsons Brinckerhoff | 2265002A-STC-REP-001 Rev0 3
Essential Energy AER Determination Project - Review of Actual Spend vs Regulatory Allowance
Actual expenditure incurred for the years ended 2010, 2011, 2012 and 2013 of the 2010 to 2015 regulatory control period.
Expenditure forecast to be incurred for the year ended 2014 of the 2010 to 2015 regulatory control period.
Expenditure allowed in the building block model by AER in its determination for the 2010 to 2015 period.
In addition:
Expenditure is presented in the same categories as those categories used to describe forecast expenditure in Essential Energy’s 2015-19 regulatory proposal.
All expenditure is expressed in real 2012/13 dollars, so a comparison can be made between the expenditure on a common basis.
Parsons Brinckerhoff | 2265002A-STC-REP-001 Rev0 4
Essential Energy AER Determination Project - Review of Actual Spend vs Regulatory Allowance
2. Capital expenditure The following sections discuss each of the actual capital expenditures, including that forecast for 2013/14, for each of the regulatory asset driver categories. For each category, any significant variations between the actual expenditure and the allowance for that period is identified and explained.
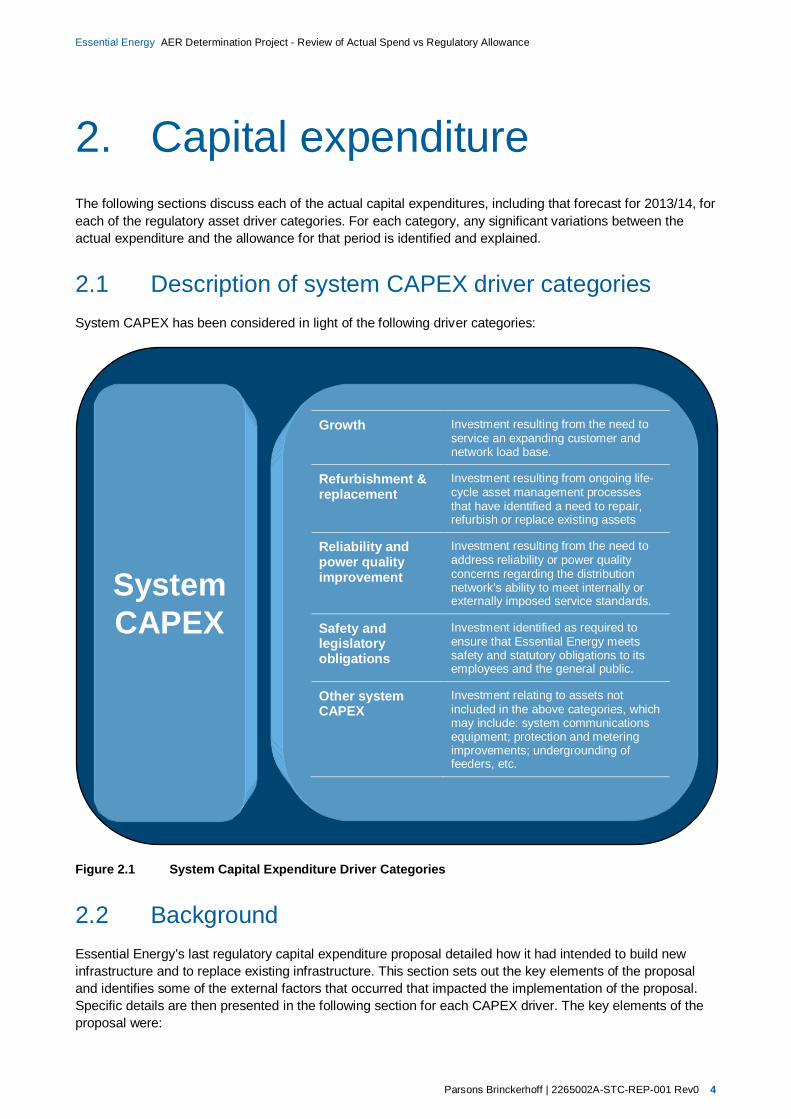
2.1 Description of system CAPEX driver categories System CAPEX has been considered in light of the following driver categories:
Figure 2.1 System Capital Expenditure Driver Categories
2.2 Background Essential Energy’s last regulatory capital expenditure proposal detailed how it had intended to build new infrastructure and to replace existing infrastructure. This section sets out the key elements of the proposal and identifies some of the external factors that occurred that impacted the implementation of the proposal. Specific details are then presented in the following section for each CAPEX driver. The key elements of the proposal were:
System CAPEX
Growth Investment resulting from the need to service an expanding customer and network load base.
Refurbishment & replacement
Investment resulting from ongoing life-cycle asset management processes that have identified a need to repair, refurbish or replace existing assets
Reliability and power quality improvement
Investment resulting from the need to address reliability or power quality concerns regarding the distribution network’s ability to meet internally or externally imposed service standards.
Safety and legislatory obligations
Investment identified as required to ensure that Essential Energy meets safety and statutory obligations to its employees and the general public.
Other system CAPEX
Investment relating to assets not included in the above categories, which may include: system communications equipment; protection and metering improvements; undergrounding of feeders, etc.

Parsons Brinckerhoff | 2265002A-STC-REP-001 Rev0 5
Essential Energy AER Determination Project - Review of Actual Spend vs Regulatory Allowance
Acquisition of new line routes and substation sites for electricity infrastructure.
Construction of a number of new zone substations in response to demand growth and security standards.
Construction of a number of new sub-transmission lines in response to demand growth and the need to satisfy license conditions and security of supply standards.
Replacement of assets that are approaching failure, prior to failure – thus preventing outages and safety incidents.
Building of a significant amount of new customer specific infrastructure to connect new customers.
A number of external business factors have directly impacted the level of capital expenditure during the current regulatory period. Specifically:
Demand growth in some regions has been less than forecast. For example, several residential developments in the far north have not yet proceeded following the market downturn stemming from the Global Financial Crisis (GFC). The developments have not been cancelled, but rather deferred until market conditions improve.
Increases in retail energy prices have modified customer behaviour by driving a reduction in overall demand and by focussing customers’ attention on new appliances’ water and energy efficiency.
Likewise, climate change concerns have driven a reduction in overall demand and an increase in alternative energy assets, in particular the rapid increase in embedded solar-photovoltaic generation at both a domestic and commercial level.
Severe weather events have periodically had various effects on Essential Energy’s capital and operational programmes. Immediately following an event, crews from across the company can be reassigned from existing capital and operational duties to aid in disaster recovery efforts. In the aftermath, capital works in storm-affected areas can be set back many months by storm damage, partly by the need to replace storm damaged equipment and works, and partly by the need to re-establish sites and access routes damaged by the event. Flooding and saturated ground conditions especially can make worksites inaccessible, and difficult or even unsafe to work on until conditions improve. All of these consequences have at been highlighted in Essential Energy’s annual reports for 2010/11, 2011/12 and 2012/13, and have been significant contributors to spikes in emergency response requirements and to shortfalls in delivery of the company’s Network Plan.
Proposed changes to licence conditions and security standards - specifically an amendment to remove the design planning criteria from the end of the current regulatory period - has impacted those projects that were due to start in the current period to meet constraints in the forecast period, effectively allowing them to be deferred.
Delays in obtaining statutory approvals.
Global shortages in key components required for the program, impacting suppliers’ abilities to deliver equipment and Essential Energy’s ability to complete some capital projects.
These factors have resulted in fewer than expected new zone substations being constructed and fewer new line routes and sites for electricity infrastructure being required or approved.
Notwithstanding, Essential Energy has continued to deliver its intended program in the following areas:
The replacement of assets that are approaching the point where they will fail repeatedly thus posing unacceptable risks to security of supply and licence compliance.
Duplication of heavily loaded sub-transmission feeders, their associated switchgear and substations in order to meet licence conditions existing prior to their revision.

Parsons Brinckerhoff | 2265002A-STC-REP-001 Rev0 6
Essential Energy AER Determination Project - Review of Actual Spend vs Regulatory Allowance
Refurbishment and rebuilding of several zone, and many distribution, substations in order to mitigate risks to security of supply and license compliance.
Specific initiatives that have been unable to be attended to during the current regulatory period include:
A number of new zone substations have been deferred. These deferrals also had a flow-on effect with construction of a number of new overhead and underground cables also being deferred.
Customer specific infrastructure has either been delayed or cancelled. The requirement to build new customer specific infrastructure has also been less than anticipated due to the continuing impact of the global financial crisis on the demand for new connections. Notable decreases were seen in the property sector – in particular in the area of new subdivisions. For example, allowance had been made for infrastructure to serve new residential developments at Casuarina ($11.1m) and Cobaki ($10.3m). Of this $21.4m total, only $400k was actually spent on acquisition of the route for the developments’ distribution feeder routes.
However, savings were also realised during the period. Following the establishment of Networks New South Wales (NNSW), and a reassessment of New South Wales Distribution Network Service Providers’ (DNSP) licence conditions, a review of Essential Energy’s plans identified that savings could be made in various projects, particularly those addressing concerns about Essential Energy’s ability to meet the Schedule 2 (average SAIDI/SAIFI) and Schedule 3 (individual feeder SAIDI/SAIFI) standards. Of approximately $620m allocated to address these two areas, only approximately $150m was actually spent during the regulatory period.
In addition to those factors discussed above, a number of economic and political factors have directly impacted the Essential Energy expenditure programs during the current regulatory control period. Largely beyond its control, these factors have had a direct impact on Essential Energy’s operational expenditure, but were not foreseeable during the previous determination process:
Increased political pressure on the state government to control electricity prices. This has resulted in the establishment of NNSW – increasing the governance and cost controls put on the Essential Energy business. This has been considered in some instances to slow down the previously agreed to programs and increased the administrative costs associated with their roll out and implementation. Whilst no judgment or comment is being passed in respect of these measures, their introduction has had a quantifiable effect on Essential Energy’s operations within the current regulatory period.
A much greater than forecast uptake of solar photovoltaic generation (driven by very attractive domestic feed-in tariffs) has seen a decrease in customer demand. This in turn has altered the previous forecasts of maximum demands, leading to deferment of some augmentation projects.
Proposed amendments to the NSW DNSP licence conditions prompted a moratorium on reliability-driven expenditure and a reassessment of project need, thereby delaying some projects for substations supplying residential loads, but bringing into the plan some new projects for substations supplying commercial and industrial loads.
2.3 Actual and forecast system CAPEX by CAPEX driver The following tables show for each CAPEX driver category a comparison of the CAPEX allowance following the 2009-14 regulatory determination and the actual expenditure from 2009/10 to 2013/14, including that forecast for 2013/14.

Parsons Brinckerhoff | 2265002A-STC-REP-001 Rev0 7
Essential Energy AER Determination Project - Review of Actual Spend vs Regulatory Allowance
2.3.1 Growth
Table 2.1 Capital expenditure driven by growth (real 2012/13 $000's)
Expenditure type 2009/10 2010/11 2011/12 2012/13 2013/14Forecast
Total
Actual 275,464 249,095 274,226 249,712 207,897 1,256,393
Regulatory Allowance 261,279 290,259 308,462 320,135 331,704 1,511,838
Variance 14,185 (41,164) (34,236) (70,423) (123,807) (255,445)
Explanation of Variances
Major expenditure variations were attributable to the following:
Forecasts prepared for the previous submission anticipated significant residential demand growth in the far north of the state, just south of the Tweed River. As a result of the GFC and approval delays, the developers currently have their developments on hold, but are expected to proceed within the coming regulatory period. As a result, only $400k out of the $21.4m allowance was actually spent in the current regulatory period.
Further residential developments in other parts of the service area at Brunswick Heads ($19.75m allowance), and Murray’s Flat ($14.5m allowance) have not proceeded as anticipated, so network reinforcement has not yet proved necessary.
Incremental load growth in several areas that was expected to trigger projects to ensure compliance with N-1 planning criteria has either not occurred or has been satisfied by non-network alternatives (e.g. standby generation). For example, new feeders from Tamworth to Quirindi ($16.3m allowance), Narromine to Nyngan ($54.3m allowance), and Nyngam to Girilam (17.5m allowance) were all planned, but not constructed.
Council rezoning of land for industrial development was expected to drive load growth, which has not actually occurred. For example, Tweed Shire council rezoned land to the south of Murwillumbah, which Essential Energy expected would require a new zone substation and distribution feeders for which $14.2m was allowed. In the event, only $720k was actually spent on the acquisition of the planned substation site, but no further work was performed.
Many projects that were envisaged in the previous proposal were implemented, but were implemented in an alternative manner in an effort to make cost savings and/or combine the growth-driven project with others that are prompted by other drivers such as asset replacement. As an example:
Coffs Harbour South was a $16.5m proposed project to significantly augment and rebuild an existing 66 kV to 11 kV substation as a result of load growth and aging equipment. Further studies showed that by building a new substation (Coffs Harbour East), rebuilding the Coffs Harbour North substation, and rescoping the work at Coffs Harbour South, a much better overall outcome (increased load capacity and improved future reliability at both existing substations) would be achieved for essentially the same funding. Essential Energy is forecasting a total of $16.2m will have been spent on this suite of projects by the end of the current regulatory period.
Some projects have returned costs in excess of those anticipated, and have often experienced delays in implementation. As an example:
The Cooma to Bega line required duplication owing to the Bega load growth triggering the N-1 criterion of the licence conditions. The previous regulatory proposal allowed for a $39.9m project to construct a second feeder rated at 132 kV, together with substation upgrades. The forecast project costs to the end
Parsons Brinckerhoff | 2265002A-STC-REP-001 Rev0 8
Essential Energy AER Determination Project - Review of Actual Spend vs Regulatory Allowance
of the regulatory period are approximately $51.75m, principally due to the costs of construction of the 132 kV line being over $47m.
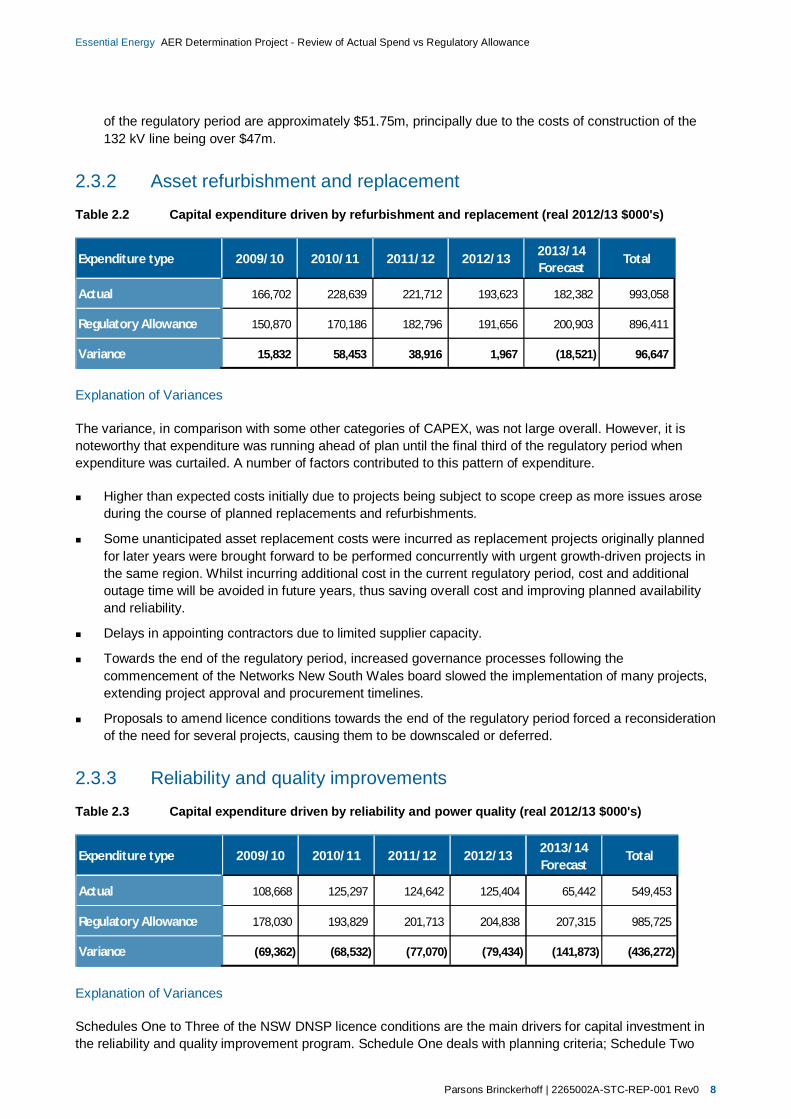
2.3.2 Asset refurbishment and replacement
Table 2.2 Capital expenditure driven by refurbishment and replacement (real 2012/13 $000's)
Expenditure type 2009/10 2010/11 2011/12 2012/13 2013/14Forecast
Total
Actual 166,702 228,639 221,712 193,623 182,382 993,058
Regulatory Allowance 150,870 170,186 182,796 191,656 200,903 896,411
Variance 15,832 58,453 38,916 1,967 (18,521) 96,647
Explanation of Variances
The variance, in comparison with some other categories of CAPEX, was not large overall. However, it is noteworthy that expenditure was running ahead of plan until the final third of the regulatory period when expenditure was curtailed. A number of factors contributed to this pattern of expenditure.
Higher than expected costs initially due to projects being subject to scope creep as more issues arose during the course of planned replacements and refurbishments.
Some unanticipated asset replacement costs were incurred as replacement projects originally planned for later years were brought forward to be performed concurrently with urgent growth-driven projects in the same region. Whilst incurring additional cost in the current regulatory period, cost and additional outage time will be avoided in future years, thus saving overall cost and improving planned availability and reliability.
Delays in appointing contractors due to limited supplier capacity.
Towards the end of the regulatory period, increased governance processes following the commencement of the Networks New South Wales board slowed the implementation of many projects, extending project approval and procurement timelines.
Proposals to amend licence conditions towards the end of the regulatory period forced a reconsideration of the need for several projects, causing them to be downscaled or deferred.
2.3.3 Reliability and quality improvements
Table 2.3 Capital expenditure driven by reliability and power quality (real 2012/13 $000's)
Expenditure type 2009/10 2010/11 2011/12 2012/13 2013/14Forecast
Total
Actual 108,668 125,297 124,642 125,404 65,442 549,453
Regulatory Allowance 178,030 193,829 201,713 204,838 207,315 985,725
Variance (69,362) (68,532) (77,070) (79,434) (141,873) (436,272)
Explanation of Variances
Schedules One to Three of the NSW DNSP licence conditions are the main drivers for capital investment in the reliability and quality improvement program. Schedule One deals with planning criteria; Schedule Two

Parsons Brinckerhoff | 2265002A-STC-REP-001 Rev0 9
Essential Energy AER Determination Project - Review of Actual Spend vs Regulatory Allowance
with average reliability targets (SAIDI/SAIFI); and Schedule Three with individual feeder reliability targets. Essential Energy’s reliability statistics are generally good, so whilst provision was made in the submission for the current regulatory period, much of the work has, in the event, proved unnecessary.
Projects intended to improve compliance with Licence Condition 14 and Schedule One are principally those where load growth (for sub-transmission feeders) or time-to-repair considerations (for distribution feeders) have triggered a need to meet an N-1 security standard. A considerable backlog of such projects had accumulated by the start of the current regulatory period, so approximately $200m was allowed in the Regulatory determination to enable Essential Energy to catch up with its Schedule One licence obligations. This funding, combined with funding from load growth allowances, has largely been used. In the forthcoming regulatory period, the licence conditions are being amended to remove Licence Condition 14.
Licence Condition 15 and Schedule Two projects (addressing average SAIDI and SAIFI standards) were principally intended to improve recloser effectiveness and segregation of the network in order to reduce the number of customers affected by an outage event. Approximately $120m was allowed in the current regulatory period, of which approximately $50m was spent. Work will continue on this and similar programs in the forthcoming regulatory period, though at a reduced scale as it is clear that Essential Energy is currently meeting its Schedule 2 licence conditions.
Licence Condition 16 and Schedule Three projects (addressing individual feeder SAIDI and SAIFI standards) were focussed on “poor performing feeders”. At the time of the previous proposal, Essential Energy’s predecessor, Country Energy, suffered from a lack of specific data on its network performance, and was somewhat conservative in its estimate of what work was required by allowing approximately $500m in CAPEX to address Schedule Three issues. During the current regulatory period, system data has improved considerably, and it was found that only approximately $100m was required to reduce the number of poor performing feeders to about 100 out of a total of 1450 feeders on the system.
Whilst maintaining its focus on poor performing feeders, Essential Energy is also focussing on “worst-served” customers, which are clusters of customers that are in the worst 1% for feeder reliability. By focussing efforts on these areas of the network, and provided that the projects can be undertaken simply and at reasonable cost (approximately $4.6m per annum over the next regulatory period), Essential Energy expects to make significant improvements in feeder reliability and customer satisfaction.
2.3.4 Compliance with safety and legal obligations
Table 2.4 Capital expenditure driven by safety and legal obligations (real 2012/13 $000's)
Expenditure type 2009/10 2010/11 2011/12 2012/13 2013/14Forecast
Total
Actual 13,026 18,631 19,819 8,326 9,250 69,052
Regulatory Allowance 39,055 43,397 46,119 47,864 49,593 226,027
Variance (26,028) (24,766) (26,300) (39,538) (40,343) (156,975)
Explanation of Variances
Navigable waterway crossings – a significant component of the CAPEX was required to comply with Essential Energy’s statutory obligations in relation to the Crossings of NSW Navigable Waters: Electricity Industry Code (published by NSW Maritime) and AS 6947-2009 - Crossing of waterways by electricity infrastructure. An essential early part of the program was to perform a complete reassessment of the risk posed by Essential Energy’s infrastructure to users of the navigable waterways
Parsons Brinckerhoff | 2265002A-STC-REP-001 Rev0 10
Essential Energy AER Determination Project - Review of Actual Spend vs Regulatory Allowance
and to the network itself. Initial uncertainty surrounding the total number of crossings was resolved jointly with NSW Maritime in 2009/10, reducing the total number of overhead and submarine crossings from 2,608 to 1,357. Following this, Essential Energy embarked on its program of inspection and risk assessment against compliance with the Code and standards. Adverse weather conditions mainly in 2010/11 and 2011/12 with high rainfall resulting in flooding and high river flow rates caused delays to the assessment program, and consequent delays to specification and execution of projects to achieve full compliance. Following the establishment of Networks NSW in 2012, enhanced contracting requirements and corporate governance, and restrictions on overtime working contributed further to programme delays, meaning that compliance assessment and implementation of the remaining projects necessary to achieve compliance will continue into the forthcoming regulatory control period.
WireAlert - The WireAlert programme was delayed in in April 2011, which resulted in a reduction in the capital plan of around $1.5m. In early 2013, Essential Energy commenced a further review as part of a capital reduction strategy. This initiative is looking to identify further projects that can be deferred through the use non-network alternatives and other risk mitigation methods.
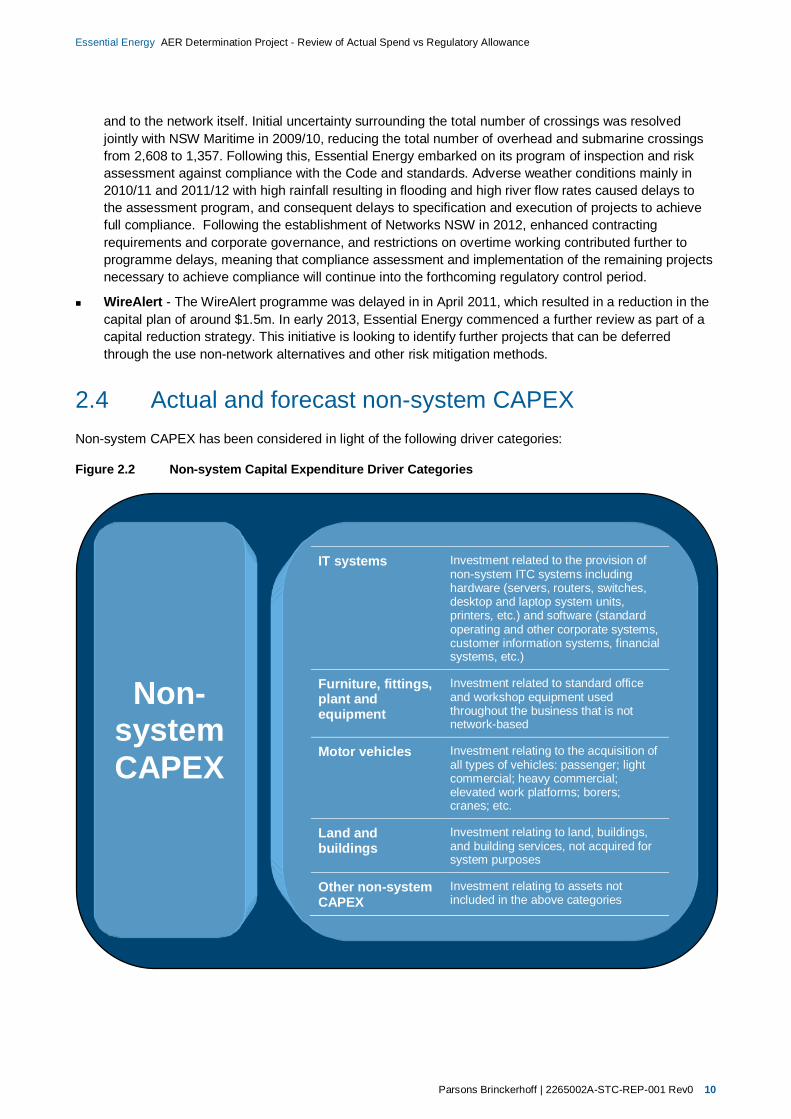
2.4 Actual and forecast non-system CAPEX Non-system CAPEX has been considered in light of the following driver categories:
Figure 2.2 Non-system Capital Expenditure Driver Categories
Non-system CAPEX
IT systems Investment related to the provision of non-system ITC systems including hardware (servers, routers, switches, desktop and laptop system units, printers, etc.) and software (standard operating and other corporate systems, customer information systems, financial systems, etc.)
Furniture, fittings, plant and equipment
Investment related to standard office and workshop equipment used throughout the business that is not network-based
Motor vehicles Investment relating to the acquisition of all types of vehicles: passenger; light commercial; heavy commercial; elevated work platforms; borers; cranes; etc.
Land and buildings
Investment relating to land, buildings, and building services, not acquired for system purposes
Other non-system CAPEX
Investment relating to assets not included in the above categories

Parsons Brinckerhoff | 2265002A-STC-REP-001 Rev0 11
Essential Energy AER Determination Project - Review of Actual Spend vs Regulatory Allowance
2.4.1 IT systems
Table 2.5 Capital expenditure – IT systems (real 2012/13 $000's)
Expenditure type 2009/10 2010/11 2011/12 2012/13 2013/14Forecast
Total
Actual 32,410 31,990 39,120 13,644 33,412 150,576
Regulatory Allowance 64,949 62,270 50,856 37,473 32,717 248,265
Variance (32,539) (30,280) (11,736) (23,830) 695 (97,690)
Explanation of Variances
Many non-network ICT programs were planned and allowed for over the course of the current regulatory period. However, there were also many changes to the programs that were ultimately implemented, some of which led to expenditure savings and others which led to significant increase. The primary causes of expenditure variances are as follows:
Asset management systems – approximately $51.5m was allowed in the previous submission to undertake a review and replacement of the existing asset management business systems. Whilst there was some initial expenditure assessing the existing systems and the most prudent use of the funding, work was suspended following the creation of Networks NSW and the subsequent moratorium on CAPEX. In parallel with this, expenditure on existing asset management ICT systems was curtailed in anticipation a replacement system being implemented. In the absence of a replacement system, continued and possibly increasing expenditure on the legacy systems will be required in the forthcoming regulatory period.
Customer information system - The previous submission included an allowance of approximately $26m to review and replace the existing CIS systems, which include billing systems, customer information, and national electricity market transaction systems. Ongoing assessment of overall business needs morphed the requirement into a whole-of-business enterprise solution encompassing asset management, customer information, and other financial systems. However, still further changes such as the separation and sale of the retail component of the business, the creation of Networks NSW, and the decision to continue with existing asset management systems prompted yet further reassessments to focus on a financial and network-only CIS solution which will largely be implemented in the next regulatory period. Essential Energy forecasts total expenditure of about $11m by the end of this regulatory period, of which more than $10.5m will be spent in FY 2013/14 now that previous uncertainties have been largely alleviated.
Owing to postponement of the implementation of the replacement CIS project, legacy CIS systems had to be maintained to a greater extent than anticipated by the previous regulatory proposal. Whilst a little over $6m had been allowed, expenditure will actually exceed $10m.
Non-network to network transfers – the telecommunications group, which had been part of the ICT (Non-Systems) part of the business was transferred to Engineering Services (Systems). With this transfer, responsibility and funding for several programs were effectively transferred from non-network CAPEX to network CAPEX. The five programs affected were the Fibre-to-Zone project, Radio Site Upgrades, Router and Switch Maintenance, Radio Site Construction, and SCADA and BPL. The total variance across these programs was expenditure of approximately $6.4m out of an allowance of $35.8m.
Mobile data and field force enablement project – approximately $15.7m was allowed to improve data collection in the field and to improve work planning and access to asset information for field crews. The program included replacement of many old portable data entry devices and the equipping of field vehicles with enhanced communication and computing devices, also known as “Smart Vehicles”. In the
Parsons Brinckerhoff | 2265002A-STC-REP-001 Rev0 12
Essential Energy AER Determination Project - Review of Actual Spend vs Regulatory Allowance
implementation, the scope of the program (especially the Smart Vehicles aspect) was considerably expanded to improve worker access to information and to increase significantly safety outcomes. The program is expected to have cost nearly $30.3m by the end of the regulatory period.
Meter data management system – approximately $13.6m was allowed because at the time of the previous submission, Country Energy doubted that its existing system would be capable of satisfying its ongoing obligations to NEMMCO (now AEMO). Later reassessments changed that evaluation to a decision that the existing system could be maintained acceptably such that only $215k has been spent in the current regulatory period.
Enterprise system modules – approximately $4m was allowed for maintenance of the existing systems such as PeopleSoft, Lotus Notes, etc. However, following reassessment and postponement of asset management and CIS system replacements, additional maintenance and upgrades of existing systems became necessary to the extent that expenditure is expected to exceed $27.2m in the current regulatory period.
Note that Essential Energy has re-categorised the capital cost of IT communications (e.g. telephone, video-conferencing equipment, etc.) to the ‘furniture, fittings, plant and equipment’ category below, rather than this category.
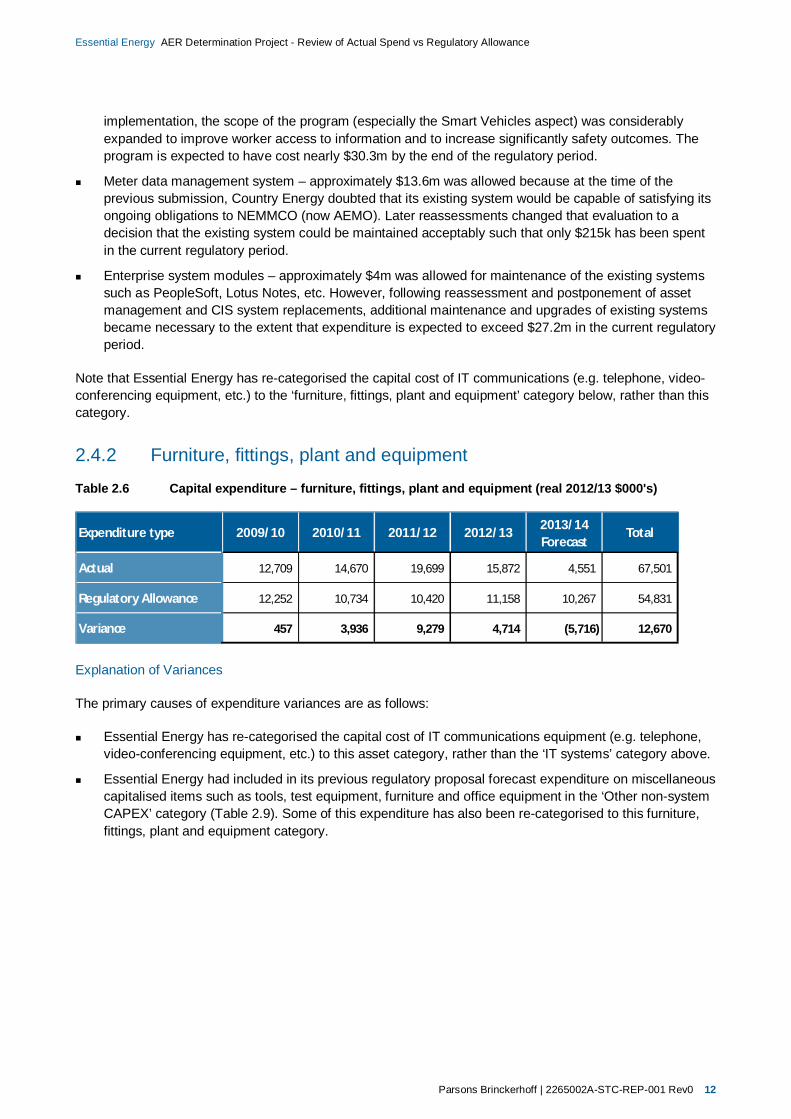
2.4.2 Furniture, fittings, plant and equipment
Table 2.6 Capital expenditure – furniture, fittings, plant and equipment (real 2012/13 $000's)
Expenditure type 2009/10 2010/11 2011/12 2012/13 2013/14Forecast
Total
Actual 12,709 14,670 19,699 15,872 4,551 67,501
Regulatory Allowance 12,252 10,734 10,420 11,158 10,267 54,831
Variance 457 3,936 9,279 4,714 (5,716) 12,670
Explanation of Variances
The primary causes of expenditure variances are as follows:
Essential Energy has re-categorised the capital cost of IT communications equipment (e.g. telephone, video-conferencing equipment, etc.) to this asset category, rather than the ‘IT systems’ category above.
Essential Energy had included in its previous regulatory proposal forecast expenditure on miscellaneous capitalised items such as tools, test equipment, furniture and office equipment in the ‘Other non-system CAPEX’ category (Table 2.9). Some of this expenditure has also been re-categorised to this furniture, fittings, plant and equipment category.

Parsons Brinckerhoff | 2265002A-STC-REP-001 Rev0 13
Essential Energy AER Determination Project - Review of Actual Spend vs Regulatory Allowance
2.4.3 Motor vehicles
Table 2.7 Capital expenditure – motor vehicles (real 2012/13 $000's)
Expenditure type 2009/10 2010/11 2011/12 2012/13 2013/14Forecast
Total
Actual 85,909 56,000 55,445 20,847 19,989 238,190
Regulatory Allowance 67,780 58,097 51,603 42,347 43,287 263,113
Variance 18,130 (2,097) 3,842 (21,500) (23,298) (24,923)
Explanation of Variances
The primary causes of expenditure variances are as follows:
Following the creation of NNSW, there was a drive to reduce capital expenditure in all areas. In the vehicle fleet, this was achieved by implementing alternative vehicle management strategies:
Passenger vehicle lifetimes were extended from approximately 100,000 km to 120,000 km
Light commercial vehicle lifetimes were extended from approximately 120,000 km to 150,000 km
Heavy commercial vehicle lifetimes were extended from between 8-10 years to 15 years
Replacement by procurement is no longer automatic – when a vehicle reaches the end of its planned lifetime, the availability of surplus vehicles elsewhere is assessed allowing for reassignment of underused assets.
Demand on the fleet has reduced as a result of increased use of tele- and video-conferencing facilities.
Overall fleet size is contracting reducing not only capital costs, but also operational costs (fuel, servicing, etc.).
2.4.4 Land and buildings
Table 2.8 Capital expenditure – land and buildings (real 2012/13 $000's)
Expenditure type 2009/10 2010/11 2011/12 2012/13 2013/14Forecast
Total
Actual 11,498 21,117 15,676 9,048 25,213 82,552
Regulatory Allowance 28,393 20,988 19,224 18,702 18,781 106,088
Variance (16,895) 129 (3,547) (9,654) 6,432 (23,535)
Explanation of Variances
The primary causes of expenditure variances are as follows:
In the current regulatory period, there was an increased emphasis placed on ensuring that buildings and their services were built to suit their purpose. For example, unless there were extenuating circumstances that dictated otherwise, they would typically be of low-cost modular construction.
Cost savings were made by reducing the scope of the zone substation fencing programme following the outcomes of more detailed risk assessments reducing the number of substation sites requiring fencing.

Parsons Brinckerhoff | 2265002A-STC-REP-001 Rev0 14
Essential Energy AER Determination Project - Review of Actual Spend vs Regulatory Allowance
Essential Energy is continuing to occupy both leasehold and freehold properties, but the benefits of both are more closely assessed
Since creation of Networks NSW, there has been a push to reassess usage and dispose of property that is surplus to requirements. This will continue in the next regulatory period
Whilst working within operational requirements, Essential Energy is looking at the possibility of depot consolidation.
2.4.5 Other non-system CAPEX
Table 2.9 Capital expenditure – other non-system CAPEX (real 2012/13 $000's)
Expenditure type 2009/10 2010/11 2011/12 2012/13 2013/14Forecast
Total
Actual 326 873 - 4,104 - 5,303
Regulatory Allowance 5,959 6,017 6,060 6,099 6,126 30,260
Variance (5,634) (5,143) (6,060) (1,994) (6,126) (24,957)
Explanation of Variances
The primary causes of expenditure variances are as follows:
In its previous regulatory proposal, Essential Energy included forecast expenditure on miscellaneous capitalised items such as tools, test equipment, furniture and office equipment in this category. In the event, most of this expenditure has been re-categorised to the ‘furniture, fittings, plant and equipment’ category shown in Table 2.6.

Parsons Brinckerhoff | 2265002A-STC-REP-001 Rev0 15
Essential Energy AER Determination Project - Review of Actual Spend vs Regulatory Allowance
3. Operating expenditure The following sections discuss each of the actual operational expenditures, including that forecast for 2013/14, for each of the regulatory asset driver categories. For each category, any significant variations between the actual expenditure and the allowance for that period are identified and explained.
3.1 Description of OPEX categories OPEX has been considered in light of the drivers and expense categories shown in Figure 3.1.
3.2 Network OPEX Initiatives that were expected to be completed during the current regulatory period included:
The development and implementation of new asset inspection and maintenance activities across all asset equipment types. This would involve new activities being introduced into the asset inspection and maintenance regime, including:
Programmed internal inspection of all underground pits and pillars
Six monthly condition monitoring and minor maintenance of all critical distribution substation and ring main units
Programmed live line pole top inspection of all radial subtransmission feeders
Annual ‘thermovision’ program covering all critical equipment and urban network components, and
Six monthly condition monitoring and minor maintenance program of all regulator and recloser assets.
The continuation of an initiative to better manage inspection, testing and risk defects to address the backlog of work prudently and with an efficient use of resources.
The reinstatement of deferred programs of inspection, vegetation management and maintenance. Expenditure constraints in previous regulatory control periods had caused deferral of some programs. Reinstatement of some of these programs was a priority to address problems with earthing inspection and testing and reliability of poor performing feeders.
An enhanced vegetation management program, including:
More thorough vegetation inspection, scoping, and clearing of all vegetation
Targeted removal of overhanging limbs and clearing of the canopy across power lines
Targeted removal of problem trees
Preventative corridor clearing to maintain an adequate ground power line corridor, and
More effective major access track maintenance to ensure access at all times for routine inspections, maintenance work, and fast response to fault locations.

Parsons Brinckerhoff | 2265002A-STC-REP-001 Rev0 16
Essential Energy AER Determination Project - Review of Actual Spend vs Regulatory Allowance
Figure 3.1 Network Operational Expenditure Driver Categories
Network OPEX
Network operating costs
Costs incurred in operating network prescribed services
Inspection Costs associated with performing periodic inspections on network assets
Maintenance and repair
Costs incurred by minor (i.e. non-capital) maintenance and repair of network assets
Vegetation management
Costs associated with the management of vegetation encroaching on transmission line routes, including: inspections, surveys, cutting, trimming, etc.
Emergency response
Costs associated with emergency response management, including customer reporting system, and management of work from reinstatement of a failed pole to major disaster response.
Other maintenance costs
Network-related operational expenditure not included in the above categories
Non-network OPEX
Meter Reading Costs incurred in meter reading, data capture and processing
Customer service Costs of providing a range of customer services (call centres, customer service centres, handling customer inquiries, connection inquiries, disconnection and reconnection, network faults and supply complaints, etc.)
Advertising, marketing and promotions
Costs incurred in advertising, marketing and publicity, including bushfire and power line safety campaigns, etc.
Other expenses Operational expenditure not included in the above categories
Parsons Brinckerhoff | 2265002A-STC-REP-001 Rev0 17
Essential Energy AER Determination Project - Review of Actual Spend vs Regulatory Allowance
Extensive evaluation and assessment of Essential Energy’s maintenance costs and requirements has been undertaken during the current regulatory period. The underlying driver for the review has been to ensure Essential Energy’s programs are prudent and efficient such that often competing needs associated with both the business’s required financial returns and its operational and corporate risks are balanced. As a business Essential Energy continually assesses asset performance and maintenance programs to ensure strategy effectiveness and efficiency. The main aim of the reviews is to identify where efficiency and effectiveness gains can be made and also result in program shortcomings or negative trends being quickly identified and addressed.
Risk assessments to validate and verify outcomes are conducted which look to consider risk from the following perspectives:
Health and Safety (to employees and the general public)
Legal and Regulatory
Financial
Reliability
Cultural and Environmental
Despite Essential Energy’s intentions for its programs for the current regulatory period, a number of initiatives were not either able to be attended to or were attended to in a different manner to that originally forecast in the last submission. Specifically:
The creation of NNSW part way through the regulatory period as an overarching distribution network entity immediately started to realise efficiencies in both capital and operational expenditure. NNSW introduced enhanced governance processes and cost controls that amongst other things placed a freeze on recruitment and curtailment of overtime for direct staff.
Inspection and maintenance methodologies have been improved, and major gains were being made to address the backlog of inspections that resulted from earlier program deferrals. However, the creation of Networks NSW and the resulting moratorium on recruitment and curtailment of overtime has put pressure on the availability of resources to progress the programs at the desired rate. For example, the pole inspection program is now estimated to be some 40,000 poles behind plan, resulting in an increased risk of pole failure and loss of service to customers.
The vegetation management program is making extensive use of new technologies and assessment methodologies. A greater use of aerial patrol, and more recently LiDAR surveys, allows more risk assessment-based decisions to be made about the best use of available funding. The breaking of the nationwide drought in the middle of the regulatory period, and the resulting resurgence in growth of vegetation that had been relatively dormant for several years meant that there was a significant increase in the amount of work to be performed in the second half of the regulatory period.
The significantly increased uptake of residential solar photovoltaic installations, which was not anticipated at the time of the previous submission, has had an impact on metering installations; instead of planning only to replace approximately 240,000 outdated meters in a planned programme, Essential Energy has also had to be responsive to those customers that have installed solar PV equipment, which can be on a much more piecemeal basis. A scaled-down programme replacing 67,000 outdated, non-compliant meters was started and will continue, in addition to approximately 70,000 customers, who installed solar PV.
The variance in expenditure from that forecast can be attributed to a combination of internal and external factors.

Parsons Brinckerhoff | 2265002A-STC-REP-001 Rev0 18
Essential Energy AER Determination Project - Review of Actual Spend vs Regulatory Allowance
3.2.1 Internal Factors
As discussed above, the business under took numerous reviews in a number of its key programs. These reviews enabled significant improvements to be made, reducing the required spends.
3.2.2 External Factors
A number of economic and political factors have emerged during the current regulatory period, which have impacted significantly on Essential Energy’s ability to meet its forecast program. Largely beyond Essential Energy’s immediate control, these factors have nonetheless had a direct impact on Essential Energy’s operational expenditure, but were not foreseeable during the previous determination process. The key developments are:
Increased political pressure on the state government (the network owner) to control electricity prices. This was probably the primary motivation behind the creation of Networks NSW, and the resulting governance and cost control measures that were put in place.
The unprecedented take-up of solar PV in the residential sector. An initial feed-in tariff of $0.60/kWh on gross solar PV generation was the most generous of all the states’ schemes and extremely attractive to a large number of householders. Essential Energy was committed to enabling embedded generation connections, ensuring that metering installations were updated, and to managing the effects of the PV installations on power quality.
A side-effect of the global financial crisis was that several large residential subdivisions, particularly in the north of the state near the Queensland border, were put on hold by their developers. Whilst deferment of such projects reduces the DNSP’s CAPEX requirements, a lot of effort would have already been put into designing the growth projects necessary for such developments, which could also partly address known shortcomings in the existing network that would then have to be addressed by a possibly technically inferior and less efficient solution.

Parsons Brinckerhoff | 2265002A-STC-REP-001 Rev0 19
Essential Energy AER Determination Project - Review of Actual Spend vs Regulatory Allowance
3.2.3 Variance Analysis
The following tables show the actual expenditure for 2009/10 to 2013/14, including that forecast for 2013/14 compared to the regulatory determination allowance. The regulatory allowances in these tables have been adjusted from those in the original determination to account for an accounting policy change in the way that Essential Energy distributed overhead costs. At the time that the regulatory submission and determination were made for the 2009-14 regulatory control period, Essential Energy’s policy was to allocate overhead costs in proportion to the direct cost of labour for Essential Energy staff. However, from the start of the regulatory control period (i.e. from 1 July 2009), Essential Energy started to allocate overhead costs in proportion to the total direct cost of activities, including subcontractor costs.
Table 3.1 Variance analysis - network OPEX (real 2012/13 $000's)
2009/10 2010/11 2011/12 2012/13 2013/14Forecast Total
Actua l - 33,220 35,368 15,003 14,998 98,589
Al lowance - - - - - -
Variance - 33,220 35,368 15,003 14,998 98,589
Actua l 37,303 41,174 45,667 30,117 30,107 184,368
Al lowance 37,832 38,895 39,947 40,903 41,656 199,233
Variance (529) 2,279 5,719 (10,785) (11,549) (14,865)
Actua l - - - - - -
Al lowance 1,692 1,740 1,787 1,829 1,863 8,911
Variance (1,692) (1,740) (1,787) (1,829) (1,863) (8,911)
Actua l 84,084 70,467 79,525 74,252 74,227 382,555
Al lowance 71,422 73,429 75,415 77,220 78,642 376,128
Variance 12,662 (2,962) 4,109 (2,968) (4,415) 6,427
Actua l 98,468 101,847 149,508 179,264 179,205 708,293
Al lowance 124,082 125,226 126,023 126,450 126,058 627,840
Variance (25,615) (23,379) 23,485 52,815 53,146 80,453
Actua l 75,978 71,191 78,308 72,716 72,692 370,885
Al lowance 45,324 45,789 46,210 46,483 46,477 230,283
Variance 30,653 25,402 32,098 26,234 26,215 140,602
Actua l 31,894 39,893 50,527 43,077 43,062 208,454
Al lowance 97,076 99,737 102,362 104,746 106,738 510,659
Variance (65,182) (59,843) (51,835) (61,669) (63,676) (302,206)
Actua l 327,726 357,792 438,903 414,430 414,291 1,953,143
Al lowance 377,429 384,815 391,744 397,631 401,435 1,953,054
Variance (49,703) (27,022) 47,159 16,799 12,856 89
Expenditure type
Maintenance and Repair
Vegetation Management
Network Operating Costs
Emergency Response
Network operating costs
Inspection
Pole Replacement
Other maintenance costs
Explanation of Variances
The variations in actual expenditure from that forecast are attributable to the following:
Change in Accounting Policy - The reported OPEX data has been impacted by accounting policy change that occurred during the current regulatory period. Previously, Essential Energy distributed overhead costs according to the cost of direct labour (i.e. Essential Energy personnel) included in the total direct cost. However, this policy was changed in July 2009 such that overhead costs would be distributed across all direct costs, not just labour. As a result those programs that have an above average subcontractor content (e.g. vegetation management) show a significant increase in cost, largely as a result of this accounting policy change.
Network operating costs – An allowance had been made in the determination for the costs of operating all prescribed services to be a “non-network” cost (see Table 3.3). Essential Energy has now

Parsons Brinckerhoff | 2265002A-STC-REP-001 Rev0 20
Essential Energy AER Determination Project - Review of Actual Spend vs Regulatory Allowance
reclassified these costs as network costs, so they have been re-categorised accordingly. As an overall category of cost, the performance is as shown in Table 3.2.
Table 3.2 Network operating costs comparison (real 2012/13 $000's)
2009/10 2010/11 2011/12 2012/13 2013/14Forecast Total
Actual 14,260 33,220 35,368 15,003 14,998 112,848
Al lowance 20,032 20,129 20,322 20,497 20,592 101,572
Variance (5,772) 13,091 15,046 (5,495) (5,594) 11,276
Expenditure type
Network operating costs – Prescribed services operating costs
Vegetation Management – The vegetation management programme was the one programme most significantly affected by the change in overhead allocation policy. Under the original allowances, the programme would have shown a variance of $158m against an allowance of $550m (real 2012/13) for the 2009/14 regulatory control period, as shown in Figure 3.2.
Figure 3.2 Vegetation management OPEX – actual vs original allowance ($m real 2012/13)
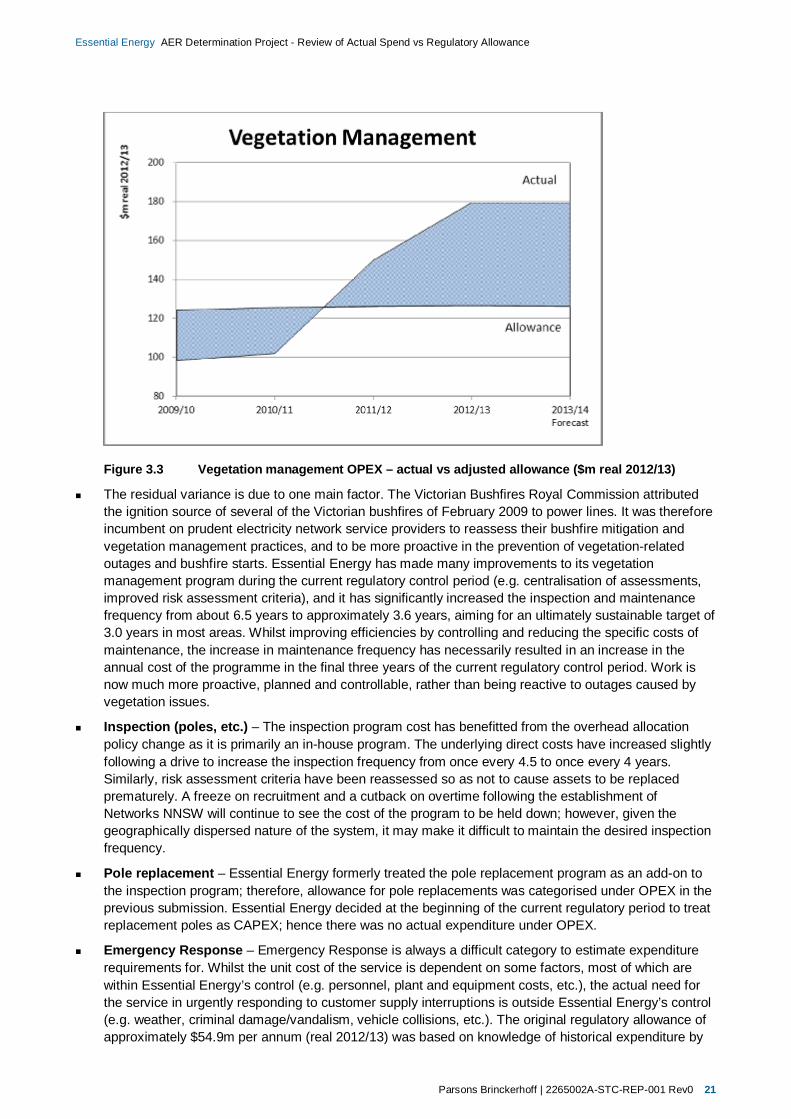
However, a large proportion of the cost of vegetation management is in subcontractor charges, so the policy change resulted in a significant adjustment, increasing the allowance by $77.5m (real 2012/13) over the regulatory control period, thus reducing the variance to $80.5m, as shown in Figure 3.3.
Parsons Brinckerhoff | 2265002A-STC-REP-001 Rev0 21
Essential Energy AER Determination Project - Review of Actual Spend vs Regulatory Allowance
Figure 3.3 Vegetation management OPEX – actual vs adjusted allowance ($m real 2012/13)
The residual variance is due to one main factor. The Victorian Bushfires Royal Commission attributed the ignition source of several of the Victorian bushfires of February 2009 to power lines. It was therefore incumbent on prudent electricity network service providers to reassess their bushfire mitigation and vegetation management practices, and to be more proactive in the prevention of vegetation-related outages and bushfire starts. Essential Energy has made many improvements to its vegetation management program during the current regulatory control period (e.g. centralisation of assessments, improved risk assessment criteria), and it has significantly increased the inspection and maintenance frequency from about 6.5 years to approximately 3.6 years, aiming for an ultimately sustainable target of 3.0 years in most areas. Whilst improving efficiencies by controlling and reducing the specific costs of maintenance, the increase in maintenance frequency has necessarily resulted in an increase in the annual cost of the programme in the final three years of the current regulatory control period. Work is now much more proactive, planned and controllable, rather than being reactive to outages caused by vegetation issues.
Inspection (poles, etc.) – The inspection program cost has benefitted from the overhead allocation policy change as it is primarily an in-house program. The underlying direct costs have increased slightly following a drive to increase the inspection frequency from once every 4.5 to once every 4 years. Similarly, risk assessment criteria have been reassessed so as not to cause assets to be replaced prematurely. A freeze on recruitment and a cutback on overtime following the establishment of Networks NNSW will continue to see the cost of the program to be held down; however, given the geographically dispersed nature of the system, it may make it difficult to maintain the desired inspection frequency.
Pole replacement – Essential Energy formerly treated the pole replacement program as an add-on to the inspection program; therefore, allowance for pole replacements was categorised under OPEX in the previous submission. Essential Energy decided at the beginning of the current regulatory period to treat replacement poles as CAPEX; hence there was no actual expenditure under OPEX.
Emergency Response – Emergency Response is always a difficult category to estimate expenditure requirements for. Whilst the unit cost of the service is dependent on some factors, most of which are within Essential Energy’s control (e.g. personnel, plant and equipment costs, etc.), the actual need for the service in urgently responding to customer supply interruptions is outside Essential Energy’s control (e.g. weather, criminal damage/vandalism, vehicle collisions, etc.). The original regulatory allowance of approximately $54.9m per annum (real 2012/13) was based on knowledge of historical expenditure by

Parsons Brinckerhoff | 2265002A-STC-REP-001 Rev0 22
Essential Energy AER Determination Project - Review of Actual Spend vs Regulatory Allowance
Country Energy over the years prior to the last determination. This allowance was reduced to approximately $46.1m as a result of the change in accounting policy. In the event, actual expenditure was found to average approximately $74m per annum (real 2012/13) as shown in Figure 3.4.
Figure 3.4 Emergency response OPEX – actual vs adjusted allowance ($m real 2012/13)
Overall, our assessment indicates that much of the OPEX savings is attributable to re-categorisation of prescribed services operating costs from non-network to network OPEX, and the pole replacement program from OPEX to CAPEX. Pressure from NNSW to improve efficiency has been effective in reducing costs, though possibly at the expense of increasing the business’s risk exposure – particularly in the areas of inspection and vegetation management. Notably these programs might not keep up with their planned frequencies given personnel capacity constraints.
Parsons Brinckerhoff | 2265002A-STC-REP-001 Rev0 23
Essential Energy AER Determination Project - Review of Actual Spend vs Regulatory Allowance
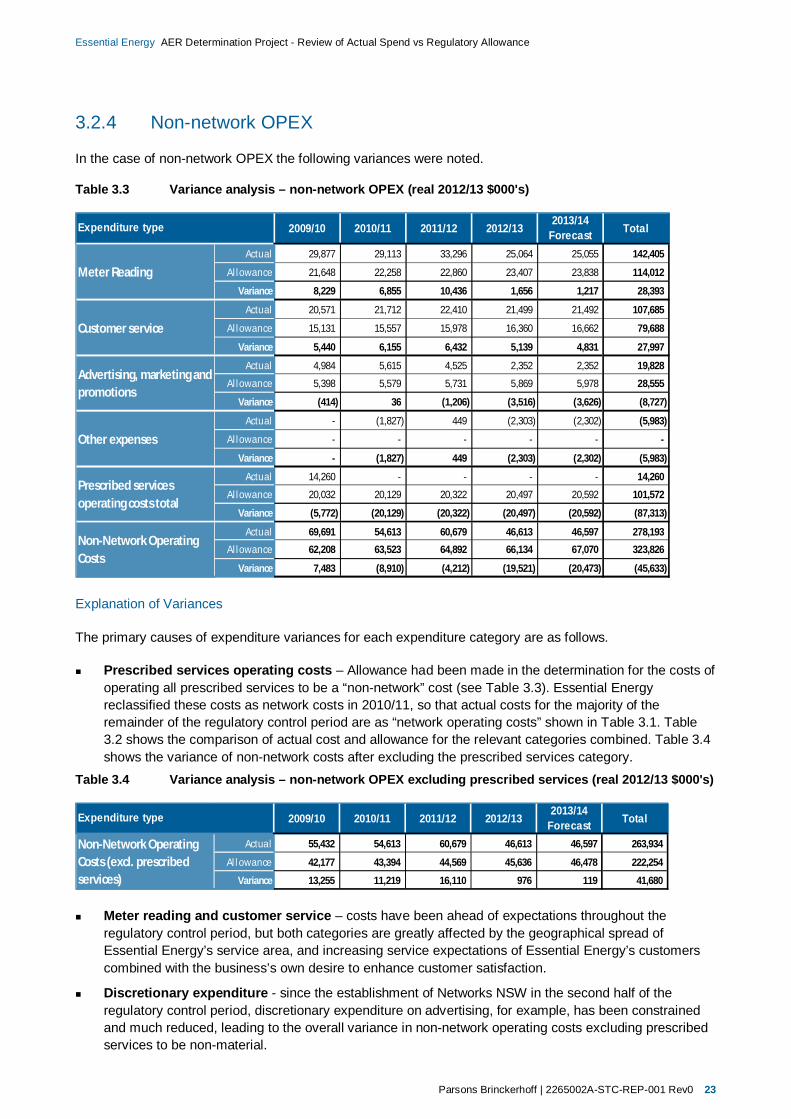
3.2.4 Non-network OPEX
In the case of non-network OPEX the following variances were noted.
Table 3.3 Variance analysis – non-network OPEX (real 2012/13 $000's)
2009/10 2010/11 2011/12 2012/13 2013/14Forecast Total
Actual 29,877 29,113 33,296 25,064 25,055 142,405
Al lowance 21,648 22,258 22,860 23,407 23,838 114,012
Variance 8,229 6,855 10,436 1,656 1,217 28,393
Actual 20,571 21,712 22,410 21,499 21,492 107,685
Al lowance 15,131 15,557 15,978 16,360 16,662 79,688
Variance 5,440 6,155 6,432 5,139 4,831 27,997
Actual 4,984 5,615 4,525 2,352 2,352 19,828
Al lowance 5,398 5,579 5,731 5,869 5,978 28,555
Variance (414) 36 (1,206) (3,516) (3,626) (8,727)
Actual - (1,827) 449 (2,303) (2,302) (5,983)
Al lowance - - - - - -
Variance - (1,827) 449 (2,303) (2,302) (5,983)
Actual 14,260 - - - - 14,260
Al lowance 20,032 20,129 20,322 20,497 20,592 101,572
Variance (5,772) (20,129) (20,322) (20,497) (20,592) (87,313)
Actual 69,691 54,613 60,679 46,613 46,597 278,193
Al lowance 62,208 63,523 64,892 66,134 67,070 323,826
Variance 7,483 (8,910) (4,212) (19,521) (20,473) (45,633)
Expenditure type
Prescribed services operating costs total
Non-Network Operating Costs
Other expenses
Meter Reading
Customer service
Advertising, marketing and promotions
Explanation of Variances
The primary causes of expenditure variances for each expenditure category are as follows.
Prescribed services operating costs – Allowance had been made in the determination for the costs of operating all prescribed services to be a “non-network” cost (see Table 3.3). Essential Energy reclassified these costs as network costs in 2010/11, so that actual costs for the majority of the remainder of the regulatory control period are as “network operating costs” shown in Table 3.1. Table 3.2 shows the comparison of actual cost and allowance for the relevant categories combined. Table 3.4 shows the variance of non-network costs after excluding the prescribed services category.
Table 3.4 Variance analysis – non-network OPEX excluding prescribed services (real 2012/13 $000's)
2009/10 2010/11 2011/12 2012/132013/14
Forecast Total
Actua l 55,432 54,613 60,679 46,613 46,597 263,934
Al l owance 42,177 43,394 44,569 45,636 46,478 222,254
Variance 13,255 11,219 16,110 976 119 41,680
Non-Network Operating Costs (excl. prescribed services)
Expenditure type
Meter reading and customer service – costs have been ahead of expectations throughout the regulatory control period, but both categories are greatly affected by the geographical spread of Essential Energy’s service area, and increasing service expectations of Essential Energy’s customers combined with the business’s own desire to enhance customer satisfaction.
Discretionary expenditure - since the establishment of Networks NSW in the second half of the regulatory control period, discretionary expenditure on advertising, for example, has been constrained and much reduced, leading to the overall variance in non-network operating costs excluding prescribed services to be non-material.

Appendix A
National Electricity Rules requirements

Parsons Brinckerhoff | 2265002A-STC-REP-001 Rev0 A-1
A1. National Electricity Rules extracts
National Electricity Rules clause S6.1.1
1. capital expenditure for each of the past regulatory years of the previous and current regulatory control period, and the expected capital expenditure for each of the last two regulatory years of the current regulatory control period, categorised in the same way as for the capital expenditure forecast and separately identifying for each such regulatory year:
a) margins paid or expected to be paid by the Distribution Network Service Provider in circumstances where those margins are referable to arrangements that do not reflect arm's length terms; and
b) expenditure that should have been treated as operating expenditure in accordance with the policy submitted under paragraph (8) for that regulatory year;
2. an explanation of any significant variations in the forecast capital expenditure from historical capital expenditure; and
3. the policy that the Distribution Network Service Provider applies in capitalising operating expenditure.
National Electricity Rules clause S6.1.2
7. operating expenditure for each of the past regulatory years of the previous and current regulatory control period, and the expected operating expenditure for each of the last two regulatory years of the current regulatory control period, categorised in the same way as for the operating expenditure forecast;
8. an explanation of any significant variations in the forecast operating expenditure from historical operating expenditure.


