31
AER/AGS Open File Report 2016-03 Summary of Hydraulic Conductivity Values for the Paskapoo Formation in West-Central Alberta

AER/AGS Open File Report 2016-03
Summary of Hydraulic Conductivity Values for the Paskapoo Formation in West-Central Alberta

AER/AGS Open File Report 2016-03
Summary of Hydraulic Conductivity Values for the Paskapoo Formation in West-Central Alberta
A.T. Hughes1, B.D. Smerdon1 and D.S. Alessi2
1 Alberta Energy Regulator Alberta Geological Survey
2 Department of Earth and Atmospheric Sciences, University of Alberta
February 2017

AER/AGS Open File Report 2016-03 (February 2017) • iii
©Her Majesty the Queen in Right of Alberta, 2017ISBN 978-1-4601-0162-9
The Alberta Energy Regulator/Alberta Geological Survey (AER/AGS), its employees and contractors make no warranty, guarantee or representation, express or implied, or assume any legal liability regarding the correctness, accuracy, completeness or reliability of this publication. Any references to proprietary software and/or any use of proprietary data formats do not constitute endorsement by AER/AGS of any manufacturer’s product.
If you use information from this publication in other publications or presentations, please acknowledge the AER/AGS. We recommend the following reference format:
Hughes, A.T., Smerdon, B.D. and Alessi, D.S. (2017): Summary of hydraulic conductivity values for the Paskapoo Formation in west-central Alberta; Alberta Energy Regulator, AER/AGS Open File Report 2016-03, 25 p.
Publications in this series have undergone only limited review and are released essentially as submitted by the author.
Author addresses:D.S. Alessi Department of Earth & Atmospheric Sciences University of Alberta Edmonton, AB - T6G 2E3 Canada 780.492.8019 E-mail: [email protected]
Published February 2017 by:Alberta Energy RegulatorAlberta Geological Survey4th Floor, Twin Atria Building4999 – 98th AvenueEdmonton, AB T6B 2X3Canada
Tel: 780.638.4491Fax: 780.422.1459E-mail: [email protected]: ags.aer.ca

AER/AGS Open File Report 2016-03 (February 2017) • iv
ContentsAcknowledgements ........................................................................................................................................vAbstract ........................................................................................................................................................ vi1 Introduction .............................................................................................................................................12 The Paskapoo Formation .........................................................................................................................1
2.1 Geological Overview......................................................................................................................12.2 Hydrogeological Characteristics ....................................................................................................12.3 Study Area ......................................................................................................................................3
3 Methods ...................................................................................................................................................33.1 Air Permeameter Testing ................................................................................................................33.2 Pumping Test Analysis ...................................................................................................................4
4 Results .....................................................................................................................................................55 Discussion ...............................................................................................................................................86 Summary .................................................................................................................................................97 References .............................................................................................................................................11Appendix 1 – Summary Table of Air Permeameter Results ........................................................................13Appendix 2 – Summary Plots of Air Permeameter Results .........................................................................14Appendix 3 – Borehole Strip Logs with Hydraulic Conductivity ...............................................................16
TablesTable 1. Summary statistics showing hydraulic conductivity, transmissivity, and permeability
results from air permeameter testing and pumping test analyses. ..............................................8
FiguresFigure 1. Location of the study area, drillcores tested with an air permeameter, and pumping test
analyses. .....................................................................................................................................2Figure 2. Example drawdown vs. time plotted using Jacob’s straight-line method for pumping tests. ....4Figure 3. Summary of hydraulic conductivity values obtained during air permeameter testing and
pumping test analyses. ................................................................................................................6Figure 4. Distribution of hydraulic conductivities among sandstones and mudstones, siltstones, and
shales obtained using an air permeameter. .................................................................................6Figure 5. Results of pumping test analysis. ...............................................................................................7Figure 6. Strip log with hydraulic conductivity of drillcore 97NC05-1. .................................................10

AER/AGS Open File Report 2016-03 (February 2017) • v
AcknowledgementsWe thank G. Jean (AER/AGS) and R. Natyshen (AER) for their support during data collection, and L. Atkinson (AER/AGS) for assistance with strip logs.

AER/AGS Open File Report 2016-03 (February 2017) • vi
AbstractAs part of the Alberta Geological Survey project “Hydrogeological Characterization of the Fox Creek Area, West-Central Alberta,” the hydraulic conductivity of the Paskapoo Formation was evaluated for west-central Alberta. Hydraulic conductivity values were determined along the length of nine drill cores from the area between Hinton and Fox Creek using an air permeameter. Additionally, pumping test records from the Alberta Water Well Information Database were analyzed to estimate transmissivity and hydraulic conductivity. The resultant horizontal hydraulic conductivity values vary from 1.1 × 10⁻¹⁰ to 1.0 × 10⁻³ m/s, supporting previous findings that the Paskapoo Formation is a highly heterogeneous system. Whereas previous studies have focused mainly on the lower portions of the Paskapoo Formation (i.e., basal sandstone), this study focuses on the middle siltstone/mudstone unit (1.1 × 10⁻¹⁰ m/s to 4.9 × 10⁻⁸ m/s) and upper sandstone unit (1.1 × 10⁻⁹ m/s to 1.0 × 10⁻³ m/s) for the northwestern portion of the Paskapoo Formation.

AER/AGS Open File Report 2016-03 (February 2017) • 1
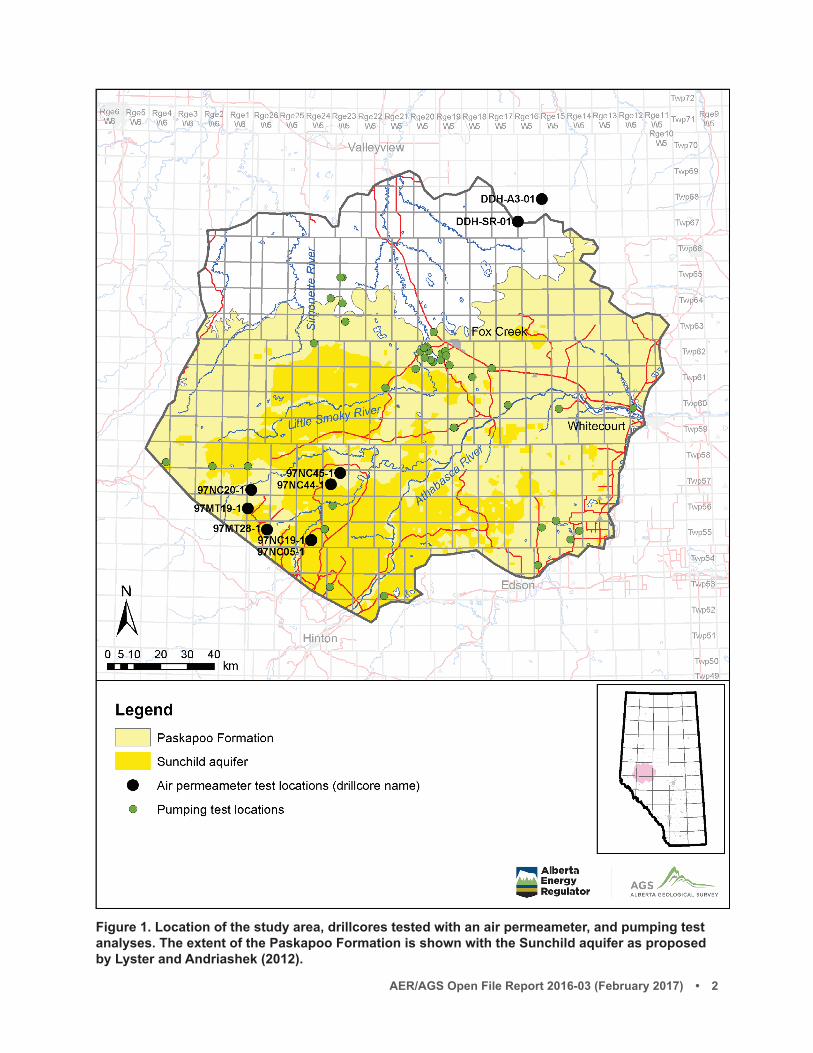
1 IntroductionThe Paskapoo Formation is the most important nonsaline groundwater source in the Canadian Prairies, covering 10% of Alberta and supporting over 60 000 water wells (Grasby et al., 2008). Although widely used and vital to Albertans, the Paskapoo Formation remains poorly understood in terms of the spatial variability of its potential as an aquifer system (Lyster and Andriashek, 2012; Grasby et al., 2008). Increasing development of shale gas plays in west-central Alberta requires large volumes of water, which could be sourced from the Paskapoo Formation to minimize reliance on surface water. In an effort to better understand the hydrogeological conditions of the area, the Alberta Geological Survey (AGS) has initiated a regional-scale characterization project in the vicinity of the Town of Fox Creek, Alberta (Figure 1).
The hydraulic properties of the Paskapoo Formation are essential for quantifying rates of groundwater movement and determining aquifer response to groundwater use. The objective of this study was to characterize the hydraulic conductivity of the Paskapoo Formation for a region centred on the Town of Fox Creek using both air permeametry (Hurst and Goggin, 1995) and pumping test data from the Alberta Water Well Information Database (Alberta Environment and Parks, 2015).
2 The Paskapoo Formation
2.1 Geological OverviewThe Paskapoo Formation is a Paleogene to earliest Eocene fluvial deposit (Hamblin, 2004; Leberkmo et al., 2008) dominated by siltstone and mudstone and interbedded with high-permeability, coarse-grained channel sands (Grasby et al., 2008). It covers over 65 000 km2 of southwestern Alberta and represents the uppermost bedrock unit over its area of occurrence (Chen et al., 2007; Hamblin, 2004). The Paskapoo Formation was deposited unconformably over the Upper Cretaceous– to lower Paleocene-aged Scollard Formation (Jerzykiewicz, 1997) as high-energy alluvial fan and floodplain deposits sourced from the eroding Rocky Mountains to the west (Hamblin, 2004). Its deposition into the subsiding foreland basin formed an asymmetrical clastic wedge with a present-day maximum thickness of up to 850 m in the foothills, pinching out to a few tens of metres towards the plains (Hamblin, 2004).
The Paskapoo Formation has been divided into three members by Demchuk and Hills (1991): the Haynes, Lacombe, and Dalehurst members. The lowermost Haynes Member is dominated by thick, massive, coarse-grained sandstones that are characteristic of the Paskapoo Formation (Demchuk and Hills, 1991). Outcrops of the Paskapoo Formation are often biased towards these massive, cliff-forming, basal sandstones, leading early interpretations to suggest a sandstone-dominated system (Lyster and Andriashek, 2012). The Lacombe Member consists of interbedded siltstone, mudstone, shale, and coal with minor fine- to medium-grained sandstone and conglomeratic lag-deposits (Demchuk and Hills, 1991). It is rarely exposed in outcrop due to its recessive nature, despite being the dominant component of the middle Paskapoo Formation (Lyster and Andriashek, 2012). The overlying Dalehurst Member is present only in the foothills of Alberta and displays interbedded sandstone, siltstone, mudstone, and shale with at least five thick (1.3 m to 6.1 m) coal seams (Demchuk and Hills, 1991).
2.2 Hydrogeological CharacteristicsSandstone in the Paskapoo Formation occurs as isolated, high-permeability channels that interconnect locally to form semicontinuous sandstone horizons (Grasby et al., 2007; Atkinson and Glombick, 2015). Further division of the Paskapoo Formation has been based on the occurrence of these sandstones, resulting in three informal hydrostratigraphic units suggested by Lyster and Andriashek (2012): the
AER/AGS Open File Report 2016-03 (February 2017) • 2
Figure 1. Location of the study area, drillcores tested with an air permeameter, and pumping test analyses. The extent of the Paskapoo Formation is shown with the Sunchild aquifer as proposed by Lyster and Andriashek (2012).

AER/AGS Open File Report 2016-03 (February 2017) • 3
Haynes and Sunchild aquifers and the Lacombe aquitard. The Haynes aquifer and Lacombe aquitard units are roughly equivalent to the Haynes and Lacombe members, respectively, as proposed by Demchuk and Hills (1991). The Sunchild aquifer is suggested as an alternative unit to the Dalehurst Member and is characterized by permeable sandstone bodies that display variable interconnectivity due to incision by present-day streams (Lyster and Andriashek, 2012).
Previously reported measurements of the hydraulic conductivity of the Paskapoo Formation primarily include Grasby et al. (2007) and Riddell et al. (2009), both of which used the air-permeametry method. For six drillcores in the Red Deer and Calgary region, Grasby et al. (2007) obtained a bimodal permeability distribution, with a mean value of 2.8 × 10⁻¹¹ m2 (corresponding to a hydraulic conductivity of 2.7 × 10⁻⁴ m/s). High permeability values were interpreted as being either coarse-grained basal sandstones or sandstones from the upper weathered zone where surface weathering processes are thought to locally enhance near-surface permeability; low permeability values were interpreted as being fine-grained sandstones or mudstones (Grasby et al., 2007). As part of groundwater mapping in the Edmonton-Calgary corridor, Riddell et al. (2009) obtained a mean hydraulic conductivity of 5.3 × 10⁻⁶ m/s for drillcores intersecting the Paskapoo Formation. Low-permeability lithologies such as siltstone and mudstone were found to have little variation in hydraulic conductivity (from 1.0 × 10⁻⁹ to 9.5 × 10⁻⁹ m/s), whereas sandstone intervals showed a range of conductivities spanning several orders of magnitude (from 4.5 × 10⁻⁹ to 4.9 × 10⁻⁵ m/s). Such large variation in sandstone conductivity was attributed to grain size distribution and degree of cementation (Riddell et al., 2009).
2.3 Study AreaThe region of interest covers roughly 22 000 km2 of west-central Alberta in the vicinity of Fox Creek, approximately 260 km northwest of Edmonton (Figure 1). The study area is bounded to the southwest by the Cordilleran deformation belt and by sub-basin drainage boundaries along all other borders. The area is forested, and outcrops of Paskapoo Formation are scarce except along major rivers and road cuts, making subsurface data invaluable when characterizing properties at a regional scale. The Paskapoo Formation varies in thickness from zero to more than 400 m in the study area.
3 Methods
3.1 Air Permeameter TestingNine drillcores from within and around the study area were tested using a Temco MP-401 air permeameter at the Mineral Core Research Facility in Edmonton. The majority of drillcores were collected in 1997 for mineralogical exploration by Kennecott Canada Exploration Inc. and are 47.6 mm diameter (NQ size). All cores intersect the Paskapoo Formation (Figure 1) with the exception of DDH-A3-01, which is located where the thickness of the Paskapoo Formation is zero metres. This core is thought to be representative of the Scollard Formation and is included in the study due to its role as an invaluable, high-quality data source and its proximity to the study area. Each core was subject to between 25 and 30 spot measurements using a 3 mm diameter probe placed perpendicular to the core axis to obtain horizontal permeability. Test locations were chosen such that a range of depths and lithologies were represented; locations that were poorly consolidated or displayed a high fracture volume were excluded. A total of 215 permeability measurements were made at regular depth intervals along each core. Resultant permeability data was used to obtain hydraulic conductivity using Equation 1.

AER/AGS Open File Report 2016-03 (February 2017) • 4
(1)
where K = hydraulic conductivity of sample (m/s); k = permeability of sample (m2); ρ = density of water (assumed to be 999.9 kg/m3); g = gravitational constant (9.81 m/s2); and µ = dynamic viscosity of water (8.9 × 10⁻⁴ kg/m·s).
3.2 Pumping Test AnalysisIn addition to air permeameter testing, pumping test records were extracted for analysis from the Alberta Water Well Information Database. Only data from wells that had been subject to greater than 120 minutes of pumping were considered because surrounding aquifer properties are assumed to be reasonably well represented after this duration. In total, data from 50 water wells from within the study area (Figure 1) was extracted for use based on the following criteria:
1) The wells did not display artesian flow.2) The well reports contained a sufficient litholog.3) The well reports contained sufficient pumping test information—including a volumetric flowrate, no
duplicate or missing drawdown values, and sufficient recovery data (i.e., after 120 minutes)—to be useful.
The resulting datasets were analyzed using the Cooper-Jacob straight-line approximation (Cooper and Jacob, 1946) for which drawdown is plotted against time using a semilogarithmic scale. A linear trend line was fit to the data recorded after 120 minutes and its slope was calculated. An example of a typical plotted dataset and corresponding trend line is given in Figure 2. The transmissivity of the surrounding aquifer horizons can then be calculated using Equation 2.
K =
kρg
µ
Figure 2. Example drawdown vs. time plotted using Jacob’s straight-line method for pumping tests.

AER/AGS Open File Report 2016-03 (February 2017) • 5
(2)
where T = transmissivity of the aquifer (m2/s), Q = volumetric discharge of the well (m3/s), m = difference in drawdown over one logarithmic cycle (slope). Resulting transmissivity values were used to obtain hydraulic conductivity using Equation 3.
(3)
where K = hydraulic conductivity of the aquifer (m/s), T = transmissivity of the aquifer (m2/s), and b = thickness of saturated interval from which water is being pumped (m). Saturated thickness (b) for each well was obtained using well report lithologs along with recorded perforation intervals and the following hierarchy of required criteria:
1) b = the perforation interval given on the well report, or sum of perforation intervals if more than one interval exists.
2) b = the sandstone portions of the perforated interval if the perforation interval intersects multiple lithologies.
3) b = the intervals described as “aquifer” in the litholog if 1 and 2 do not apply.4) b = the intervals described as “water-bearing” or “water-bearing sandstone” in the litholog if neither
1, 2 nor 3 apply.5) b = the intervals described as “sandstone” or “clean sandstone” in the litholog if neither 1, 2, 3 nor 4
apply.
Because the resultant hydraulic conductivity values are representative of an interval (i.e., b), each conductivity was then assigned to a depth corresponding to the midpoint of the uppermost and lowermost depths of the saturated intervals.
4 ResultsAir permeameter test results show hydraulic conductivity values that are generally lower than those from pumping test analyses (Figure 3). Values range from 1.1 × 10⁻¹⁰ to 3.0 × 10⁻⁵ m/s, with a weak bimodal distribution about an arithmetic mean of 7.4 × 10⁻⁷ m/s (Table 1; Figure 3a). Note that all mean values stated in this report are arithmetic means. An average hydraulic conductivity of 1.3 × 10⁻⁶ m/s was obtained for sandstone intervals, whereas the combined average for mudstones, siltstones, and shales is 4.4 × 10⁻⁹ m/s (Figure 4). Permeability values range from 9.9 × 10⁻¹⁸ m2 to 2.7 × 10⁻¹² m2, with an average permeability of 6.8 × 10⁻¹⁴ m2 (Table 1). Summary results from individual core are located in Appendices 1 and 2.
Pumping test analyses show a broad range in hydraulic conductivities for the study area, from 2.5 × 10⁻⁶ to 1.0 × 10⁻³ m/s with a unimodal distribution about an average of 2.3 × 10⁻⁴ m/s (Table 1; Figure 3a). Values are randomly distributed across the study area with no significant regions of high or low hydraulic conductivity (Figure 5). Transmissivity results are located in Table 1, with a mean value of 2.3 × 10⁻³ m2/s.
T =
2.3Q
4πm
K =
T
b

AER/AGS Open File Report 2016-03 (February 2017) • 6
Figure 3. Summary of hydraulic conductivity values obtained during air permeameter testing and pumping test analyses. a) Distribution of hydraulic conductivities among both types of analyses. b) Hydraulic conductivity vs. depth plot demonstrates no relationship between the two variables. Pumping test values are several orders of magnitude higher that air permeameter results.
Figure 4. Distribution of hydraulic conductivities among sandstones and mudstones, siltstones, and shales obtained using an air permeameter. Sandstones show a wide range with bimodal distribution, while fine-grained lithologies show a narrow range with unimodal distribution.

AER/AGS Open File Report 2016-03 (February 2017) • 7
Figure 5. Results of pumping test analysis. Symbol size represents relative hydraulic conductivity obtained from pumping test analyses; colour represents depth of measurement below surface.
AER/AGS Open File Report 2016-03 (February 2017) • 8
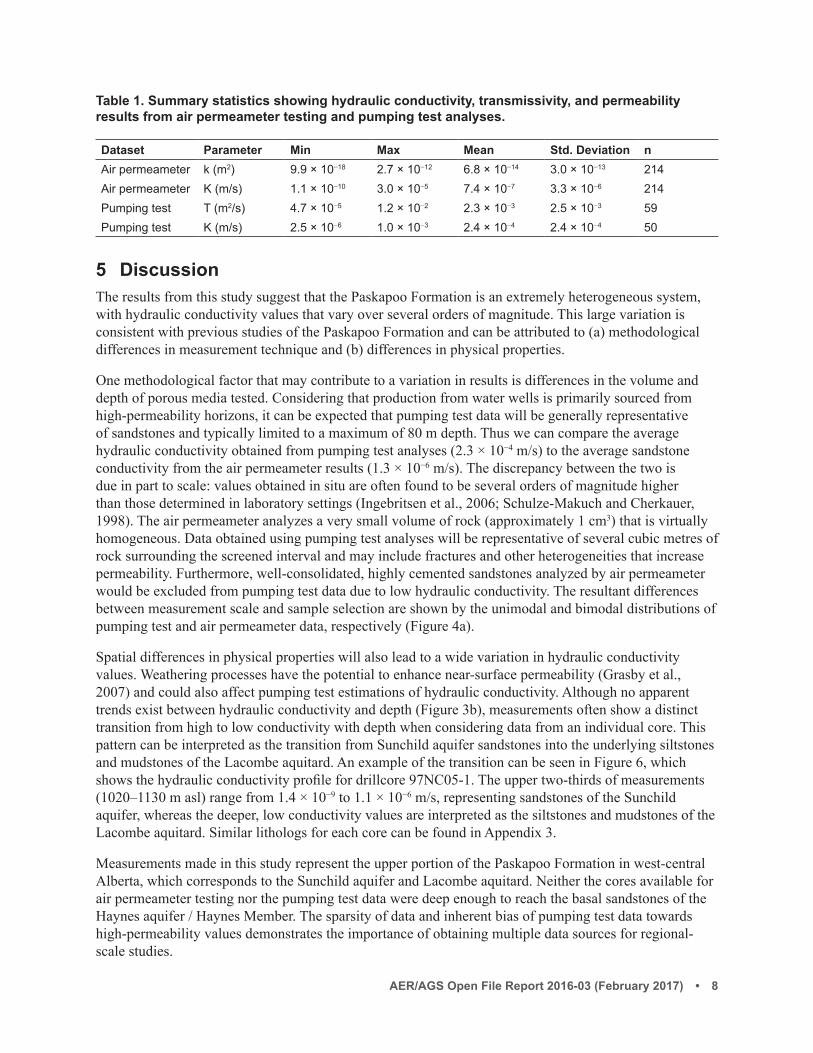
5 DiscussionThe results from this study suggest that the Paskapoo Formation is an extremely heterogeneous system, with hydraulic conductivity values that vary over several orders of magnitude. This large variation is consistent with previous studies of the Paskapoo Formation and can be attributed to (a) methodological differences in measurement technique and (b) differences in physical properties.
One methodological factor that may contribute to a variation in results is differences in the volume and depth of porous media tested. Considering that production from water wells is primarily sourced from high-permeability horizons, it can be expected that pumping test data will be generally representative of sandstones and typically limited to a maximum of 80 m depth. Thus we can compare the average hydraulic conductivity obtained from pumping test analyses (2.3 × 10⁻⁴ m/s) to the average sandstone conductivity from the air permeameter results (1.3 × 10⁻⁶ m/s). The discrepancy between the two is due in part to scale: values obtained in situ are often found to be several orders of magnitude higher than those determined in laboratory settings (Ingebritsen et al., 2006; Schulze-Makuch and Cherkauer, 1998). The air permeameter analyzes a very small volume of rock (approximately 1 cm3) that is virtually homogeneous. Data obtained using pumping test analyses will be representative of several cubic metres of rock surrounding the screened interval and may include fractures and other heterogeneities that increase permeability. Furthermore, well-consolidated, highly cemented sandstones analyzed by air permeameter would be excluded from pumping test data due to low hydraulic conductivity. The resultant differences between measurement scale and sample selection are shown by the unimodal and bimodal distributions of pumping test and air permeameter data, respectively (Figure 4a).
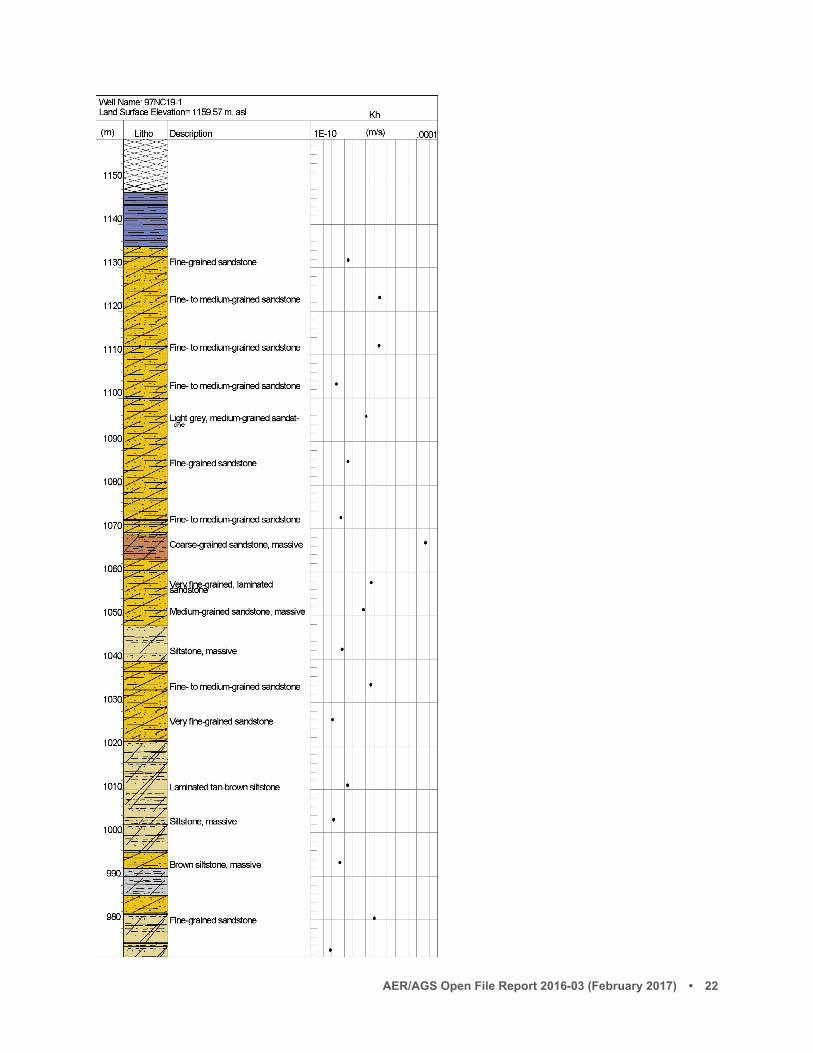
Spatial differences in physical properties will also lead to a wide variation in hydraulic conductivity values. Weathering processes have the potential to enhance near-surface permeability (Grasby et al., 2007) and could also affect pumping test estimations of hydraulic conductivity. Although no apparent trends exist between hydraulic conductivity and depth (Figure 3b), measurements often show a distinct transition from high to low conductivity with depth when considering data from an individual core. This pattern can be interpreted as the transition from Sunchild aquifer sandstones into the underlying siltstones and mudstones of the Lacombe aquitard. An example of the transition can be seen in Figure 6, which shows the hydraulic conductivity profile for drillcore 97NC05-1. The upper two-thirds of measurements (1020–1130 m asl) range from 1.4 × 10⁻⁹ to 1.1 × 10⁻⁶ m/s, representing sandstones of the Sunchild aquifer, whereas the deeper, low conductivity values are interpreted as the siltstones and mudstones of the Lacombe aquitard. Similar lithologs for each core can be found in Appendix 3.
Measurements made in this study represent the upper portion of the Paskapoo Formation in west-central Alberta, which corresponds to the Sunchild aquifer and Lacombe aquitard. Neither the cores available for air permeameter testing nor the pumping test data were deep enough to reach the basal sandstones of the Haynes aquifer / Haynes Member. The sparsity of data and inherent bias of pumping test data towards high-permeability values demonstrates the importance of obtaining multiple data sources for regional-scale studies.
Table 1. Summary statistics showing hydraulic conductivity, transmissivity, and permeability results from air permeameter testing and pumping test analyses.
Dataset Parameter Min Max Mean Std. Deviation nAir permeameter k (m2) 9.9 × 10⁻¹⁸ 2.7 × 10⁻¹² 6.8 × 10⁻¹⁴ 3.0 × 10⁻¹³ 214Air permeameter K (m/s) 1.1 × 10⁻¹⁰ 3.0 × 10⁻⁵ 7.4 × 10⁻⁷ 3.3 × 10⁻⁶ 214Pumping test T (m2/s) 4.7 × 10⁻⁵ 1.2 × 10⁻² 2.3 × 10⁻³ 2.5 × 10⁻³ 59Pumping test K (m/s) 2.5 × 10⁻⁶ 1.0 × 10⁻³ 2.4 × 10⁻⁴ 2.4 × 10⁻⁴ 50

AER/AGS Open File Report 2016-03 (February 2017) • 9
6 SummaryThe Paskapoo Formation contains the most important nonsaline aquifer system in the Canadian Prairies, although not much is known about the hydrogeological regime. This study determined hydraulic conductivity values of the Paskapoo Formation in west-central Alberta using air permeameter measurements on nine drillcores from the Fox Creek area and pumping test data from the Alberta Water Well Information Database. Findings suggest that the variability in hydraulic conductivity of the Paskapoo Formation found previously is also true for the Fox Creek region. Results suggest that lithology alone is not a sufficient indicator of potential hydrogeological properties in the Paskapoo Formation due the wide range of values determined for sandstones. To explore the sandstone units further, suggested future work includes investigating the type and amount of cementation in Paskapoo Formation sandstones in the Fox Creek region as well as an evaluation of porosity using thin-section analysis. Additionally, vertical hydraulic conductivity measurements should be made using the air permeameter in order to quantify the degree of anisotropy in the region.

AER/AGS Open File Report 2016-03 (February 2017) • 10
Figure 6. Strip log with hydraulic conductivity of drillcore 97NC05-1.

AER/AGS Open File Report 2016-03 (February 2017) • 11
7 ReferencesAlberta Environment and Parks (AEP) (2015): Alberta water well information database; Government of
Alberta, URL <http://groundwater.alberta.ca/WaterWells> [September 2016].
Atkinson, L.A. and Glombick, P.M. (2015): Three-dimensional hydrostratigraphic modelling of the Sylvan Lake sub-basin in the Edmonton-Calgary Corridor, central Alberta; Alberta Energy Regulator, AER/AGS Open File Report 2014-10, 58 p., URL <http://ags.aer.ca/publications/OFR_2014_10.html> [September 2016].
Chen, Z., Grasby, S.E. and Wozniak, P.R.J. (2007): Paskapoo groundwater study part VI: aquifer transmissivity estimation and a preliminary data analysis of the Paskapoo Formation, Alberta; Geological Survey of Canada, Open File 5444, 31 p., doi:10.4095/224035.
Cooper, H. H. and Jacob, C. E. (1946): A generalized graphical method for evaluating formation constants and summarizing well-field history; Eos, Transactions American Geophysical Union, v. 27, no. 4, p. 526–534, doi:10.1029/TR027i004p00526.
Demchuk, T.D. and Hills, L.V. (1991): A re-examination of the Paskapoo Formation in the central Alberta Plains: the designation of three new members; Bulletin of Canadian Petroleum Geology, v. 39, p. 270–282, URL <http://archives.datapages.com/data/cspg/data/039/039003/0270.htm> [September 2016].
Grasby, S., Tan, W., Chen, Z. and Hamblin, A.P. (2007): Paskapoo groundwater study part I: hydrogeological properties of the Paskapoo Formation determined from six continuous cores; Geological Survey of Canada, Open File 5392, 6 p., doi:10.4095/223756.
Grasby, S.E., Chen, Z., Hamblin, A.P., Wozniak, P.R.J. and Sweet, A.R. (2008): Regional characterization of the Paskapoo bedrock aquifer system, southern Alberta; Canadian Journal of Earth Sciences, v. 45, no. 12, p. 1501–1516, doi:10.1139/E08-069.
Hamblin, A.P. (2004): Paskapoo-Porcupine Hills Formations in western Alberta: synthesis of regional geology and resource potential; Geological Survey of Canada, Open File 4679, 30 p., doi:10.4095/215631.
Hurst, A. and Goggin, D. (1995): Probe permeametry: an overview and bibliography; American Association of Petroleum Geologists Bulletin, v. 79, p. 463–473. URL <http://archives.datapages.com/data/bulletns/1994-96/data/pg/0079/0003/0450/0463.htm> [September 2016].
Ingebritsen, S.E., Sanford, W.E. and Neuzil, C. E. (2006): Groundwater in geologic processes (2nd edition); Cambridge University Press.
Jerzykiewicz, T. (1997): Stratigraphic framework of the uppermost Cretaceous to Paleocene strata of the Alberta Basin; Geological Survey of Canada, Bulletin 510, 121 p. URL <http://geogratis.gc.ca/api/en/nrcan-rncan/ess-sst/6bd77380-f580-5f48-b441-151301bc923d.html> [September 2016].
Leberkmo, J.F., Heaman, L.M., Baadsgaard, H., Muehlenbachs, K., Evans, M.E. and Sweet, A.R. (2008): Normal polarity magnetosubchrons in 24r and the age of the Paleocene-Eocene boundary; Canadian Journal of Earth Sciences, v. 45, no. 7, p. 781-793, doi:10.1139/E08-025.
Lyster, S. and Andriashek, L.D. (2012): Geostatistical rendering of the architecture of hydrostratigraphic units within the Paskapoo Formation, central Alberta; Energy Resources Conservation Board, ERCB/AGS Bulletin 66, 103 p. URL <http://ags.aer.ca/publications/BUL_066.html> [September 2016].

AER/AGS Open File Report 2016-03 (February 2017) • 12
Riddell, J.T.F., Andriashek, L.D., Jean, G. and Slattery, S.R. (2009): Preliminary results of sediment and bedrock coring in the Edmonton-Calgary Corridor, central Alberta; Energy Resources Conservation Board, ERCB/AGS Open File Report 2009-17, 81 p. URL <http://ags.aer.ca/publications/OFR_2009_17.html> [September 2016].
Schulze-Makuch, D. and Cherkauer, D. S. (1998): Variations in hydraulic conductivity with scale of measurement during aquifer tests in heterogeneous, porous carbonate rocks; Hydrogeology Journal, v. 6, no. 2, p. 204–215, doi:10.1007/s100400050145.

AER/AGS Open File Report 2016-03 (February 2017) • 13
Appendix 1 – Summary Table of Air Permeameter Results
Drillcore name Minimum (m/s) Maximum (m/s) Mean (m/s) Std. Dev (m/s) # Test pointsDDH-A3-01 1.2 × 10−09 8.9 × 10−06 1.2 × 10−06 2.5 × 10−06 26DDH-SR-01 1.2 × 10−09 3.0 × 10−05 2.2 × 10−06 6.9 × 10−06 2797MT19-1 1.1 × 10⁻¹⁰ 2.0 × 10−07 2.0 × 10−08 5.0 × 10−08 2997MT28-1 1.1 × 10−09 7.7 × 10−08 1.5 × 10−08 2.5 × 10−08 1597NC05-1 1.3 × 10−09 1.1 × 10−06 9.8 × 10−08 2.1 × 10−07 3897NC19-1 8.6 × 10⁻¹⁰ 2.6 × 10−05 1.5 × 10−06 6.2 × 10−06 1897NC20-1 1.1 × 10−09 8.1 × 10−07 4.1 × 10−08 1.6 × 10−07 2997NC44-1 1.6 × 10−09 1.1 × 10−05 1.1 × 10−06 2.5 × 10−06 2197NC45-1 6.8 × 10−08 1.2 × 10−08 9.9 × 10−07 2.3 × 10−06 12

AER/AGS Open File Report 2016-03 (February 2017) • 14
Appendix 2 – Summary Plots of Air Permeameter Results

AER/AGS Open File Report 2016-03 (February 2017) • 15

AER/AGS Open File Report 2016-03 (February 2017) • 16
Appendix 3 – Borehole Strip Logs with Hydraulic Conductivity

AER/AGS Open File Report 2016-03 (February 2017) • 17

AER/AGS Open File Report 2016-03 (February 2017) • 18

AER/AGS Open File Report 2016-03 (February 2017) • 19

AER/AGS Open File Report 2016-03 (February 2017) • 20

AER/AGS Open File Report 2016-03 (February 2017) • 21
AER/AGS Open File Report 2016-03 (February 2017) • 22

AER/AGS Open File Report 2016-03 (February 2017) • 23

AER/AGS Open File Report 2016-03 (February 2017) • 24

AER/AGS Open File Report 2016-03 (February 2017) • 25


