2 Aerodynamic Design of Sports Garments Harun Chowdhury School of Aerospace, Mechanical and Manufacturing Engineering, RMIT University Australia 1. Introduction The suitability of materials for sports garments must meet a range of performance parameters for the specific sport. Therefore, the minimisation of detrimental effects of sports garments on sporting performance is becoming an important aspect of sports technology and product design. The demands on sports garments design for high performance sports and particularly those associated with aerodynamic resistance and its associated energy loss during the sporting action extend the conventional design methodology of synthesis, form, and function to new requirements for quantitative understandings of materials performance and fabric construction. Therefore, sports garments design and its engineering modelling require detailed information on the fabric and surface physics of the materials about the aerodynamic behaviour. A number of factors identified by prior studies (Grappe et al., 2005; Lukes et al., 2005; Chowdhury et al., 2010) that may contribute to the aerodynamic efficiency of athletes in higher speed sports. Some major factors are: Athlete body position during activity Sport equipment and accessories used in sporting event Sports garments There are several factors that can affect the aerodynamic characteristics of sports garments. These are: Speed Body position Fabric properties Garment construction Fitting of the garments Speed is an important parameter for the aerodynamic optimisation of athlete’s performance in sports. It has significant influences on the overall aerodynamic efficiency based on the body position and geometric shapes of sports equipment including sports garments. For example, speed has significant effect on aerodynamic properties as the airflow regime may notably change from laminar to turbulent flow at a particular speed. Table 1 listed the average speed in air for various higher speed sports. www.intechopen.com
Transcript
2
Aerodynamic Design of Sports Garments
Harun Chowdhury School of Aerospace,
Mechanical and Manufacturing Engineering, RMIT University Australia
1. Introduction
The suitability of materials for sports garments must meet a range of performance
parameters for the specific sport. Therefore, the minimisation of detrimental effects of sports
garments on sporting performance is becoming an important aspect of sports technology
and product design. The demands on sports garments design for high performance sports
and particularly those associated with aerodynamic resistance and its associated energy loss
during the sporting action extend the conventional design methodology of synthesis, form,
and function to new requirements for quantitative understandings of materials performance
and fabric construction. Therefore, sports garments design and its engineering modelling
require detailed information on the fabric and surface physics of the materials about the
aerodynamic behaviour.
A number of factors identified by prior studies (Grappe et al., 2005; Lukes et al., 2005;
Chowdhury et al., 2010) that may contribute to the aerodynamic efficiency of athletes in
higher speed sports. Some major factors are:
Athlete body position during activity
Sport equipment and accessories used in sporting event
Sports garments
There are several factors that can affect the aerodynamic characteristics of sports garments. These are:
Speed
Body position
Fabric properties
Garment construction
Fitting of the garments
Speed is an important parameter for the aerodynamic optimisation of athlete’s performance
in sports. It has significant influences on the overall aerodynamic efficiency based on the
body position and geometric shapes of sports equipment including sports garments. For
example, speed has significant effect on aerodynamic properties as the airflow regime may
notably change from laminar to turbulent flow at a particular speed. Table 1 listed the
average speed in air for various higher speed sports.
www.intechopen.com
Applied Aerodynamics
22
Type of sports Average speed range (km/h)
Ski Jumping 90-100
Cycling 30-60
Downhill Skiing 80 – 120
Speed skating 50
Sprint (running) 32
Swimming 112 (i.e. 2.1 m/s in water)
Table 1. Average speeds in air for various higher speed sports
In all higher speed sports, the body position also plays an important role as some body parts
are responsible for generating either pure aerodynamic drag or both drag and lift
simultaneously. The angle of attack (inclination angle) on the aerodynamic drag and lift
generation can play a crucial role. Generally, the majority of the aerodynamic drag
generated by the body shapes is predominantly form or pressure drag. Therefore, the
projected frontal area can be a significant factor in aerodynamic drag generation. Grappe et
al. (1997) pointed out that the position of the athlete body should be constantly monitored
and analysed in order to ensure that the athlete adopts the most aerodynamic position alone
with the equipment at all times during the event.
The cyclists and ski jumpers body positions have been extensively studied and analysed by
the bio-mechanists since long. Kyle et al. (2004) and Di Prampero et al. (1979) demonstrated
that some positions are more aerodynamically efficient than others. Capelli et al. (1993)
showed that the importance of the drag reduction for the bicycle itself. During the sporting
event, different body part experiences the incoming air differently. In ski jumping, the
jumpers try to streamline their body to minimise the frontal area as well as the aerodynamic
drag during in-run phase. During flight phase, the trunk, arms and legs are positioned in
such a way that the jumper can jump a longer distance. Thus, the minimisation of drag and
maximisation of lift can be done depending on the body position during the flight. In
cycling, the cyclist body parts face on coming wind differently (e.g., various angles of
attack). Therefore, the aerodynamic drag reduction should be based on the posture of body
parts and streamlining the body parts as practical as possible. Under the optimal body
configuration in higher speed sports, the additional aerodynamic advantages (e.g.,
reduction of drags) can be possible by manipulating the flow regimes over the body parts
using appropriate fabric.
Sports garments are generally made of knitted fabrics that are manufactured with various fabric manufacturing techniques with natural or synthetic materials (e.g., cotton, polymer). The parameters affecting the aerodynamic properties (drag and lift) of fabrics are the surface roughness, seam position, wale orientation and the air permeability (Chowdhury et al., 2009, 2010; Oggiano et al., 2004; Moria et al., 2010). Studies by Dias & Delkumburewatte (2007) reported that there is a relationship between the surface profile and fabric construction parameters. The surface roughness and air permeability of the fabric can be controlled by manipulating different knitting parameters (Oggiano et al., 2009; Spencer, 2001). Hoerner (1952) reported that aerodynamic drag and lift might have direct relation with the air permeability of the fabrics.
www.intechopen.com
Aerodynamic Design of Sports Garments
23
The surface profile and the air permeability of sports fabrics can potentially exhibit significant influences on aerodynamic properties (lift and drag) and flow transitions from laminar to turbulent. Surface roughness is an important parameter for lift and drag due to the transitional properties at the boundary layer. Sport fabrics represent a wide spectrum of surface topologies and wide boundary layer behaviours. The importance of the aerodynamic attributes of the fabric materials used in the garment manufacturing was highlighted in numerous studies (Kyle et al., 2004; Brownlie, 1992; Oggiano et al., 2004; Moria et al., 2010). Also fabric surface is arrayed with regular pattern of stitches. The orientation of the stitches or wales within the garment can potentially have effects in the aerodynamic properties. No study has been reported addressing these parameters of garments in the literature.
Sports garments are made of multiple pieces or panels of fabric that are joined together by using seams or fasteners (e.g., zipper, buttons). The prominence of the seam (position and size) might have effect on drag and lift as it may change air flow regime locally. Kyle et al. (2004) mentioned that the reduction of aerodynamic drag of bicycle racing garments is possible by using different fabrics in different zones of the body parts by taking advantage of aerodynamic behaviour. Brownlie (1992) studied the effects of trip wire at transition point for drag reduction. In ski jumping suit, seam is significantly larger in size compared to cycling garment (skin suit) as the thickness of the ski jumping suit material is approximately 10 times larger. The seam in various speed sports garments potentially has significant effect on aerodynamic performance. The effect on the aerodynamic behaviour of the seam on the garments has not been well studied. The seam on sports garments plays a vital role in aerodynamic drag and lift. Therefore, a thorough study on seam should be undertaken in order to utilize its aerodynamic advantages and minimise its negative impact.
Prior studies were primarily carried out in wind tunnels utilizing mainly cylinders and mannequins with athletic garment and fabric covered. Kyle et al. (2004), Brownlie (1992), Moria et al. (2010) and Oggiano et al. (2009) used wind tunnel for drag measurement using vertical cylinder model. But different body parts have different angle configurations. Therefore, it is necessary to evaluate the aerodynamic properties of different parts of the athlete body with various angular configurations depending on the physical characteristics of the sports.
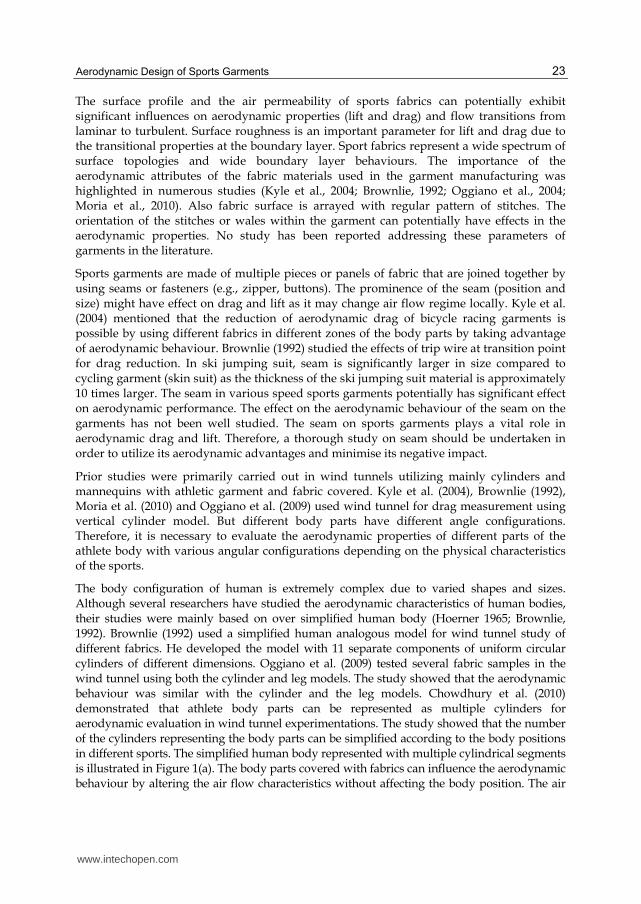
The body configuration of human is extremely complex due to varied shapes and sizes. Although several researchers have studied the aerodynamic characteristics of human bodies, their studies were mainly based on over simplified human body (Hoerner 1965; Brownlie, 1992). Brownlie (1992) used a simplified human analogous model for wind tunnel study of different fabrics. He developed the model with 11 separate components of uniform circular cylinders of different dimensions. Oggiano et al. (2009) tested several fabric samples in the wind tunnel using both the cylinder and leg models. The study showed that the aerodynamic behaviour was similar with the cylinder and the leg models. Chowdhury et al. (2010) demonstrated that athlete body parts can be represented as multiple cylinders for aerodynamic evaluation in wind tunnel experimentations. The study showed that the number of the cylinders representing the body parts can be simplified according to the body positions in different sports. The simplified human body represented with multiple cylindrical segments is illustrated in Figure 1(a). The body parts covered with fabrics can influence the aerodynamic behaviour by altering the air flow characteristics without affecting the body position. The air
www.intechopen.com
Applied Aerodynamics
24
flow characteristics can also be influenced by varying angles of attack. Figure 1(b) shows the segmentation of a sprinter in running position. The breakdown of individual body parts clearly show that these parts can be treated as multiple cylinders with varied dimensions and positions (Chowdhury et al., 2009, 2010).
WIND
(a) Human body (b) Sprinter
Fig. 1. Simplified model with cylindrical segments (Chowdhury et al., 2010)
Thus, the aerodynamic characteristics of these cylindrical body parts can easily be evaluated in wind tunnel testing under a range of angles of attacks and yaw angles representing real life body position in sporting actions using the articulating cylindrical methodology developed by Chowdhury et al. (2009, 2010). The study demonstrated that the cylindrical arrangements can be used to evaluate the aerodynamic properties of fabric features such as seam position, wale orientation and surface roughness with standard cylindrical geometry to quantify the aerodynamic properties more accurately.
In this study, the drag and lift characteristics of a number of sports fabrics were evaluated in various configurations together with the implications of this behaviour for the design of garments in such higher speed sports. Two sports were selected based on their speed ranges and characteristics. One is ski jumping where the speed is about 90 to 100 km/h. Another one is cycling where the speed is relatively lower, ranges from 30 to 60 km/h. For ski jumping, both lift and drag optimisation are important as the ski jumper become airborne during the in-flight phase. On the other hand, in cycling, the minimisation of aerodynamic drag is paramount. Full scale evaluation for ski jumping and cycling were also conducted. Full scale mannequin or human athlete test results were correlated with the standardised cylinder test data. Therefore, the focus of the research is on the comprehensive evaluation of aerodynamic behaviour of sports garments used in ski jumping and cycling sports to determine aerodynamic efficiency. No such study has been reported in the literature.
This chapter will describe a systematic methodology to design aerodynamically optimised sports garments starting from the wind tunnel experimentations of fabric sleeves with
www.intechopen.com
Aerodynamic Design of Sports Garments
25
cylinder models to the full scale evaluation of prototype suits. Details studies were carried out for cycling and ski jumping suits, although this methodology can be applied to other higher speed sports based on their characteristics.
2. Methods, equipment and materials
2.1 Segmentation of athlete body
In this study, the segmentation of different body parts for ski jumper and cyclist were considered. Figure 2 shows the cylinder representation of different body parts of a ski jumper. Simplified model of ski jumper was modelled with 5 cylindrical shapes based on the ski jumping at in-flight position obtained for the field research results of 19th Olympic Winter Games in 2002 (Schmölzer & Müller, 2004). Cylinder 1 and 2 represent the arms, cylinder 3 and 4 represent legs and cylinder 5 represents the trunk of the ski jumper. It is clearly evident that these cylinders have different angle of attack as shown in the side view. Angles of different body parts of a ski jumper are indicated in Figure 3. Table 2 indicates the angular positions of arm and leg segments of a ski jumper at in-flight position.
12
3
5
4
(a) Front view (b) Side view
Fig. 2. Cylinder representation of different body parts of a ski jumper
Body Segment Angle of Attack (°) Rotation (°)
Arm (1) 30 5.3
Leg (3) 45 30
Table 2. Angular position for leg and arm segments of a ski jumper
Similarly, cyclist body parts were also decomposed in to cylindrical geometry. Figure 4(a) shows the cylinder representation of different body parts of a cyclist. The body parts were considered only for those parts that are covered with fabric. Simplified model of a cyclist was modelled with 4 cylinders. Cylinder 1, 2, 3 and 4 represent the forearms, arms, trunk and thigh of the cyclist respectively. It is clearly seen that these cylinders have different
www.intechopen.com
Applied Aerodynamics
26
21
3
3
14
4
(a) Front view (b) Side view
Fig. 3. Angles of different body parts of a ski jumper
angle of attack. Also the angles are varied in different cyclist positions. In competitive cycling, 2 main cycling positions are generally being adapted by the cyclist (Kyle et al., 2004; Lukes et al., 2005). Angle of attack of body parts varies depending on cycling position. Angles of different body parts of a cyclist are indicated in Figure 4(b). Table 3 indicates the angular positions of different body parts of a cyclist at 2 cycling positions.
3
4
2
1
2
3
1
4
(a) Cylinder representation (b) Angles of a cyclist body parts
Fig. 4. Cylinder representation and angles of a cyclist body parts that are covered with fabric
Body segment angle Road racing position Time trial position
Thigh (1) 0°- 115° 0°- 115°
Trunk (2) 45° 0°
Arm (3) 115° 105°
Forearm (4) 115° 0°
Table 3. Angles of different body segment in two cycling positions
The rotational cylinder arrangement was used to measure the aerodynamic forces for cycling fabrics for different segments of the cyclist. Two samples were tested with a range of speed from 20 to 70 km/h with angles of attack at 30º, 45º, 60º, 105º and 115º which covers
www.intechopen.com
Aerodynamic Design of Sports Garments
27
all the body parts angles at different cycling positions (see Table 3). Rotation angle (yaw) was set to zero for all configurations. Aerodynamic evaluation of both ski jumping and cycling fabrics was carried out with rotational cylinder methodology (Chowdhury et al., 2009) which will be discussed in the next subsection.
2.2 Fabric testing using cylinder testing methodology
In order to evaluate aerodynamic properties (drag and lift forces and their corresponding moments) of these cylindrical body parts under a range of positions, a wind tunnel experimental methodology was developed by Chowdhury et al. (2008, 2009, 2010) with standard cylinder with variable angle configurations to measure the drag and lift simultaneously at different yaw and angle of attack. Figure 5 shows the schematic of the experimental arrangement. It consists of a solid cylinder with 110 mm diameter and 300 mm length. The cylinder is connected with 6-componemt load cell through a steel strut. Fabric sleeves to be tested are wrapped against the cylinder. The arrangement was designed with a rotating mechanism to allow the cylinder to fix any angle from 30º to 150º relative to the wind direction and also the yawing can be done by using rotating table that allows the cylinder to be rotated and fixed at any angle from 0° to 360°. Figure 6 shows the angle of attack and yaw angle measurement in the experimental arrangement.
Fig. 5. Schematic of the experimental arrangement
www.intechopen.com
Applied Aerodynamics
28
Side View
Angle of Attack = α
Top View
Front View
Yaw Angle =
(a) (b)
Fig. 6. Inclined cylinder arrangement in the wind tunnel
2.3 Full scale testing methodology
In order to measure the aerodynamic properties of ski jumping and cycling suits, two separate experimental arrangements and methodologies were used. Details of the experimental methodologies can be found in Chowdhury et al. (2010, 2011a, 2011b). For the ski jumping suits, an articulated mannequin (178 cm height) including all equipment (e.g., skis, boots, goggles and helmet) was used in wind tunnel testing for the replication of the ski jumper at in-flight position based on the field research results of 19th Olympic Winter Games in 2002 (Schmölzer & Müller, 2004). Figure 7 shows the experimental arrangement in
the wind tunnel for ski jumping suit testing. Suits were tested at a fixed position with =10º,
=20º, =160º and angle between two skis, V=30º.
(a) Front view (b) Side view
Fig. 7. Experimental arrangement in the wind tunnel for ski jumping suit testing
On the other hand, cycling suits were tested in the wind tunnel at road racing (upright) and time trial positions by using a professional cyclist. During the testing, professional racing bicycles along with appropriate helmets, and other accessories were used to replicate the
www.intechopen.com
Aerodynamic Design of Sports Garments
29
real cycling as possible. For the road racing position, a professional road racing bicycle (Orbea) and a Giro Atmos road racing helmet were used as shown in Figure 8(b). Figure 8(b) shows the time trial position in which a professional time trial bicycle (Louis Garneau) and a Giro Advantage time trial helmet were used. It may be mentioned that all necessary documentations on ethics of human experimentation was undertaken from the RMIT University Ethic Committee prior conducting the experiments.
(a) Road racing position (b) Time trial position
Fig. 8. Cycling suits testing in the wind tunnel
In order to reposition the experimental arrangement and other equipment for repeatable data acquisition, video positioning system was developed. Details of the video positioning system can be found in Chowdhury et al. (2011b).
2.4 Experimental facilities and equipment
The RMIT Industrial Wind Tunnel was used for this study. The wind tunnel is a closed return circuit wind tunnel that has a rectangular test section of 6 square meters with low turbulence (about 1.8%). The dimension of the test section is 2 m × 3 m × 9 m with a turntable to yaw suitably sized models. The tunnel used a 7-blade fan with the approximate diameter of 3 m, which is driven by a DC electric motor controlled by a tachometer mounted on the output shaft of the motor. The maximum wind speed in the test section is approximately145 km/h. A remotely mounted fan drive motor and acoustically treated turning vanes minimise the background noise and temperature rise inside the test section. Also the blockage ratio for the full scale test was less than 10%. A plan view of the tunnel is shown in Figure 9. The tunnel was calibrated before conducting the experiment.
The wind speeds inside the wind tunnel were measured with a modified National Physical Laboratory (NPL) ellipsoidal head pitot-static tube (located at the entry of the test section) which was connected through flexible tubing with the Baratron pressure sensor made by MKS Instruments, USA. Temperature, dynamic pressure, and upstream velocity inside the wind tunnel in real time are obtained from the wind tunnel control panel.
www.intechopen.com
Applied Aerodynamics
30
Fig. 9. A schematic of the wind tunnel
To measure the forces and moments in real time, a digital data accusation system was used. The system consists of a load sensor, connecting cable, PCI data card (12 bit) and data acquisition computer (Microsoft Windows 2000 compatible) with a data acquisition software. The experimental arrangements were connected through a mounting sting with the JR3 multi-axis load cell. The sensor was used to measure all three forces (drag, lift and side forces) and three moments (yaw, pitch and roll moments) at a time. Accuracy of the sensor is nominally 1% of full scale. Each data point is recorded for 30 seconds time average with a frequency of 20 Hz ensuring electrical interference was minimised. Multiple snaps were collected at each speed tested and the results were averaged for minimising the further possible errors in the raw experimental data which are further processed using Microsoft Excel spread sheet analysis software. Two M series JR3 sensors with load rating 200N and 1000N were used for the measurement of aerodynamic properties for cylinder and full scale testings respectively.
2.5 Materials
Three different fabrics were studied. Fabrics are generally made of yarn or thread that is a
continuous twisted strand of wool, cotton or synthetic fibre with various stitch
configurations. Figure 10 illustrates the structure of a common knitted fabric. Stitch density
of fabric is expressed as the amount of courses and wales per centimetre. Course can be
defined as the meandering path of the yarn through the fabric. Figure 10 shows the yellow
path that defines one course. Wale is a sequence of stitches in which each stitch is suspended
from the next as shown in Figure 10.
One ski jumping fabric material was studied with three wale orientations. Figure 11 shows the fabric orientation of the samples facing the wind. Wale direction is shown in Figure 11 with straight parallel lines. The figure shows that the wale directions of Sample#01, Sample#02 and Sample#03 are positioned at 0°, 45°, and 90° respectively with respect to wind direction. The position of seam of all 3 samples was placed at the back at 180° (opposite the wind flow direction) in order to avoid the flow disturbances due to the seam.
www.intechopen.com
Aerodynamic Design of Sports Garments
31
Wale
Course
Yarn
Fig. 10. Structure of a common knitted fabric stitch
Ski jumping fabric material consists of 5 layers. Outer and inner layer (thickness 0.5mm each) are knitted fabrics and the middle layers are (thickness 2 mm each) foam layers with an elastic perforated membrane at the centre layer. Other 2 knitted fabrics with average thickness of 0.5 mm were studied for cycling.
For this study, a Field Emission Scanning Electron Microscope (model: FEI Quanta 200) was used for capturing fabric surface images with different magnification and Alicona Mex® software was used to generate 3D model of the scanned images for surface profile analysis. Figure 12 shows the 3D model of a fabric surface. Table 4 listed the surface measurement of the fabrics used in this study. Fabric sleeves with a single seam were fabricated for the cylinder such that each fabric had similar tensions when installed on the cylinder.
Fabric Average height of fabric surface (µm)
Sample#01, 02 and 03 48.179
Sample#04 52.052
Sample#05 59.670
Table 4. Average height of fabric surface
www.intechopen.com
Applied Aerodynamics
32
Fig. 12. 3D model of a fabric surface
Two ski jumping suits were fabricated for full scale testing in the wind tunnel. The suits are shown in Figure 13. Ski jumping suit is generally a single piece suit made of 13 panels with a zipper at the front. The panels are stitched together using seams. Both suits were made according to the body measurement of the mannequin used for full scale wind tunnel testing where seams were positioned at 90° with respect to the wind direction. Table 5 represents the configuration of the ski jumping suits.
(a) Suit-A (b) Suit-B
Fig. 13. Ski jumping suits for full scale wind tunnel evaluation
Parameters Suit-A Suit-B
Colour Blue Bottle green and white
Leg sleeve fabric Sample#01 Sample#02
Arm sleeve fabric Sample#01 Sample#03
Table 5. Configuration of the ski jumping suits
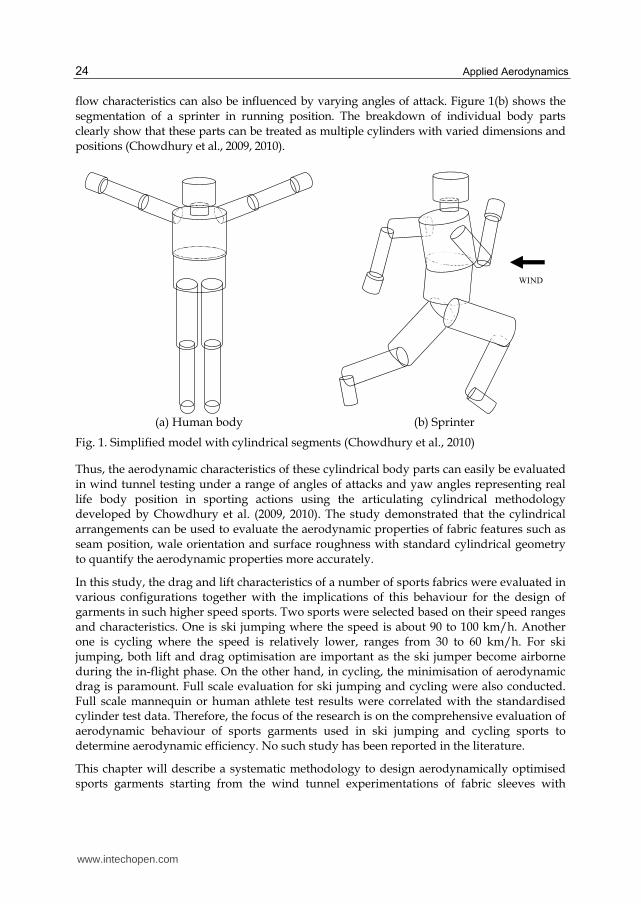
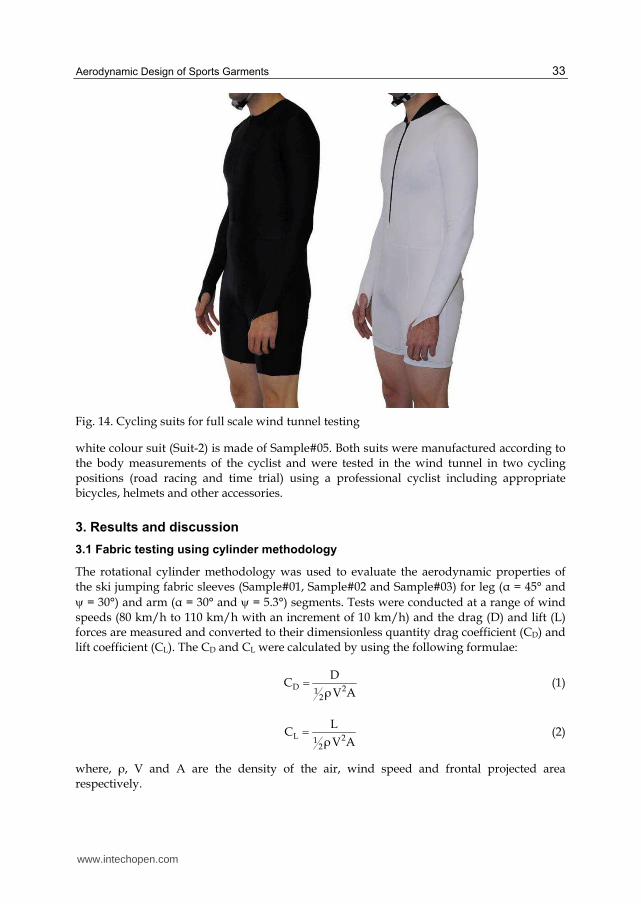
Two prototype cycling skin body suits (single piece) were also fabricated with different fabrics as shown in Figure 14. The black colour suit (Suit-1) is made of Sample#04 and the
www.intechopen.com
Aerodynamic Design of Sports Garments
33
Fig. 14. Cycling suits for full scale wind tunnel testing
white colour suit (Suit-2) is made of Sample#05. Both suits were manufactured according to the body measurements of the cyclist and were tested in the wind tunnel in two cycling positions (road racing and time trial) using a professional cyclist including appropriate bicycles, helmets and other accessories.
3. Results and discussion
3.1 Fabric testing using cylinder methodology
The rotational cylinder methodology was used to evaluate the aerodynamic properties of the ski jumping fabric sleeves (Sample#01, Sample#02 and Sample#03) for leg (α = 45° and
= 30°) and arm (α = 30° and = 5.3°) segments. Tests were conducted at a range of wind speeds (80 km/h to 110 km/h with an increment of 10 km/h) and the drag (D) and lift (L) forces are measured and converted to their dimensionless quantity drag coefficient (CD) and lift coefficient (CL). The CD and CL were calculated by using the following formulae:
D 212
DC
ρV A (1)
L 212
LC
ρV A (2)
where, ρ, V and A are the density of the air, wind speed and frontal projected area respectively.
www.intechopen.com
Applied Aerodynamics
34
Figures 15 and 16 show the results for the evaluation of ski jumping fabric for arm and leg segments respectively. The results show the CD, CL and L/D variations with speed (km/h).
0.51
0.54
0.57
70 90 110
CD
Speed (km/h)
Sample#01
Sample#02
Sample#03
0.28
0.31
0.34
70 90 110C
L
Speed (km/h)
Sample#01
Sample#02
Sample#03
0.51
0.55
0.59
0.63
70 90 110
L/D
Speed (km/h)
Sample#01
Sample#02
Sample#03
(a) CD variation with Speed (b) CL variation with Speed (c) L/D variation with Speed
Fig. 15. Evaluation of ski jumping fabric at arm position (α = 30° and = 5.3°)
0.72
0.76
0.80
0.84
70 90 110
CD
Speed (km/h)
Sample#01
Sample#02
Sample#03
0.08
0.13
0.18
0.23
0.28
0.33
70 90 110
CL
Speed (km/h)
Sample#01
Sample#02
Sample#03
0.15
0.20
0.25
0.30
0.35
0.40
70 90 110
L/D
Speed (km/h)
Sample#01
Sample#02
Sample#03
(a) CD variation with Speed (b) CL variation with Speed (c) L/D variation with Speed
Fig. 16. Evaluation of ski jumping fabric at leg position (α = 45° and = 30°)
In flight aerodynamics, the quality of lifting components is evaluated by the ratio of L/D (Meile et al., 2006). From the cylinder test results, it is clearly evident that Sample#03 has maximum L/D value than any other configurations within the speeds range from 90 to 100 km/h. Similarly, Sample#02 exhibits maximum L/D value for the leg configuration. Thus, it is believed that similar aerodynamic advantage can be obtained in full scale ski jumping suit by implementing the arm and leg segments of the suit according to these configurations.
In order to understand the effect of cylinder test results, two full scale suits were manufactured for full scale aerodynamic evaluation. One of these two suits (Suit-B) was made according to with maximum L/D ratio obtained from the cylinder testing methodology and other one (Suit-A) was made with Sample#01 for both the leg and arm segments. Tables 6 and 7 summarise the aerodynamic parameters for arm and leg segments of the ski jumping suit at a speed range from 90 to 100 km/h.
Parameters Sample#01 Sample#03 Changes (%)
CD 0.532 0.526 -1.1%
CL 0.296 0.314 +6.4%
L/D 0.556 0.598 +7.6%
Table 6. Fabric comparison for arm segment
www.intechopen.com
Aerodynamic Design of Sports Garments
35
Parameters Sample#01 Sample#02 Changes (%)
CD 0.761 0.774 +1.7%
CL 0.185 0.245 +32.2%
L/D 0.243 0.315 +29.7%
Table 7. Fabric comparison for leg segment
For the comparison of cylinder test results with the full scale evaluation, Sample#01 was taken as the base configuration. The changes (%) in aerodynamic properties were estimated in comparison with the base configuration (Sample#01) for both arm and leg segments. Table 6 shows that the CD is decreased by 1.1% but CL is increased by 6.4% for arm position. Also, the glide ratio (L/D) is increased about 7.6% which is an aerodynamic advantage. Similar aerodynamic benefit is also observed at leg position with an increase of L/D ratio about 30% (see Table 7). Full scale testing of these suits was carried out and the results will be discussed in next subsection.
In order to compare the cylinder test results with full scale evaluation, two cycling fabric samples—Sample#04 (relatively smooth surface) and Sample#05 (relatively rough surface) were selected for this study. The fabric samples were tested with a range of angles of attack starting from 30° to 115°. These angles were selected based on the cyclist’s body position during different cycling positions as elaborately discussed in Section 2. The impact of surface roughness in relation to different body position were compared with cylinder test results with full scale testing which will be discussed in next subsection. Figure 17 shows the CD variation with speed for 2 cycling fabrics at different angles of attack.
0.30
0.35
0.40
0.45
0.50
0 20 40 60 80
CD
Speed (km/h)
Sample#04Sample#05
=30°
0.40
0.50
0.60
0.70
0.80
0.90
0 20 40 60 80
CD
Speed (km/h)
Sample#04Sample#05
=45°
0.55
0.60
0.65
0.70
0.75
0.80
0.85
0 20 40 60 80
CD
Speed (km/h)
Sample#04Sample#05
=60°
(a) (b) (c)
0.35
0.45
0.55
0.65
0.75
0.85
0 20 40 60 80
CD
Speed (km/h)
Sample#04Sample#05
=90°
0.31
0.41
0.51
0.61
0.71
0.81
0 20 40 60 80
CD
Speed (km/h)
Sample#04Sample#05
=105°
0.25
0.35
0.45
0.55
0.65
0 20 40 60 80
CD
Speed (km/h)
Sample#04Sample#05
=115°
(d) (e) (f)
Fig. 17. Evaluation of cycling fabric at different angles of attack
Results indicate that relatively rough fabric (Sample#05) undergoes flow transition earlier than relatively smooth fabric (Sample#04) at high angle of attack (α = 45° to 115°). On the
www.intechopen.com
Applied Aerodynamics
36
other hand, Sample#04 has lower CD value (approximately 5% less) at low angle of attack (α = 30°) and higher speed (when speed is 40 km/h or over). It is clearly evident that with an increase of angle of attack, the rough fabric reduces drag more efficiently. However, when the body become more streamlined (at α<45°) then the smooth fabrics can be used to reduce drag more efficiently. In the time trial position, the cyclist body become streamline than road racing positions. Therefore, the smooth fabric has the potential to provide aerodynamic advantage at this position. But when the cyclist body is less inclined as in road racing (upright) position when the trunk, arm and thigh angles are more than 30°, then rough fabric has the potential to reduce overall drag at the low speed ranges from 30 to 40 km/h.
3.2 Full scale evaluation of sports garments
Two ski-jumping suits were tested for the full scale aerodynamic evaluation at two different positions. Frontal areas of the ski jumping experimental arrangement including the ski jumper at both positions were measured using the projected frontal area measurement system described in Chowdhury et al., 2011a. Drag and lift forces were measured at a range of wind speeds from 80 to 110 km/h. Drag and lift forces were converted to their non dimensional drag and lift coefficient. Figure 18 shows the full scale testing of ski jumping suits for the CD, CL and L/D variations with speed with error bars indicating the standard deviation of the experimental data.
0.70
0.75
0.80
0.85
0.90
70 80 90 100 110 120
CD
Speed (km/h)
Suit-ASuit-B
0.90
1.00
1.10
1.20
1.30
1.40
70 80 90 100 110 120
CL
Speed (km/h)
Suit-A
Suit-B
1.25
1.31
1.37
1.43
1.49
1.55
70 80 90 100 110 120
L/D
Speed (km/h)
Suit-ASuit-B
(a) CD variation with Speed (b) CL variation with Speed (c) L/D variation with Speed
Fig. 18. Full scale testing of ski jumping suits
Results show that there is little variation in CD values between two suits in both positions within the speed range from 90 to 100 km/h. Suit-B exhibits more CL value in both positions than Suit-A. Also L/D values of Suit-B are higher than that of Suit-A. Thus a little aerodynamic benefit is noted with Suit-B. With Suit-B, the Drag is decreased by 0.4% but the lift is increased by 2.2% with respect to Suit-A. The resultant jump length can be increased by about 4.44 m by using the simulation approach formulated by Muller & Schmolzer (2002).
Two cycling suits were manufactured for the full scale testing. Suits were tested at two widely used cycling positions: road racing and time trial. Projected frontal areas of the cyclist at different positions were measured using the projected frontal area measurement system described by Chowdhury et al., 2011b. Drag forces were measured under a range of wind speeds starting from 20 to 70 km/h with an increment of 10 km/h. Drag forces were converted to non dimensional drag coefficient (CD). Figure 19 shows the CD variation with speed at road racing and time trial position.
www.intechopen.com
Aerodynamic Design of Sports Garments
37
0.90
1.00
1.10
0 20 40 60 80
CD
Speed (km/h)
Road Racing PositionSuit-1
Suit-2
0.80
0.90
1.00
0 20 40 60 80
CD
Speed (km/h)
Suit-1
Suit-2
Time Trial Position
(a) Road racing position (b) Time trial position
Fig. 19. Ski jumping suits for full scale wind tunnel evaluation
The road racing (upright) position is used by the cyclist generally during long distance road racing. In this position, the frontal area is comparatively higher than time trial positions. As a result, the cyclist experiences more aerodynamic drag. The speed range for upright position is from 30 to 40 km/h. Suit-2 is made of relatively rough fabric (Sample#05) and has lowest CD values from 30 to 50 km/h as shown in Figure 19(a). Therefore, Suit-2 provides more aerodynamic benefits at this cycling position and speed range compared to Suit-1 which is made of relatively smooth fabric (Sample#04). Results show that around 2.1% drag reduction is possible with Suit-2 at upright position between 30 to 40 km/h.
On the other hand, in time trial position is used by the cyclist generally during the time trial cycling event. At this position, the cyclist tries to achieve the minimum projection frontal area in order to minimise the aerodynamic drag. This is the most streamlined position used by the cyclist. Figure 19(b) shows the CD variation with speed at time trial position. The speed range for the time trial position is generally 50 to 60 km/h. Suit-1 has lowest CD value within this speed range.
3.3 Comparison of results
In ski jumping, it was predicted earlier with the cylinder results that Suit-B would be more aerodynamically efficient than Suit-A. Cylinder results indicate an increase of L/D ratio approximately 30% for the leg segment and 8% for the arm segment compared to the base configuration (Sample #01). Full scale results shows that Suit-B has approximately 3% increase of L/D compared to Suit-A which is made according to base configuration. Therefore, it is evident that cylinder results has similar trend with full scale results. However, the magnitude of the aerodynamic benefit is different. Cylinder test results are more specific to the fabric properties. Full scale testing is more complicated compared to simplified cylindrical methodology.
In cycling, the average drag reduction was calculated by taking Suit-1 as the base for comparison. The average drag reduction with Suit-2 was found at road racing (upright) position by 2.1% approximately. But the drag increased by 1.5% at the time trial position at low speed (below 50 km/h). The average reduction of drag for the time trial positions was around 21% compared to the upright position. Suit-2 has the highest reduction of drag in
www.intechopen.com
Applied Aerodynamics
38
road racing (upright) position where generally the cyclist’s body is not very streamlined. Suit-1 performs better than Suit-2 at time trial position at high speeds (over 50 km/h).
Cylinder test results indicate that the smooth fabric possesses 5% less drag than rough fabric
at low angle of attack (α < 45) at speed ranges from 50 to 60 km/h. Full scale results indicate 2.1% drag reduction with Suit-1 at time trial position compared to Suit-2. Cylinder results also showed that the rough fabric undergoes the flow transition earlier than the
smooth fabric when angle of attack is more than 45. Therefore, at low speeds (from 40 to 50 km/h), CD values of the rough fabric are lower than that of the smooth fabric. The average drag reduction was calculated around 3.3% with Suit-2 compared to Suit-1. Therefore, it is evident that full scale test results compared well with cylinder results.
However, the magnitudes of the aerodynamic forces are less in cylinder testing. Cylinder results are more specific to fabric features (e.g., surface profile) of the suit compare to the full scale testing. The full scale testing is less sensitive as the high magnitude of force is measured and also the aerodynamic interference is more. Therefore, the cylinder test is more appropriate as the flow transition due to the surface roughness can be observed with cylinder testing. On the other hand, no flow transition was observed in the full scale testing for ski jumping and cycling which agreed well with published data (Brownlie, 1992). Brownlie tested several fabrics with cylinder model and garments with full scale models for cycling and sprint. The study showed that flow transition was only observed with cylinder model but no flow transition was noted with full scale model. Brownlie (1992) suggested that peripheral parts (arm, leg, etc.) of human athlete prevented the flow separation. In this study, complex flow structures were observed around the ski jumping and cycling using the flow visualisation technique which is not included in this study. However, on field test can be another way for further verification of cylinder test results.
4. Conclusion
Cylinder results have good agreement with the full scale testing both for ski jumping and cycling garments. In this study, it was estimated about 4.44 m increase of the jump length which could be a decisive advantage for a ski jumper. The results also demonstrated that the cycling suit should be selected depending on the cycling position and speed range in order to take the aerodynamic advantage. As the position in the world class competitions are decided with a fraction of time difference, apart from the athletic performance, an efficient sport garment can enhance the overall performance of the athlete. Depending on the nature of the sport, this methodology can be used as a basic design tool to optimise or select proper parameters for the betterment of the outcome. Prior to making a full-scale suit, this methodology can be an essential tool to investigate the performance of individual parts of the body. Thus, it will be easier to manufacture the aerodynamic prototype suit. The practical implementation of knowledge from this study can be applied not only in ski jumping and cycling but also other speed sports.
5. Acknowledgment
The author is highly grateful to Dr Firoz Alam, Prof. Aleksandar Subic, Prof. David
Mainwaring and Dr Margaret Tate of RMIT University for their guidance and assistance.
The author thanks Mrs Dorothy Forster for fabricating the fabric sleeves, ski jumping and
www.intechopen.com
Aerodynamic Design of Sports Garments
39
cycling suits and also thanks Mr Jordi Beneyto-Ferre for his active participation in the wind
tunnel testing. Author acknowledges the support from the School of Applied Sciences,
RMIT University for providing the articulated mannequin.
6. References
Brownlie, L. W. (1992). Aerodynamic Characteristics of Sports Apparel, PhD Thesis, University of British Columbia, Canada
Capelli, C.; Rosa, G.; Butti, F.; Ferreti, G., Veicsteinas, A. & Di Prampero, P. E. (1993). Energy cost and efficiency of riding aerodynamic bicycles, European Journal of Applied Physiology, Vol.67, pp. 144-149
Chowdhury, H.; Alam, F. & Mainwaring, D. (2011a). Aerodynamic study of ski jumping suits. Procedia Engineering, Vol. 13, pp. 376-381
Chowdhury, H.; Alam, F. & Mainwaring, D. (2011b). A full scale bicycle aerodynamics testing methodology. Procedia Engineering, Vol. 13, pp. 94-99
Chowdhury, H.; Alam, F. & Subic, A. (2010). Aerodynamic Performance Evaluation of Sports Textile. Procedia Engineering, Vol.2, N0.2, pp. 2517-2522, Elsevier, UK
Chowdhury, H.; Alam, F. & Subic, A. (2010). An Experimental Methodology for a Full Scale Bicycle Aerodynamics Study, In: Proceedings of the First International Conference on Mechanical, Industrial and Energy Engineering (ICMIEE2010), Paper MIE10-124, ISBN: 978-984-33-2300-2, Khulna, Bangladesh
Chowdhury, H.; Alam, F.; Mainwaring, D.; Beneyto-Ferre, J.; Forster, D.; Tate, M. & Subic, A. (2010). Experimental Evaluation of Ski Suit Performance, In: Proceedings of the 17th Australian Fluid Mechanics Conference (AFMC2010), Paper 173, ISBN: 978-0-86869-129-9, Auckland, New Zealand
Chowdhury, H.; Alam, F.; Mainwaring, D.; Subic, A.; Tate, M.; Forster D. & Beneyto-Ferre, J. (2009). Design and Methodology for Evaluating Aerodynamic Characteristics of Sports Textiles, Sports Technology, Vol.2, No.3-4, pp. 81-86, John Wiley and Sons Asia Pte Ltd.
Chowdhury, H.; Beneyto-Ferre, J.; Tate, M.; Alam, F.; Mainwaring, D.; Forster, D. & Subic, A. (2009). Effects of Textile and Garment Design on Aerodynamic Characteristics Applied to Cycling Apparel, In: The Impact of Technology on Sport III, Paper no.: P-131, ISBN: 978-1-921426-39-1, Hawaii, USA
Chowdhury, H.; Alam, F.; Mainwaring, D.; Subic, A.; Tate, M. & Forster, D. (2008). Aerodynamic Testing Methodology for Sports Garments, In: Proceedings of the 4th BSME-ASME International Conference on Thermal Engineering, Paper no.: AU-04, ISBN: 984-32-3815-X, Dhaka, Bangladesh
Di Prampero, P. E.; Cortili, G.; Mognoni, P. & Saibene, F. (1979). Equation of motion of a cyclist, Journal of Applied Physiology, Vol.47, pp. 201-206
Dias, T. & Delkumburewatte, G. B. (2008). Changing porosity of knitted structures by changing tightness, Fibers and Polymers, Vol.9, No.1, pp. 76-79
Grappe, F; Candau, R; Belli, A & Rouillon, J. D. (1997). Aerodynamic drag in field cycling with special references to the Obree’s position, Ergonomics, Vol.40, No.12, pp. 1299-1311
Hoerner, S. F. (1952). Aerodynamic Properties of Screens and Fabrics, Textile Research Journal, Vol.1, No.22, pp. 274-279
www.intechopen.com
Applied Aerodynamics
40
Kyle, C. R.; Brownlie, L. W.; Harber, E.; MacDonald, R. & Norstrom, M. (2004). The Nike Swift Spin Cycling Project: Reducing the Aerodynamic Drag of Bicycle Racing Clothing by Using Zoned Fabrics, In: The Engineering of Sport 5, Vol. 1, International Sports Engineering Association, UK
Lukes, R. A.; Chin, S. B. & Haake, S. J. (2005). The understanding and development of cycling aerodynamics, Sports Engineering, Vol.8, No.2, pp. 59-74
Meile, W.; Reisenberger, E.; Mayer, M.; Schmölzer, B; Müller, W. & Brenn, G. (2006). Aerodynamics of ski jumping: experiments and CFD simulations, Experiments in Fluids, Vol. 41, No.6, pp. 949–964
Moria, H.; Chowdhury, H.; Alam, F.; Subic A.; Smits, A. J.; Jassim, R. & Bajaba, N. S. (2010). Contribution of swimsuits to swimmer’s performance, Procedia Engineering, Vol.2, No.2, pp. 2505-2510, Elsevier, UK
Muller, W. (2008). Computer simulation of ski jumping based on wind tunnel data, Sports Aerodynamics, pp. 161-182
Müller, W. & Schmölzer, B. (2005). Individual Flight Styles in Ski Jumping: Results Obtained During Olympic Games Competitions, Journal of Biomechanics, Vol.38, No. 5, pp. 1055-1065
Oggiano, L.; Troynikov, O.; Konopov, I.; Subic, A. & Alam, F. (2009). Aerodynamic behaviour of single sport jersey fabrics with different roughness and cover factors, Sports Engineering, Vol.12, No.1, pp. 1-12
Schmölzer, B. & Müller, W. (2004). Individual flight styles in ski jumping: results obtained during Olympic Games competitions, Journal of biomechanics, Vol.38, pp. 1055-1065
Spencer, D. J. (2001). Knitting Technology: a comprehensive handbook and practical guide, Woodhead Publishing, Cambridge, England
www.intechopen.com
Applied AerodynamicsEdited by Dr. Jorge Colman Lerner
ISBN 978-953-51-0611-1Hard cover, 192 pagesPublisher InTechPublished online 11, May, 2012Published in print edition May, 2012
InTech ChinaUnit 405, Office Block, Hotel Equatorial Shanghai No.65, Yan An Road (West), Shanghai, 200040, China
Phone: +86-21-62489820 Fax: +86-21-62489821
Aerodynamics, from a modern point of view, is a branch of physics that study physical laws and theirapplications, regarding the displacement of a body into a fluid, such concept could be applied to any bodymoving in a fluid at rest or any fluid moving around a body at rest. This Book covers a small part of thenumerous cases of stationary and non stationary aerodynamics; wave generation and propagation; windenergy; flow control techniques and, also, sports aerodynamics. It's not an undergraduate text but is thought tobe useful for those teachers and/or researchers which work in the several branches of applied aerodynamicsand/or applied fluid dynamics, from experiments procedures to computational methods.
How to referenceIn order to correctly reference this scholarly work, feel free to copy and paste the following:
Harun Chowdhury (2012). Aerodynamic Design of Sports Garments, Applied Aerodynamics, Dr. Jorge ColmanLerner (Ed.), ISBN: 978-953-51-0611-1, InTech, Available from: http://www.intechopen.com/books/applied-aerodynamics/aerodynamic-design-of-sports-garments