December 2005 NASA/TM-2005-213790 Aeroelastic Deformation: Adaptation of Wind Tunnel Measurement Concepts to Full-Scale Vehicle Flight Testing Alpheus W. Burner Langley Research Center, Hampton, Virginia William A. Lokos Dryden Flight Research Center, Edwards, California Danny A. Barrows Langley Research Center, Hampton, Virginia https://ntrs.nasa.gov/search.jsp?R=20060002833 2020-03-29T14:03:26+00:00Z
Transcript
December 2005
NASA/TM-2005-213790
Aeroelastic Deformation: Adaptation of Wind Tunnel Measurement Concepts to Full-Scale Vehicle Flight Testing Alpheus W. Burner Langley Research Center, Hampton, Virginia
William A. Lokos Dryden Flight Research Center, Edwards, California
Danny A. Barrows Langley Research Center, Hampton, Virginia
Since its founding, NASA has been dedicated to the advancement of aeronautics and space science. The NASA Scientific and Technical Information (STI) Program Office plays a key part in helping NASA maintain this important role.
The NASA STI Program Office is operated by Langley Research Center, the lead center for NASA’s scientific and technical information. The NASA STI Program Office provides access to the NASA STI Database, the largest collection of aeronautical and space science STI in the world. The Program Office is also NASA’s institutional mechanism for disseminating the results of its research and development activities. These results are published by NASA in the NASA STI Report Series, which includes the following report types:
• TECHNICAL PUBLICATION. Reports of completed research or a major significant phase of research that present the results of NASA programs and include extensive data or theoretical analysis. Includes compilations of significant scientific and technical data and information deemed to be of continuing reference value. NASA counterpart of peer-reviewed formal professional papers, but having less stringent limitations on manuscript length and extent of graphic presentations.
• TECHNICAL MEMORANDUM. Scientific and technical findings that are preliminary or of specialized interest, e.g., quick release reports, working papers, and bibliographies that contain minimal annotation. Does not contain extensive analysis.
• CONTRACTOR REPORT. Scientific and technical findings by NASA-sponsored contractors and grantees.
• CONFERENCE PUBLICATION. Collected papers from scientific and technical conferences, symposia, seminars, or other meetings sponsored or co-sponsored by NASA.
• SPECIAL PUBLICATION. Scientific, technical, or historical information from NASA programs, projects, and missions, often concerned with subjects having substantial public interest.
• TECHNICAL TRANSLATION. English-
language translations of foreign scientific and technical material pertinent to NASA’s mission.
Specialized services that complement the STI Program Office’s diverse offerings include creating custom thesauri, building customized databases, organizing and publishing research results ... even providing videos.
For more information about the NASA STI Program Office, see the following:
• Access the NASA STI Program Home Page at http://www.sti.nasa.gov
at (301) 621-0134 • Phone the NASA STI Help Desk at
(301) 621-0390 • Write to:
NASA STI Help Desk NASA Center for AeroSpace Information 7121 Standard Drive Hanover, MD 21076-1320
National Aeronautics and Space Administration Langley Research Center Hampton, Virginia 23681-2199
December 2005
NASA/ TM-2005-213790
Aeroelastic Deformation: Adaptation of Wind Tunnel Measurement Concepts to Full-Scale Vehicle Flight Testing Alpheus W. Burner Langley Research Center, Hampton, Virginia
William A. Lokos Dryden Flight Research Center, Edwards, California
Danny A. Barrows Langley Research Center, Hampton, Virginia
Available from:
NASA Center for AeroSpace Information (CASI) National Technical Information Service (NTIS) 7121 Standard Drive 5285 Port Royal Road Hanover, MD 21076-1320 Springfield, VA 22161-2171 (301) 621-0390 (703) 605-6000
The use of trademarks or names of manufacturers in the report is for accurate reporting and does not constitute an official endorsement, either expressed or implied, of such products or manufacturers by the National Aeronautics and Space Administration.
1
Abstract The adaptation of a proven wind tunnel test technique, known as Videogrammetry, to flight testing of full-scale vehicles is presented. A description is presented of the technique used at NASA’s Dryden Flight Research Center for the measurement of the change in wing twist and deflection of an F/A-18 research aircraft as a function of both time and aerodynamic load. Requirements for in-flight measurements are compared and contrasted with those for wind tunnel testing. The methodology for the flight-testing technique and differences compared to wind tunnel testing are given. Measurement and operational comparisons to an older in-flight system known as the Flight Deflection Measurement System (FDMS) are presented.
Introduction Photogrammetry and image processing techniques (videogrammetry) have been used for the
measurement of wind tunnel aeroelastic deformations at five major NASA ground-based facilities at Langley Research Center and Ames Research Center [1]. Wind tunnel applications ranging from subsonic to supersonic include many types of models such as those used in the former Advanced Subsonic Technology (AST) and High Speed Research (HSR) programs. This technique, developed to meet the needs of production wind tunnel testing with minimal impact to productivity, is known as the videogrammetric model deformation (or VMD) technique. The technique uses single-camera, single-view photogrammetry coupled with image processing. The term single-view is used to distinguish between techniques employing a single-camera, multi-view configuration, during which a single camera is moved about a static object to record multiple images that can then be used in a simultaneous solution to determine spatial coordinates. The use of such a single-camera, multi-view configuration is the technique of choice in the photogrammetric community [2]. The single-camera, single-view technique utilized for this effort however, while not normally chosen for photogrammetric applications, has several advantages for wind tunnel testing (and for flight testing). These advantages include: (1) only one camera is needed, reducing space and viewport requirements in the wind tunnel or on the aircraft; (2) the base separation that would be required for multiple cameras (requiring additional mounting locations) is not a factor; and (3) the constrained coordinate that enables the single-view solution can usually be measured with more accuracy during pre-test or pre-flight than is possible with multi-camera photogrammetry during wind tunnel or flight testing.
In-flight measurements of aeroelastic deformations in the past have typically been costly, non-routine, and required significant setup and aircraft adaptations. Special light emitting diodes (LEDs) are generally required that must be installed on the aerodynamic surfaces of interest for a limited amount of testing [3-7] with large, specialized, high-cost, and older measurement systems, such as the electro-optical Flight Deflection Measurement System (FDMS) [3] or the commercially available Optotrak® measurement system from Northern Digital Corporation [7]. In addition, some aerodynamic surfaces, such as ailerons and leading edge slats, are very difficult to measure with the older systems due to the requirement for LEDs, wiring, and special mounts that protrude above the aerodynamic surface. A technique that does not require LED targets, is relatively inexpensive, requires less aircraft adaptations, and is more flexible to measurement needs is highly desirable for flight testing. Videogrammetry with existing video cameras or digital still cameras offers promise to meet these measurement requirements. This paper describes efforts toward adaptation of a videogrammetric method for aeroelastic deformation
2
measurements in-flight that does not require LEDs, is low cost, and may eventually be more robust, accurate, and adaptable to measurement needs than current in-flight measurement systems. Initial efforts investigating the use of videogrammetry for flight testing are presented in [8].
Comparing Wind Tunnel and Flight Testing
There are several notable differences between measuring wing and control surface deformation of a wind tunnel model compared with measuring wing and controls surface deformation on an aircraft in flight. For instance, the in-flight data camera would likely be mounted on the fuselage of the aircraft, thus the view presented to the data camera would be essentially the same throughout testing (except of course for any deformation or scale changes due to varying refractive index at different altitudes). In contrast, for wind tunnel measurements the camera must typically be mounted on the test section wall. Figure 1 compares the differences in camera geometry for wind tunnel measurements with a camera mounted on the test section wall and in-flight measurements with an onboard camera (which is shown as mounted on the fuselage).
During wind tunnel testing, the pitch range of the model must remain in the field-of-view so that the amount of the image plane occupied by the wing at any given pitch angle is reduced, which correspondingly reduces the accuracy of the measurements. A given target may also move significantly on the image plane due to pitch-sweep testing during wind tunnel testing, unlike the case for flight testing. In addition, the typical image plane motion during wind tunnel testing (due to the excursions in model pitch angle during a run) makes it more critical to determine and properly account for optical lens distortion than for flight testing, where the motion on the image plane is much smaller and confined to that produced by differential dynamics or the deformation itself. Unlike flight testing, wind tunnel testing requires the measurement of large angles because the local angles on the wing follow the model pitch angle which can change considerably relative to the fixed camera on the test section wall. Thus, it is necessary during wind tunnel testing to calibrate the optical measurement system in terms of model pitch angle with an onboard precision accelerometer under static test conditions in order to improve the measurement accuracy. Such additional calibrations may not be necessary for flight testing where the angular change relative to the camera is confined to that due to the aeroelastic deformation itself.
Wind tunnel measurements are further complicated by the need to accommodate and account for rigid body motion of the model due to sting bending induced by the overall aerodynamic loading on the model. The measurement of wing deformation during flight testing is closer to a differential measurement, can make better use of the available image area, and is affected less by rigid body motion because the camera is on the body (fuselage). Dynamics of the model can further exacerbate potential problems during wind tunnel testing. Dynamics may be less of an issue for in-flight testing in one respect because the camera moves with the fuselage, thus any dynamics common to the fuselage and wing would tend to cancel, unlike for wind tunnel testing.
Differences also occur with targeting. For most wind tunnel tests, retro-reflective tape targets are used to provide very high-contrast targets to greatly increase the chances of successful automated image processing. (A notable exception to this is the National Transonic Facility at Langley Research Center, where a special polished paint technique has been developed to reduce the potentially harmful aerodynamic effect of the thicker and rougher surface-finish tape targets.) An example of a high-contrast image from a wind tunnel test using the polished paint technique is
3
shown in figure 2. A typical video image of the left wing of an F/A-18 is shown in figure 3 for comparison. Images with retro-reflective tape targets are even higher contrast, such that often only the targets themselves are seen.
Another difference is that the wind tunnel model is typically viewed at an angle to the wing of about 30°, whereas for aircraft in flight, the data camera located on the fuselage would likely have a view angle to the wing closer to 10° or less. Because the light return from retro-reflective material drops significantly as the angle of incidence moves away from normal, the retro-effect for aircraft with a shallow angle of incidence would be reduced significantly. One way around this would be to place the targets on raised tabs to orient the tape targets toward the camera. However, the potential aerodynamic disturbance would then be equivalent to that now encountered with the protruding FDMS targets, which is undesirable. Another aspect of retro-reflective material that complicates their use for deformation measurements on aircraft in flight is the requirement for a light source near the camera. The space required for such a light source, along with its additional wiring, mounting, survivability, and operational concerns, limit the use of retro-reflective tape targets for in-flight testing. The use of natural features or passive targets that do not require additional wiring or special mounting is highly desirable for in-flight testing.
One major difference between wind tunnel and flight testing is the very nature of the tests themselves. It is common in wind tunnel testing to require that data be available at least within a few minutes after the completion of a run series. Thus, near real-time data processing and rapid final reduction are necessary for an effective and useful model deformation measurement system for a production wind tunnel. Flight testing, on the other hand, normally consists of an hour or so flight where, during the flight, there is usually no pressing need for near real-time deformation data. The requirements for data processing and final reduction for in-flight measurements of wing deformation might be better expressed as rapid, next-day delivery of reduced data. Also, the very nature of the unknowns in flight testing make it desirable to record images for post-flight analyses rather than the procedure of capturing images, performing image processing, recording the results of image processing, and overwriting the images, as is commonly done during more well-defined wind tunnel testing. The recording of images for post-test processing is especially important during early phases of technique development. In fact, during the early stages of our development of a wind tunnel model deformation measurement system, images were likewise recorded for post-run or post-test analyses in order to develop a databank of troublesome images for technique development and enhancement.
Finally, flight-hardened hardware is a major concern for any in-flight test technique. Flight hardware must be able to endure a variable and hostile environment and still continue to function. Ambient temperature can vary over a range of up to 150 °C or more. Low air pressure at higher altitudes may cause electrical circuits to arc. Structural vibrations can sometimes cause electrical or mechanical components to failure. Moisture, as well as jet fuel, can potentially harm flight instrumentation. In addition, flight systems must be able to run unattended.
F/A-18 Research Aircraft (Active Aeroelastic Wing)
The test bed subject of this study is the NASA Active Aeroelastic Wing (AAW) F/A-18 aircraft undergoing flight testing at the NASA Dryden Flight Research Center. The AAW effort is a joint program of the Air Force Research Laboratory (AFRL), NASA, and The Boeing Company. The program [9-10] started in 1996 with a goal to develop flight-validated, active aeroelastic wing technology design guidance suitable for use on future aircraft design programs.
4
The traditional roll control paradigm requires a torsionally stiff wing box structure. Rolling moment is expected to be produced exclusively through anti-symmetric control surface loads. Using this control approach, higher performance aircraft designs struggle to provide enough wing stiffness to produce the desired roll rates. At high free stream dynamic pressure flight conditions the wing box elastically twists enough to generate an opposing rolling moment of its own. The higher the dynamic pressure, the higher is the required stiffness. The structural design penalty for this added stiffness is either greater wing mold-line thickness or increased structural weight, or both. The goal of the AAW research program is to provide design guidance to allow lighter and thinner wing designs by using the wing box itself as a primary control surface intentionally driven by the wing control surfaces. This coupling of the aerodynamic loads with the structural elasticity can now be a design benefit under the AAW roll control paradigm.
To support this aeroelastic flight research the AAW aircraft, shown in figures 4 and 5, has added research flight control computers in addition to the standard computers so that alternative flight control laws may be tested. The wing structure has been modified to provide more torsional flexibility. This involved modifying the auxiliary (aft) wing box upper and lower cover panels. The drive mechanisms for the leading edge control surfaces were modified to allow independent actuation of the inboard and outboard leading edge control surfaces. Some control surface drive rates and ranges were also modified. New flight control laws were developed to exploit the desired aeroelastic behavior with the more capable control surface drive system. The research flight control laws produce roll control without the use of differential horizontal tail deflection.
Considerable instrumentation has been added to the aircraft including strain gages, accelerometers, surface air pressure sensors, control surface position sensors, and in-flight deflection measurement instrumentation. The AAW F/A-18 project envisioned the application of in-flight structural deflection measurement from its earliest formation. Provisions were designed in the test aircraft to accommodate the Flight Deflection Measurement System (FDMS). This included a dorsally mounted receiver pod with window, shown in figure 6, sixteen infrared LED targets on the upper left-hand wing surface with lead wires to a target driver box, a control unit box, power supplies, data telemetry interface circuit, and a cockpit-mounted on/off switch. Image data for this research paper were acquired from a flight-qualified video camera mounted just aft of the FDMS Pod, which looks out over the left hand wing. A planform of the aircraft showing the locations of the video camera, FDMS receivers, and FDMS targets (indicated with small dots) is shown in figure 7. A digital still camera is located between the FDMS receivers and video camera. As the FDMS installation was being designed, additional provisions were built in to support a developmental deflection measurement system. These provisions include additional space in the FDMS receiver pod and a longer window. Additionally, a pod heater/cooler was provided. These features make the AAW aircraft an ideal test-bed for the flight testing of new deflection measurement approaches.
Data Reduction Procedures
Overview
One of the long-term goals of this effort is to develop a test technique able to provide next-day, continuous, time-resolved aeroelastic results from takeoff to landing [8]. It is envisioned that an image sequence of the entire flight will provide the raw data from which time-resolved
5
deflection can be extracted. As mentioned earlier, a variation of the videogrammetric model deformation measurement technique used in wind tunnel testing offers promise for such in-flight measurements. Central to the extraction of meaningful image data that can be transformed to deflection is the applicability of automated image processing that is robust and requires little user intervention. In order to apply single-camera, single-view photogrammetry, which is the basis of the measurement, the pointing angles and location of the data camera must be determined in the aircraft coordinate system. This is accomplished with a well-known photogrammetric procedure known as space resection with assumed or known values of several camera parameters. Once all camera parameters and the pointing angles and location are known, two of three coordinates (with the third coordinate known) can then be computed from a single-camera view. To determine deflection, the vertical coordinates at a reference condition are subtracted from the vertical coordinates at the flight condition of interest. Angles are determined from the slope of computed coordinates in chordwise planes at the various spanwise locations where targets or suitable image patches (natural features) exist. Local angles at various span stations at the reference condition are subtracted from the flight condition of interest to yield the change in angle (induced twist) due to aeroelastic loading. An alternative approach to single-camera, single-view photogrammetry (requiring resection) is the determination of scale factors for each target (or image patch) location. This is essentially the approach used for the FDMS and, depending on the availability of targets with known 3D coordinates, may be desirable for the videogrammetric technique in some situations.
Two recording approaches are being investigated. The first approach for image recording uses a standard resolution flight-hardened video camera for recording. This camera, normally used for surveillance of the left wing, provided the image sequences for the results reported here. These video data sets expedite test technique development with real-world flight-test data for evaluation and offer a minimum impact data recording. The second approach uses a high-resolution (3 Megapixel) digital still camera for selected data samples. The digital still camera had to be mounted upside down in order to fit into the camera pod. The pilot triggers the digital still camera from the control stick to acquire a short sequence of images. The camera aperture is fixed at a mid-range f-number to provide reasonable depth of field. The camera exposure time is automatically adjusted internally by the camera to provide reasonable contrast images, even with varying wing illumination. A USB interface cable running from the camera pod to the cockpit enables the images to be downloaded on the ground (while clearing the memory card) without having to open the camera pod (which can be very time-consuming). Results from the digital still camera will be evaluated and compared to results from the over-the-wing video camera and the FDMS during the 2nd phase of flight testing which began in December 2004.
Determining Pointing Angles and Location of Data Camera
The first task in the data reduction procedure is to determine the location and pointing angles of the data camera in the aircraft coordinate system. This can be accomplished photogrammetrically with a process known as space resection, or simply resection. In resection, 2D image plane coordinates are mathematically compared with their known 3D object space coordinates (which defines the coordinate system). Nonlinear least squares is used to extract estimates of the Euler angles ω, ϕ, κ (defining the pointing angles of the data camera) and the location of the effective perspective center of the camera Xc, Yc, Zc as well as precision estimates of these computed quantities. The basic equations used for this computation are referred to as the collinearity equations [1]. The collinearity equations (1) are the most fundamental and important data reduction equations in photogrammetry. They express the ideal imaging relationship that the object point, perspective center, and image point should be on a straight line. In equations (1) below, the image coordinates x, y have been corrected for optical lens distortion [11] (or the
6
distortion is negligible). Unlike wind tunnel testing, the image motion of targets (or a given image patch) is small compared with wind tunnel testing; therefore, lens distortion has much less effect on the results and is ignored here. The photogrammetric principal point, which can be thought of as the point of symmetry for imaging, is represented by xp, yp, the principal distance is represented by c, and the object space location of each target is represented by X, Y, Z. The principal distance is the perpendicular image distance from the rear perspective center to the image plane and would ideally be equal to the effective focal length if the lens were focused on infinity. If the lens is focused on a near object (as for the examples presented here) the principal distance will be a little longer than the effective focal length and can be estimated from the well-known Gaussian object-image relationship among object distance, image distance, and effective focal length.
( ) ( ) ( )( ) ( ) ( )⎥⎦
⎤⎢⎣
⎡−+−+−−+−+−
−=ccc
cccp ZZmYYmXXm
ZZmYYmXXmcxx
333231
131211
(1)
( ) ( ) ( )( ) ( ) ( )⎥⎦
⎤⎢⎣
⎡−+−+−−+−+−
−=ccc
cccp ZZmYYmXXm
ZZmYYmXXmcyy333231
232221
The Euler angles ω, φ, κ, which orient the image plane to the coordinate system of interest about the X, Y, Z axes, respectively, are used to compute the nine elements of the rotation matrix given by equation (2).
For the efforts presented here, the following assumptions were made. The principal point, xp, yp, was approximated as a fixed location at the center of the digital image extracted from the DVD recordings at a resolution of 704 horizontal pixels by 480 vertical pixels. In pixel space, the coordinates for xp, yp were taken to be 352, 240, which during the conversion from pixel space to millimeters on the image plane corresponded to a value of xp, yp = (0, 0). The principal distance was estimated to be 16.08 mm based on an assumed focus toward the outboard portion of the wing and an effective focal length of 16 mm. The results are only weakly dependent on the actual value of the principal distance used due to the differential nature of the computations to establish the difference in Z (or in angle) from a given measurement condition to another. It is common for wind tunnel testing to perform a lens calibration to determine principal distance, principal point, and lens distortion (both radial and asymmetric) [11]. However, for flight testing, motion of targets on the image plane is confined to localized regions (in fact, inboard image areas are effectively stationary to noise level), and additional lens calibration may not be necessary. A sensitivity analysis is suggested to determine the effects of the various lens calibration coefficients on the results in order to ascertain the value of additional lens calibration for a particular project.
With the principal distance and principal point assumed, and known X, Y, Z associated with each target or image patch location, the remaining unknowns in equations (1), namely ω, φ, κ and Xc, Yc, Zc, are then solved for with an iterative nonlinear least-squares solution, which requires initial start values. For the examples presented below, the FDMS targets were used as reference with locations that had been measured with a precision theodolite before flight testing began. An image from level flight was used to establish the approximate pointing angles and location of the video camera. The image locations were determined manually in MATLAB® by setting a cursor at each target location on the digital image of interest. The pixel coordinates (with the origin to the upper left of the image), xpix, ypix, were converted to units of millimeters, xmm, ymm, (centered at the middle of the image plane) with the following equations:
xmm = ( xpix − xo) Sh
ymm = − ( ypix − yo) Sv (3)
where xo, yo locate the approximated principal point in pixel space (352, 240), and Sh and Sv are the effective horizontal and vertical pixel spacings of the digital imagery. The effective pixel spacings Sh and Sv were adjusted from repeated photogrammetric resections until the computed location of the video camera from resection was in reasonable agreement with its assumed location (to within a tolerance of several centimeters). An additional constraint that Sh = (639/703) Sv was initially applied to account for the digital conversion at 704 × 480 instead of the more common square pixel format of 640 × 480. The horizontal pixel spacing was further adjusted to minimize image plane resection residuals to yield a final estimate for Sh, Sv of 0.02484, 0.028 mm. Because differential measurements are being made from image coordinates that differ little from condition to condition, the exact value of the horizontal and vertical pixel spacings is not as critical as for multi-camera photogrammetric solutions or single-camera, single-view solutions where there is relatively large motion on the image plane (such as that which occurs during wind tunnel testing).
The collinearity equations (1) can be recast in linear form as:
a1X + a2Y + a3Z = a1X c + a2Yc + a3Zc
a4 X + a5Y + a6Z = a4 Xc + a5Yc + a6Zc (4)
where,
8
( )( )( )( )( )( ) 23336
21315
22324
13333
11312
12321
mcmyya
mcmyya
mcmyya
mcmxxa
mcmxxa
mcmxxa
p
p
p
p
p
p
+−=
+−=
+−=
+−=
+−=
+−=
(5)
If two or more cameras image a single point and a1 through a6 (containing coefficients xp, yp, c, ω, φ, κ) and Xc, Yc, Zc are known, then the spatial coordinates X, Y, Z can be determined with linear least squares as 4 equations in 3 unknowns. This is the basis of photogrammetric intersection, or triangulation. If one of the spatial coordinates is known, such as the semispan location of image points (X), then a single-camera image of a point results in two equations in two unknowns. With X known, Y (fuselage station) and Z (vertical) can be found by Gaussian elimination or with the following algebraic solution:
Y =Yc +X − X c( ) a2a6 −a5a3( )
a4a3 − a1a6( )
Z = Zc −Y −Yc( )a1 + X − Xc( )a2
a3
(6)
The primary advantages of this single-camera, single-view technique are: (1) only one camera is needed, reducing space and viewport requirements on the aircraft; (2) the base separation needed for multiple cameras (and requiring additional mounting locations) is not a factor; and (3) the constrained coordinate necessary for a single-view solution can usually be measured with more accuracy pre-test or pre-flight than is possible with multi-view photogrammetry during flight testing. When comparing multi-camera with single-camera techniques, it should be noted that variance in the photogrammetrically computed X-coordinate (and Y) of a multi-camera measurement will lead to variance in the more critical Z-values. However, with the single-camera, single-view technique X-values are determined to greater precision with theodolites prior to testing and, in most cases, will propagate less error into Z-coordinates. The bias errors in Y and Z due to error in X tend to cancel upon the subtraction that is inherent in differential measurements (runway-to-flight, level-flight-to-maneuver, etc.). Additional uncertainty considerations for the technique when used for wind tunnel testing, including the effect of changes in the known semispan coordinate X due to bending, are addressed in reference [11] (where the known semispan coordinate is represented as Y instead of X, and X and Z are solved for instead of Y and Z as shown here).
Once the Y and Z coordinates are computed for a given semispan location X, a slope angle can be computed in the Y-Z plane by either least squares for multiple image coordinates, or directly when there are only two targets per semispan. This angle, designated as the videogrammetric angle θη, is given at each normalized semispan location η by:
θη = tan−1 ΔZη
ΔYη (7)
Thus, the data extracted from the flight images would consist of angles at each semispan station (if more than one target per semispan) and Z-deflection values for each target or image
9
patch. The reference condition (e.g., runway or level flight) Z-values or angles are then subtracted from the condition of interest to determine the change in deflection or angle (induced twist) from the reference to that condition.
Image Processing and Targeting Considerations
In order to extract useful spatial information from a digital image in a timely manner, some variation of image processing is needed. The basic methods under consideration are location of discrete targets or target-like features, edge detection, and digital image correlation of natural features. Only results from the first 2 methods are presented here. Subpixel digital image correlation, although not presented here, offers perhaps the best potential for future efforts since its use may obviate the need for any targets to be applied to the wing. In addition, nearly global coverage of the wing may be possible using natural features. It is expected that for regions of the wing where natural features are nondescript, tape or painted targets may be necessary to obtain data in those regions, even when using image correlation.
For the resection effort outlined above, and for the examples of FDMS target deflection, it was simplest and most straightforward to manually select the image coordinates that correspond to the FDMS target housing locations [8]. Efforts to extract the image coordinates with binarization, segmentation, and centroiding were only marginally successful due to the very low contrast and low resolution of the video images. In addition, the images have enough background clutter surrounding a given target location to make the application of automated image processing difficult. The contrast of the target housings also varies drastically with time, sometimes actually switching sign, depending on the location of the Sun with respect to the wing. Given the mostly white nature of the wing, it is expected that the best chance of success with automated image processing would occur with flat-black targets of sufficient size to cover four or five pixels in image space in the horizontal and vertical directions. Black tape may be a convenient and effective means to apply targeting to the wing in the future. Due to the extreme foreshortening of the view caused by the low inclination angle of the camera to the wing of around 10°, it will be desirable to use elongated targets with an aspect ratio of around four or so with the long axis pointing toward the camera.
Detection of straight edges at known semispan locations was slightly more successful in terms of automation and data quality. Edge detection was found to partially work on the upper edge of the launcher rail located at the wing tip. Edge detection is illustrated in figure 8. In order to extract the proper edge, MATLAB® code was developed that isolated the edge detector output to a region surrounding the launcher rail. The code also tracked the potential edges over an angular range expected to include the desired edge. For figure 8 the first selection of the edge data is highlighted in red. The data in red are then passed through a filter that rejects data outside of a set fraction or number of standard deviations of the linear least squares computed angle in pixel space and over a range of angles. The final filtered edge data from which the angle computations are made are indicated in green in figure 8. With this method and operator viewing of the overlaid edges on each image, data segments of about 11 seconds and 31 seconds were analyzed from early parameter identification flights. For the 11-second data record the aircraft passed from level flight through a low load maneuver and then returned to level flight. The 31-second maneuver was a high load 5-G slow wind-up turn for which FDMS data were also available for comparison.
10
Examples of In-Flight Measurements
Spanwise Wing Deflection Due to Aerodynamic Loading
Three hundred sixty-one individual digital images at a resolution of 704 × 480 (bitmap color RGB format) were extracted from a DVD image sequence recorded from a flight-hardened video-monitoring camera that views the left wing of the AAW F/A-18 research aircraft [8]. Thirty-one of the images were from a 1-second time history while the aircraft was on the runway. Three hundred thirty of the images covered the aircraft from level flight (M = 0.95, q = 750 psf, altitude = 15,000 ft) through a 90° bank-and-return maneuver over a time period of 11 seconds. One image each from the runway, level flight, and at the peak of the maneuver was selected for initial measurements. Because some of the FDMS target housings, especially outboard toward the trailing edge of the wing, were barely distinguishable from the background, the image locations of the targets for the three images were manually selected within MATLAB®. The red, green, and blue components of each digital image could be analyzed separately. The red component was found to have highest contrast for most of the images and was used for further analyses. The estimated precision of manual image coordinate location is at best a pixel or so whereas centroiding of high-contrast targets with proper background removal can yield a precision of 0.01 pixel (one standard deviation). The relatively poor precision of the manual image coordinate selection accounts for the large scatter in the results presented below. Larger, higher contrast, better defined targets would allow for automated image processing, such as centroiding, and lead to much less data scatter.
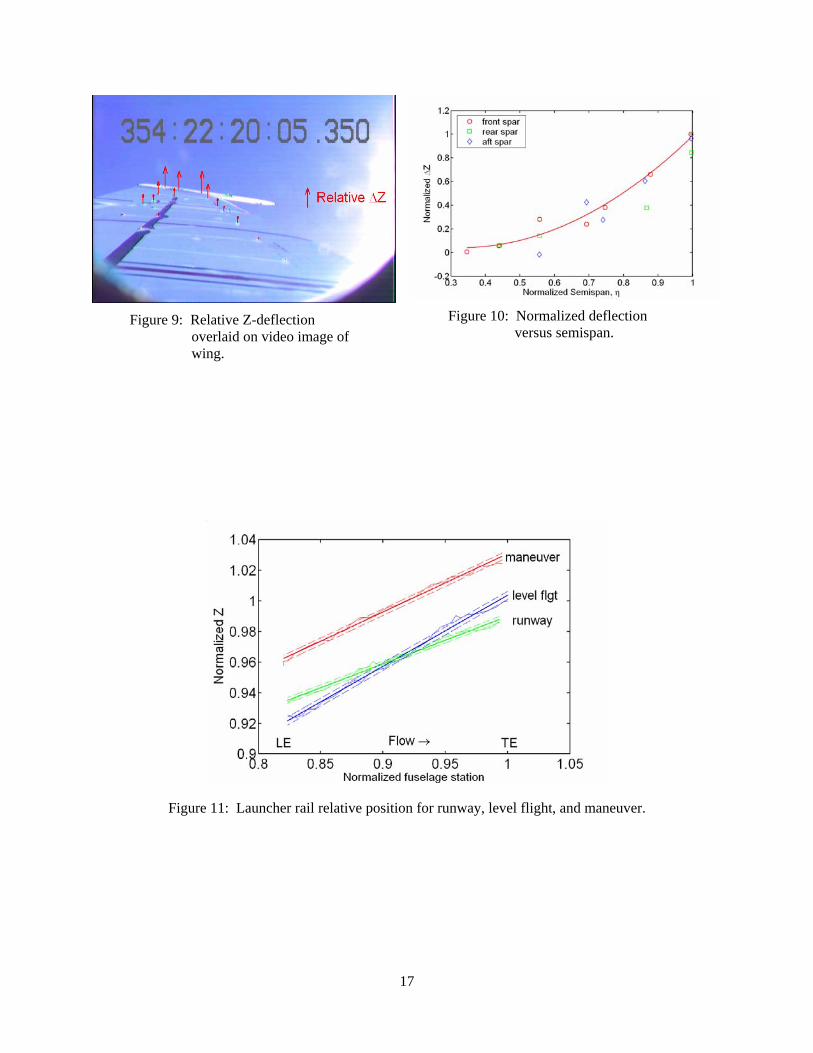
Resection on the level flight image was used to establish the pointing angles and location of the camera in the aircraft coordinate system necessary for the single-camera, single-view solution. The semispan locations (X-coordinate) of each FDMS target were used to compute Y (fuselage station) and Z. The error in these pointing angles and location of the data camera due to resection are not as critical as in some photogrammetric applications. For this application, the image coordinates change very little from condition to condition so that bias errors in the computation of Y- and Z-coordinates from equations (4.6) tend to cancel when the reference condition is subtracted. Figure 9 shows the relative Z-deflection at locations near the 16 FDMS targets from a level flight condition to a maneuver [8]. The computed Z-values of the level flight image were subtracted from the maneuver image to arrive at the ΔZ-values. For figure 9, the deflection represented by the arrows does not have perspective correction. In other words, the amount of deflection indicated by the arrows is independent of where on the image the arrows are located. The most inboard targets exhibit very little deflection, as expected. The deflection increases as one moves outboard toward the wing tip. The housings nearest the leading edge and closest to the front wing spar had higher contrast, with corresponding better precision than the rest of the housings. The corresponding normalized (to maximum deflection) ΔZ is plotted in figure 10 versus normalized semispan η. The solid line in figure 10 is a second-order polynomial fit to the seven higher contrast targets nearest the leading edge, indicated by circles, which lie along the front wing spar. The midchord row targets (near the rear spar) are indicated with squares and the targets nearest the trailing edge (aft spar) are indicated with diamonds. Although the scatter in these data is relatively large, it does indicate the correct trend and illustrates the potential of useful measurements given low-contrast non-ideal targets, even with low-resolution video. It is estimated that an improvement approaching a factor of 10 could be achieved in data precision with larger, better defined, high-contrast targets, even with relatively low-resolution video recording.
11
Change in Twist at Wing Tip Due to Aerodynamic Loading
Plots of the wing tip deflection while on the runway, in level flight, and at maneuver (corresponding to manual image plane measurements on the corresponding three images) are shown in figure 11 [8]. Airflow direction is from left to right. The solid lines are first-order linear least-squares fits to each Y, Z data set for each of the three digital images. The dotted lines are ±1 standard deviation of the polynomial fits. The characteristic negatively induced wing twist due to aerodynamic loading is evident upon comparing the runway data with level flight data. Very little vertical deflection at the wing tip is noted when comparing runway with level flight data. The main effect of the maneuver is upward deflection of the wing tip and a slight increase in wing twist at the tip. The relatively stable image locations (and corresponding stable spatial object locations) of the most inboard targets give credibility that the nature of the wing tip deformation is effectively depicted in figure 11 rather than camera movement, which would have caused image plane motion of the most inboard targets as well.
In order to assess the precision of angle and deflection measurements, pixel coordinates were determined with image processing of the top edge of the launcher rail and transformed to spatial coordinates for 31 images of the wing (while taxiing on the runway over a 1-second period). Due to the relatively stable wing and background while taxiing, this data set serves as an indicator of close to best-case angular and deflection measurements over a short time period for this relatively low-contrast video resolution data set. For the runway 1-second data reference set the standard deviation of the measured angles was 0.020°. Note also that the standard deviations of the linear least-squares fits used to determine the slope angle in Y, Z spaces also had a typical value of 0.02°. The mean angle from this 31-sample set that was subtracted out as reference for the following data thus has a standard deviation of about 0.004° (0.02/sqrt(31)). The standard deviation of the Z-measurements at midchord was 0.032 in. with a corresponding standard deviation of the mean Z-value used for reference of 0.006°. Background clutter (clouds, etc.), the location of the Sun relative to the wing, and poor contrast in general will cause these best-case values to worsen considerably.
Edge detection image processing was used to record the change in twist and deflection at the wing tip (top edge of the launcher rail) as a function of time [8]. The normalized change in wing tip twist as a function of time from level flight through maneuver and back to level flight is shown in figure 12 for the 11-sec data record. The data for this plot (and figure 13 as well) were obtained in a piecewise fashion because no single edge detector with default input parameter worked well for the entire time sequence. Although complete automated image processing was not achieved for the entire time sequence, the piecewise reduction time history is encouraging for future development efforts. Figure 13 shows the corresponding change in Z at the midpoint of the tip chord for the same time sequence as figure 12. The heavy lines in both figures 12 and 13 show a five-sample moving average used to smooth the data. The lines plotted near zero in each figure show the relative precision (two times the standard deviation) of each linear fit used to create the plots versus time. The relative precision is noticeably worse for images with background clutter and poor contrast. It can be noted from figure 12 that, at the end of the maneuver, the wing tip twist did not return to its pre-maneuver value. This start-to-finish difference is several times as large as the relevant data uncertainty levels and therefore indicates that the wing took a “set” during the maneuver. It is known that the F/A-18 wing does this. When the AAW wing was load tested to quantify its torsional stiffness, as reported in reference 12, the wing’s structural hysteresis was noted. This hysteresis is due to the aggregate effect of many mechanically fastened joints, each with fitting tolerance and friction. That this effect is not apparent in figure 13 is attributed to the fact that the vertical displacement was measured for a point near the wing’s elastic axis.
12
Comparison of Videogrammetric and FDMS Deflection Data
A 5-G slow wind-up turn (M = 0.85, q = 600 psf, altitude = 15,000 ft) during one of the early parameter identification runs was selected for comparison of video and FDMS deflection data. A total of 930 digital video images over a time of 31-seconds were analyzed. The top edge of the launcher rail was used as a contrasting edge to compute the change in deflection from the start of the wind-up turn. The launcher rail edge data were interpolated at the chordwise stations corresponding to wingtip FDMS targets labeled 13, 14 and 15 for comparisons. The videogrammetric data as a function of acceleration in G’s is plotted in figure 14 for the 3 interpolated chordwise stations corresponding to the 3 FDMS target locations. The differences between the video and FDMS deflection data are presented in figure 15. Most of the data scatter seen in figure 15 is due to the videogrammetric data which has not been filtered. The separation noted in figure 15 of the 3 chordwise stations between accelerations of 3.1 and 4.2 G’s is likely due to a troublesome background that caused an error in the apparent angle of the launcher rail edge due to non-robust image processing. The mean and standard deviation of differences between the video and FDMS deflection data over the 5-G slow wind-up turn are shown in Table 1 for the 3 FDMS target locations labeled 13, 14, and 15. The units of Table 1 are in cm.
Future Work
In addition to a comparison of results using a low resolution video camera versus a higher resolution digital still camera, future work includes the comparison of single image calibration using photogrammetric space resection with measuring rod calibration at finite points on the wing to assess the relative merits of each calibration method. The measuring rod consists of high contrast edges (or targets) at known locations in concert with a bubble level to ensure that the rod is vertical when placed at various locations on the wing. An example of a measuring rod calibration image is presented in figure 16. For such a calibration no photogrammetric information is required. The transformation from pixels to vertical deflection is determined at each point where the measuring rod is located. A response surface plot (2nd order may be sufficient) over the wing based on the individual calibration points can then be used to interpolate the scale factor at intermediate locations on the wing where calibration images were not recorded. While the measuring rod technique has the advantage of a direct calibration from pixels to vertical height, it does require a number of images and takes more time to complete.
Enhanced targeting on the wing will also be assessed during the next phase of flight testing. Painted black diamond targets (figure 17) will be used during the next phase of fight tests in order to determine the improvement in image processing automation and data quality with such larger higher-contrast targets. The black diamonds were sized to yield adequate pixel coverage for the low resolution over-the-wing video camera. The black diamonds are elongated in the direction of the camera look-angle to partially compensate for the fore-shortening that occurs with the camera at such a steep viewing angle. The black diamond targets are placed at approximately the same wing locations as the FDMS LED targets to facilitate comparisons with that measurement system. Black diamond targets were also placed on the aileron (where FDMS targets could not be placed) to enable the measurement of aileron deformation during next phase of flight testing. Future efforts will also involve the evaluation of digital image correlation. Subpixel digital image correlation offers perhaps the best potential for future efforts since correlation of natural features may obviate the need for any targets to be applied to the wing. In addition, nearly global coverage of the wing may be possible using natural features. It is expected that for regions of the
13
wing where natural features are nondescript, tape or painted targets may be necessary to supplement image correlation.
Conclusions
The adaptation of the single-camera, single-view photogrammetric method widely used in NASA wind tunnels is shown to be useful for the measurement of static and dynamic aeroelastic wing deformation of aircraft in flight. The primary advantages of the single-camera, single-view technique are: (1) only one camera is needed, reducing space and viewport requirements on the aircraft, (2) the base separation of multiple cameras (with additional mounting locations required) is not a factor, and (3) the constrained coordinate necessary for a single-view solution can usually be measured with more accuracy pre-test or pre-flight than is possible with multi-camera photogrammetry during in-flight data taking. Actual in-flight measurements of the AAW F/A-18 research aircraft illustrate that useful measurements are possible from a standard resolution video camera with low-resolution targets. An improvement in precision by a factor of 10 is anticipated for high-contrast targets. Time-history examples of changes in induced twist angle and deflection show the improvement in measurement precision possible with image processing of lines or edges located at various semispan stations. Although complete automated image processing was not achieved for the entire time sequences presented, the results of the piecewise reduction time history and the agreement with FDMS results are encouraging for future developmental efforts.
Acknowledgments
The support and technical assistance of team members of the Active Aeroelastic Wing program, the Aerostructures Branch at Dryden Flight Research Center, and the Advanced Sensing & Optical Measurement Branch and the Aeroelasticity Branch at Langley Research Center are acknowledged. The innovation of James Mills, Adam Matuszeski, Dallas Quantz, and other members of the AAW F/A-18 ground crew in adapting and interfacing a digital still camera within the constraints of flight testing are especially acknowledged.
References
[1] A. W. Burner and Tianshu Liu, “Videogrammetric Model Deformation Measurement Technique,” J. of Aircr., 38, 4, pp. 745-754, July-August 2001.
[2] E. M. Mikhail, J. S. Bethel, and J. C. McGlone, Introduction to Modern Photogrammetry, chapt. 9, John Wiley & Sons, New York, 2001.
[3] V. Michael DeAngelis and Robert Fodale, “Electro-Optical Flight Deflection Measurement System,” Society of Flight Test Engineers 18th Annual Symposium Proceedings, SFTE Technical Paper 22, pp. 1-14, Sept. 1987.
[4] Kenneth L. Bonnema and William A. Lokos, “AFTI/F-111 Mission Adaptive Wing Flight Test Instrumentation Overview,” ISA 35th International Instrumentation Symposium, Paper #89-0084, pp. 809-839, May 1989.
14
[5] William A. Lokos, “Predicted and Measured In-Flight Wing Deflections of a Forward-Swept-Wing Aircraft,” NASA TM-4245, 21 pp., Jan. 1990.
[6] William A. Lokos, Catherine M. Bahm, and Robert A. Heinle, “Determination of Stores Pointing Error Due to Wing Flexibility Under Flight Load,” AIAA 7th Biennial Flight Test Conference, AIAA 94-2112, 20 pp., June 1994.
[7] P. Williard, J. D. Hardin, and J. H. Whitehead, “Determination of In-Flight Aeroelastic Deformation of a Transport High-Lift System Using Optical Position Measurement Technology,” 1st AIAA Aircraft Engineering Technology and Operations Congress, Los Angles, CA, Sept. 19-21, 1995.
[8] Burner, A. W., Lokos, W. A., Barrows, D. A., “In-Flight Aeroelastic Measurement Technique Development,” SPIE’s 48th Annual Meeting – International Symposium on Optical Engineering and Technology, San Diego, August 2-8, 2003.
[9] E. Pendleton, K. E. Griffin, M. Kehoe, and B. Perry, “A Flight Research Program for Active Aeroelastic Wing Technology,” AIAA Paper No. 96-1574, 37th AIAA Structures, Structural Dynamics, and Materials Conference, Salt Lake City, Utah, pp. 2263-2273, April 1996.
[10] E. Pendleton, D. Bessette, P. Field, G. Miller, and K. Griffin, “The Active Aeroelastic Wing Flight Research Program, Technical Program & Model Analytical Development,” J. of Aircr., 37, 4, pp. 554-561, July-August 2000.
[11] A. W. Burner, Tianshu Liu, and Richard DeLoach, “Uncertainty of Videogrammetric Techniques Used for Aerodynamic Testing,” 22nd AIAA Aerodynamic Measurement Technology and Ground Testing Conference, St. Louis, Missouri, AIAA 2002-2794, 20 pp., June 2002.
[12] William A. Lokos, Candida D. Olney, Natalie D. Crawford, Rick Stauf, and Eric Y. Reichenbach, “Wing Torsional Stiffness Tests of the Active Aeroelastic Wing F/A-18 Airplane,” AIAA-2002-1333, 9 pp., Jan. 2002.
15
Figure 1: Comparing wind tunnel and in-flight geometries.
Figure 2: Relatively high-contrast
image from wind tunnel test.
Figure 3: Video image of F/A-18
left wing.
16
Figure 4: F/A-18 AAW research aircraft.
Figure 5: F/A-18 AAW research aircraft.
Figure 6: Camera locations on F/A-18.
Figure 7: Planform of F/A-18 showing FDMS target layout (LEDs) and receiver and video camera locations.
Figure 8: Detection of upper edge of launcher rail with image processing
FDMS LEDs
FDMS receivers
video camera
camera pod
FDMS & digital cam
video cam
17
Figure 9: Relative Z-deflection
overlaid on video image of wing.
Figure 10: Normalized deflection
versus semispan.
Figure 11: Launcher rail relative position for runway, level flight, and maneuver.
18
Figure 12: Normalized change in
launcher rail angle versus time during maneuver.
Figure 13: Normalized change in Z of
launcher rail versus time during maneuver.
Figure 14: Videogrammetric
normalized ΔZ versus acceleration in G’s.
Figure 15: Difference between
videogrammetric and FDMS data (cm).
19
Figure 16: Measuring rod calibration
image.
Figure 17: Black diamond targets on
AAW F/A-18.
Z13 Z14 Z15
mean 0.22 0.04 -0.17
stnd dev 0.61 0.54 0.59
Table 1: Mean and standard deviation of the differences between the videogrammetric and the FDMS Z-deflections (cm).
REPORT DOCUMENTATION PAGE Form ApprovedOMB No. 0704-0188
2. REPORT TYPE Technical Memorandum
4. TITLE AND SUBTITLE
Aeroelastic Deformation: Adaptation of Wind Tunnel MeasurementConcepts to Full-Scale Vehicle Flight Testing
5a. CONTRACT NUMBER
6. AUTHOR(S)
Burner, Alpheus W.; Lokos, William A.; and Barrows, Danny A.
7. PERFORMING ORGANIZATION NAME(S) AND ADDRESS(ES)
NASA Langley Research Center Dryden Flight Research CenterHampton, VA 23681-2199 Edwards California 93523-0273
9. SPONSORING/MONITORING AGENCY NAME(S) AND ADDRESS(ES)
National Aeronautics and Space AdministrationWashington, DC 20546-0001
8. PERFORMING ORGANIZATION REPORT NUMBER
L-19151
10. SPONSOR/MONITOR'S ACRONYM(S)
NASA
13. SUPPLEMENTARY NOTESBurner and Barrows: Langley Research Center, Hampton, VA; Lokos: Dryden Flight Research Center, Edwards, CAAn electronic version can be found at http://ntrs.nasa.gov
12. DISTRIBUTION/AVAILABILITY STATEMENTUnclassified - UnlimitedSubject Category 02Availability: NASA CASI (301) 621-0390
The adaptation of a proven wind tunnel test technique, known as Videogrammetry, to flight testing of full-scale vehicles ispresented. A description is presented of the technique used at NASA's Dryden Flight Research Center for the measurement ofthe change in wing twist and deflection of an F/A-18 research aircraft as a function of both time and aerodynamic load.Requirements for in-flight measurements are compared and contrasted with those for wind tunnel testing. The methodologyfor the flight-testing technique and differences compared to wind tunnel testing are given. Measurement and operationalcomparisons to an older in-flight system known as the Flight Deflection Measurement System (FDMS) are presented.
Prescribed by ANSI Std. Z39.18Standard Form 298 (Rev. 8-98)
3. DATES COVERED (From - To)2004-2005
5b. GRANT NUMBER
5c. PROGRAM ELEMENT NUMBER
5d. PROJECT NUMBER
5e. TASK NUMBER
5f. WORK UNIT NUMBER
23-762-55-MQ
11. SPONSOR/MONITOR'S REPORT NUMBER(S)
NASA/TM-2005-213790
16. SECURITY CLASSIFICATION OF:
The public reporting burden for this collection of information is estimated to average 1 hour per response, including the time for reviewing instructions, searching existing data sources, gathering and maintaining the data needed, and completing and reviewing the collection of information. Send comments regarding this burden estimate or any other aspect of this collection of information, including suggestions for reducing this burden, to Department of Defense, Washington Headquarters Services, Directorate for Information Operations and Reports (0704-0188), 1215 Jefferson Davis Highway, Suite 1204, Arlington, VA 22202-4302. Respondents should be aware that notwithstanding any other provision of law, no person shall be subject to any penalty for failing to comply with a collection of information if it does not display a currently valid OMB control number.PLEASE DO NOT RETURN YOUR FORM TO THE ABOVE ADDRESS.


![Global Subsonic and Subsonic-Sonic Flows through Infinitely … · 2018. 11. 1. · arXiv:0907.3274v1 [math.AP] 19 Jul 2009 Global Subsonic and Subsonic-Sonic Flows through Infinitely](https://static.documents.pub/doc/80x56/60cc91b2435c55467c1b4ed5/global-subsonic-and-subsonic-sonic-flows-through-ininitely-2018-11-1-arxiv09073274v1.jpg)


