22
Aerosol and chemical transport in tropical convection ACTIVE
| Date post: | 22-Dec-2015 |
| Category: |
Documents |
| View: | 217 times |
| Download: | 0 times |

Aerosol and chemical transport in tropical
convection
ACTIVE

Airborne measurements for ACTIVE
ARA Egrett, 10 - 15 km
NERC Dornier
0-5 km
Ozonesondes (profiles)

Egrett payloadBasic Meteorology and position Pressure, temperature, wind (1 Hz), GPS
DMT Single Particle Soot Photometer (SP-2) † Aerosol particle size distribution (0.2 – 1.0 µm), light absorbing fraction (LAP), carbon mass, metal
2 x TSI-3010 Condensation Particle Counter (CPC)
Total condensation particles > 40 nm & > 80 nm
DMT Cloud, Aerosol & Precipitation Spectrometer (CAPS)
Cloud Droplet psd, aerosol/small particle assymetry, aerosol refractive index,large ice psd, (0.3<Dp<3,200 µm), Total Liquid Water Content
DMT Cloud Droplet Probe (CDP) Particle Size Distribution (2< Dp<60 µm)
SPEC Cloud Particle Imager CPI-230 Cloud particle/ice CCD images, (30 < Dp< 2,300µm)
Buck Research CR-2 frost point hygrometer Temperature, dew/ice point, 20 s, 0.1
2X Tunable diode laser Hygrometer (SpectraSensors)
Water vapour, 2 Hz, 0.005 ppmv precision
Julich CO analyser High precision (± 2 ppb), fast response (10 Hz) CO
Cambridge Miniature Gas-Chromatograph Halocarbons (Cl, Br, I), 3-6 min, 5%
TE-49C UV Ozone sensor Ozone concentration (± 1 ppbv, 10 seconds)
Adsorbent tube carbon trap C4-C9 aliphatics, acetone, monoterpenes
NO and NO2 chemiluminescent detector † 200 ppt @ 10 Hz; 30 ppt @ 4 s integration
† alternates Aerosol
Humidity Cloud Physics
Chemistry Met/Position

Dornier payloadBasic meteorology Aventech probe ARSF/Manchester
Position/Timing GPS ARSF
Aerosol Mass Spectrometer Aerosol composition, 30 – 2000 nm Manchester
Condensation particle counter
Aerosol concentration > 10 nm Manchester
Grimm Optical Particle Counter
Aerosol size distribution, 0.5 – 20 μm
Manchester
Ultra high sensitivity aerosol spectrometer
Aerosol size distribution 50 nm – 2 µm
Manchester
Aerosol spectrometer probe Aerosol size distn, 0.1 – 1 µm Manchester
FSSP Aerosol, size ( 2- 47 µm) Manchester
Filters Coarse aerosol composition Manchester
Ozone UV absorption, 2B York
CO AL5003 York
VOC Adsorbent tubes York
NO/NOx (TWP-ICE period only) Chemiluminescence/catalysis York
Halocarbons DIRAC gas chromatograph Cambridge
Black Carbon PSAP DLR
Aerosol Chemistry Met/Position

Egrett payloadBasic Meteorology and position Pressure, temperature, wind (1 Hz), GPS
DMT Single Particle Soot Photometer (SP-2) † Aerosol particle size distribution (0.2 – 1.0 µm), light absorbing fraction (LAP), carbon mass, metal
2 x TSI-3010 Condensation Particle Counter (CPC) Total condensation particles > 10 nm & > 80 nm
DMT Cloud, Aerosol & Precipitation Spectrometer (CAPS)
Cloud particle size distribution, aerosol/small particle asymmetry, aerosol refractive index (0.3<Dp<2,000 µm)
DMT Cloud Droplet Probe (CDP) Particle Size Distribution (2< Dp<62 µm)
SPEC Cloud Particle Imager CPI-230 Cloud particle/ice CCD images, (10 < Dp< 2,300 µm)
Buck Research CR-2 frost point hygrometer Temperature, dew/ice point, 20 s, 0.1
2X Tunable diode laser Hygrometer (SpectraSensors) Water vapour, 2 Hz, 1 ppmv
Julich CO analyser High precision (± 2 ppbv), fast response (1 Hz) CO
Cambridge Miniature Gas-Chromatograph Halocarbons (Cl, Br, I), 3-6 min, 5%
TE-49C UV Ozone sensor Ozone concentration (± 1 ppbv, 10 seconds)
Adsorbent tube carbon trap C4-C9 aliphatics, acetone, monoterpenes
NO and NO2 chemiluminescent detector † 200 ppt @ 10 Hz; 30 ppt @ 4 s integration
† alternates Aerosol
Humidity Cloud Physics
Chemistry Met/Position

Dornier payloadAventech AIMMS-20 probe Basic Meteorology ARSF/Manchester
GPS Position/Timing ARSF
Aerosol Mass Spectrometer Aerosol composition, 30 – 2000 nm Manchester
Condensation particle counter
Aerosol concentration > 10 nm Manchester
Grimm Optical Particle Counter
Aerosol size distribution, 0.3 – 2 μm
Manchester
Ultra high sensitivity aerosol spectrometer
Aerosol size distribution 0.1 – 0.8 μm
Manchester
Aerosol spectrometer probe Aerosol size distribution, 0.2 – 2 µm
Manchester
FSSP Aerosol, size ( 2- 47 µm) Manchester
PSAP Black Carbon aerosol DLR
Filters Coarse aerosol composition Manchester
2B technologies model 202 Ozone York
Aerolaser AL5003 CO York
Automatic tube sampler C4-C9 aliphatics, acetone, OVOCs etc
York
Chemiluminescence/catalysis NO/NOx York
DIRAC gas chromatograph Halocarbons CambridgeAerosol Chemistry Met/
Position

Campaign 1
13 ED 14 15 ED 16ED GF
17 18 19 D GF
20 21 22 23 D GF
24 D 25 26
27 E 28 D F
29 GF
30EDGF(2)
1 ED 2 3 E
4 ED 5 ED GF
6 E 7 8 E 9 E 10 E
Test Survey Hector Mixed survey/Hector
Nov
Dec
Single-cellular Hector
Multi-cellular Hector
Mini-monsoon

Campaign 2Jan 16 17 18 19 D 20ED 21
22ED T
23 E T
24 25 ED PT
26 D 27 ED PT
28
29 30 D 31 E 1 ED 2 D 3 ED 4
5 6 ED PT
7 8 ED T
9 D T
10ED PT
11
12 EDPT
13 E 14 ED 15 E 16 17 Feb
Test Survey Lidar Monsoon Aged anvil Hector
Single-cellular Hector
Multi-cellular Hector
Active Monsoon Inactive Monsoon

Summary of flights
7
1
3
2
Hector
Survey
Test
Cirrus
5
41
3
2
Hector
Survey
Test
Cirrus
Monsoon
73
2
ConvectionSurveyTest
Campaign 1 Campaign 2
Egrett
Dornier
7
7
1
ConvectionSurveyTest
O3sondes: 23 8
13 15
12 15

Single-cell storm, Nov 16
17:30
16:15
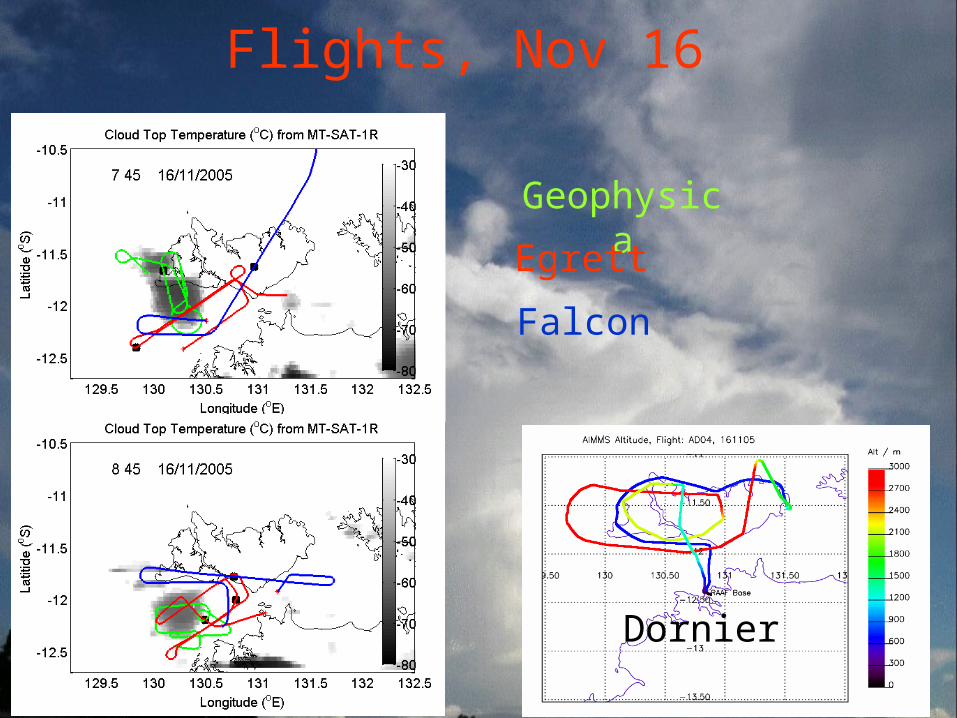
Flights, Nov 16
Dornier
GeophysicaEgrett
Falcon

Cloud particles: CAPSCloud imaging probe: large
particles
Cloud and aerosol spectrometer: small particles observed in first Egrett transect of
anvil
Data: A. Heymsfield and A. Bansamer

Multicell thunderstorm: 30 Nov
14:12
15:25
17:05
15:10

Joint flights, 30th November
Dornier
Geophysica
Dornier
Egrett
Falcon
15:00
16:23

Monsoon convection: 22 Jan 2006MTSAT infra-red image
Aircraft tracks: Egrett (red) and Twin Otter
(green)
Rain rate from polarimetric radar
Courtesy: Peter May, BoM

Evolution of Egrett CO profiles during ACTIVE (ascent profiles only)
Data from A. Volz-Thomas and W. Pätz

Summary
• Around 30 flights with each aircraft in and around tropical convection
• Inflow conditions change from polluted early in November (smoke from biomass burning) to very clean in Jan/Feb
• Hectors observed in polluted and clean regine
• Monsoon convection observed in the second half of January

The Consortium
University of Manchester: Geraint Vaughan (PI), Tom Choularton, Hugh CoeMartin Gallagher, Keith
BowerUniversity of Cambridge: John Pyle, Neil Harris,
Peter Haynes, Rod JonesUniversity of York (UK): Ally Lewis
York University (Toronto): Jim WhitewayDLR (Germany): Reinhold BusenFZ Julich, Germany: Andreas Volz-ThomasNCAR, Boulder: Andy Heymsfield Australian Bureau of Meteorology: Peter MayAirborne Research Australia: Jörg Hacker

Summary
• 7 Egrett Hector flights (3 NOX, 4 aerosol)
• 2 Egrett cirrus flights (1 NOx, 1 aerosol)
• 1 Egrett survey (aerosol)• 3 Egrett test flights• 7 Dornier convection
flights• 3 Dornier survey flights• Intercomparison leg• 2 Dornier test flights• 23 ozonesondes
• 2 Monsoon anvil flights (1 NOx, 1 aerosol)
• 5 Egrett Hector flights (2 NOX, 3 aerosol)
• 3 Egrett cirrus flights (1 NOx, 2 aerosol)
• 4 Egrett survey (1 aerosol, 2 lidar, 1 transit)
• 1 Egrett calibration flight• 7 Dornier convection
flights• 7 Dornier survey flights• Intercomparison flight• 1 Dornier test flights• 8 ozonesondes
Campaign 1 Campaign 2

Objectives Relate measurements of aerosols and
chemicals in the TTL to low-level sources. Determine how deep convection modifies
the aerosol population reaching the TTL, and thus evaluate its impact on cirrus nucleation.
Determine the relative contribution of convection and large-scale transport to the composition of the TTL over Darwin.
Compare the effects of monsoon and pre-monsoon convection on the composition of the TTL.
Determine the contribution of deep convection to the NOx and O3 budget in the TTL
Measure how much black carbon reaches the outflow regions of the storms.


