PLEASE SCROLL DOWN FOR ARTICLE This article was downloaded by: [California Institute of Technology] On: 28 February 2011 Access details: Access Details: [subscription number 917270853] Publisher Taylor & Francis Informa Ltd Registered in England and Wales Registered Number: 1072954 Registered office: Mortimer House, 37- 41 Mortimer Street, London W1T 3JH, UK Aerosol Science and Technology Publication details, including instructions for authors and subscription information: http://www.informaworld.com/smpp/title~content=t713656376 Transfer Functions and Penetrations of Five Differential Mobility Analyzers for Sub-2 nm Particle Classification Jingkun Jiang ab ; Michel Attoui c ; Michael Heim d ; Nicholas A. Brunelli e ; Peter H. McMurry a ; Gerhard Kasper d ; Richard C. Flagan e ; Konstantinos Giapis e ; Guillaume Mouret f a Department of Mechanical Engineering, University of Minnesota, Minneapolis, USA b Department of Environmental Science & Engineering, Tsinghua University, Beijing, China c University of Paris XII, Paris, France d Karlsruhe Institute of Technology, Karlsruhe, Germany e California Institute of Technology, Pasadena, California, USA f University of Nancy, Nancy, France First published on: 15 January 2011 To cite this Article Jiang, Jingkun , Attoui, Michel , Heim, Michael , Brunelli, Nicholas A. , McMurry, Peter H. , Kasper, Gerhard , Flagan, Richard C. , Giapis, Konstantinos and Mouret, Guillaume(2011) 'Transfer Functions and Penetrations of Five Differential Mobility Analyzers for Sub-2 nm Particle Classification', Aerosol Science and Technology, 45: 4, 480 — 492, First published on: 15 January 2011 (iFirst) To link to this Article: DOI: 10.1080/02786826.2010.546819 URL: http://dx.doi.org/10.1080/02786826.2010.546819 Full terms and conditions of use: http://www.informaworld.com/terms-and-conditions-of-access.pdf This article may be used for research, teaching and private study purposes. Any substantial or systematic reproduction, re-distribution, re-selling, loan or sub-licensing, systematic supply or distribution in any form to anyone is expressly forbidden. The publisher does not give any warranty express or implied or make any representation that the contents will be complete or accurate or up to date. The accuracy of any instructions, formulae and drug doses should be independently verified with primary sources. The publisher shall not be liable for any loss, actions, claims, proceedings, demand or costs or damages whatsoever or howsoever caused arising directly or indirectly in connection with or arising out of the use of this material.
Transcript
PLEASE SCROLL DOWN FOR ARTICLE
This article was downloaded by: [California Institute of Technology]On: 28 February 2011Access details: Access Details: [subscription number 917270853]Publisher Taylor & FrancisInforma Ltd Registered in England and Wales Registered Number: 1072954 Registered office: Mortimer House, 37-41 Mortimer Street, London W1T 3JH, UK
Aerosol Science and TechnologyPublication details, including instructions for authors and subscription information:http://www.informaworld.com/smpp/title~content=t713656376
Transfer Functions and Penetrations of Five Differential MobilityAnalyzers for Sub-2 nm Particle ClassificationJingkun Jiangab; Michel Attouic; Michael Heimd; Nicholas A. Brunellie; Peter H. McMurrya; GerhardKasperd; Richard C. Flagane; Konstantinos Giapise; Guillaume Mouretf
a Department of Mechanical Engineering, University of Minnesota, Minneapolis, USA b Department ofEnvironmental Science & Engineering, Tsinghua University, Beijing, China c University of Paris XII,Paris, France d Karlsruhe Institute of Technology, Karlsruhe, Germany e California Institute ofTechnology, Pasadena, California, USA f University of Nancy, Nancy, France
First published on: 15 January 2011
To cite this Article Jiang, Jingkun , Attoui, Michel , Heim, Michael , Brunelli, Nicholas A. , McMurry, Peter H. , Kasper,Gerhard , Flagan, Richard C. , Giapis, Konstantinos and Mouret, Guillaume(2011) 'Transfer Functions and Penetrationsof Five Differential Mobility Analyzers for Sub-2 nm Particle Classification', Aerosol Science and Technology, 45: 4, 480— 492, First published on: 15 January 2011 (iFirst)To link to this Article: DOI: 10.1080/02786826.2010.546819URL: http://dx.doi.org/10.1080/02786826.2010.546819
Full terms and conditions of use: http://www.informaworld.com/terms-and-conditions-of-access.pdf
This article may be used for research, teaching and private study purposes. Any substantial orsystematic reproduction, re-distribution, re-selling, loan or sub-licensing, systematic supply ordistribution in any form to anyone is expressly forbidden.
The publisher does not give any warranty express or implied or make any representation that the contentswill be complete or accurate or up to date. The accuracy of any instructions, formulae and drug dosesshould be independently verified with primary sources. The publisher shall not be liable for any loss,actions, claims, proceedings, demand or costs or damages whatsoever or howsoever caused arising directlyor indirectly in connection with or arising out of the use of this material.
Transfer Functions and Penetrations of Five DifferentialMobility Analyzers for Sub-2 nm Particle Classification
Jingkun Jiang,1,6 Michel Attoui,2 Michael Heim,3 Nicholas A. Brunelli,4
Peter H. McMurry,1 Gerhard Kasper,3 Richard C. Flagan,4 Konstantinos Giapis,4
and Guillaume Mouret5
1Department of Mechanical Engineering, University of Minnesota, Minneapolis, USA2University of Paris XII, Paris, France3Karlsruhe Institute of Technology, Karlsruhe, Germany4California Institute of Technology, Pasadena, California, USA5University of Nancy, Nancy, France6Department of Environmental Science & Engineering, Tsinghua University, Beijing, China
The transfer functions and penetrations of five differential mo-bility analyzers (DMAs) for sub-2 nm particle classification wereevaluated in this study. These DMAs include the TSI nanoDMA,the Caltech radial DMA (RDMA) and nanoRDMA, the GrimmnanoDMA, and the Karlsruhe-Vienna DMA. Measurements weredone using tetra-alkyl ammonium ion standards with mobility di-ameters of 1.16, 1.47, and 1.70 nm. These monomobile ions weregenerated by electrospray followed by high resolution mobilityclassification. Measurements were focused at an aerosol-to-sheathflow ratio of 0.1. A data inversion routine was developed to obtainthe true transfer function for each test DMA, and these measuredtransfer functions were compared with theory. DMA penetrationefficiencies were also measured. An approximate model for diffu-sional deposition, based on the modified Gormley and Kennedyequation using an effective length, is given for each test DMA.These results quantitatively characterize the performance of thetest DMAs in classifying sub-2 nm particles and can be readilyused for DMA data inversion.
according to their electrical mobility. The history of mobilityanalyzers can be traced back to measurements of atmosphericions in the early 20th century (Flagan 1998). The DMA de-veloped in the University of Minnesota Particle Technology
Received 11 May 2010; accepted 4 August 2010.This work was partially supported by a grant from the US NSF
(ATM-0506674) and US DOE (DE-FG-02-05ER63997). JJ thanks Dr.Kenjiro Iida for his help on the data inversion program. A NSF gradu-ate fellowship to NAB is gratefully acknowledged. We thank the twoanonymous reviewers for helping to improve the clarity of our article.
Address correspondence to Michel Attoui, University of Paris XII,Paris, France. E-mail: [email protected]
Laboratory was a breakthrough both in terms of apparatus de-sign (Liu and Pui 1974) and theory (Knutson and Whitby 1975).Similar to the instrument used by Hewitt (1957), this DMA hasa coaxial cylinder arrangement with two inlets and two out-lets. Since the mid 1970s, DMAs have been used routinely toproduce aerosol standards of known size, concentration, andcomposition, to measure aerosol size distributions, and to mea-sure aerosol properties with tandem measurement instrumentsystems (Park et al. 2008). The transfer function that was firstderived by Knutson and Whitby (1975) was the key develop-ment in enabling quantitative applications of DMAs for suchpurposes. Over the past decades, several other types of DMAshave been developed and used in aerosol research, includingthe Vienna type (Winklmayr et al. 1991), the French radial type(RDMA, Mesbah 1994; Ooghe et al. 1994; Fissan et al. 1998),the Caltech radial type (Zhang et al. 1994, 1995; Brunelli et al.2009), and the TSI nanoDMA (Chen et al. 1998). The perfor-mance of such DMAs in the 3 to 200 nm size range has beendiscussed in previous studies (Fissan et al. 1996; Birmili et al.1997; Karlsson and Martinsson 2003). More recently, supercrit-ical cylindrical DMAs that remain laminar in the classificationregion to Reynolds numbers much higher than 2000, and DMAsof unconventional geometries have been developed to improvethe performance and were reviewed by Fernandez de la Mora(2011).
The classification of nanoparticles down to molecular di-mensions is of special interest for current research. However,the transfer functions of most DMAs for sub-2 nm particle clas-sification have not been systematically evaluated, largely dueto the lack of suitable sub-2 nm particle standards. The tandemDMA (TDMA) method has often been used to evaluate DMAtransfer functions (Stolzenburg and McMurry 1988; Fissanet al. 1996; Stratmann et al. 1997). In the 1–2 nm size range,
480
Downloaded By: [California Institute of Technology] At: 16:35 28 February 2011
DMA TRANSFER FUNCTION AND PENETRATION FOR 1–2 NM PARTICLE 481
FIG. 1. Experimental setup for generating monomobile ion standards and for testing DMA performances.
diffusional broadening can significantly degrade the DMAresolution such that it is difficult to generate pseudo-monodisperse particles using a conventional DMA as the firstDMA (Kousaka et al. 1986; Stolzenburg 1988). Recent devel-opments in high-flow DMAs significantly improved the DMAresolution in the nanometer size range (Rosell-Llompart et al.1996; Fernandez de la Mora et al. 1998; Rosser and Fernandezde la Mora 2005), and enabled the generation of molecularmonodisperse mobility standards (tetra-alkyl ammonium ions)(Ude and Fernandez de la Mora 2005). These monomobile ions,which have mobility diameters of 1–2 nm, have been used assize standards to test DMA resolution (Rosser and Fernandezde la Mora 2005; Steiner et al. 2010), diffusional particle losses(Heim et al. 2010), and the transmission factors of mass spec-trometers (Zhao et al. 2010). Another newly developed sizestandard is oven-generated fullerene (C60) vapor. MonodisperseC60 monomer has a geometrical size around 1 nm and has beenused to test DMA performance (Tanaka and Takeuchi 2003; Iidaet al. 2009).
In this study, the transfer functions and penetrations of fivedifferential mobility analyzers for sub-2 nm particle classifica-tion were evaluated using tetra-alkyl ammonium ion standards.These DMAs included the TSI nanoDMA (Chen et al. 1998), theCaltech RDMA (Zhang et al. 1995) and nanoRDMA (Brunelliet al. 2009), the Grimm nanoDMA, and the Karlsruhe-ViennaDMA, an optimized version of the classical Vienna typeDMA (Winklmayr et al. 1991; Heim et al. 2005). Calibrationwas performed using singly charged tetra-propyl ammonium(N+[C3H7]4), tetra-heptyl ammonium (N+[C7H15]4), andtetra-dodecyl ammonium (N+[C12H25]4) ions with mobilitydiameters of 1.16, 1.47, and 1.70 nm, respectively. Thesemonomobile ions were generated by electrospray and classifiedby the high resolution DMA (Fernandez de la Mora et al. 1998;Ude and Fernandez de la Mora 2005). Based on Stolzenburg’sdiffusive transfer function (Stolzenburg 1988; Stolzenburg andMcMurry 2008), a data inversion routine was developed to ob-
tain the true transfer function for each test DMA. In addition totransfer functions, we report the DMA penetration efficiencies.
2. EXPERIMENTSAs shown in Figure 1, an electrospray was coupled to a high
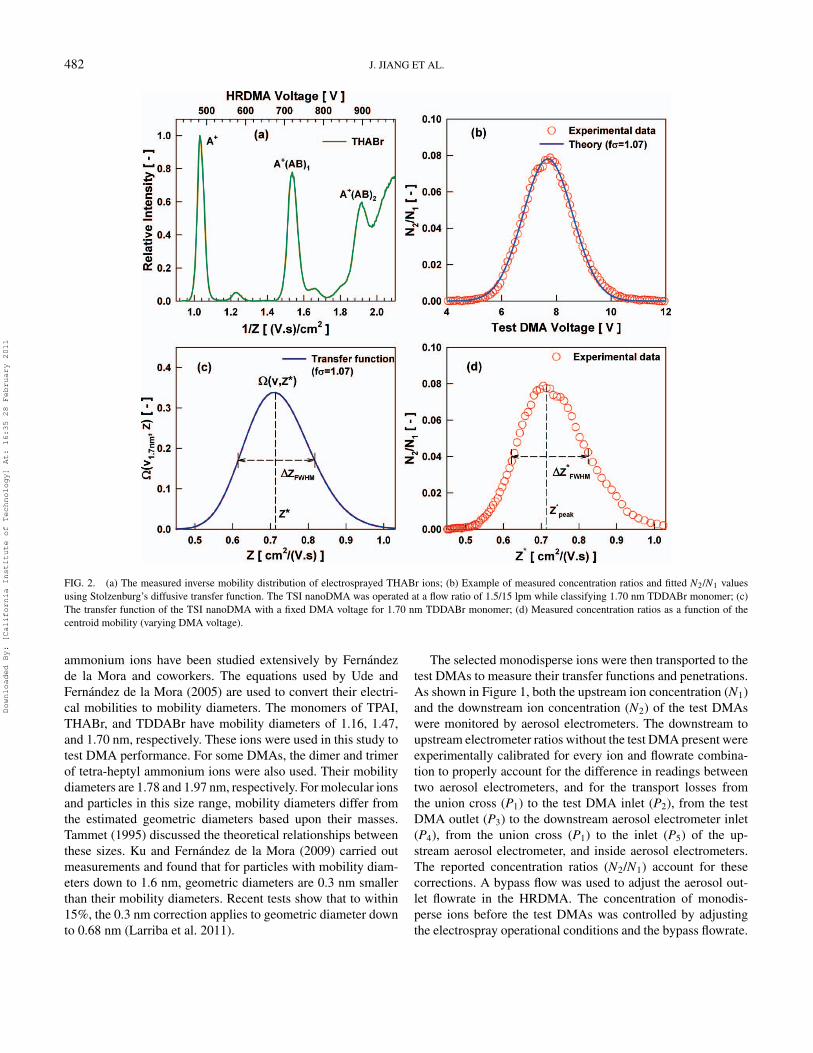
resolution differential mobility analyzer (HRDMA) to generatemonodisperse size standards (tetra-alkyl ammonium ions). Theelectrospray system used here has been described in detail byUde and Fernandez de la Mora (2005). Particle-free compressedair was used as the carrier gas. The organic salts used to producethese ions (tetra-propyl ammonium iodide (TPAI, N[C3H7]4I),tetra-heptyl ammonium bromide (THABr, N[C7H15]4Br), andtetra-dodecyl ammonium bromide (TDDABr, N[C12H25]4Br))were dissolved in ultrapure methanol with low concentrations.All the chemicals were purchased and used as received fromSigma Aldrich. Rather than precisely controlling the salt con-centrations (Ude and Fernandez de la Mora 2005), serial dilu-tions were made to a solution of unknown concentration untilthe electrospray was stable and the peaks of monomer (A+;A denotes the tetra-alkyl ammonium) and dimer (A+(AB)1;B denotes the halide) were somewhat higher than other peaks.Highly mobile positively charged ions generated by electrospraywere then transported to a high-resolution differential mobilityanalyzer (Fernandez de la Mora et al. 1998). An inverse mo-bility distribution of electrosprayed THABr ions measured byscanning HRDMA voltage while using an aerosol electrom-eter to measure the concentrations of mobility-classified ionsis shown in Figure 2a. The HRDMA cleanly separates themonomer (A+), dimer (A+(AB)1), and trimer (A+(AB)2). Theidentities of these molecular ions have been confirmed by massspectrometry (Ude and Fernandez de la Mora 2005). Therefore,monodisperse molecular ions having known chemical structures(e.g., monomer or dimer) can be selected by fixing the HRDMAvoltage at the value corresponding to the peak currents shown inFigure 2a. The electrical mobilities of electrosprayed tetra-alkyl
Downloaded By: [California Institute of Technology] At: 16:35 28 February 2011
482 J. JIANG ET AL.
FIG. 2. (a) The measured inverse mobility distribution of electrosprayed THABr ions; (b) Example of measured concentration ratios and fitted N2/N1 valuesusing Stolzenburg’s diffusive transfer function. The TSI nanoDMA was operated at a flow ratio of 1.5/15 lpm while classifying 1.70 nm TDDABr monomer; (c)The transfer function of the TSI nanoDMA with a fixed DMA voltage for 1.70 nm TDDABr monomer; (d) Measured concentration ratios as a function of thecentroid mobility (varying DMA voltage).
ammonium ions have been studied extensively by Fernandezde la Mora and coworkers. The equations used by Ude andFernandez de la Mora (2005) are used to convert their electri-cal mobilities to mobility diameters. The monomers of TPAI,THABr, and TDDABr have mobility diameters of 1.16, 1.47,and 1.70 nm, respectively. These ions were used in this study totest DMA performance. For some DMAs, the dimer and trimerof tetra-heptyl ammonium ions were also used. Their mobilitydiameters are 1.78 and 1.97 nm, respectively. For molecular ionsand particles in this size range, mobility diameters differ fromthe estimated geometric diameters based upon their masses.Tammet (1995) discussed the theoretical relationships betweenthese sizes. Ku and Fernandez de la Mora (2009) carried outmeasurements and found that for particles with mobility diam-eters down to 1.6 nm, geometric diameters are 0.3 nm smallerthan their mobility diameters. Recent tests show that to within15%, the 0.3 nm correction applies to geometric diameter downto 0.68 nm (Larriba et al. 2011).
The selected monodisperse ions were then transported to thetest DMAs to measure their transfer functions and penetrations.As shown in Figure 1, both the upstream ion concentration (N1)and the downstream ion concentration (N2) of the test DMAswere monitored by aerosol electrometers. The downstream toupstream electrometer ratios without the test DMA present wereexperimentally calibrated for every ion and flowrate combina-tion to properly account for the difference in readings betweentwo aerosol electrometers, and for the transport losses fromthe union cross (P1) to the test DMA inlet (P2), from the testDMA outlet (P3) to the downstream aerosol electrometer inlet(P4), from the union cross (P1) to the inlet (P5) of the up-stream aerosol electrometer, and inside aerosol electrometers.The reported concentration ratios (N2/N1) account for thesecorrections. A bypass flow was used to adjust the aerosol out-let flowrate in the HRDMA. The concentration of monodis-perse ions before the test DMAs was controlled by adjustingthe electrospray operational conditions and the bypass flowrate.
Downloaded By: [California Institute of Technology] At: 16:35 28 February 2011
DMA TRANSFER FUNCTION AND PENETRATION FOR 1–2 NM PARTICLE 483
TABLE 1Geometry parameters and tested flow conditions for various DMAs
Karlsruhe-Vienna DMA 2.5 2.29 3.3 0.838 6/61.4 Heim et al. 2005
Measurements were made over a sufficient range of concentra-tions to confirm that data were not affected by space charge(Camata et al. 2001). During the DMA calibration, the voltagefor the HRDMA was fixed and the voltage for the test DMAwas scanned continuously. The DMA voltage was increasedslowly to ensure pseudo-steady-state operation. A typical scantook approximately 15 min. Most measurements were done atan aerosol-to-sheath flow ratio of 0.1. Several other aerosol andsheath flow combinations were also examined. Balanced flowswere used for all test DMAs, i.e., the aerosol inlet flowratewas equal to the aerosol sampling outlet flowrate. A closed-loop was used for DMA sheath and excess flows to ensure theywere exactly equal (Rogak et al. 1993; Jokinen and Makela1997).
The geometry parameters and the tested flowrates for eachDMA are summarized in Table 1. Designs of the TSI nano-DMA, the Caltech RDMA and nanoRDMA are described indetail in the references given in Table 1. The description of theKarlsruhe-Vienna DMA and the Grimm nanoDMA are not read-ily available in literature. We discuss the difference between theKarlsruhe-Vienna DMA and the original Vienna DMA in Sec-tion 4.5. The Grimm nanoDMA is a commercial instrument, andwe were unable to obtain a detailed description of its pertinentdesign features. The French radial DMA (Ooghe et al. 1994)was also tested. However, the use of a high voltage insulatorinside this DMA causes high electrostatic transport losses, sothat no ions were observed at the outlet. Such electrostatic losseshave been reported previously with other DMAs and they be-come increasingly important as size decreases (Kousaka et al.1986; Chen et al. 1998). Similar losses were observed for acopy of the Vienna type DMA (referred to as “DMA 1/40” inWinklmayr et al. 1991). The penetration through the Viennatype DMA was significantly improved by replacing the originalinsulator with a Delrin insulator, though the results of these twoDMAs are not included in this study. The Grimm nanoDMA andthe Karlsruhe-Vienna DMA were tested at the Karlsruhe Insti-tute of Technology. The Caltech RDMA and nanoRDMA wereevaluated at the University of Minnesota. The TSI nanoDMAwas tested at both the University of Minnesota and KarlsruheInstitute of Technology.
Different versions of high-resolution differential mobilityanalyzers have been developed by Fernandez de la Mora and
coworkers. The HRDMA used in Minneapolis is also referred asthe Herrmann DMA (Herrmann et al. 2000), while the HRDMAused in Karlsruhe is also referred as the Attoui DMA (Fernandezde la Mora and Attoui 2007; Heim et al. 2010). Both HRDMAswere operated in an open-loop for sheath and excess flows andin a safe mode, i.e., the DMA outer electrode is grounded. Theuse of a “leaky” insulator (polyoxymethylene, Ensinger-HYDE,Germany) at the aerosol outlet facilitates the safe mode opera-tion (Fernandez de la Mora and Attoui 2007). This insulatingmaterial is slightly conductive which helps to dissipate the elec-tric charges built up on the insulator surface due to chargedparticle depositions.
3. DATA INVERSIONThe results of a typical measurement, where the TSI nano-
DMA was operated at a flow ratio of 1.5/15 lpm while clas-sifying 1.70 nm TDDABr monomer, are shown in Figure 2b.Since monodisperse particles were sent into the test DMA, theconcentration ratio (N2/N1) can be written as,
N2
N1= ηpen(dp) · �(V,Z(dp)) [1]
where ηpen(dp) is the penetration efficiency of particles of di-ameter dp through the entrance and exit regions of the DMAand �(V,Z(dp)) is the DMA transfer function. The transfer func-tion is defined as the fraction of particles of electrical mobilityZ(dp) that penetrate through a DMA classifying region oper-ated at voltage V . As shown in Figure 2c, the transfer functionis characterized by two parameters: the height (�(V,Z∗)) andthe normalized full-width at half-maximum (NFWHM), or theresolution (R). The height of the transfer function is the pene-tration fraction of particles with the centroid electrical mobility(Z∗), i.e., the mobility that corresponds to the DMA voltageV through the voltage-mobility equation (Knutson and Whitby1975; Stolzenburg and McMurry 2008). The NFWHM of thetransfer function is,
NFWHM = �ZFWHM
Z∗ [2]
Downloaded By: [California Institute of Technology] At: 16:35 28 February 2011
484 J. JIANG ET AL.
where �ZFWHM is the transfer function width at half height(Figure 2c). The instrument mobility resolution is defined as thereciprocal of the NFWHM (Flagan 1999),
R = 1
NFWHM= Z∗
�ZFWHM[3]
and is a figure of merit for DMA performance.To measure the true DMA transfer function (Figure 2c), ide-
ally one will fix the DMA voltage and send monodisperse par-ticles of different sizes to the DMA to obtain �(V,Z(dp)). Sinceit is impractical to generate many different monodisperse sizestandards under the narrow non-zero width of the transfer func-tion, an alternative method is used—the particle size is fixedand the DMA voltage is scanned, as shown for example in Fig-ure 2b. If the DMA transfer functions at different voltages arethe same, the measured � at different voltages can be directlyprojected back to Figure 2c. Particle diffusion can broaden theDMA transfer function significantly when classifying sub-2 nmparticles. The NFWHM of the DMA transfer function also be-comes a function of the DMA voltage (the centroid mobility)due to diffusion. Therefore, the results obtained by measur-ing concentration ratios as a function of the test DMA voltagefor monodisperse particles are not exactly equal to the transferfunction, i.e., the diffusional broadening effect increases as thevoltage is decreased in the course of the transfer function mea-surement. For all DMAs tested here, this effect was accountedfor when inverting the data so that the transfer functions reportedhere correspond to the transfer function that would be measuredat constant voltage if a sufficient range of calibration particleswere available. The resolution of the Caltech nanoRDMA in the1–2 nm size range was previously reported without consideringthis effect (Brunelli et al. 2009). In that earlier study, the res-olution was estimated based on �Z∗
FWHM and Z∗peak in Figure
2d.In this study, a data inversion scheme was developed based
on Stolzenburg’s diffusive transfer function. Stolzenburg (1988)extended the non-diffusive transfer function developed by Knut-son and Whitby (1975) to account for particle diffusion. A di-mensionless diffusional broadening parameter, σ theo, was de-fined and an expression for the diffusive transfer functionwas developed. This theory is described in detail elsewhere(Stolzenburg 1988; Flagan 1999; Stolzenburg and McMurry2008) and is summarized in the Supplemental Information. Inaddition to particle diffusion, the transfer function might alsobe affected by instrument nonidealities, electrode imperfectionsand misalignments, and other factors that may influence the flowor electric fields (Stolzenburg 1988; Zhang and Flagan 1996;Chen and Pui 1997; Eichler et al. 1998; Karlsson and Martins-son 2003; Heim et al. 2005). To account for these potentialeffects, a multiplicative factor (fσ ) is used and the broadeningparameter in the diffusive transfer function is rewritten as,
σ = σtheo · fσ [4]
If no other broadening exists, the factor (fσ ) will be equal tounity. We assume that fσ is constant across the narrow non-zerowidth of the transfer function. Particle diffusion will increasethe transfer function NFWHM and decrease the height, subse-quently lowering the peak value of N2/N1. The losses at theentrance and exit regions of the DMA will affect N2/N1 withoutchanging the NFWHM (Martinsson et al. 2001). Therefore, twounknowns are needed to calculate the concentration ratio usingEquation (1): fσ and ηpen(dp). A least squares fitting method wasused to solve for these two unknowns by matching the theoret-ically predicted concentration ratios with the measured N2/N1.For the data shown in Figure 2b, the theoretical calculated con-centration ratios agreed with the experimental data very wellwhen fσ is 1.07. The transfer function height (�(V,Z∗)) and thepenetration efficiency (ηpen) were 33.8% and 23.1%, respec-tively. Their product is the peak value of N2/N1, 7.8% (Figure2b). Another way to look at the additional broadening is to de-fine it as σ distor which can be estimated from (Stolzenburg 1988;Rosell-Llompart et al. 1996; Flagan 1999),
σ 2 = (σtheo · fσ )2 = σ 2theo + σ 2
distor [5]
When comparing DMA performance, the migration Pecletnumber is often used (Zhang and Flagan 1996; Fissan et al. 1998;Flagan 1999; Karlsson and Martinsson 2003). It is defined as theratio of the electrophoretic flux to the diffusive flux of particlesduring mobility classification. For each test DMA, the migrationPeclet number allows the results obtained at different aerosoland sheath flowrates but the same aerosol-to-sheath ratio, β, tobe conveniently presented on the same plot. In this study, weused the definition given by Flagan (1999),
Pe = qV
kTf [6]
where q is the charge carried by particles (one elementary chargefor all ion standards used in this study), V is the DMA voltage, kis Boltzmann’s constant, T is the absolute temperature, and f isa DMA geometry factor that accounts for the nonuniformity ofthe DMA electric field. For radial DMAs, this geometry factoris unity. For cylindrical DMAs, this geometry factor is,
f = 1 − R1/R2
ln(R2/R1)[7]
where R1 and R2 are the inner radius and the outer radius ofthe DMA, respectively. The f factors for all test DMAs aresummarized in Table 1.
The losses at the entrance and exit regions of the test DMAswere simulated using the laminar diffusional deposition modelfor cylindrical tubes, and an effective length, Leff, for each testDMA is reported. Though these losses are probably more com-plicated (e.g., electrostatic deposition likely contributes to ob-served losses, and flow channels are not all cylindrical), it has
Downloaded By: [California Institute of Technology] At: 16:35 28 February 2011
DMA TRANSFER FUNCTION AND PENETRATION FOR 1–2 NM PARTICLE 485
TABLE 2Estimated DMA transfer function parameters and effective lengths
distor are σ theo and σ distor evaluated at the centroid electrical mobility (Z∗), respectively; Qa is the aerosol inlet flow rate.
been shown that the modified Gormley and Kennedy equation(Gormley and Kennedy 1949; Cheng 2002) provides a rea-sonable model for explaining size-dependent DMA penetrationefficiencies (Reineking and Porstendorfer 1986; Karlsson andMartinsson 2003; Iida et al. 2006). More accurate estimationof the diffusion losses in DMA entrance and exit regions mightbe obtained by dividing them into different sections that areeach analyzed using the approach originally developed for thecorresponding heat transfer problem (Graetz 1885) and electro-static deposition can also be included (Zhang and Flagan 1996;Karlsson and Martinsson 2003). However, the effective lengthapproach is simpler and provides results that are more conve-nient to be included in DMA data inversion. The dimensionlessdeposition parameter, µ, can be written as,
µ = πDLeff
Q[8]
where D is the diffusion coefficient of particles with diameterdp and Q is the flow rate through the cylindrical tube. Thepenetration efficiency is given by (Cheng 2002),
An effective length can be derived by fitting the calculatedpenetration efficiencies using the above equations to the mea-sured penetrations. A least squares method was used for thefitting.
Downloaded By: [California Institute of Technology] At: 16:35 28 February 2011
486 J. JIANG ET AL.
FIG. 3. Performances of four DMAs in classifying THABr monomer (1.47 nm): (a) measured concentration ratios by scanning the DMA voltage (varyingcentroid mobility); (b) the inverted transfer functions of four DMAs with a fixed DMA voltage for 1.47 nm THABr monomer. For the TSI nanoDMA, 15 lpmtransport flow was used to reduce the losses through the entrance region (Chen et al. 1998).
The errors in determining the DMA transfer function (res-olution/NFWHM and height) and penetration efficiency wereestimated to be smaller than 7%. Uncertainties are due primarilyto the uncertainties in DMA flowrates and particle concentrationmeasurements. As shown in Figure 2b, the fitted concentrationratios mostly agree with the measured N2/N1 very well. Thoughit was not observed under the conditions shown in Figure 2b,an abnormal tail at higher voltage side (lower mobility) oc-curred under certain conditions for all test DMAs. This was alsoobserved by Heim et al. (2010) in a TDMA experiment usingTHABr monomer and trimer, but not for the dimer. Their resultsfor the monomer disagree with the proposed fragmentation andclustering hypothesis (Rosell-Llompart et al. 1996; Fernandezde la Mora et al. 2005). The origin of this abnormal tail remainsto be identified. Their N2/N1 values are often much smaller thanthe peak value. The abnormal tail was not included in the inver-sion fitting which may cause some additional uncertainty in thereported resolution and transmission.
4. RESULTS AND DISCUSSIONEstimated DMA transfer function parameters and effective
lengths are summarized in Table 2. The performance of the TSInanoDMA, the Grimm nanoDMA, the Caltech nanoRDMA,and the Karlsruhe-Vienna DMA in classifying 1.47 nm THABrmonomer are shown in Figure 3. The measured transfer func-tion of the Caltech RDMA was very broad and is thereforenot included in Figure 3. Different flowrates were used for
these DMAs, but the aerosol-to-sheath flow ratios were simi-lar (∼0.1). In order to present the results from different DMAsin one graph, the corresponding centroid mobilities (Z∗) ratherthan the test DMA voltages are used in Figure 3(a). The Cal-tech nanoRDMA has the highest peak N2/N1 value, followed bythe TSI nanoDMA, the Grimm nanoDMA, and the Karlsruhe-Vienna DMA. Their inverted transfer functions, obtained byfixing voltage at a value corresponding to the centroid mobil-ity diameter of 1.47 nm, are shown in Figure 3b. The resolu-tion of the Caltech nanoRDMA was the best, followed by theKarlsruhe-Vienna DMA, the Grimm nanoDMA, and the TSInanoDMA. Since the multiplicative factors ( fσ ) for both theTSI nanoDMA and the Grimm nanoDMA were close to unity,there was no additional broadening for these two DMAs. Boththe Caltech nanoRDMA and the Karlsruhe-Vienna DMA hadadditional broadening under these conditions. The resolutionand peak N2/N1 value of the Grimm nanoDMA were very closeto those of the Karlsruhe-Vienna DMA.
The flowrates of a DMA are critical in determining its perfor-mance and different DMAs are designed to operate at differentflowrates. Instrument characterization should be based on theoptimum operation of each DMA such that a direct comparisonof the different DMA performances is only suitable to a limiteddegree (Fissan et al. 1996; Birmili et al. 1997; Flagan 1999). Inthe following discussion, we focused on a comparison betweenthe measured performances and the theoretical predictions foreach test DMA.
Downloaded By: [California Institute of Technology] At: 16:35 28 February 2011
DMA TRANSFER FUNCTION AND PENETRATION FOR 1–2 NM PARTICLE 487
FIG. 4. TSI nanoDMA: (a) the resolution as a function of instrument Peclet number; (b) the NFWHM; (c) the height, and the penetration efficiency throughDMA entrance and exit regions as a function of particle mobility diameter for the flow ratio of 1.5/15 lpm; (d) the measured penetration efficiency versus the fittedpenetration efficiency.
4.1. TSI nanoDMABoth the resolution and the penetration efficiency of the TSI
nanoDMA are shown in Figure 4. Monodisperse ions with di-ameters of 1.16, 1.47, and 1.70 nm were tested using flow ra-tios of 1.5/15 and 2/20 lpm. In both cases, 15 lpm transportflow was used to reduce the losses through the nanoDMA en-trance region (Chen et al. 1998). Literature data on the TSInanoDMA performance in classifying particles larger than 3nm are also included in Figure 4 (Chen et al. 1998; Li et al.2006). As shown in Figure 4a and b, the experimentally deter-mined resolution for this instrument agreed very well with itsideal resolution ( fσ = 1.0) in both diffusive and non-diffusiveranges. No additional broadening due, for example, to imper-fections in flow profiles, electric fields, or machining tolerances,was observed under these conditions. At the test flowrates, theNFWHM of the TSI nanoDMA transfer function in classifyingsub-2nm particles is 2∼4 times wider than the non-diffusivevalue (0.1).
Figure 4c shows the transfer function heights (�(V,Z∗)) forclassifying different sized particles at a flow ratio of 1.5/15 lpmand the penetration efficiencies (ηpen) of sub-2 nm particlesthrough the nanoDMA entrance and exit regions. Literature
data for particles larger than 3 nm were also analyzed usingthe same method, i.e., by separating �(V,Z∗) and ηpen. Togetherthe penetration efficiencies for different sized particles werefitted with the modified Gormley and Kennedy equation. If theflowrate of 1.5 lpm was used (without considering the 15 lpmtransport flow at the entrance region), the effective length of theTSI nanoDMA was found to be 1.58 m. As shown in Figure 4c,good agreement between the experimental data and the fittedpenetrations is observed.
To include the transport flow, the entrance and exit regionscan be fitted separately and two effective lengths will be re-ported. The flowrate through the first length (the entrance re-gion) is then the aerosol flow plus the transport flow, while theflowrate through the second length (the exit region) is only theaerosol flow. Both results from this study and literature datawere used for the fitting. There are total 45 data points and theirinformation are summarized here—this study: 1.5 and 2 lpm(15 lpm transport flow), 1–2 nm; Chen et al. (1998): 1.5 lpm(with and without 15 lpm transport flow), 3–50 nm; Li et al.(2006): 0.75 and 1.5 lpm (no transport flow), 6–50 nm; Heimet al. (2007): 2 lpm (15 lpm transport flow), 3–10 nm. The effec-tive lengths for the entrance and exit regions were found to be
Downloaded By: [California Institute of Technology] At: 16:35 28 February 2011
488 J. JIANG ET AL.
FIG. 5. Caltech nanoRDMA: (a) the resolution as a function of instrumentPeclet number; (b) the NFWHM; (c) the height, and the penetration efficiencyas a function of particle mobility diameter for the flow ratio of 0.6/6 lpm.
2.24 and 1.40 m, respectively. As shown in Figure 4d, the fittedpenetration efficiencies agree well with the measured ones.
4.2. Caltech nanoRDMAThe results for the Caltech nanoRDMA are shown in Fig-
ure 5. Monomobile ions with mobility diameters of 1.16, 1.47,and 1.70 nm were tested using flow ratios of 0.6/6, 1/10, and1.5/15 lpm. At the test flowrates, the NFWHM of the CaltechnanoRDMA transfer function in classifying sub-2 nm particleswas equal to or less than 0.2 (relatively close to the non-diffusivevalue of 0.1). The measured resolution for this instrument agreedvery well with its ideal resolution at the flow ratio of 0.6/6 lpm.However, the measured resolution fell below its ideal resolu-tion at the flow ratio of 1/10 lpm and deviated further at higherflowrates (1.5/15 lpm). Its resolutions at the flow ratio of 0.6/10
lpm were also found to be lower than the ideal values, which isconsistent to previous studies (Brunelli et al. 2009). As shownin Table 2, σ distor increases with the increasing flowrate throughthe nanoRDMA. Additional tests indicated that turbulence oc-curred inside the nanoRDMA for a sheath flowrate of 18 lpm andparticles were detected at the aerosol outlet when there was novoltage applied. Similar resolution degradation by flow effectswas observed for the Caltech RDMA (Zhang and Flagan 1996)and was attributed to the flow disturbances near the entrance slotor at the classified aerosol exit. The shorter classification lengthof the nanoRDMA might cause additional non-uniformities inflow and electric field, e.g., in addition to the observed resolutiondegradation, as confirmed in this study, an empirical correctionfactor of 0.874 is needed for the conversion between the DMAvoltage and the centroid mobility (Brunelli et al. 2009). Boththe transfer function heights (�(V,Z∗)) for classifying differentsized particles and the penetration efficiencies (ηpen) of sub-2nm particles at a flow ratio of 0.6/6 lpm are shown in Figure5c. The effective length of the Caltech nanoRDMA was foundto be 0.60 m. If ηpen for all the tested flowrates (0.6, 1.0, and1.5 lpm) were fitted together, the effective length was found tobe 0.87 m.
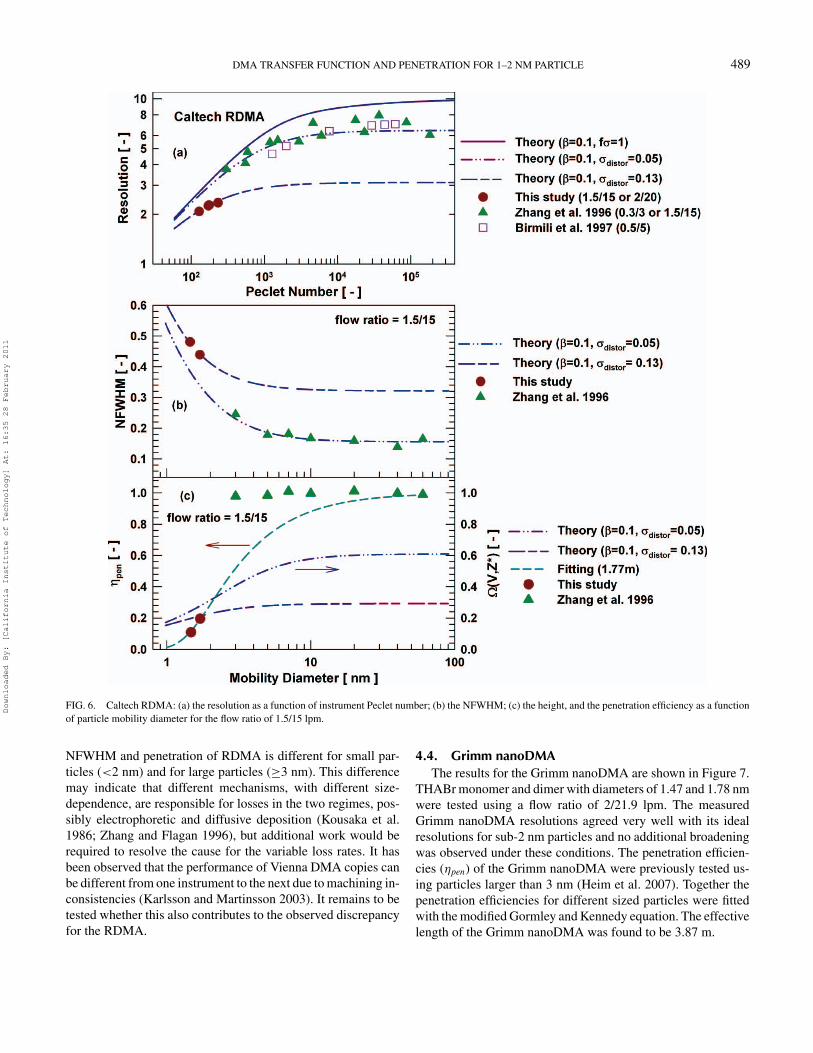
4.3. Caltech RDMAThe results for the Caltech RDMA are shown in Figure 6.
Monomobile ions with diameters of 1.47 and 1.70 nm weretested using flow ratios of 1.5/15 and 2/20 lpm. Literature data onthe Caltech RDMA performance in classifying particles largerthan 3 nm are also included in Figure 6 (Zhang and Flagan1996; Birmili et al. 1997). As shown in Figure 6a and b, themeasured Caltech RDMA resolution was lower than its idealresolution in both diffusive and non-diffusive size ranges. Byusing a constant additional broadening (σ distor = 0.05), theoret-ically calculated RDMA resolutions agreed very well with mea-sured resolutions for particles larger than 3 nm, while σ distor wasestimated to be ∼0.13 for sub-2 nm classification. Again, flowdisturbances inside the DMA might account for the observedresolution degradation for the Caltech RDMA.
The transfer function heights (�(V,Z∗)) at σ distor of 0.05 and0.13 are shown in Figure 6c. The penetration efficiencies (ηpen)for sub-2 nm particles and literature penetration efficiencies forlarge particles (Zhang and Flagan 1996) are also included inFigure 6c. For these literature data, ηpen and �(V,Z∗) were al-ready separated from each other. There was no single effectivelength to achieve good fitting with the penetration efficienciesof particles in the whole size range. When fitted separately, theeffective length was found to be 1.77 m for sub-2 nm particlesand less than 0.1 m for particles larger than 3 nm. If ηpen ofsub-2 nm particles tested at all the flowrates (1.5 and 2 lpm)were fitted together, the effective length was found to be 1.99m. Based on the same RDMA data set for large particles, aneffective length of 0.083 m was reported by Karlsson and Mar-tinsson (2003). It remains to be determined why the resolution/
Downloaded By: [California Institute of Technology] At: 16:35 28 February 2011
DMA TRANSFER FUNCTION AND PENETRATION FOR 1–2 NM PARTICLE 489
FIG. 6. Caltech RDMA: (a) the resolution as a function of instrument Peclet number; (b) the NFWHM; (c) the height, and the penetration efficiency as a functionof particle mobility diameter for the flow ratio of 1.5/15 lpm.
NFWHM and penetration of RDMA is different for small par-ticles (<2 nm) and for large particles (≥3 nm). This differencemay indicate that different mechanisms, with different size-dependence, are responsible for losses in the two regimes, pos-sibly electrophoretic and diffusive deposition (Kousaka et al.1986; Zhang and Flagan 1996), but additional work would berequired to resolve the cause for the variable loss rates. It hasbeen observed that the performance of Vienna DMA copies canbe different from one instrument to the next due to machining in-consistencies (Karlsson and Martinsson 2003). It remains to betested whether this also contributes to the observed discrepancyfor the RDMA.
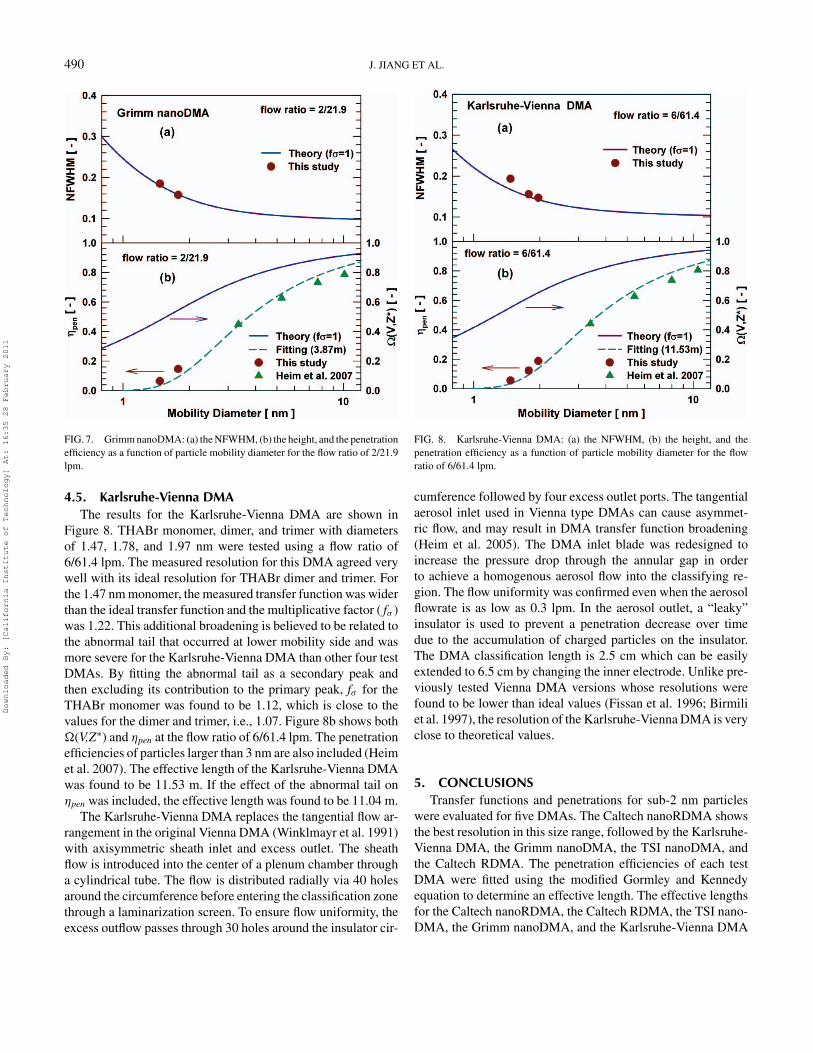
4.4. Grimm nanoDMAThe results for the Grimm nanoDMA are shown in Figure 7.
THABr monomer and dimer with diameters of 1.47 and 1.78 nmwere tested using a flow ratio of 2/21.9 lpm. The measuredGrimm nanoDMA resolutions agreed very well with its idealresolutions for sub-2 nm particles and no additional broadeningwas observed under these conditions. The penetration efficien-cies (ηpen) of the Grimm nanoDMA were previously tested us-ing particles larger than 3 nm (Heim et al. 2007). Together thepenetration efficiencies for different sized particles were fittedwith the modified Gormley and Kennedy equation. The effectivelength of the Grimm nanoDMA was found to be 3.87 m.
Downloaded By: [California Institute of Technology] At: 16:35 28 February 2011
490 J. JIANG ET AL.
FIG. 7. Grimm nanoDMA: (a) the NFWHM, (b) the height, and the penetrationefficiency as a function of particle mobility diameter for the flow ratio of 2/21.9lpm.
4.5. Karlsruhe-Vienna DMAThe results for the Karlsruhe-Vienna DMA are shown in
Figure 8. THABr monomer, dimer, and trimer with diametersof 1.47, 1.78, and 1.97 nm were tested using a flow ratio of6/61.4 lpm. The measured resolution for this DMA agreed verywell with its ideal resolution for THABr dimer and trimer. Forthe 1.47 nm monomer, the measured transfer function was widerthan the ideal transfer function and the multiplicative factor ( fσ )was 1.22. This additional broadening is believed to be related tothe abnormal tail that occurred at lower mobility side and wasmore severe for the Karlsruhe-Vienna DMA than other four testDMAs. By fitting the abnormal tail as a secondary peak andthen excluding its contribution to the primary peak, fσ for theTHABr monomer was found to be 1.12, which is close to thevalues for the dimer and trimer, i.e., 1.07. Figure 8b shows both�(V,Z∗) and ηpen at the flow ratio of 6/61.4 lpm. The penetrationefficiencies of particles larger than 3 nm are also included (Heimet al. 2007). The effective length of the Karlsruhe-Vienna DMAwas found to be 11.53 m. If the effect of the abnormal tail onηpen was included, the effective length was found to be 11.04 m.
The Karlsruhe-Vienna DMA replaces the tangential flow ar-rangement in the original Vienna DMA (Winklmayr et al. 1991)with axisymmetric sheath inlet and excess outlet. The sheathflow is introduced into the center of a plenum chamber througha cylindrical tube. The flow is distributed radially via 40 holesaround the circumference before entering the classification zonethrough a laminarization screen. To ensure flow uniformity, theexcess outflow passes through 30 holes around the insulator cir-
FIG. 8. Karlsruhe-Vienna DMA: (a) the NFWHM, (b) the height, and thepenetration efficiency as a function of particle mobility diameter for the flowratio of 6/61.4 lpm.
cumference followed by four excess outlet ports. The tangentialaerosol inlet used in Vienna type DMAs can cause asymmet-ric flow, and may result in DMA transfer function broadening(Heim et al. 2005). The DMA inlet blade was redesigned toincrease the pressure drop through the annular gap in orderto achieve a homogenous aerosol flow into the classifying re-gion. The flow uniformity was confirmed even when the aerosolflowrate is as low as 0.3 lpm. In the aerosol outlet, a “leaky”insulator is used to prevent a penetration decrease over timedue to the accumulation of charged particles on the insulator.The DMA classification length is 2.5 cm which can be easilyextended to 6.5 cm by changing the inner electrode. Unlike pre-viously tested Vienna DMA versions whose resolutions werefound to be lower than ideal values (Fissan et al. 1996; Birmiliet al. 1997), the resolution of the Karlsruhe-Vienna DMA is veryclose to theoretical values.
5. CONCLUSIONSTransfer functions and penetrations for sub-2 nm particles
were evaluated for five DMAs. The Caltech nanoRDMA showsthe best resolution in this size range, followed by the Karlsruhe-Vienna DMA, the Grimm nanoDMA, the TSI nanoDMA, andthe Caltech RDMA. The penetration efficiencies of each testDMA were fitted using the modified Gormley and Kennedyequation to determine an effective length. The effective lengthsfor the Caltech nanoRDMA, the Caltech RDMA, the TSI nano-DMA, the Grimm nanoDMA, and the Karlsruhe-Vienna DMA
Downloaded By: [California Institute of Technology] At: 16:35 28 February 2011
DMA TRANSFER FUNCTION AND PENETRATION FOR 1–2 NM PARTICLE 491
are 0.87, 1.99, 3.64, 3.87, and 11.53 m, respectively. The Cal-tech nanoRDMA shows the highest penetration efficiency. Thisstudy also demonstrates that Stolzenburg’s diffusive transferfunction accurately predicts transfer functions for particles downto the smallest tested size (1.16 nm). The resolutions of the TSInanoDMA, the Grimm nanoDMA, the Caltech nanoRDMA (atlow flow rates), and the Karlsruhe-Vienna DMA (for 1.78 and1.97 nm particles) agree very well with the diffusive transferfunction. Additional broadening was observed for the CaltechRDMA, the Caltech nanoRDMA (at high flow rates), and theKarlsruhe-Vienna DMA for 1.47 nm particles. Results are pre-sented in a form that is useful for DMA data inversion.
REFERENCESBirmili, W., Stratmann, F., Wiedensohler, A., Covert, D., Russell, L. M., and
Berg, O. (1997). Determination of Differential Mobility Analyzer Trans-fer Functions Using Identical Instruments in Series. Aerosol Sci. Technol.27:215–223.
Brunelli, N. A., Flagan, R. C., and Giapis, K. P. (2009). Radial DifferentialMobility Analyzer for One Nanometer Particle Classification. Aerosol Sci.Technol. 43:53–59.
Camata, R. P., Atwater, H. A., and Flagan, R. C. (2001). Space-Charge Effectsin Nanoparticle Processing Using the Differential Mobility Analyzer. J.Aerosol Sci. 32:583–599.
Chen, D. R., and Pui, D. Y. H. (1997). Numerical Modeling of the Performanceof Differential Mobility Analyzers for Nanometer Aerosol Measurements.J. Aerosol Sci. 28:985–1004.
Chen, D. R., Pui, D. Y. H., Hummes, D., Fissan, H., Quant, F. R., and Sem,G. J. (1998). Design and Evaluation of a Nanometer Aerosol DifferentialMobility Analyzer (Nano-DMA). J. Aerosol Sci. 29:497–509.
Cheng, Y. S. (2002). Condensation Detection and Diffusion Size SeparationTechniques, in Aerosol Measurement: Principles, Techniques, and Applica-tions, P. A. Baron, and K. Willeke, eds., John Wiley & Sons, New York.
Eichler, T., de Juan, L., and Fernandez de la Mora, J. (1998). Improvement ofthe Resolution of TSI’s 3071 DMA via Redesigned Sheath Air and AerosolInlets. Aerosol Sci. Technol. 29:39–49.
Fernandez de la Mora, J. (2011). Sub-3 nm Aerosol Measurement with DMAsand CNCs, in Aerosol Measurement: Principles, Techniques, and Applica-tions, P. Kulkarni, P. A. Baron, and K. Willeke, eds., John Wiley & Sons,New York.
Fernandez de la Mora, J., and Attoui, M. (2007). A DMA Covering the 1–100nm Particle Size Range with High Resolution Down to 1 nm. EuropeanAerosol Conference. Salzburg, Austria.
Fernandez de la Mora, J., de Juan, L., Eichler, T., and Rosell, J. (1998). Dif-ferential Mobility Analysis of Molecular Ions and Nanometer Particles.Trac-Trends in Anal. Chem. 17:328–339.
Fernandez de la Mora, J., Thomson, B. A., and Gamero-Castano, M. (2005).Tandem Mobility Mass Spectrometry Study of Electrosprayed TetraheptylAmmonium Bromide Clusters. J. Am. Soc. Mass Spectrom. 16:717–732.
Fissan, H., Hummes, D., Stratmann, F., Buscher, P., Neumann, S., Pui, D. Y.H., and Chen, D. (1996). Experimental Comparison of Four DifferentialMobility Analyzers for Nanometer Aerosol Measurements. Aerosol Sci.Technol. 24:1–13.
Fissan, H., Pocher, A., Neumann, S., Boulaud, D., and Pourprix, M. (1998).Analytical and Empirical Transfer Functions of a Simplified Spectrometrede Mobilite Electrique Circulaire (SMEC) for Nano Particles. J Aerosol Sci.29:289–293.
Flagan, R. C. (1998). History of Electrical Aerosol Measurements. Aerosol Sci.Technol. 28:301–380.
Flagan, R. C. (1999). On Differential Mobility Analyzer Resolution. AerosolSci. Technol. 30:556–570.
Gormley, P. G., and Kennedy, M. K. (1949). Diffusion from a Stream Flowingthrough a Cylindrical Tube. Proc. R. Ir. Acad. A52:163–169.
Graetz, L. (1885). On the Heat Capacity of Fluids. Annalen der Physik.25:337–357.
Heim, M., Attoui, M., and Kasper, G. (2007). Performance and Characteriza-tion of a High Flow, High-Resolution DMA: Particle Losses and FiltrationEfficiency Measurments for Particles Below 20 nm. European Aerosol Con-ference. Salzburg, Austria.
Heim, M., Attoui, M., and Kasper, G. (2010). The Efficiency of DiffusionalParticle Collection onto Wire Grids in the Mobility Equivalent Size Rangeof 1.2–8 nm. J. Aerosol Sci. 41:207–222.
Heim, M., Wild, M., and Kasper, G. (2005). Asymmetric Flow Effects in Vienna-Type Differential Mobility Analyzers. European Aerosol Conference. Ghent,Belgium.
Herrmann, W., Eichler, T., Bernardo, N., and Fernandez de la Mora, J. (2000).Turbulent Transition Arises at Reynolds Number 35,000 in a Short ViennaType DMA with a Large Laminarization Inlet. AAAR Annual Conference.St. Louis, USA.
Hewitt, G. (1957). The Charging of Small Particles for Electrostatic Precipita-tion. AIEE Trans. 76:300–307.
Iida, K., Stolzenburg, M., McMurry, P., Dunn, M. J., Smith, J. N., Eisele, F., andKeady, P. (2006). Contribution of Ion-Induced Nucleation to New ParticleFormation: Methodology and Its Application to Atmospheric Observationsin Boulder, Colorado. J. Geophys. Res. Atmospheres. 111:D23201.
Iida, K., Stolzenburg, M. R., and McMurry, P. H. (2009). Effect of Working Fluidon Sub-2 nm Particle Detection with a Laminar Flow Ultrafine CondensationParticle Counter. Aerosol Sci. Technol. 43:81–96.
Jokinen, V., and Makela, J. M. (1997). Closed-Loop Arrangement with CriticalOrifice for DMA Sheath Excess Flow System. J Aerosol Sci. 28:643–648.
Karlsson, M. N. A., and Martinsson, B. G. (2003). Methods to Measure andPredict the Transfer Function Size Dependence of Individual DMAs. J.Aerosol Sci. 34:603–625.
Knutson, E. O., and Whitby, K. T. (1975). Aerosol Classification by ElectricMobility: Apparatus, Theory, and Applications. J. Aerosol Sci. 6:443–451.
Kousaka, Y., Okuyama, K., Adachi, M., and Mimura, T. (1986). Effectof Brownian Diffusion on Electrical Classification of Ultrafine Aerosol-Particles in Differential Mobility Analyzer. J. Chem. Eng Japan 19:401–407.
Ku, B. K., and Fernandez de la Mora, J. (2009). Relation between ElectricalMobility, Mass, and Size for Nanodrops 1–6.5 nm in Diameter in Air.Aerosol Sci. Technol. 43:241–249.
Larriba, C., Hogan Jr, C. J., Attoui, M., Borrajo, R., Garcia, J. F., and Fernandezde la Mora, J. (2011). The Mobility-Volume Relationship below 3.0 nmExamined by Tandem Mobility-Mass Measurement. Aerosol Sci. Technol.45:453–467.
Li, W. L., Li, L., and Chen, D. R. (2006). Technical Note: A New DeconvolutionScheme for the Retrieval of True DMA Transfer Function from TandemDMA data. Aerosol Sci. Technol. 40:1052–1057.
Liu, B. Y. H., and Pui, D. Y. H. (1974). A Submicron Aerosol Standard andthe Primary, Absolute Calibration of the Condensation Nuclei Counter. J.Colloid Interface Sci. 47:155–171.
Martinsson, B. G., Karlsson, M. N. A., and Frank, G. (2001). Methodology toEstimate the Transfer Function of Individual Differential Mobility Analyz-ers. Aerosol Sci. Technol.35:815–823.
Mesbah, B. (1994). Le Spectrometre de Mobilite Electrique Circulaire S.M.E.C.Theorie, Performances et Applications—Contamination Controlee des Sur-faces Granulometrie de l’aerosol fin, Universite Paris XII, Paris.
Ooghe, M., Mesbah, B., Pourprix, M., and Boulaud, D. (1994). Radial Flow Dif-ferential Mobility Analyzer (RF-DMA). International Aerosol Conference.Los Angeles, USA, p. 463.
Park, K., Dutcher, D., Emery, M., Pagels, J., Sakurai, H., Scheckman, J., Qian, S.,Stolzenburg, M. R., Wang, X., Yang, J., and McMurry, P. H. (2008). TandemMeasurements of Aerosol Properties—A Review of Mobility Techniqueswith Extensions. Aerosol Sci. Technol. 42:801–816.
Downloaded By: [California Institute of Technology] At: 16:35 28 February 2011
492 J. JIANG ET AL.
Reineking, A., and Porstendorfer, J. (1986). Measurements of Particle LossFunctions in a Differential Mobility Analyzer (Tsi, Model 3071) for Differ-ent Flow-Rates. Aerosol Sci. Technol. 5:483–486.
Rogak, S. N., Flagan, R. C., and Nguyen, H. V. (1993). The Mobility andStructure of Aerosol Agglomerates. Aerosol Sci. Technol. 18:25–47.
Rosell-Llompart, J., Loscertales, I. G., Bingham, D., and Fernandez de la Mora,J. (1996). Sizing Nanoparticles and Ions with a Short Differential MobilityAnalyzer. J. Aerosol Sci. 27:695–719.
Rosser, S., and Fernandez de la Mora, J. (2005). Vienna-Type DMA of HighResolution and High Flow Rate. Aerosol Sci. Technol. 39:1191–1200.
Steiner, G., Attoui, M., Wimmer, D., and Reischl, G. P. (2010). A Medium Flow,High-Resolution Vienna DMA Running in Recirculating Mode. Aerosol Sci.Technol. 44:308–315.
Stolzenburg, M. (1988). An Ultrafine Aerosol Size Distribution Measuring Sys-tem. University of Minnesota Twin Cities, Minneapolis.
Stolzenburg, M., and McMurry, P. (1988). TDMAFIT User’s Manual. Universityof Minnesota, Minneapolis.
Stolzenburg, M. R., and McMurry, P. H. (2008). Equations Governing Singleand Tandem DMA Configurations and a New Lognormal Approximation tothe Transfer Function. Aerosol Sci. Technol. 42:421–432.
Stratmann, F., Kauffeldt, T., Hummes, D., and Fissan, H. (1997). DifferentialElectrical Mobility Analysis: A Theoretical Study. Aerosol Sci. Technol.26:368–383.
Tammet, H. (1995). Size and Mobility of Nanometer Particles, Clusters, andIons. J. Aerosol Sci. 26:459–475.
Tanaka, H., and Takeuchi, K. (2003). Experimental Transfer Function for aLow-Pressure Differential Mobility Analyzer by Use of a MonodisperseC-60 Monomer. J. Aerosol Sci. 34:1167–1173.
Ude, S., and Fernandez de la Mora, J. (2005). Molecular Monodisperse Mobilityand Mass Standards from Electrosprays of Tetra-Alkyl Ammonium Halides.J. Aerosol Sci. 36:1224–1237.
Winklmayr, W., Reischl, G. P., Lindner, A. O., and Berner, A. (1991). A NewElectromobility Spectrometer for the Measurement of Aerosol Size Dis-tributions in the Size Range from 1 to 1000 Nm. J. Aerosol Sci. 22:289–296.
Zhang, S. H., Akutsu, Y., Russell, L., Flagan, R. C., and Seinfeld, J. H. (1994).Radial Differential Mobility Analyzer. International Aerosol Conference.Los Angeles, USA, p. 465.
Zhang, S. H., Akutsu, Y., Russell, L. M., Flagan, R. C., and Seinfeld, J. H. (1995).Radial Differential Mobility Analyzer. Aerosol Sci. Technol. 23:357–372.
Zhang, S. H., and Flagan, R. C. (1996). Resolution of the Radial DifferentialMobility Analyzer for Ultrafine Particles. J. Aerosol Sci. 27:1179–1200.
Zhao, J., Eisele, F. L., Titcombe, M., Kuang, C., and McMurry, P. H. (2010).Chemical Ionization Mass Spectrometric Measurements of AtmosphericNeutral Clusters Using the Cluster-CIMS. J. Geophys. Res. Atmospheres.115:D08205.
Downloaded By: [California Institute of Technology] At: 16:35 28 February 2011