62
AF ablation guided by spatio temporal dispersion of EGM Dr Clément BARS Hôpital saint Joseph-Marseille-France 02-03-2107
| Date post: | 13-Mar-2018 |
| Category: |
Documents |
| Upload: | truongngoc |
| View: | 217 times |
| Download: | 2 times |
AF ablation guided by spatiotemporal dispersion of EGM
Dr Clément BARS
Hôpital saint Joseph-Marseille-France
02-03-2107

Disclosure
Speaker name: Dr Clément BARS
.................................................................................
I have the following potential conflicts of interest to report:
Consulting: Abbott, Biosense Webster
Shareholder of a healthcare company: Volta Medical
Visual appraisal of the sequence and morphology of intracardiac
electrograms is sufficient to guide ablation of most arrhythmias, Atrial
fibrillation is an exception to this paradigm so far.
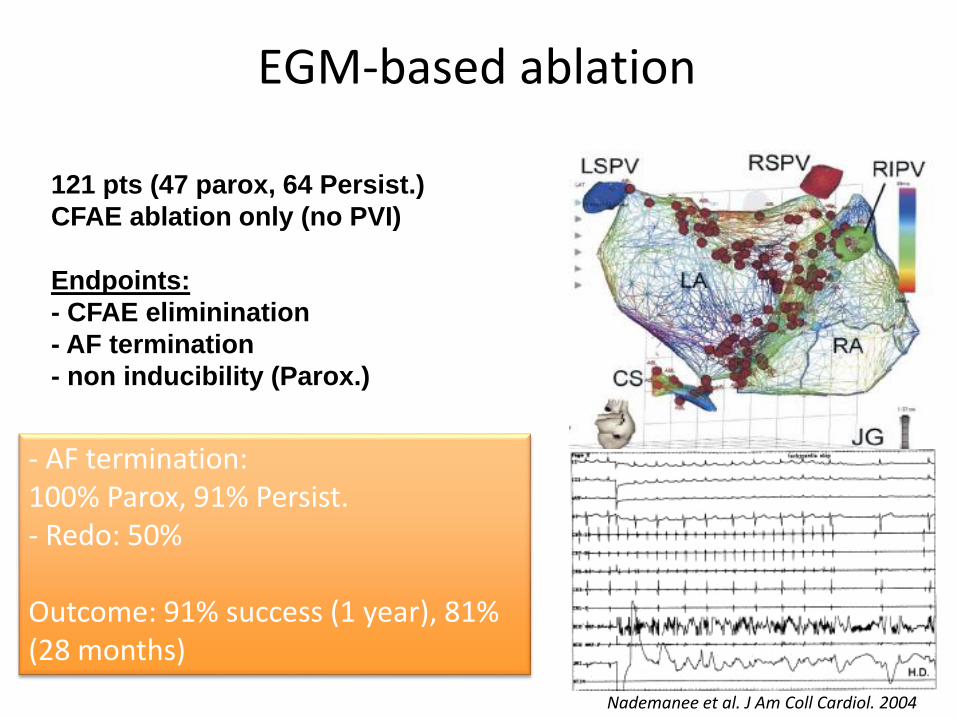
Nademanee et al. J Am Coll Cardiol. 2004
EGM-based ablation
121 pts (47 parox, 64 Persist.)
CFAE ablation only (no PVI)
Endpoints:
- CFAE eliminination
- AF termination
- non inducibility (Parox.)
- AF termination: 100% Parox, 91% Persist.- Redo: 50%
Outcome: 91% success (1 year), 81% (28 months)

~ 50% Freedom from AF/AT after multiple procedureswith or without AA drugs
Averaged results (589 patients , no statistical difference between techniques): Fr
eed
om
AF/
AT
1 p
roce
du
reo
r m
ore
Verma et al. NEJM 2015
~ 50 %
PVI for persitent & LS-persistent AF:

Multipolar mapping of AFSeveral authors have specifically pointed out that fractionation occurring ina non-simultaneous fashion at neighboring electrode locations (timedispersion) and organized in well-defined clusters (spatial dispersion) may
indicate the presence of an underlying source of AF.
Jaïs P, Haïssaguerre et al. PACE 1996;19:1998–2003.
Rostock et al. Heart Rhythm Soc. 2006;3:27–34
Takahashi , O’Neill et al. JACC. Vol. 51, No. 10, 2008
Haïssaguerre, Hocini et al. Circulation 2006;113:616–625.
Narayan et al. Heart Rhythm Soc. 2011;8:244–253.
Ganesan, Ghoraani et al. Heart Rhythm december 2013
Jadidi, Arentz et al. Circ. Arrhythm.Electrophysiol. 2016;9:e002962. 2016

• How extensive are these regions of STD in patients in Afib?
• What would happen should weablate the STD areas

Julien Seitz*, MD; Clément Bars* y, MD; Guillaume Théodorez, MD;
Sylvain Beurtheret*, MD; Nicolas Lellouchex, MD, PHD; Michel
Bremondy*, MD; Ange Ferracci*, MD; Jacques Faure*; Guillaume
Penarandaj j ; Masatoshi Yamazaki{; Uma Mahesh R. Avula{, MD;
Laurence Curel*, MS; Sabrina Siame* Omer Berenfeld{, PHD;
André Pisapia*, MD; Jérôme Kalifa{, MD, PHD.
Wholly Patient-tailored Ablation of Atrial Fibrillation Guided by Spatio-Temporal
Dispersion of Electrograms in the Absence of Pulmonary Veins Isolation

Source of Funding:
The study was not funded by industry and received no financial support.
Dr Masatoshi Yamazaki was supported by Grant-in-Aid for Scientific Research (C): 15K09077 and Joint International Research: 15KK0341.
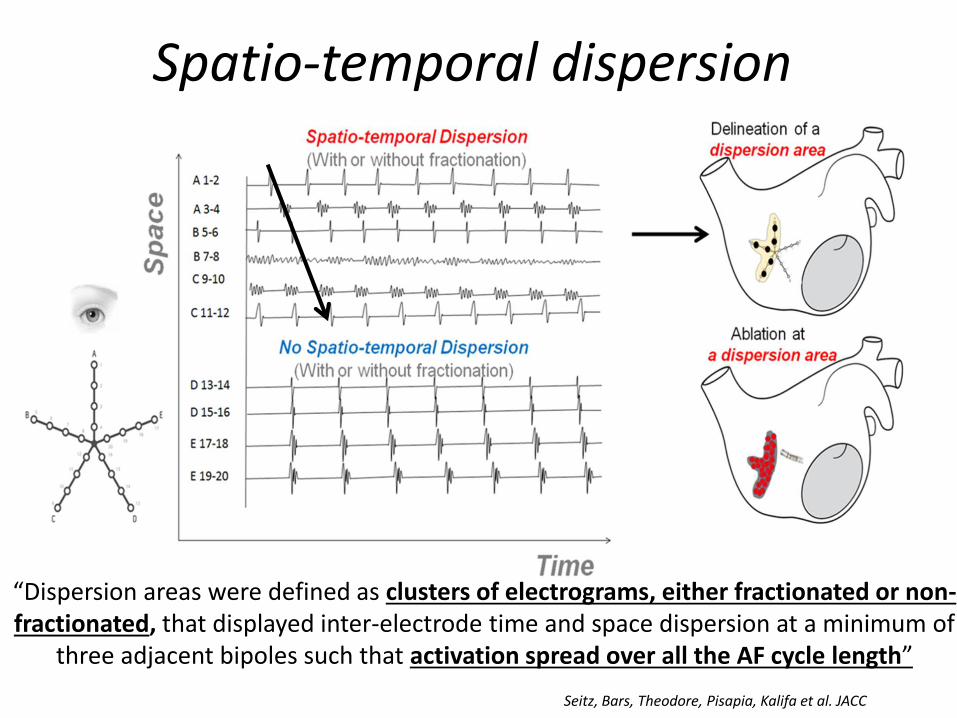
Spatio-temporal dispersion
“Dispersion areas were defined as clusters of electrograms, either fractionated or non-fractionated, that displayed inter-electrode time and space dispersion at a minimum of
three adjacent bipoles such that activation spread over all the AF cycle length”
Seitz, Bars, Theodore, Pisapia, Kalifa et al. JACC

Example of EGMs from dispersion regions
Reentry like patternReentry like pattern
*
*: Nademanee et al. JACC 2004 Seitz, Bars, Theodore, Pisapia, Kalifa et al. JACC

You may find non fractionated EGMs within dispersion regions and to the oposite fractionated EGMs within non dispersion regions
f: fractionated EGM
Seitz, Bars, Theodore, Pisapia, Kalifa et al. JACC

f: fractionated EGM
Seitz, Bars, Theodore, Pisapia, Kalifa et al. JACC

f: fractionated EGM
Seitz, Bars, Theodore, Pisapia, Kalifa et al. JACC

Substrate HDClinical study
Objectives
• Determine whether spatio temporaldispersion morphologies may enable theidentification of AF drivers regions.
• Demonstrate that spatio temporal dispersionregions are effective target sites for AFablation.
Seitz, Bars, Theodore, Pisapia, Kalifa et al. JACC
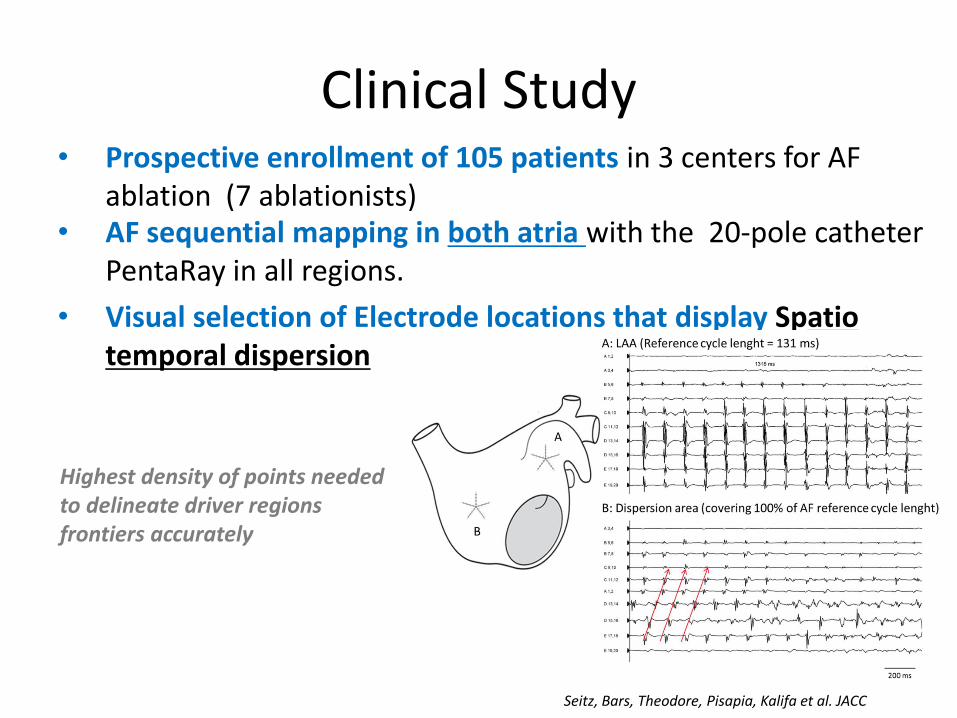
Clinical Study• Prospective enrollment of 105 patients in 3 centers for AF
ablation (7 ablationists)• AF sequential mapping in both atria with the 20-pole catheter
PentaRay in all regions.
• Visual selection of Electrode locations that display Spatiotemporal dispersion
Highest density of points neededto delineate driver regionsfrontiers accurately
Seitz, Bars, Theodore, Pisapia, Kalifa et al. JACC

• Ablation at dispersion regions (10-45W). • If two ablated areas were very close (<1cm) they were connected by RF applications.
• No probabilistic ablation (no PVI or lines)
• Ablation endpoints : AF termination, SR conversion acutely, and freedom from AF/AT (after 18 mo-follow-up with or without AA drugs).
• Same approach for redo
Biatrial Dipersion map
Seitz, Bars, Theodore, Pisapia, Kalifa et al. JACC

Study population (n=105)Validation set
(n=47)p
Age (years), mean ± SD 63 ±11 58±11 0.0046
Male, n (%) 80 (76.2%) 35 (74%) 0.8191
AF type
Paroxysmal AF, n (%) 24 (22.8%) 9 (19,2%) 0,6
Non-paroxysmal AF, n (%) 81 (77,2%) 38(80,8%) 0,6
Maximum sustained AF duration (months), mean + SD 12.2 ± 20 19.4±31.6 0.2457
Structural heart disease, n(%) 38 (36%) 14 (35%) 0.4665
Hypertension, % 48(45,7%) 20 (42,5%) 0.5217
Diabetes, % 13(12.4%) 5(10,6%) 0,5995
LA diameter (mm),mean ± SD 45,6± 7,6 42,4±12,4 0,09
LVEF (%), median mean ± SD 52 ± 11 54 ± 12 0,2082
Amiodarone before ablation, % 32% NA
Spontaneous AF at the beginning of procedure
(persistent and longstanding persistent AF only), n65 NA
LS-Pers. = 30
Prior AF ablation 0 0
(80,2% of the non PAF)
LAA CL (ms) 182[164-203] NAnon PAF: 174[157-200]
Pers+LS pers=14 ±21LS pers=33 ±27

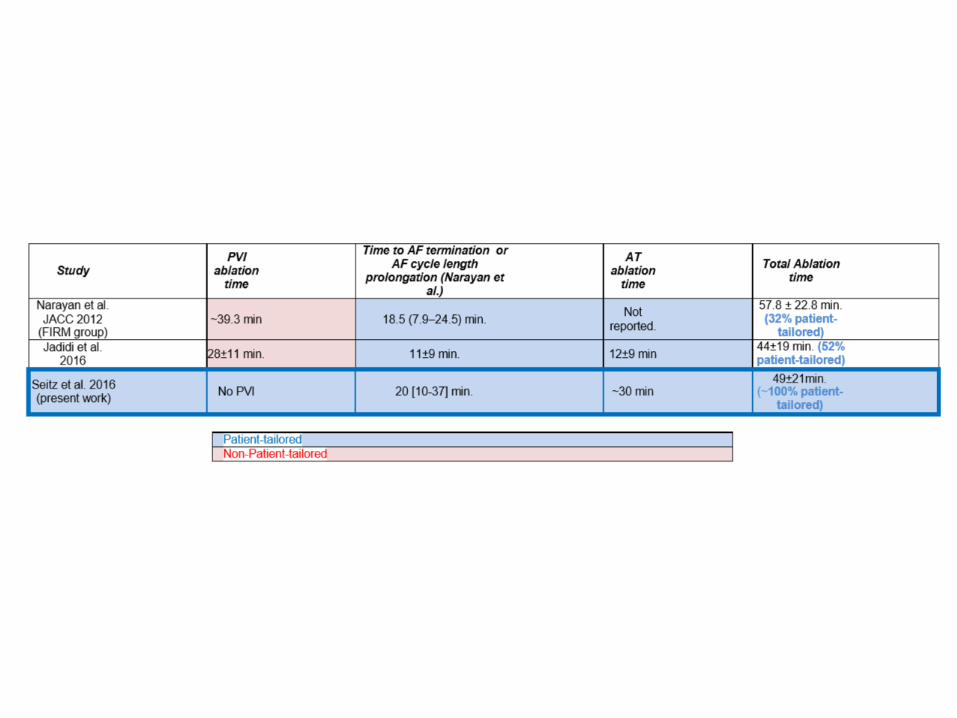
RF= 20 min
RF time = 49±21 minutes Non extensive ablation: Ablated surface= 17±10%
LA surface and 10±5 % biatrial surface
(77%)
Persitent & LS Persistent: AF termination= 95% & SR conversion = 72%LS persistrent: AF termination = 90%, SR conversion = 53%
Procedural outcome
Seitz, Bars, Theodore, Pisapia, Kalifa et al. JACC
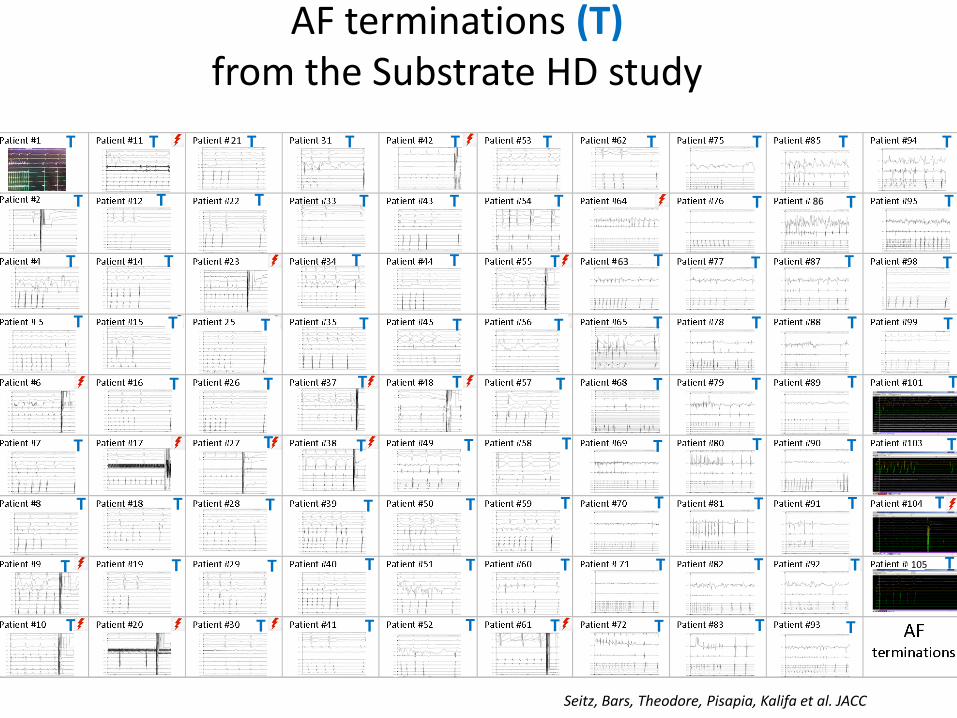
AF terminations (T)from the Substrate HD study
T T T T T T T TT T
T T T T
TT T T
T
T T T T T
T
T
T
TTT
T TT
T T T
TTTTTT
T
T T T T T T
T
T
T
TTTTT
T T T T
TTTT
T
TT
T
T
T
T T
T
T
T
T
T
T
T
T
T T
T
63
86
105
21
Seitz, Bars, Theodore, Pisapia, Kalifa et al. JACC
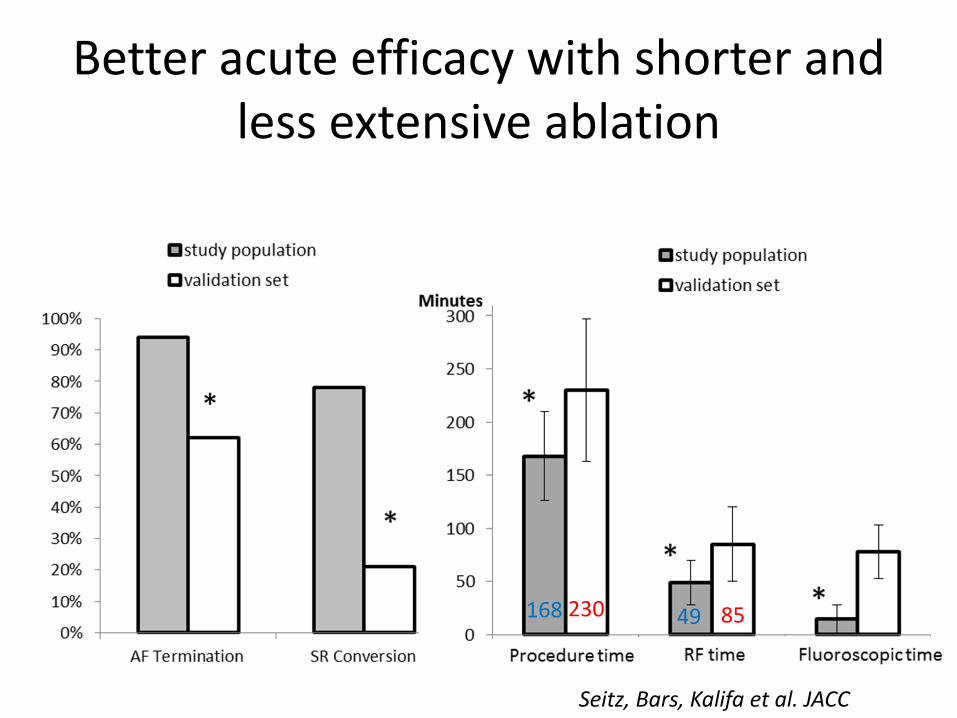
Better acute efficacy with shorter and less extensive ablation
49 85168 230
Seitz, Bars, Kalifa et al. JACC
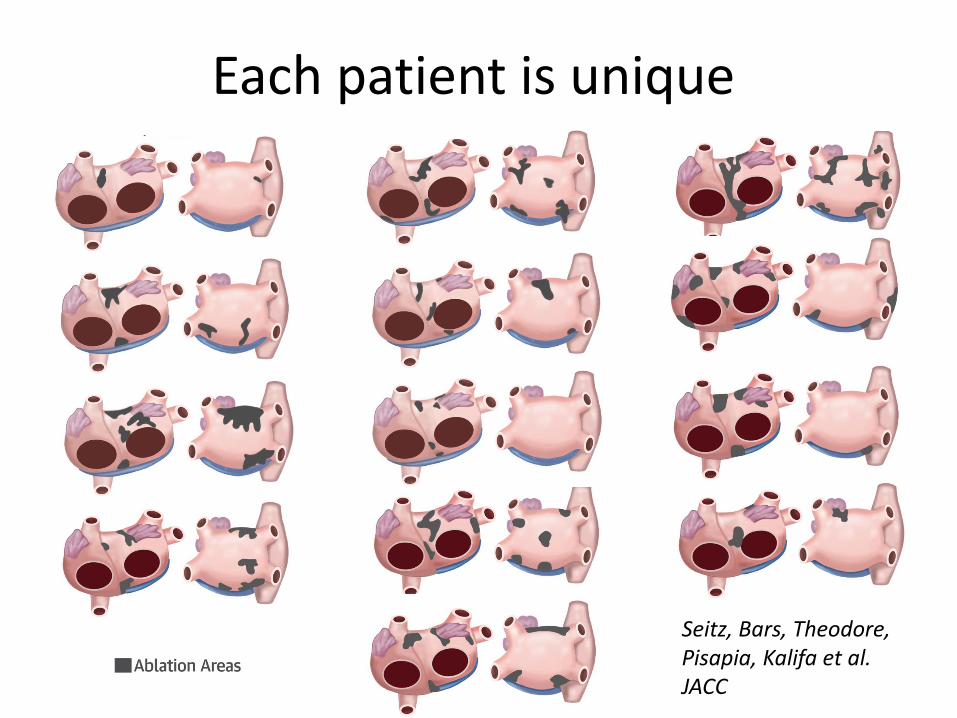
Each patient is unique
Seitz, Bars, Theodore, Pisapia, Kalifa et al. JACC

Af ter 1 procedure, there w ere no di f ferences in AF
recurren ce or AF/AT recurrence rates betw een the
paroxysmal, persistent , and longstanding persistent
groups: respect ively, 21%, 8%, and 10% (log-rank
p ¼ 0.24) and 29%, 53%, and 43% (log-rank p ¼ 0.15).
Af ter 1.4 0.5 procedures per pat ien t , there also w ere
no di f ferences in AF/AT recurrence rates betw een the
paroxysmal, persistent , and longstanding persistent
groups, respect ively: 17%, 16%, and 13%; log-rank
p ¼ 0.9. Redo procedures w ere performed for orga-
nized ATs in 75.6% of pat ients. Redo procedures
w ere signi fi cant ly shorter in durat ion than the index
procedu res and required less RF and fl uoroscopy
t imes (Table 4). Except for 1 pericardial ef fusion, no
T A B L E 2 Sur f ace Area
Al l Pat ient s
(N ¼ 43)
Paroxysmal
(n ¼ 15)
Persist ent
(n ¼ 17)
LS Persist ent
(n ¼ 11) p Value
Dispersion areas
Total dispersion area surface, cm2
Mean SD 22.5 13.5 18 10 17 9 41 12 < 0.0001
Median (IQR) 19 (12.5–33) 17 (13–22) 15 (11–19) 40 (32–50)
Mean dispersion area surface, cm2
Mean SD 5 2 5 2 4 1.5 6 2 0 .0025
Median (IQR) 4.5 (3–6) 4.5 (3.4–6.0 ) 3.2 (2.9–5.6) 6.0 (4.9–8.2)
Number of dispersion areas
Mean SD 5 1.5 4 1.7 5 1.2 6 1 0 .02
Median (IQR) 5 (4–6) 4 (3–5) 5 (4–5) 6 (5–7)
Ablat ion in the RA
RA ablated surface, cm2
Mean SD 6 5 4 5 5 3 9 7 0.03
Median (IQR) 4.5 (2–7) 3 (0–4) 5 (2–6) 7 (4–15)
RA total surface, cm2
Mean SD 154 58 138.3 71.0 138.9 36.5 196.5 50 .2 0 .003
Median (IQR) 150 (122–184) 129 (121–186) 135 (117–169) 186 (167–220)
Percent of RA ablated surface
Mean SD 4 2.5 3.8 3 4.2 3 4.0 2.5 0 .90
Ablat ion in the LA
LA ablated surface, cm2
Mean SD 25.5 15.7 20 .5 10 .5 16.5 6 46 13.5 < 0 .0001
Median (IQR) 20 .6 (15–35.5) 19 (14–27) 17 (11–21) 40 (36–56)
LA total surface, cm2
Mean SD 157 47 139 44 167 53 165.5 35 0 .18
Median (IQR) 156 (135–171) 153 (114–164) 156 (135–172) 165 (152–175)
Percent of LA ablated surface
Mean SD 17 10 15.8 8.8 10 .1 4.0 29 9.7 < 0 .0001
Ablat ion in both atria
Biat rial total surface, cm2
Mean SD 302 85 266 97.5 296 53 361 82.5 0 .06
Median (IQR) 312 (257–350) 288 (207–331) 293 (273–322) 340 (320–398)
Bi-at rial total ablated surface, cm2
Mean SD 31 19 25 12 21 7.0 55 17.5 < 0 .0001
Median (IQR) 24.5 (18–39.5) 21 (17–39) 20 (16–23) 50 (42–74)
Percent of biat rial ablated surface, cm2
Mean SD 10 5 10 4 7.5 2.5 15 4 0 .0005
IQR ¼ interquart ile range; LA ¼ left at rial/at rium; LS¼ longstanding; RA ¼ right atrial/at rium.
T A B L E 3 Dist r ibut ion of Disper sion Areas
Regions
Dispersion Areas*
(% of Pat ient s)
Left pulmonary veins and left appendage 79
Right pulmonary veins and posterior
interat rial groove
78
Inferior and posterior LA 73
Upper half of RA and appendage 42
Lower half of RA 31
Anterior LA and roof 77
Anterior interat rial groove 77
*For each atrial subregion, the percentage indicates the proport ion of pat ients in
whom at least 1 dispersion area was counted.
Abbreviat ions as in Table 2.
Seitz et al. J A CC V O L . 6 9 , N O . 3 , 2 0 17
Spat iotemporal Dispersion in AF J A N U A RY 2 4 , 2 0 17 : 3 0 3 –2 1
310
Author's Personal Copy
Af ter 1 procedure, there w ere no di f ferences in AF
recurren ce or AF/AT recurrence rates betw een the
paroxysmal , persistent , and longstanding persistent
groups: respect ively, 21%, 8%, and 10% (log-rank
p ¼ 0.24) and 29%, 53%, and 43% (log-rank p ¼ 0.15).
Af ter 1.4 0.5 procedures per pat ien t , there also w ere
no di f ferences in AF/AT recurrence rates betw een the
paroxysmal , persistent , and longstanding persistent
groups, respect ively: 17%, 16%, and 13%; log-rank
p ¼ 0.9. Redo procedures w ere performed for orga-
nized ATs in 75.6% of pat ients. Redo procedures
w ere signi fi cant ly shorter in durat ion than the index
procedu res and required less RF and fl uoroscopy
t imes (Table 4). Except for 1 pericardial ef fusion, no
T A B L E 2 Sur f ace Area
All Pat ient s
(N ¼ 43)
Paroxysmal
(n ¼ 15)
Persist ent
(n ¼ 17)
LS Persist ent
(n ¼ 11) p Value
Dispersion areas
Total dispersion area surface, cm2
Mean SD 22.5 13.5 18 10 17 9 41 12 < 0.0001
Median (IQR) 19 (12.5–33) 17 (13–22) 15 (11–19) 40 (32–50)
Mean dispersion area surface, cm2
Mean SD 5 2 5 2 4 1.5 6 2 0 .0025
Median (IQR) 4.5 (3–6) 4.5 (3.4–6.0 ) 3.2 (2.9–5.6) 6.0 (4.9–8.2)
Number of dispersion areas
Mean SD 5 1.5 4 1.7 5 1.2 6 1 0 .02
Median (IQR) 5 (4–6) 4 (3–5) 5 (4–5) 6 (5–7)
Ablat ion in the RA
RA ablated surface, cm2
Mean SD 6 5 4 5 5 3 9 7 0.03
Median (IQR) 4.5 (2–7) 3 (0–4) 5 (2–6) 7 (4–15)
RA total surface, cm2
Mean SD 154 58 138.3 71.0 138.9 36.5 196.5 50 .2 0 .003
Median (IQR) 150 (122–184) 129 (121–186) 135 (117–169) 186 (167–220)
Percent of RA ablated surface
Mean SD 4 2.5 3.8 3 4.2 3 4.0 2.5 0 .90
Ablat ion in the LA
LA ablated surface, cm2
Mean SD 25.5 15.7 20 .5 10 .5 16.5 6 46 13.5 < 0 .0001
Median (IQR) 20 .6 (15–35.5) 19 (14–27) 17 (11–21) 40 (36–56)
LA total surface, cm2
Mean SD 157 47 139 44 167 53 165.5 35 0 .18
Median (IQR) 156 (135–171) 153 (114–164) 156 (135–172) 165 (152–175)
Percent of LA ablated surface
Mean SD 17 10 15.8 8.8 10 .1 4.0 29 9.7 < 0 .0001
Ablat ion in both atria
Biat rial total surface, cm2
Mean SD 302 85 266 97.5 296 53 361 82.5 0 .06
Median (IQR) 312 (257–350) 288 (207–331) 293 (273–322) 340 (320–398)
Bi-at rial total ablated surface, cm2
Mean SD 31 19 25 12 21 7.0 55 17.5 < 0 .0001
Median (IQR) 24.5 (18–39.5) 21 (17–39) 20 (16–23) 50 (42–74)
Percent of biat rial ablated surface, cm2
Mean SD 10 5 10 4 7.5 2.5 15 4 0 .0005
IQR ¼ interquart ile range; LA ¼ left at rial/at rium; LS ¼ longstanding; RA ¼ right at rial/at rium.
T A B L E 3 Dist r ibut ion of Disper sion Areas
Regions
Dispersion Areas*
(% of Pat ient s)
Left pulmonary veins and left appendage 79
Right pulmonary veins and posterior
interat rial groove
78
Inferior and posterior LA 73
Upper half of RA and appendage 42
Lower half of RA 31
Anterior LA and roof 77
Anterior interat rial groove 77
*For each atrial subregion, the percentage indicates the proport ion of pat ients in
whom at least 1 dispersion area was counted.
Abbreviat ions as in Table 2.
Seitz et al. J A CC V O L . 6 9 , N O . 3 , 2 0 17
Spat iotemporal Dispersion in AF J A N U A RY 2 4 , 2 0 17 : 3 0 3 – 2 1
310
Author's Personal Copy


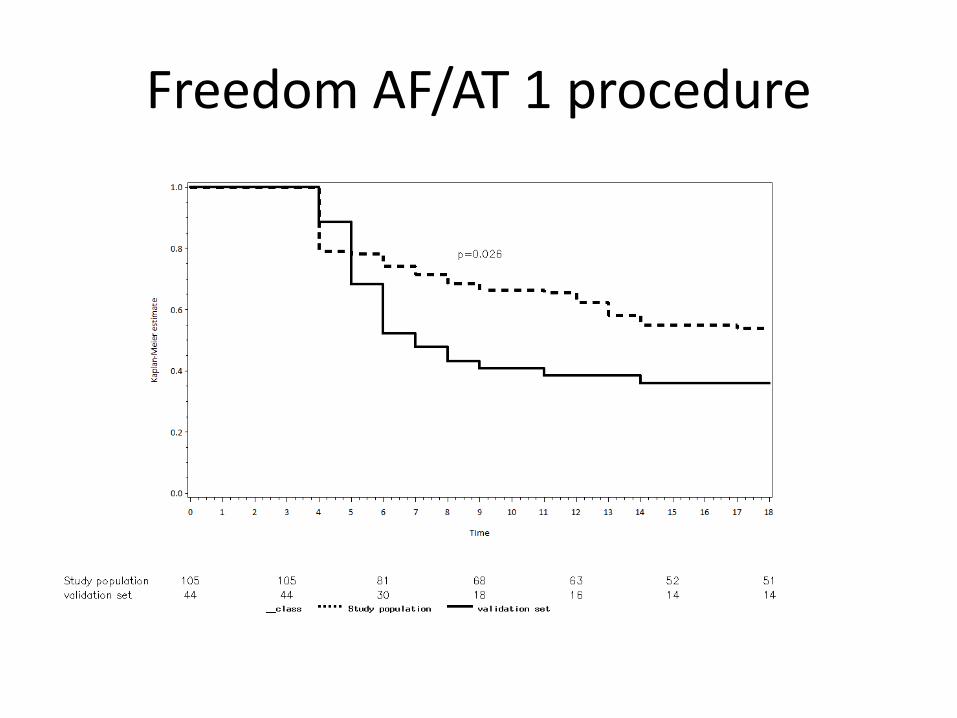
18 month-follow up
Completed in 91% of the patients: follow-up visits and 24-hour Holter ,
7days holter-monitor/ PM-ICD memories in 20 pts
Seitz, Bars, Theodore, Pisapia, Kalifa et al. JACC

Free
do
mfr
om
AF/
AT
1 p
roce
du
re/p
atie
nt
with or without AA drugs
18 month-FU: 55% free from AF/AT after 1 procedure
After initial procedure,Re-do procedures were
performed for organized ATs in 75.6% of the
patients.
Seitz, Bars, Kalifa et al. JACC

18 month-FU: 85% free from AF/ATafter 1,4 procedure/patient
Free
do
mfr
om
AF/
AT
1,4
±0
,5 p
roce
du
re/p
atie
nt
with or without AA drugs
Persitent & LS persitent AF: 85 % free from AF/AT
Seitz, Bars, Theodore, Pisapia, Kalifa et al. JACC

Atrial fibrillation &
Atrial tachycardias….
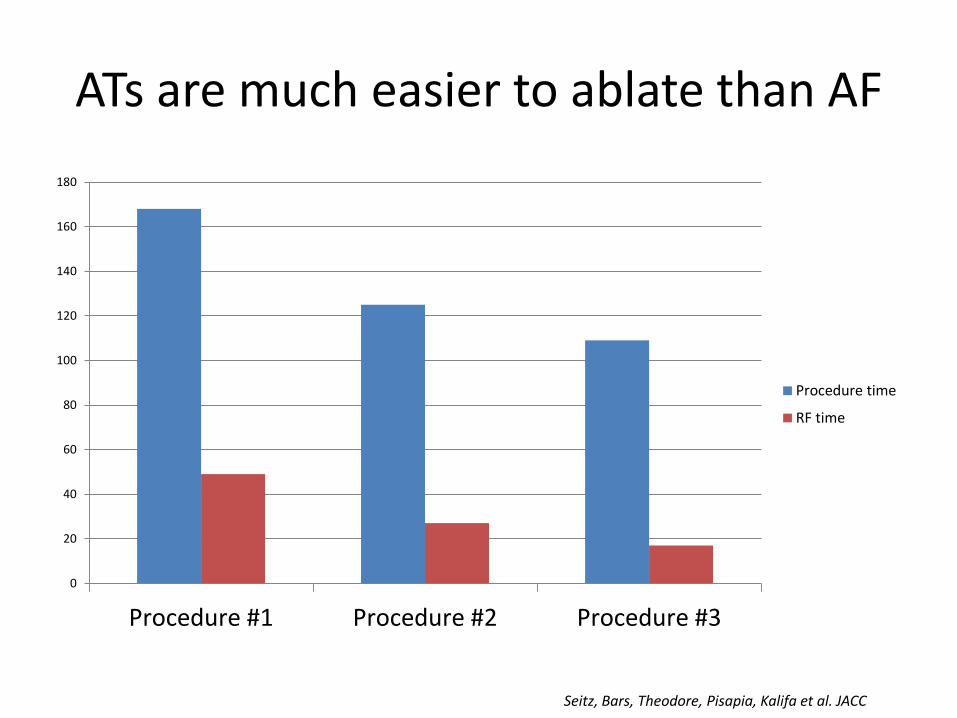
0
20
40
60
80
100
120
140
160
180
Procedure #1 Procedure #2 Procedure #3
Procedure time
RF time
ATs are much easier to ablate than AF
Seitz, Bars, Theodore, Pisapia, Kalifa et al. JACC
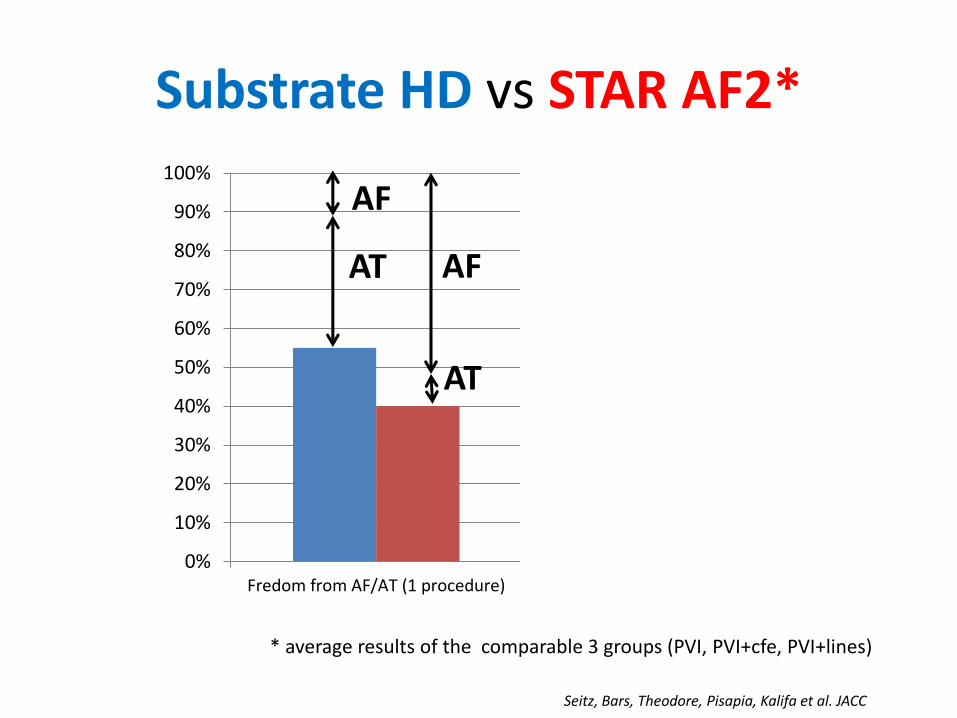
Substrate HD vs STAR AF2*
0%
10%
20%
30%
40%
50%
60%
70%
80%
90%
100%
Fredom from AF/AT (1 procedure) Fredom from AF/AT (1 procedure ormore)
Freedom from AF (1 procedure)
* average results of the comparable 3 groups (PVI, PVI+cfe, PVI+lines)
AT
AF
AF
AT
Seitz, Bars, Theodore, Pisapia, Kalifa et al. JACC

Conclusion
• The clustering of intra-cardiac electrogramsexhibiting spatio-temporal dispersion may guide a wholly patient-tailored ablation for AF especially for persistent AF.
• AF termination =95% within ~ 20 min of RF.
• Using this approach, Redo procedure are mostly performed for Atrial tachycardias recurrences that are much easier to ablate than AF what led to promising long term results. Freedom from AF/AT at 18 mo-FU =85% (1,4 procedure /pt)
Seitz, Bars, Theodore, Pisapia, Kalifa et al. JACC
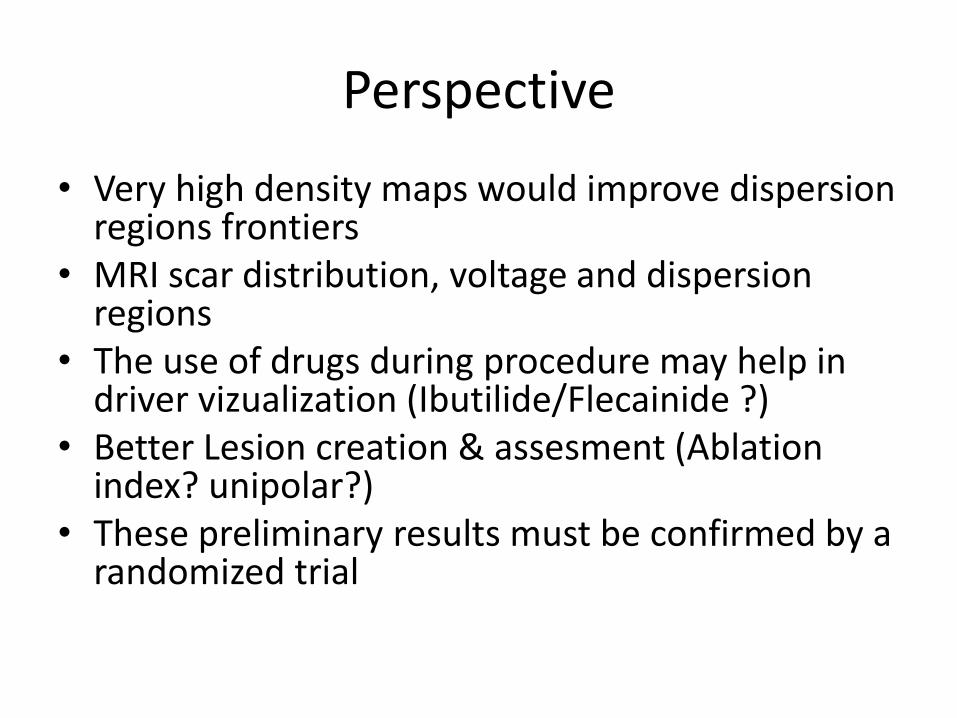
Perspective
• Very high density maps would improve dispersion regions frontiers
• MRI scar distribution, voltage and dispersion regions
• The use of drugs during procedure may help in driver vizualization (Ibutilide/Flecainide ?)
• Better Lesion creation & assesment (Ablation index? unipolar?)
• These preliminary results must be confirmed by a randomized trial

THANK YOU!

LAA CL Driver CL
Non driver
CL
ContinuousCFE in driver
regions
Global voltage <0,5 mV in
driver regions
Takayashi et al.JACC 2008 167 ms 166 ms* 182 ms yes yes
Haissaguerre et al. Circ 2014 NA 185 ms 189 ms yes No (0,8 mV)
Jadidi et al. Circ ep 2016 168 ms NA NA yes yesSeitz et al. JACC 2017
(PAF excluded) 174 ms 165 ms* 190 ms yes yes*: CL significantly shorter than in non driver regions
Majority of AF CLIn driver regions
yes
yes
yes
yes
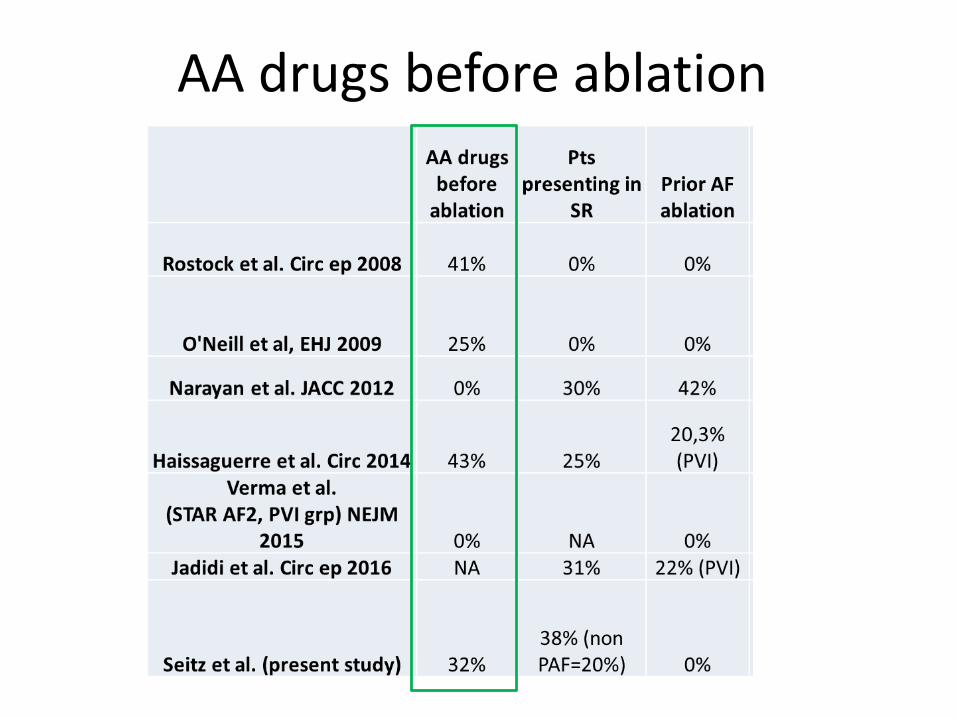
AA drugs before ablation

Freedom from AF/AT 1 procedure
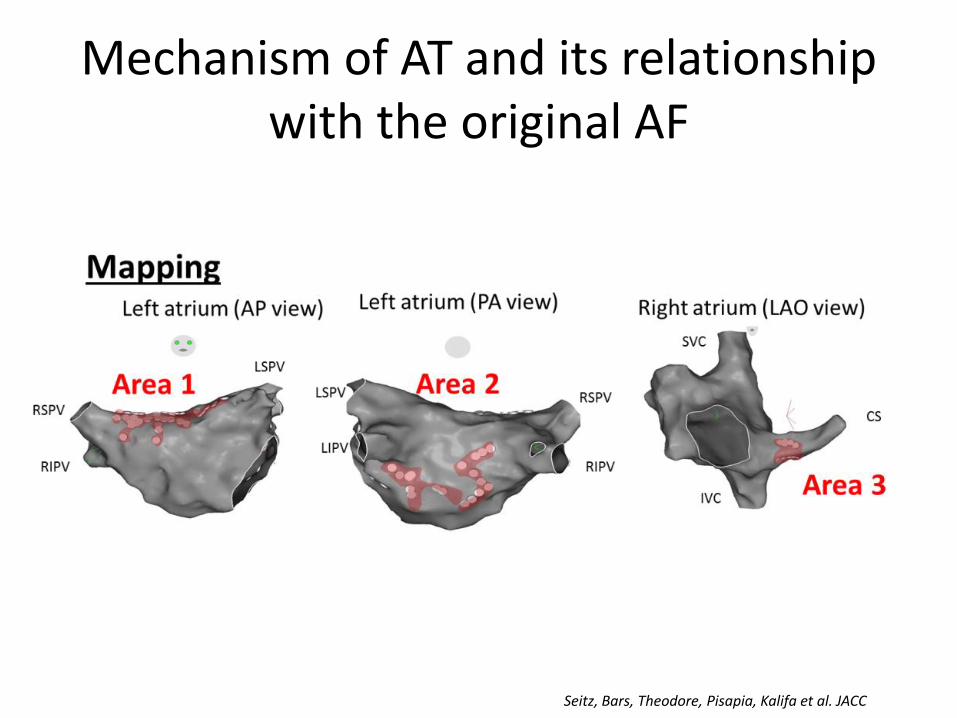
Mechanism of AT and its relationship with the original AF
Seitz, Bars, Theodore, Pisapia, Kalifa et al. JACC

The 2 ATs were located in dipersion areas non already ablated
Analysis in 21 patients: 44 ATs, 22 macroreentries & 22 localized
AT (88,6% in non- ablated areas).
Importantly 17/22 (77,3%) localized ATs arose from dispersion regions that were
not previously ablated!
Seitz, Bars, Theodore, Pisapia, Kalifa et al. JACC

Since the majority of ATs arise from the dispersion regions that were not
previously ablated, it implies that such ATs may be part of AF substrate and were unmasked after the areas of fibrillatory conductions had been
ablated…
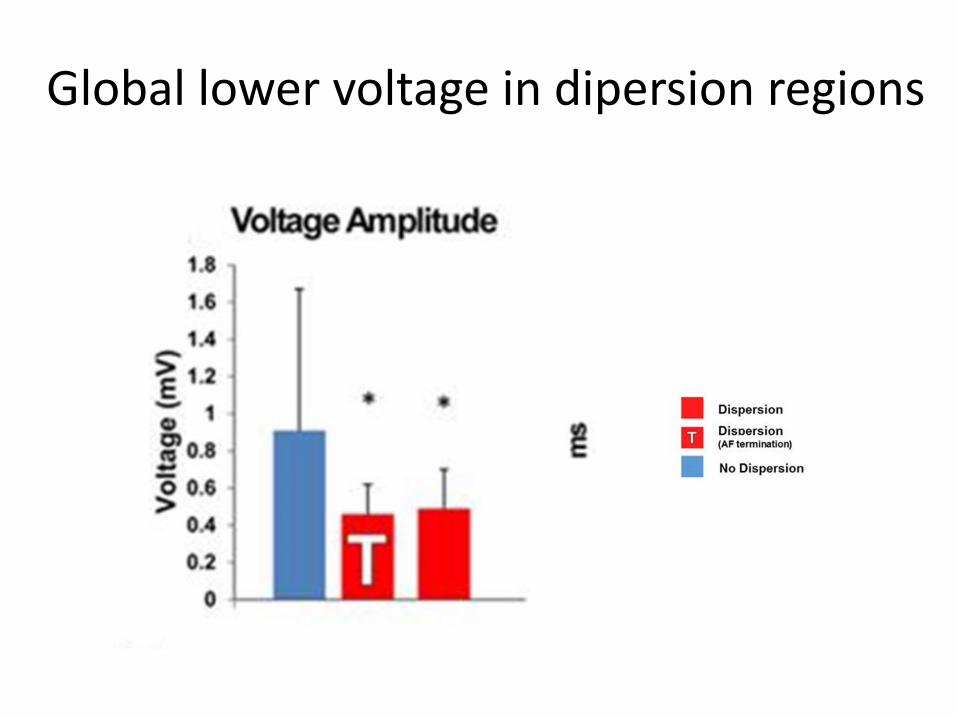
Global lower voltage in dipersion regions

Dispersion and Low voltage maps
• Biatrial Voltage maps (<0,5 mv) compared to dispersion maps in 43 patients:
- low voltage regions = 92,6 +/- 83,4 cm2
- Dispersion regions = 22,5 +/- 13,5 cm2
- 21 % of the dispersion regions exhibited lowvoltage
- 3,8% of the low voltage area exhibiteddispersion
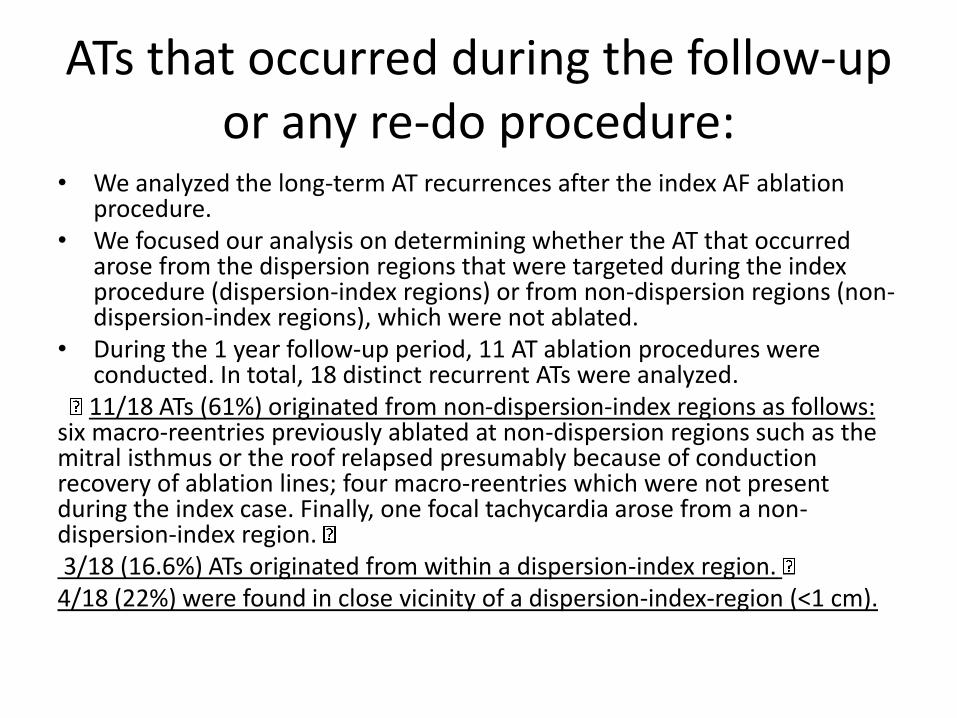
ATs that occurred during the follow-up or any re-do procedure:
• We analyzed the long-term AT recurrences after the index AF ablation procedure.
• We focused our analysis on determining whether the AT that occurred arose from the dispersion regions that were targeted during the index procedure (dispersion-index regions) or from non-dispersion regions (non-dispersion-index regions), which were not ablated.
• During the 1 year follow-up period, 11 AT ablation procedures were conducted. In total, 18 distinct recurrent ATs were analyzed.11/18 ATs (61%) originated from non-dispersion-index regions as follows:
six macro-reentries previously ablated at non-dispersion regions such as the mitral isthmus or the roof relapsed presumably because of conduction recovery of ablation lines; four macro-reentries which were not present during the index case. Finally, one focal tachycardia arose from a non-dispersion-index region. 3/18 (16.6%) ATs originated from within a dispersion-index region. 4/18 (22%) were found in close vicinity of a dispersion-index-region (<1 cm).
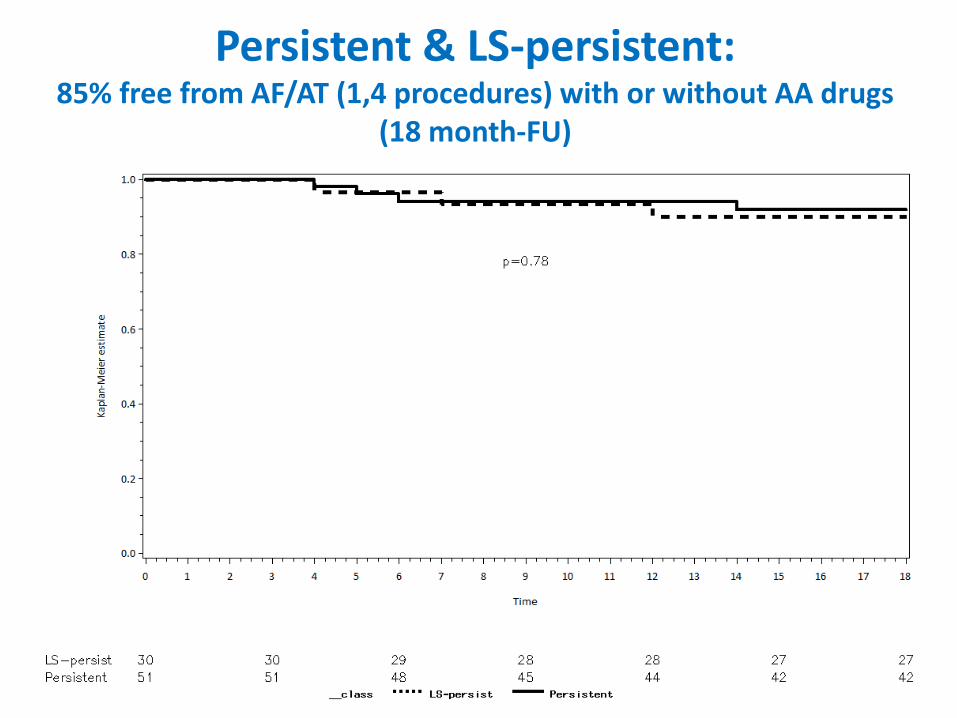
Persistent & LS-persistent:85% free from AF/AT (1,4 procedures) with or without AA drugs
(18 month-FU)

Freedom AF/AT 18 month-FU (1 procedure)
Conclusion
• Spatio-temporal dispersion of electrograms represents an electrical footprint of waves emanating from rapid fibrillatory drivers and propagating within a heterogeneous atrial muscle.
• The clustering of intra-cardiac electrograms exhibiting spatio-temporal dispersion may guide a wholly patient-tailored ablation of all types of AF especially for persistent AF.
• Atrial tachycardias may probably be part of AF substrate and are unmasked by ablation at dispersion regions
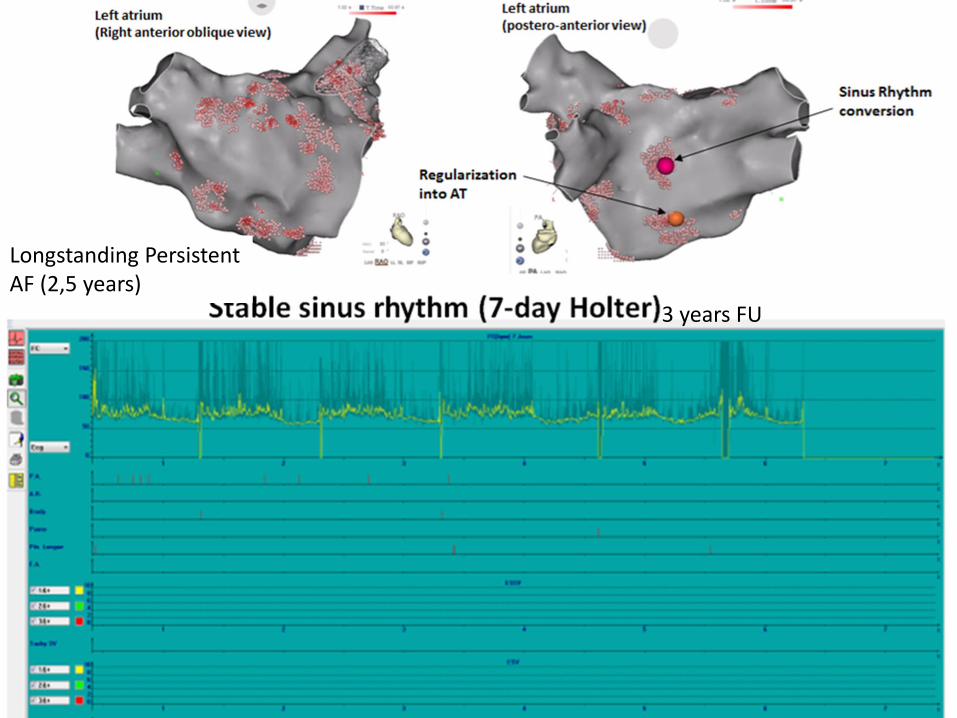
Longstanding Persistent AF (2,5 years)
3 years FU
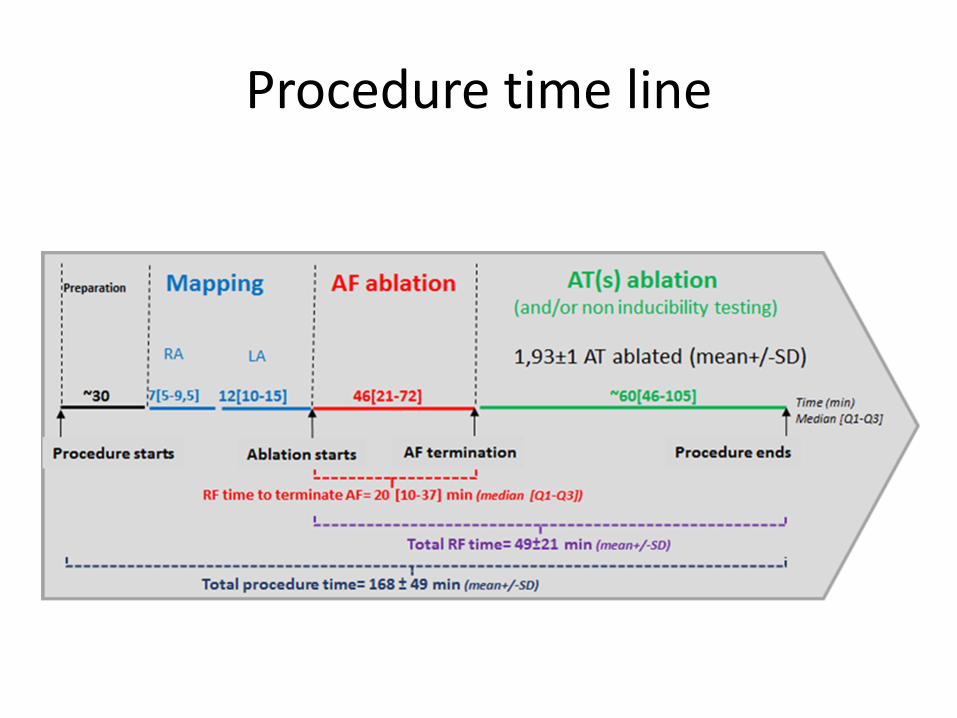
Procedure time line

Dispersion maps & CFAE maps
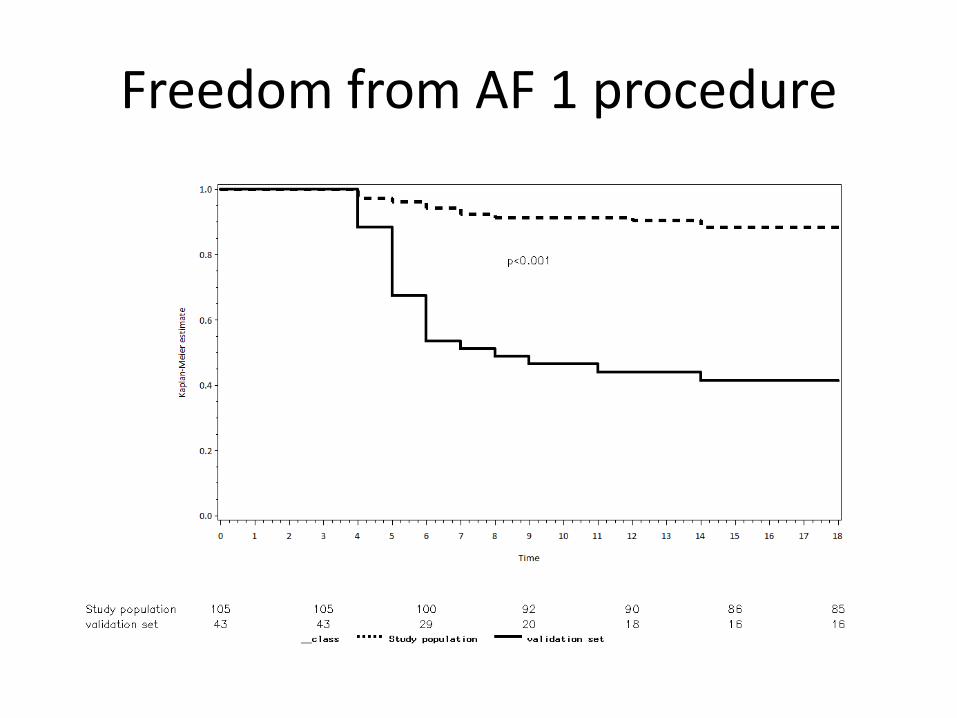
Freedom from AF 1 procedure
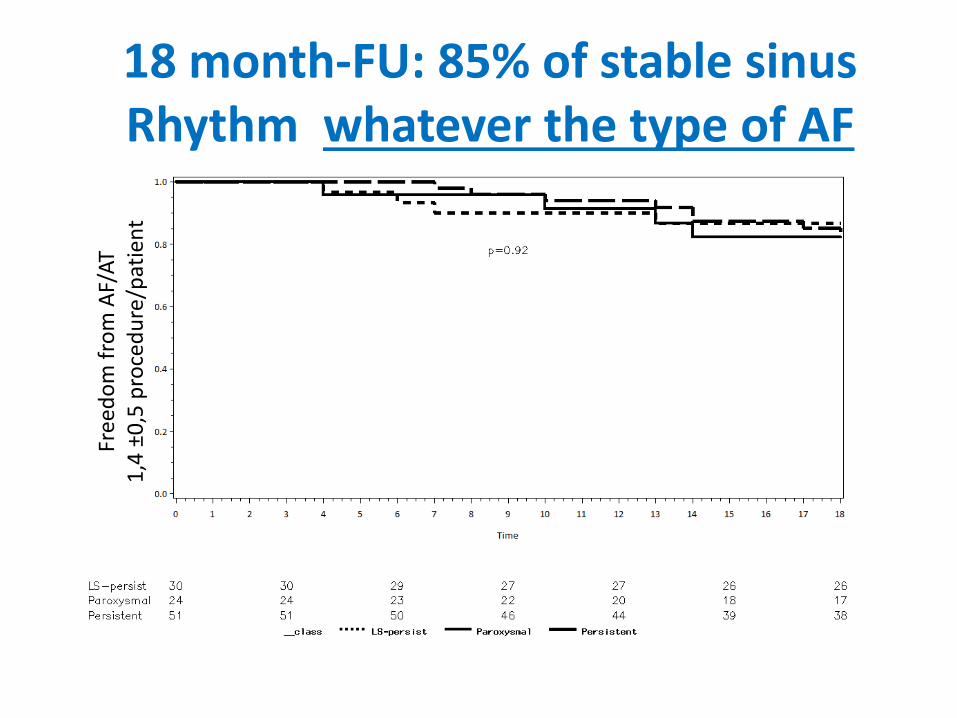
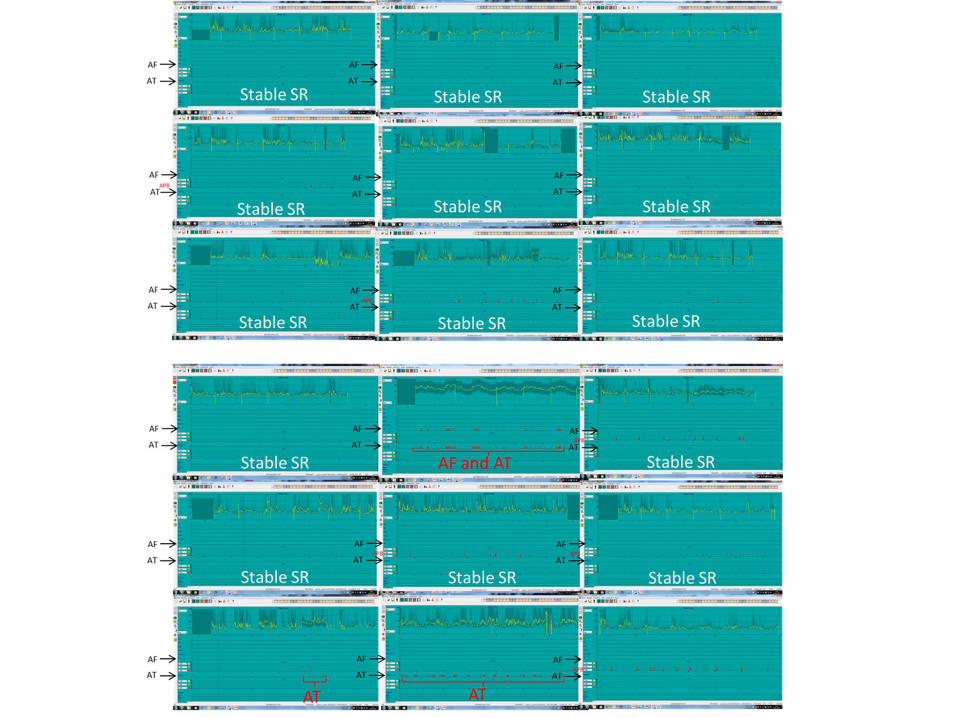
18 month-FU: 85% of stable sinus Rhythm whatever the type of AF
Free
do
mfr
om
AF/
AT
1,4
±0
,5 p
roce
du
re/p
atie
nt
Freedom AF/AT 1 procedure
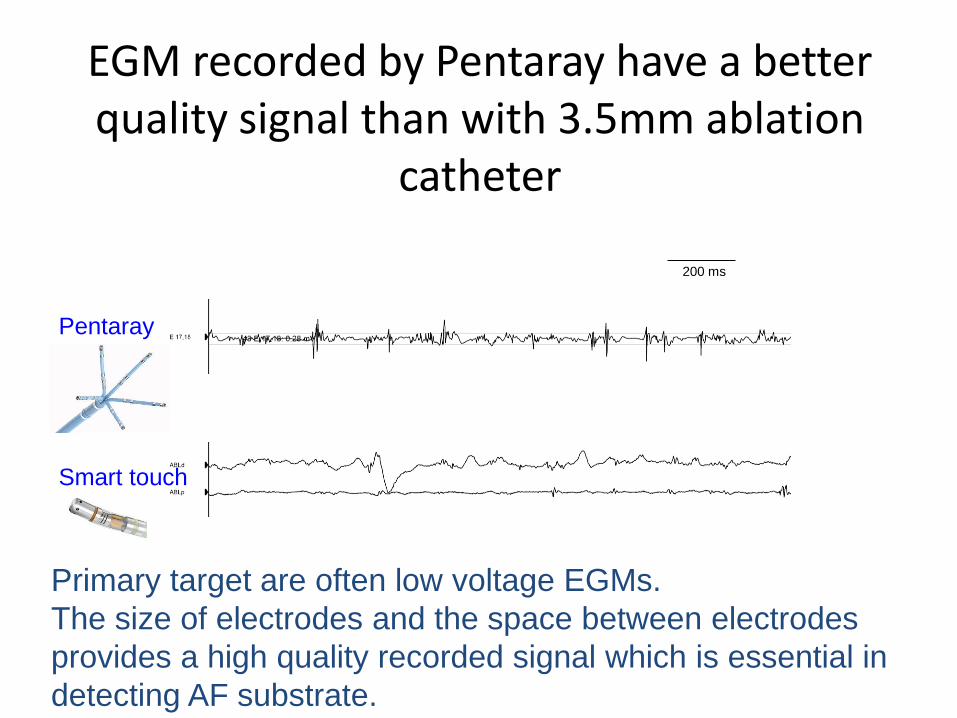
EGM recorded by Pentaray have a better quality signal than with 3.5mm ablation
catheter
200 ms
Pentaray
Primary target are often low voltage EGMs.
The size of electrodes and the space between electrodes
provides a high quality recorded signal which is essential in
detecting AF substrate.
Smart touch

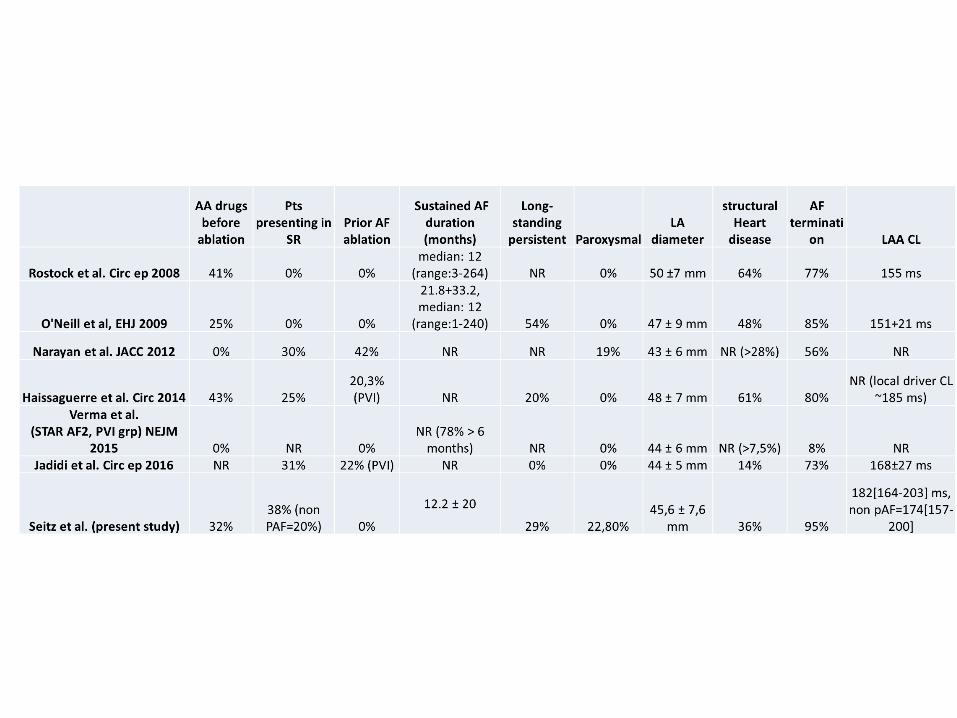
AA drugsbefore
ablation
Pts presenting in
SR Prior AF ablation
Sustained AF duration (months)
Long-standing
persistent ParoxysmalLA
diameter
Rostock et al. Circ ep 2008 41% 0% 0%median: 12
(range:3-264) NA 0% 50 ±7 mm
O'Neill et al, EHJ 2009 25% 0% 0%
21.8+33.2, median: 12
(range:1-240) 54% 0% 47 ± 9 mm
Narayan et al. JACC 2012 0% 30% 42% NA NA 19% 43 ± 6 mm
Haissaguerre et al. Circ 2014 43% 25%20,3% (PVI) NA 20% 0% 48 ± 7 mm
Verma et al. STAR AF2, PVI grp) NEJM
2015 0% NA 0%NR (78% > 6
months) NA 0% 44 ± 6 mmJadidi et al. Circ ep 2016 NA 31% 22% (PVI) NA 0% 0% 44 ± 5 mm
Seitz et al. (present study) 32%38% (non PAF=20%) 0%
12.2 ± 20
29% 22,80%45,6 ± 7,6
mm

4 ± 2 areas18 ±10 cm2
5 ± 1.5 areas17±9 cm2
6 ± 2 areas41±12 cm2
Overall patients:5 ± 2 areas
22.5±13.5 cm2
Dispersion regions characteristics


First name - last name

First name - last name

Substrate HDMechanistic study

Dispersion area abnormal electrograms exhibited a higher occurrence of single-bipolefractionated continuous signals, a reduced voltage & a significantly shorter cycle length.
Dispersion was stable (2,5 sec window) and spanned ~100% AFCL.
Electrograms characteristicsin dispersion regions
Analysis of 103 atrial regions in 20 patients
Seitz, Bars, Theodore, Pisapia, Kalifa et al. JACC (In press)


