130
MANAGEMENT REPORT

MANAGEMENT REPORT


MANAGEMENT REPORTEDPR 2016
Index
1
0918
The Company
EDP Renovaveis in Brief
2016 in Review
Organization 21
2
3344
Strategy
Business Environment
Business Plan
Risk Management 51
3 Execution
Economic 59Stakeholders 70Safety First 81Environment 82Innovation 84
4 Sustainability 87

RENEWABLE ENERGYAS THE NEWART

RENEWABLE ENERGYAS THE NEWART

03Desempenho
Temas Materiais Do Ano 63
Sustentabilidade Financeira 65
Actividades Produção De Electricidade 74Distribuição De Electricidade E Gás 78Comercialização De Electricidade E Gás 82
Ética Gestão De Reclamações Éticas 85Reforço Da Cultura Ética 86Anticorrupção 87Direitos Humanos 87Avaliação De Desempenho Ético 88
Inovação Abordagem À Inovação 88Iniciativas De Inovação 89
Ambiente Alterações Climáticas 92Gestão De Impactes Ambientais 96
Stakeholders 100Colaboradores 101Clientes 108Fornecedores 114Comunidade 118
Indicadores Complementares Incadores Ambientais 124Indicadores Socias 127Indicadores Económicos 131

MANAGEMENT REPORTEDPR 2016
1 The Company
EDP Renovaveis in Brief
Vision, Mission, Values and Commitments 09World Presence 10Business Description 12Stakeholder Focus 13Sustainability Roadmap 16
2016 in Review
Key Metrics Summary 18Share Performance 20
Organization
Shareholders 21Governance Model 22Organization Structure 26

WINDAS THE NEWART

WINDAS THE NEWART
16

9
MANAGEMENT REPORT EDPR 2016
1 The Company
1.1 EDP Renováveis in brief
1.1.1 VISION, MISSION, VALUES AND COMMITMENTS
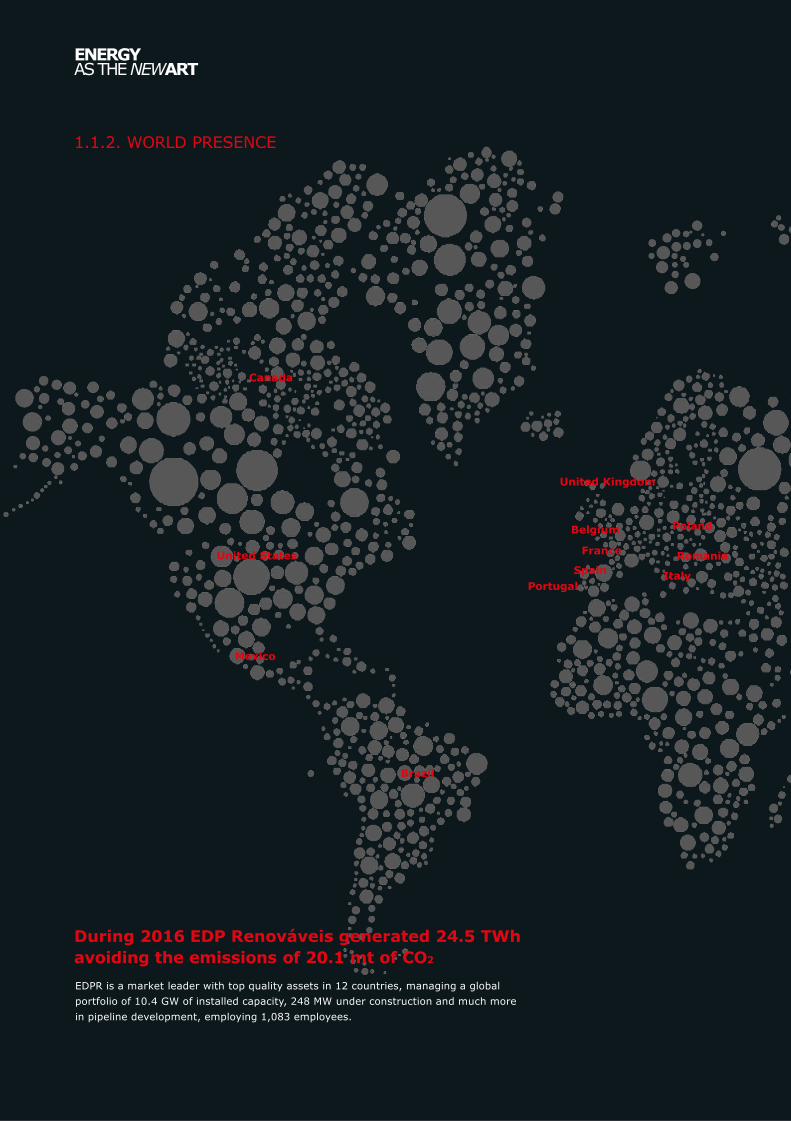
1.1.2. WORLD PRESENCE
Spain
Portugal
FranceRomania
Italy
Belgium Poland
United Kingdom
Brazil
Mexico
United States
Canada
During 2016 EDP Renováveis generated 24.5 TWh
avoiding the emissions of 20.1 mt of CO2
EDPR is a market leader with top quality assets in 12 countries, managing a global
portfolio of 10.4 GW of installed capacity, 248 MW under construction and much more
in pipeline development, employing 1,083 employees.
ENERGYASTHENEWART

EUROPE
Spain
373 employees
2,371 MW Operational
4,926 GWh generated
France
53 employees
388 MW Operational
777 GWh generated
+18 MW under construction
+430 MW offshore in pipeline
Belgium
2 employees
71 MW Operational
128 GWh generated
Poland
38 employees
418 MW Operational
951 GWh generated
Italy
23 employees
144 MW Operational
258 GWh generated
+127 MW in pipeline
with PPA
United States
410 employees
4,811 MW Operational
12,501 GWh generated
+100 MW under construction
+551 MW in pipeline with PPA
Canada
5 employees
30 MW Operational
75 GWh generated
+100 MW in pipeline
with PPA
Mexico
7 employees
200 MW Operational
Romania
32 employees
521 MW Operational
1,143 GWh generated
United Kingdom
34 employees
1.1 GW (max)
of offshore in pipeline
Portugal
72 employees
1,251 MW Operational
3,047 GWh generated
+3 MW under construction
NORTH AMERICA
BRAZIL
34 employees
204 MW Operational
666 GWh generated
+127 MW under construction
+140 MW in pipeline with PPA
MANAGEMENT REPORT EDPR 2016

12
1.1.3 BUSINESS DESCRIPTION
Our renewable energy business grossly comprises the development, construction and operation of fully controlled wind farms and solar plants to generate and delier clean electricity.

13
MANAGEMENT REPORT EDPR 2016
1.1.4. STAKEHOLDER FOCUS
EDP Renováveis, in line with the policies created by the EDP Group, is an innovative company concerning the way it manages the relations with its stakeholders. One of the company’s main objectives is to serve and engage with not only its investors and shareholders, but with the remaining stakeholders as well: employees, suppliers, communities and the media, among others. All of these translates into important relationships that impact the company’s performance.
Because of this vision, we aim to maintain and enhance an open and transparent dialogue with our stakeholders to build and strengthen trust, promote information and knowledge sharing, predict future challenges and identify opportunities for cooperation.
We have four main guiding commitments: Comprehend, Communicate, Collaborate and Trust. These are part of a comprehensive plan that involves all business areas and uses cross-functional tools.
We want to communicate cohesively with the various groups of stakeholders, regardless of the department they fall under. The image below lists the different stakeholders groups, using Spain as an example:

14
After surveying stakeholders’ perceptions and expectations, a whole new Stakeholder Management Plan was put in place aiming to satisfy those expectations by generating value, improving performance and minimizing possible risks to the business.
This year we started a series of initiatives aiming to improve performance beyond mere adequacy and to truly engage our different stakeholder groups in a convergent manner and with common practices and messages. For this purpose, it was necessary to change from a vision and management centered on departments or business units to a corporate, cross-functional, convergent model that offers coherence and synergy, secure alignment and promote the efficient use of resources.
Furthermore, a Stakeholder Steering Committee was created to establish the Stakeholders Management Plan, monitor progress and evaluate results. In addition, a Stakeholder Working Group, made up of members from different departments and units is in charge of enacting the committee’s plans, made the ideas operational and impactful.
In addition to soft indicators such as satisfaction, relations, credibility, important issues for each stakeholder, delivery and transparency, the Stakeholders Management Plan also includes new indicators, such as the degree of influence on business-related decision-making processes, as well as the relevance of issues for EDPR’s business. Therefore, the Stakeholders Management Plans for 2016 and beyond aim not only to improve perception, but also make an impact on the business. Technological tools, such as CRM (Customer Relations Management), will be used in stakeholders’ management in order to re-shape the way information is handled.
HOW CAN WE IMPACT EDPR’S BUSINESS ON A GLOBAL SCALE?
Following this pilot project for stakeholders management in the Spanish market, in the future we will conduct similar practices across all EDPR markets around the world. The goal is developing a global vision of the company’s relationships with stakeholders across its different locations in a transversal way.
Main communication channels
Media and all communication channels play a key role in managing the relations with the stakeholders. EDPR uses diverse channels to communicate with our stakeholders. In addition, to ensure continuous dialogue and a close relationship with them, EDPR aims to use the most effective channels to identify and manage expectations, minimizing and ensuring better control of the risks associated with each stakeholder group.
Following the first major stakeholder survey conducted in Spain, working groups were set up to put in action plan into practice across the company.

15
MANAGEMENT REPORT EDPR 2016
Through the Stakeholders Global Survey, EDPR works to identify areas of improvement with each particular group by analyzing which communication channels are mostly used with each stakeholder and which ones are the most effective.
In addition, data is collected to understand how much each media channel influence decisions, recommendations and business-related behaviors in a way that helps us managing them in order to generate value for the company in the future. Since communication channels will remain at the center of stakeholder management, all stakeholder’s leaders and managers are working together to produce coherent messages, align the strategy and constant monitoring.

ENERGYAS THE NEWART
ANNUAL REPORT EDPR 2016
1.1.5. SUSTAINABILITY ROADMAP
EDPR, as a renewable energy company, creates great expectations in its stakeholders about Sustainability. Responding to these expectations the company keeps committed to excel in all three pillars of sustainability- namely the economic, the environmental and the social - defining a strategy of best practices. Following a culture of continuous improvement, 10 Sustainability goals were defined within the 2016-2020 Business Plan.
United Nations Sustainable Development Goals (SDGs)
Sustainability Roadmap Strategic Lines(2016-20)
Execution 2016
Sustainability Roadmap Indicators(2016-20)
Decent Work and Economic Growth
Good Health and Well-being
Sustainable Cities and Communities
Industry, Innovation and Infrastructure
No Poverty
Zero Hunger
Quality Education
Reduced Inequalities
Peace, Justiceand Strong Institutions Gender Equality
Responsible Consumption and Production
Clean Water and Sanitation Life Below Water Life on Land
Affordable and Clean Energy Climate Action
• Installed capacity:700 MW /year• Avoided CO2:+10% (CAGR vs. 2015-20)• < 1% emitted / avoided CO2
• EBITDA:+8% (CAGR vs. 2015-20)• Net Profit:+16% (CAGR vs. 2015-20)• Core OPEX/MW:-1% (CAGR vs. 2015-20)
• 100% Certified MWs (ISO 14001)• 100% of critical suppliers with environmental
management system (EMS)
• Maintain hazardous wastes and used water per GWh ratios aligned with previous years
• > 90% Hazardous wastes recovered
• 100% Certified MWs (OHSAS 18001)• 100% of critical suppliers with H&S management system• Zero accidents mind-set
• Zero tolerance for unethical behaviors
• Stakeholders Plan development in all geographies
• c. €10m investments (incl. energy storage and offshore structures)
• >80% of employees in training activities• >40% of employees in volunteering activities
• c. €2.5m investment
1 Excluding non-recurrent items.2 In 2016 there was one communication to the Ethics Ombudsmen through the Ethics Channel. However, it was not considered as an issue related to the Ethics Code and it willbe suggested to be rejected during the next Committee Ethics. The issue has been submitted to the responsible area in order to be analyzed and take the corresponding measures.
• Added +770 MW in 2016• Avoided CO2:+7% in 2016• 0.2% emitted / avoided CO2
• Adj. EBITDA: +12%1 in 2016• Adj. Net Profit: -4%1 in 2016• -5% Core OPEX/MW in 2016
• 89% Certified MWs (ISO 14001) based on 2016 Installed Capacity• 88% critical suppliers with EMS
• 26 Kg./GWh and 0.76 l/MWh• 87% Hazardous wastes recovered
• 95% Certified MWs (OHSAS 18001) basedon 2016 Installed Capacity
• 83% critical suppliers with H&S management system
• One communication to the Ethics Ombudsman2
• Stakeholders execution plan in Spain
• c. €2m investment
• 100% of employees received training• 20% of employees participated in volunteering activities
• €602k investment in 2016
Maintain leadership position in RENEWABLE ENERGY PRODUCTION
Optimize ENVIRONMENTAL MANAGEMENT
Broaden and harmonize the mechanisms of periodic consultation of STAKEHOLDERS
Promote INNOVATION in operation and construction phases
Invest in employees DEVELOPMENT and ensure continued compromise with society through VOLUNTEERING
Support SOCIAL AND EDUCATIONALINITIATIVES through Fundación EDP
CREATE VALUE while maintaining a LOW RISK profile
Maintain CIRCULAR ECONOMY in the internal management of the operations
Ensure high SAFETY STANDARDS for employees and contractors
Ensure a high standard ETHICAL PROCESS
This roadmap brings together the three sustainability pillars and is laid down in 10 different areas: Operational growth, Risk controlling, Economic value creation, Environment, Value circle, People, Governance, Stakeholder Engagement,Innovation and Society. Defined goals make performance measurable to help drive the company as a growing leader in value creation, innovation and sustainability.
16 25

ENERGYAS THE NEWART
MANAGEMENT REPORTEDPR 2016
1.1.5. SUSTAINABILITY ROADMAP
EDPR, as a renewable energy company, creates great expectations in its stakeholders about Sustainability. Responding to these expectations the company keeps committed to excel in all three pillars of sustainability- namely the economic, the environmental and the social - defining a strategy of best practices. Following a culture of continuous improvement, 10 Sustainability goals were defined within the 2016-2020 Business Plan.
United Nations Sustainable Development Goals (SDGs)
Sustainability Roadmap Strategic Lines(2016-20)
Execution 2016
Sustainability Roadmap Indicators(2016-20)
Decent Work and Economic Growth
Good Health and Well-being
Sustainable Cities and Communities
Industry, Innovation and Infrastructure
No Poverty
ZeroHunger
Quality Education
Reduced Inequalities
Peace, Justiceand Strong Institutions Gender Equality
Responsible Consumption and Production
Clean Water and Sanitation Life Below Water Life on Land
Affordableand Clean Energy Climate Action
• Installed capacity:700 MW /year• Avoided CO2:+10% (CAGR vs. 2015-20)• < 1% emitted / avoided CO2
• EBITDA:+8% (CAGR vs. 2015-20)• Net Profit:+16% (CAGR vs. 2015-20)• Core OPEX/MW:-1% (CAGR vs. 2015-20)
• 100% Certified MWs (ISO 14001)• 100% of critical suppliers with environmental
management system (EMS)
• Maintain hazardous wastes and used water per GWhratios aligned with previous years
• > 90% Hazardous wastes recovered
• 100% Certified MWs (OHSAS 18001)• 100% of critical suppliers with H&S management system• Zero accidents mind-set
• Zero tolerance for unethical behaviors
• Stakeholders Plan development in all geographies
• c. €10m investments (incl. energy storage and offshore structures)
• >80% of employees in training activities• >40% of employees in volunteering activities
• c. €2.5m investment
1 Excluding non-recurrent items.2 In 2016 there was one communication to the Ethics Ombudsmen through the Ethics Channel. However, it was not considered as an issue related to the Ethics Code and it willbe suggested to be rejected during the next Committee Ethics. The issue has been submitted to the responsible area in order to be analyzed and take the corresponding measures.
• Increased 770 MW in 2016• Avoided CO2:+7% in 2016• 0.1% emitted / avoided CO2
• Adj. EBITDA: +12%1 in 2016• Adj. Net Profit: -4%1 in 2016• -5% Core OPEX/MW in 2016
• 89% Certified MWs (ISO 14001) based on 2016 Installed Capacity• 88% critical suppliers with EMS
• 26 Kg./GWh and 0.76 l/MWh• 87% Hazardous wastes recovered
• 95% Certified MWs (OHSAS 18001) basedon 2016 Installed Capacity
• 83% critical suppliers with H&S management system
• One communication to the Ethics Ombudsman2
• Stakeholders execution plan in Spain
• c. €2m investment
• 100% of employees received training• 20% of employees participated in volunteering activities
• €602k investment in 2016
Maintain leadership position in RENEWABLE ENERGY PRODUCTION
Optimize ENVIRONMENTAL MANAGEMENT
Broaden and harmonize the mechanisms of periodicconsultation of STAKEHOLDERS
Promote INNOVATION in operation and construction phases
Invest in employees DEVELOPMENT and ensure continued compromise with society through VOLUNTEERING
Support SOCIAL AND EDUCATIONALINITIATIVES through Fundación EDP
CREATE VALUE while maintaining a LOW RISK profile
Maintain CIRCULAR ECONOMY in the internalmanagement of the operations
Ensure high SAFETY STANDARDS for employees and contractors
Ensure a high standard ETHICAL PROCESS
This roadmap brings together the three sustainability pillars and is laid down in 10 different areas: Operational growth, Risk controlling, Economic value creation, Environment, Value circle, People, Governance, Stakeholder Engagement,Innovation and Society. Defined goals make performance measurable to help drive the company as a growing leader in value creation, innovation and sustainability.
24 17

ENERGYAS THE NEWART
1.2. 2016 in Review1.2.1. KEY METRICS SUMMARY
NEW ADDITIONS
+0.8GWEBITDA + Net Equity
NET DEBT
€2.8 billion-26% vs 2015
NET INCOME
€56m-66% vs 2015
EBITDA
€1,171m+3% vs 2015
97.7%+0.1p.p. vs 2015
TECHNICALAVAILABILITY
LOAD FACTOR
30%+1% vs 2015
10.4GWEBITDA + Net Equity
INSTALLEDCAPACITY
CAPEX
€1,029m+14% vs 2015
18

MANAGEMENT REPORTEDPR 2016
GENERATION
24.5 TWh+14% vs 2015
EMISSIONSAVOIDED
20.1 mt CO2+7% vs 2015
1,083EMPLOYEES
+6% vs 2015
100%employees trained
TRAINING95%
CAPACITYCERTIFIED
OHSAS 18001OPERATING CASH-FLOW
€869m+24% vs 2015
CORE OPEX/MWh
€16.3/MWh-8% vs 2015
19
41hrs/employee

20
1.2.2 SHARE PERFORMANCE
In 2016, EDPR share price closed at €6.04 with and average daily volume of 1.13 million shares.
EDPR has 872.3 million of shares listed and admitted to trading in NYSE Euronext Lisbon. On December 30th 2016 EDPR had a market capitalization of 5.3 billion euro, below than 6.3 billion euro at previous year-end, and equivalent to €6.04 per share. In 2016 total shareholder return was -16%, considering the dividend paid on May 16th of € 0.05 per share.
EDPR in Capital Markets 2016 2015 2014 2013 2012
Opening price (€) 7.25 5.404 3.86 3.99 4.73 Minimum price (€) 5.70 5.3 3.87 3.58 2.31 Maximum price (€) 7.28 7.25 5.7 4.36 4.86 Closing price (€) 6.04 7.25 5.4 3.86 3.99 Market capitalization (€ million) 5,265 6,324 4,714 3,368 3,484
Total traded volume: Listed & OTC (million) 291.07 289.22 396.84 448.15 446.02 …of which in NYSE Euronext Lisbon (million) 103.50 109.67 149.48 200.29 207.49 Average daily volume (million) 1.13 1.13 1.56 1.76 1.74 Turnover (€ million) 1,828.34 1,824.08 1,976.41 1,759.20 1,525.56 Average daily turnover (€ million) 7.11 7.13 7.75 6.9 5.96 Rotation of capital (% of total shares) 32% 33% 46% 51% 51% Rotation of capital (% of floating shares) 141% 148% 205% 229% 228%
Share price performance -17% 34% 40% -3% -16% Total shareholder return -16% 35% 41% -2% -16% PSI 20 -12% +11% -27% +16% +3% Dow Jones Eurostoxx Utilities -8% -5% +12% +9% -9%
1 EDPR informs about the Spanish renewable energy auction, 14-Jan 12 EDPR 1H16 Results release, 26-Jul 2 EDPR FY15 Volumes & Capacity Statement release, 26-Jan 13 EDPR secures PPA for new 200 MW wind farm in the US, 28-Jul
3 EDPR FY15 Annual Results release, 24-Feb 14 EDPR established new institutional partnership structure for 328 MW in the US,26-Sep
4 EDPR secures a new long term contract for 100 MW in Canada, 10-Mar 15 EDPR 9M16 Volumes & Capacity Statement release, 18-Oct
5 EDPR Annual Shareholders' Meeting, 14-Apr 16 EDPR concludes the sale of minority stakes in Poland and Italy, 27-Oct
6 EDPR executes an asset rotation transaction in Europe, 19-Apr 17 EDPR 9M Results Release, 03-Nov 7 EDPR 1Q16 Volumes & Capacity Statement release, 20-Apr 18 EDPR secures a 75 MW PPA for a new wind farm in the United States, 28-Nov
8 EDPR 1Q16 Results release, 04-May 19 EDPR established new institutional partnership structure for 101 MW in the US,14-Dec
9 EDP Group Capital Markets Day, 05-May 20 Changes on EDPR´s corporate bodies, 16-Dec 10 EDPR Payment of Dividends (€0.05 per share), 16-May 21 EDPR completed $343m funding of tax equity in the US, 20-Dec
11 EDPR 1H16 Volumes & Capacity Statement release, 12-Jul 22 EDPR was awarded long term contracts for 127 MW at the Italian wind auction,23-Dec
70
80
90
100
110
Dec-15 Feb-16 Apr-16 Jun-16 Aug-16 Oct-16 Dec-16
Indexed EDPR share performance vs. PSI20 & SX6E
EDPR PSI20 SX6E
‐17%
‐8%
‐12%
5.0
5.5
6.0
6.5
7.0
7.5
8.0
0.0 m
0.2 m
0.4 m
0.6 m
0.8 m
1.0 m
1.2 m
1.4 m
1.6 m
1.8 m
Dec-15 Feb-16 Mar-16 Apr-16 May-16 Jun-16 Jul-16 Aug-16 Sep-16 Oct-16 Nov-16 Dec-16
Sh
are
Pir
ce (
€)
Vo
lum
e (M
illio
ns)
VOLUME Last Price Events
8
6
7
2 14 13
15
4 12
5
16
21 19
18
22 20 3
1
17
10 11
9

21
MANAGEMENT REPORTEDPR 2016
1.3 Organization
1.3.1 SHAREHOLDERS
EDPR shareholders are spread across 23 countries. EDP (“Energias de Portugal”) is the major one holding 77.5% of the share capital since launching the company’s IPO in June 2008.
EDPR total share capital is, since its initial public offering (IPO) in June 2008, composed of 872,308,162 shares issued with a nominal value of five euros each, fully paid. All these shares are part of a single class and series and are admitted to trading on the NYSE Euronext Lisbon regulated market.
Major shareholder, the EDP Group The majority of the company’s share capital is owned by EDP Group, holding 77.5% of the share capital and voting rights, since launching the company’s IPO in June 2008. EDP Group is a vertically integrated utility company, the largest generator, distributor and supplier of electricity in Portugal, has significant operations in electricity and gas in Spain and is one of the largest private generation group in Brazil through its stake in Energias do Brasil. In the Iberian Peninsula, EDP is the third largest electricity generation company and one of the largest distributors of gas. EDP has a relevant presence in the world energy outlook, being present in 14 countries and close to 12,000 employees around the world. In 2016, EDP had an installed capacity of 25.2 GW, generating 70 TWh, of which 33% come from wind. EDP is part of sustainability indexes (DJSI World and Europe), following its performance in the economic, social and environmental dimensions. Its holding company, EDP SA, is a listed company whose ordinary shares are traded in the NYSE Euronext Lisbon since its privatization in 1997.
Other qualified shareholders Besides the qualified shareholding of EDP Group, MFS Investment Management - an American-based global investment manager formerly known as Massachusetts Financial Services - communicated to CNMV in September 2013 an indirect qualified position, as collective investment institution, of 3.1% in EDPR share capital and voting rights.
Broad base of investors EDPR has a broad base of international investors. Excluding EDP Group, EDPR shareholders comprise more than 65,000 institutional and private investors spread worldwide. Institutional investors represent about 92% of EDPR investor base (ex-EDP Group), while the remaining 8% stand private investors, most of whom are resident in Portugal. Within institutional investors, investment funds are the major type of investor, followed by sustainable and responsible funds (SRI). EDPR is a member of several financial indexes that aggregate top performing companies for sustainability and corporate social responsibility.
Worldwide shareholders EDPR shareholders are spread across 23 countries, being United States the most representative country, accounting for 26% of EDPR shareholder base (ex-EDP Group), followed by United Kingdom, Portugal, Netherlands, Australia, France and Norway. In Rest of Europe the most representative countries are Switzerland, Spain and Sweden.
78%
3%
19%
EDPR Shareholders
EDP MSF Other Shareholders
58%
25%
1%8% 8%
Shareholders (Ex-EDP) by type
Investment funds SRI Pension Other Retail
26%
18%12%
8%
7%
6%
5%
17%1%
Shareholders (Ex-EDP)by country
US UK PT NL AU FR NO RoE RoW

22
1.3.2 GOVERNANCE MODEL
EDPR’s corporate governance model is designed to ensure transparency and accountability through a clear separation of duties between management and supervision of the company’s activities.
Corporate governance is about promoting corporate fairness, transparency and accountability. EDPR’s corporate governance structure specifies the shareholders, board of directors, managers and other stakeholders’ rights and responsibilities and spells out the rules and procedures for making decisions on corporate affairs. It also incorporates the organization's strategic response to risk management.
The corporate governance structure adopted is the one in effect in Spain. It comprises a General Meeting of Shareholders and a Board of Directors that represents and manages the company. As required by the law and established in the company’s articles of association, the Board of Directors has set up four specialized committees. These are the Executive Committee, the Audit and Control Committee, the Nominations and Remunerations Committee and the Committee on Related-Party Transactions.
This governance structure and composition was chosen to adapt the company’s corporate governance model also to the Portuguese legislation and it seeks, insofar it is compatible with the Spanish law, to correspond to the so-called “Anglo-Saxon” model set forth in the Portuguese Commercial Companies Code, in which the management body is a Board of Directors, and the supervision and control duties are of the responsibility of a separate body, a Supervisory Board.
General Shareholders’ Meeting
General Shareholders’ Meeting is the body where the shareholders participate, it has the power to deliberate and adopt decisions, by majority, on matters reserved by the law or the articles of association.

23
MANAGEMENT REPORTEDPR 2016

24
Board of Directors
EDPR’s BoD shall consist of no less than 5 and no more than 17 Directors, including a Chairperson. Currently it is composed by 17 board members, out of which 10 are independent. BoD members are elected for 3 years period and may be re-elected for equal periods.
EDPR’s BoD has the broadest power for the administration, management and governance of the company, with no limitations other than the responsibilities expressly and exclusively invested in the General Shareholders Meeting, in the company’s articles of association or in the applicable law. Its members must meet at least 4 times a year, preferably once a quarter. Nonetheless, the Chairperson, on his own initiative or that of 3 Directors, shall convene a meeting whenever he deems fit for the company’s interests.
Executive Committee
EDPR’s Executive Committee (EC) is composed by four members, including a Chief Executive Officer (CEO). The CEO coordinates the implementation of the BOD decisions and the Corporate and General Management functions, partially assigning those to the other executive officers, namely: the Chief Financial Officer (CFO), the Chief Operating Officer for Europe and Brazil (COO EU & BR) and the Chief Operating Officer for North America (COO NA).
The CFO proposes and ensures the implementation of the financial policy and management, including financial negotiation, management and control, cash management optimization and financial risk management policy proposal; he also coordinates and prepares the business plan and the budget, manages the financial statements reporting analyses the operational and financial performance and coordinates procurement function and relations with key suppliers while ensuring the implementation of the procurement strategy and policy.
The COO EU & BR and the COO NA coordinate their platforms by developing, establishing and implementing the strategic plan for the renewable energy business in their respective platforms, in accordance with the guidelines set by the BOD; they are also responsible for planning, organizing and managing resources, controlling, measuring and improving the management of projects and subsidiary companies to achieve expected results to make EDPR a leader in the renewable energy sector in their respective platforms.
Nominations and Remunerations, Related-Party Transactions and Audit and Control Committees
In addition to EC referred above, EDPR governance model contemplates permanent bodies with an informative, advisory and supervisory tasks independently from the BoD, such as:

25
MANAGEMENT REPORTEDPR 2016
Remuneration Policy
EDPR governance model is reinforced by an incentive structure with transparent remuneration through variable remuneration based on key performance indicators.
The graphic below describes the remuneration policy. For further information on the remuneration policy refer to the Corporate Governance section.
For further detailed information regarding the responsibilities and roles of the different social bodies, as well as 2016 activity, please refer to the Corporate Governance section, at the end of this report. The company also posts its up-to-date articles of association and regulations at www.edpr.com.

26
1.3.3 ORGANIZATION STRUCTURE
The organization structure is designed to accomplish the strategic management of the company but also a transversal operation of all the business units, ensuring alignment with the defined strategy, optimizing support processes and creating synergies.
EDPR is organized around three main elements: a corporate Holding and two platforms that group all the business units where the company has presence.
ORGANIZATIONAL MODEL PRINCIPLES
The model is designed with several principles in mind to ensure optimal efficiency and value creation.
EDPR HOLDING ROLE
EDPR Holding seizes value creation, through the dissemination of best practices in the organization and the standardization of corporate processes to the platforms and the business units to improve efficiency. Its internal coordination model and interface with EDP group impacts both the company’s processes - activities performed, processes steps, inputs and outputs, and decision-making mechanisms -, and the company’s structure, with an alignment of functions and responsibilities with the processes configuration.
Accountabilityalignment
Critical KPIs and span of control are aligned at project, country, platform and holding level to ensure accountability tracking and to take advantage of complementarities derived from end-to-end process vision.
Client-service
Corporate areas function as competence support centers and are internal service providers to all business units for all geographical non-specific needs. Business priorities and needs are defined by local businesses and best practices are defined and distributed by corporate units.
Lean organization Execution of activities at holding level are held only when significant value is derived,coherently with defined EDPR holding role.
Collegial decision-making
Ensures proper counter-balance dynamics to ensure multiple-perspective challenge across functions.
Clear andtransparent
Platforms organizational models remain similar to allow for: - Easy coordination, vertically (holding-platforms) and horizontally (across platforms); - Scalability and replicability to ensure efficient integration of future growth.

27
MANAGEMENT REPORTEDPR 2016
The EDPR Holding structure was designed to accomplish two fundamental roles: Strategic Management and Transversal Operation.
Strategic Management covers to a) adopt a coordination model within the group, supporting the Executive Committee in the definition and control of the strategy policies and objectives; b) define specific strategic initiatives; c) review the accomplishment of the company’s business plan; d) define transversal policies, rules and procedures; e) control key performance indicators.
Transversal Operation deals to i) ensure the alignment of all the platforms with the defined strategy; ii) capture synergies and optimize support processes; and iii) systematically and progressively concentrate supporting activities in shared service business units with the group.
INTEGRITY AND ETHICS
Ethical behaviour is absolutely essential for the functioning of the economy. EDPR recognizes its importance and complexity, and is committed to address ethics and its compliance. But is employees’ responsibility to comply with ethical obligations.
GOVERNANCE MODEL FOR ETHICS
Ethics are the cornerstone of EDPR strategy, to the extent that EDPR has a Code of Ethics and an Anti-Corruption regulation that go beyond just defining the company principles to be adopted, but also how employees and any other service provider working on behalf of EDPR should behave when dealing with the company stakeholders. The Code of Ethics has its own regulation that defines a process and channels to report any potential incident or doubt on the application of the code. The Ethics Ombudsman is behind this communication channel, and to analyse and present to the Ethics Committee any potential ethical problem. The code is communicated and distributed to all employees and interested parties, and complemented with tailored training sessions.
HOW DO WE APPLY OUR CODE OF ETHICS?
EDPR’s Code of Ethics applies to all company employees, regardless of their position in the organization and working location, and they all must comply with. Our suppliers should be aligned with the spirit of our Code of Ethics, and this is reflected in our procurement policies.
The Ethics Ombudsman plays an essential role in the ethics process. He guarantees impartiality and objectivity in registering and documenting all complaints of ethical nature submitted to him. He monitors their progress and ensures that the identity of the complainants remains confidential, while entering into contact with them whenever appropriate, until the case is closed.
Identify an alleged violation of the code of
ethics
Ombudsman performs a summary
investigation
Ethics Committee decides if the complaint
portrays a violation
When a violation is confirmed, the
Committee opens an investigation
Reports of alleged violations of the Code of Ethics must be submitted to the Ethics Ombudsman, indicating personal data and a detailed description of the situation.
Ethics Ombudsman first confirms the events reported and submits a preliminary report on the initial confirmations to the Ethics Committee.
Ethics Committee analyses every situation reported and decides as to whether it should be classified as a violation of the Code of Ethics.
When conducting an investigation, the Company shall abide by the law and its own in-house rules. After the investigation is complete, the Committee decides whether any corrective or disciplinary action is required.

28
In 2016 there was one communication to the Ethics Ombudsmen through the Ethics Channel. However, it was not considered as an issue related to the Ethics Code and it will be suggested to be rejected during the next Committee Ethics. The issue has been submitted to the responsible area in order to be analyzed and take the corresponding measures.
ETHICS PROGRAM
EDPR is strongly committed with the dissemination and promotion of compliance with the Code of Ethics , which includes a Human Rights section, available to all employees through training, questionnaires, and open discussions of the findings. To this extent, from March to December 2016, EDP offered an online Ethics training (“Ética EDP") available to all employess of both Europe/Brazil and North America. This course achieved a major participation of around 900 EDPR employees.
ANTI-CORRUPTION REGULATION
In order to ensure compliance with the standards of Anti-Corruption Regulation in all geographies where EDPR operates, the Company has developed an Anti-Corruption Policy of application to all EDPR Group, which was approved by its Board of Directors on December, 2014.
This Anti-Corruption Policy involves a series of new procedures regarding the relationships of EDPR employees with external parties, namely the approval of certain actions regarding hospitality to and from external parties, charitable donations, and sponsorships.
EMPLOYEE RELATIONS
EDPR is committed to respect freedom of trade union association and recognises the right to collective bargaining.
At EDPR, from 1,083 employees, 21% were covered by collective bargaining agreements. Collective bargaining agreements apply to all employees working under an employment relationship with some companies of EDPR group, regardless of the type of contract, the professional group into which they are classified, their occupation or job. However, matters relating to the corporate organization itself, the laws of each country or even usage and custom in each country result in certain groups being expressly excluded from the scope of collective bargaining agreements.
The collective bargaining agreements that are applied at EDPR are usually negotiated at state level or regional level, and EDPR may be just one of the players among other leading sectorial companies in the negotiation with employees’ representatives, and in some cases, governmental representatives. In Portugal and Brazil, EDP negotiates its own agreements with employees, and those apply to all employee working for companies of the group, including EDPR.
Despite not taking an active part in the negotiations, EDPR wants to facilitate the broadcast of any update in those agreements. EDPR organized training sessions for its employees to inform about the results of those negotiations.
During the last years, EDPR has performed different benchmark analysis of the benefits stated at the different collective bargaining agreements that apply to our employees, comparing them against the benefits offered by the company and, in general terms, the company offers a more competitive benefits package compared to what is stated in the collective bargaining agreement.

MANAGEMENT REPORTEDPR 2016
2 Strategy
Business Environment
The Importance of Renewables 33The Evolution of Renewables Around the World 37Supportive Policy Instruments 38
Business Plan 44Selective Growth 45Operational Excellence 47Self-Funding Model 49
Risk Management 51

INNOVATIONAS THE NEWART

INNOVATIONAS THE NEWART

16

33
MANAGEMENT REPORTEDPR 2016
2 Strategy
2.1. Business environment
2.1.1. THE IMPORTANCE OF RENEWABLES
Renewable energy is a fundamental part of the world’s ongoing energy transformation. On the one hand, it is a critical part of reducing global emissions and keeping global temperature increase below 2ºC, as agreed in Paris. On the other hand, renewables are increasingly competitive with conventional technologies while they achieve a myriad of socioeconomic benefits. Hence, renewable energies fuel economic growth, increase energy security, create new employment opportunities, enhance human welfare and contribute to achieve development goals, among other benefits.
Necessary to stop climate change and comply with international agreements Human activities are releasing critical amounts of carbon dioxide and other greenhouse gases (GHG), which trap heat and steadily drive up our planet’s temperature, eventually compromising our climate. Climate scientists agree that human-caused climate change is happening based on massive scientific record and climate change effects are easily observed and are evidenced by data as global temperatures increase of 0.9°C (compared to 1880’s levels), rising sea levels (around 17 cm in the last century) or, noticeable Greenland and Antarctic ice sheets melting. There has been a “step change” in momentum on climate change in the past decade, with large developing countries led by China aiming at reducing their emissions alongside accelerated action by the U.S. under President Barack Obama.
The Paris Agreement, ratified in November 2016, aims at avoiding the worst effects of climate change and opens up a path towards a decarbonized economy.
As anthropogenic GHG result primarily from the combustion of fossil fuels, effective action in the energy sector is, consequentially, essential to tackle climate change issues. According to the International Renewable Energy Agency (IRENA), reaching a 30% renewables share by 2030, coupled with higher energy efficiency, would be enough to prevent global temperatures from rising more than 2°C above preindustrial levels. It is becoming increasingly clear that the investments required to reduce emissions will be modest in comparison with the benefits from avoided climate change damages.
Therefore, renewable energy is a cornerstone for achieving climate targets and onshore wind, because of its maturity and competitiveness, is expected to be at the forefront of the required transformation of our energy sector.
Renewables are the cheapest option in many parts of the world Nowadays, some renewable’s technologies (wind and solar PV in particular) are competitive with conventional technologies. According to the levelised cost of energy (LCOE), onshore wind already generates the cheapest source of electricity in some regions while solar PV is also becoming increasingly competitive as stated by many experts and prestigious analysts, including Bloomberg Energy Finance, IRENA or Lazard. Despite the substantial cost reduction of onshore wind since the early 1980s, there is still significant further potential for the next decade as costs are expected to keep falling due to improved turbine designs, the use of larger and more reliable turbines, increased hub heights and rotor diameters capable to unlock higher capacity factors at the same wind resource. According to IRENA, by 2025, the LCOE of onshore and offshore wind could see declines of
According to IRENA, the cost of doubling the renewable energy share by 2030 would be US$ 290 billion per year which is expected to be at least 4 and up to 15 times less than the external costs avoided.
In Spain, according to the Spanish Wind Energy Association, 2016’s average wholesale electricity price would have been 15.3€/MWh higher (28%) if the 23 GW wind fleet had not been producing energy.

34
26% and 35% respectively, while solar PV’s could fall by as much of 59%. Additionally, since renewables energies do not use fossil fuels, they are not exposed to their inherent price volatility, being their LCOE foreseeable and stable.
Levelized Revenue Requirements (€16/MWh):
The increased competitiveness of wind was highlighted in the latest energy auctions held all over the world: in 2016, the price of wind energy, not only reached historical minimums (below 40US$/MWh), but was often lower than any other technology. On the other hand, increasing the supply of renewable energy tends to lower the average price per unit of electricity because they have very low marginal costs as they do not have to pay for fuel, therefore reducing wholesale prices and ultimately, the cost for consumers.
Fundamental pillar of sustainability and energy independence The limitless nature of wind resource contributes to its sustainability: the use of wind resource allows to slow down the pace of fossil fuel depletion and to maintain the balance between the existing natural resources and their consumption, besides having a reduced environmental impact as they do not pollute or generate waste, contributes to air quality and does not require water or fuels. Another advantage is that wind resource is also endogenous, improving countries’ energy supply security by decreasing the vulnerability of many countries due to interruption or alteration of the energy supply and enhances the energy independence, bringing significant cost savings by reducing gas and oil imports. This is very relevant for most of the countries, particularly in Europe, as the largest share of fossil fuel reserves is concentrated in a small number of countries (mainly in the Middle East).
A driver for growth and regional development Renewable energy generates wealth, support the creation of new jobs and strengthen industrial network. Compared with fossil fuel technologies, which are typically mechanized and capital intensive, the renewable energy industry is more labour-intensive as on average, more jobs are created for each unit of electricity generated from renewable sources than from fossil fuels. According to IRENA, the renewable sector employs, directly and indirectly, over 8 million of people around the word, of which, the wind sector represents more than 1 million jobs. Since most of the facilities are in rural areas, wind energy creates local wealth: the largest share of the jobs created are local and local taxes, in particular, land taxes, often represent a large share of the income of the municipalities in which wind farms are built. In developing countries, renewables are becoming increasingly important: an estimated 1.2 billion people still do not have access to electricity according to IEA, which severely jeopardizes their well-being and economic development, presenting a strong case for increased deployment of renewables, since off-grid renewable solutions offer the most cost-effective way to extend energy access to all.
Improved public health and environmental quality Building wind and solar facilities helps to improve public health mainly by displacing noxious emissions from coal-fired power plants. Air pollution is becoming a severe problem in many regions of the world, in particular in big cities, due to smog, which is highly toxic for the health, reduce visibility and contribute to acid rain, which can damage vegetation and crops. Air pollution has emerged as the deadliest form of pollution and the fourth leading risk factor for premature deaths worldwide, according to the World Bank. Those deaths cost the global economy about US$225 billion, the World Bank study finds, pointing toward the economic burden of air pollution.

35
MANAGEMENT REPORTEDPR 2016
PARIS AGREEMENT ALREADY RATIFIED BY COUNTRIES THAT REPRESENT AROUND 89% OF THE WORLDWIDE EMISSIONS
The global low-carbon transition is already underway and gaining momentum, following the adoption of the first universal climate change agreement and its ratification in November 2016.
The Paris Climate Change Agreement, the result of the most intricate, far-reaching and critical international climate negotiation ever attempted, came into force the 4th November 2016, much earlier than expected thanks to the early ratification of a large number of countries.
The Agreement is undoubtedly a turning point in the history, cementing the combined political, economic and social will of governments, cities, regions, corporations and citizens to avoid the worst effects of climate change.
The Paris Agreement sparked an unprecedented wave of action and pledges to boost renewable energy industry all around the world. But even if undoubtedly the Paris Agreement gave hope, 2016 was also marked by unprecedented climate concerns. On the one side, 2016 was the hottest year on record and a new high for the third year in a row, according to the UN. Additionally, the World Meteorological Organization has now confirmed that the average global concentration in the atmosphere of the main greenhouse gas, carbon dioxide, reached the symbolic and significant milestone of 400 parts per million for the first time in 2015 and broke new records in 2016.
Against this backdrop, non-State actors are increasingly aware of the need to address climate change. The preparation of the Paris Agreement has shown that fighting against climate change is no longer an issue for governments to solve alone and that companies have a key role to play. Spurred by rising expectations of society and corporate targets, an increasing number of companies have grasped the challenges and opportunities of moving towards a low-carbon economy and addressing climate change is becoming a key part of their corporate strategy. In the US, for example, corporate buyers (including Google, Facebook, Amazon, Apple and many others), contracted for almost 2.5 GW of new renewable energy PPA capacity in 2016.
The electricity sector will play a central role in the transition towards a low-carbon economy. It can almost totally eliminate CO2 emissions by producing electricity from renewable sources, and offers the prospect of partially replacing fossil fuels in transport and heating. Indeed, according to “Climate Action Tracker”, which provides independent scientific analysis, all 1.5°C pathways foresee a fully decarbonized power system by 2050, which implies a power system consisting entirely of renewables and other zero or low carbon sources.
What is the Paris Agreement?
It is a climate accord reached by nearly 200 countries in December 2015. The Agreement commits world leaders to keeping global warming below 2°C seen as the threshold to avoid the worst effects of climate change, and endeavor to pursue a safer target of 1.5°C. Each country submitted national pledges to achieve the goals and the agreement includes a mechanism for periodical revisions of those targets. The agreement also include a long-term goal for a net zero emissions, which could effectively phase out fossil fuels. The accord also places a legal obligation to provide climate finance to developing countries.
127
70
Ratified
Signed andawaitingratification
Countries that already signed the COP21 agreement
11%
Others (not ratified,incl. Russia)
US & Canada
China
India
UE
Japan
Brazil
Others (ratified)
Weight of emissions by signatory country

36
YES TO WIND POWER
In the wake of the of success of the Yes to Wind Power campaign launched in 2015 in Spain, it grew in 2016 by expanding into the markets of Italy, Romania, Poland and France.
In order to demonstrate the benefits of renewable energy, especially wind power, the campaign aims above all to show that renewable energy is the most effective way to mitigate climate change in the short term and fulfill commitments made at COP21. In addition, it highlights the competitiveness of this type of energy. To inform society about these issues, this social media campaign centered on the Energy Hipster character who, in 2016, began answering questions and sharing the answers with the entire community on Facebook and Twitter. Through the Energy Hipster and the campaign webpage, journalists, opinion leaders and the general public across these four countries had access, in their language, to up-to-date scientific information in a format easy to read and understand.
Campaign publications in Poland, Spain, Italy and Romania:
Total number of campaign impacts: 2,580,769 (doubled compared to the previous year).
Twitter: 4,462,785 hashtag impacts l Generation of a community of 1,280 fans
Facebook: 73% increase in community size YOY l Publication reach of 1,569,001

37
MANAGEMENT REPORTEDPR 2016
2.1.2. THE EVOLUTION OF RENEWABLES AROUND THE WORLD
Wind
According to Global Wind Energy Council (GWEC), 54.7 GW of wind capacity were grid-connected in 2016, bringing total
global installed capacity to nearly 487 GW.
Once again, China led wind power installations with 23.3 GW of new capacity, below 2015’s spectacular results (30
GW) though, raising its total wind installed capacity to 169 GW. With 0.7 GW offshore capacity installed in 2016,
China overcame Denmark and achieved third place in global offshore rankings, after UK and Germany.
The US was the second largest wind market with an additional 8.2 GW, bringing the US cumulative capacity to 82.2 GW,
surpassing hydropower capacity to become the largest source of renewable capacity and the fourth largest overall. By
state, Texas connected 2.6 GW in 2016, followed by Oklahoma (1.5 GW) and Iowa (0.7 GW). With these additions Texas
remains the largest wind State, outstripping the 20 GW landmark, followed by Iowa (6.9 GW) and California (5.7 GW).
US also commissioned its first offshore wind project, the 30 MW Block Island project off the coast of Rhode Island.
In Europe, renewable energy sources made up nearly 90% of capacity additions, a sign of the continent’s rapid shift
away from fossil fuels. For the first time, wind overtook coal and became the
second largest source of power generation capacity only behind natural gas,
which is particularly impressive as ten years ago it was only the sixth technology.
In 2016, wind facilities made up more than half of Europe's new power capacity
and met 10.4% of total electricity demand. According to Wind Europe, 12.5 GW
of wind were installed during 2016 in EU, of which 1.6 GW were offshore, representing together 51% of all new capacity.
These results make cumulative installed capacity in Europe amounting to 153.7 GW of wind, of which 12.6 GW are
offshore, cementing the European leadership. Germany was again the largest market with 5.4 GW of new capacity (of
which 0.8 GW were offshore) and France came second with a record year of 1.6 GW, followed by Turkey (1.4 GW) and
Netherlands (0.9 GW, of which 0.7 GW offshore). In terms of cumulative capacity, Germany maintains its leadership
with 50.0 GW, followed by Spain (23.1 GW), UK (14.5 GW), France (12.1 GW) and Italy (9.3 GW).
In Latin America, 2016 was a remarkable year for Brazil that installed 2.0 GW and surpassed 10 GW of wind installed
capacity. Chile added 0.5 GW reaching 1.4 GW of capacity while Mexico connected 0.5 GW closing the year with 3.5 GW.
Other emerging economies that achieved very good results were India, setting a new national record of 3.6 GW and
consolidating its position as fourth largest wind market, South Africa (0.4 GW) and Pakistan (0.3 GW).
Solar
2016 was an outstanding year for solar PV with 76.1 GW of capacity additions
which compares with 51.2 GW in 2015. The largest market was China, which
added 34.2 GW, an 125% increase versus 2015. US ranked second with
estimated additions of 14 GW, up from 7.3 GW in the previous year and Japan
and India were the following markets adding, respectively 8.6 and 4.5 GW.
European countries installed around 6.9 GW of solar power in 2016, a 20%
decrease compared to the 8.6 GW that was installed in the previous year,
according to Solar Power Europe. The growth was mainly driven by the UK,
Germany, Turkey and France.
Almost 90% of new power in Europe from renewable sources in 2016
“2016 will be remembered as the year that the first solar PPAs were signed at levels that have made solar the lowest-cost power in many regions of the world”, James Watson (Solar Power Europe CEO)
38
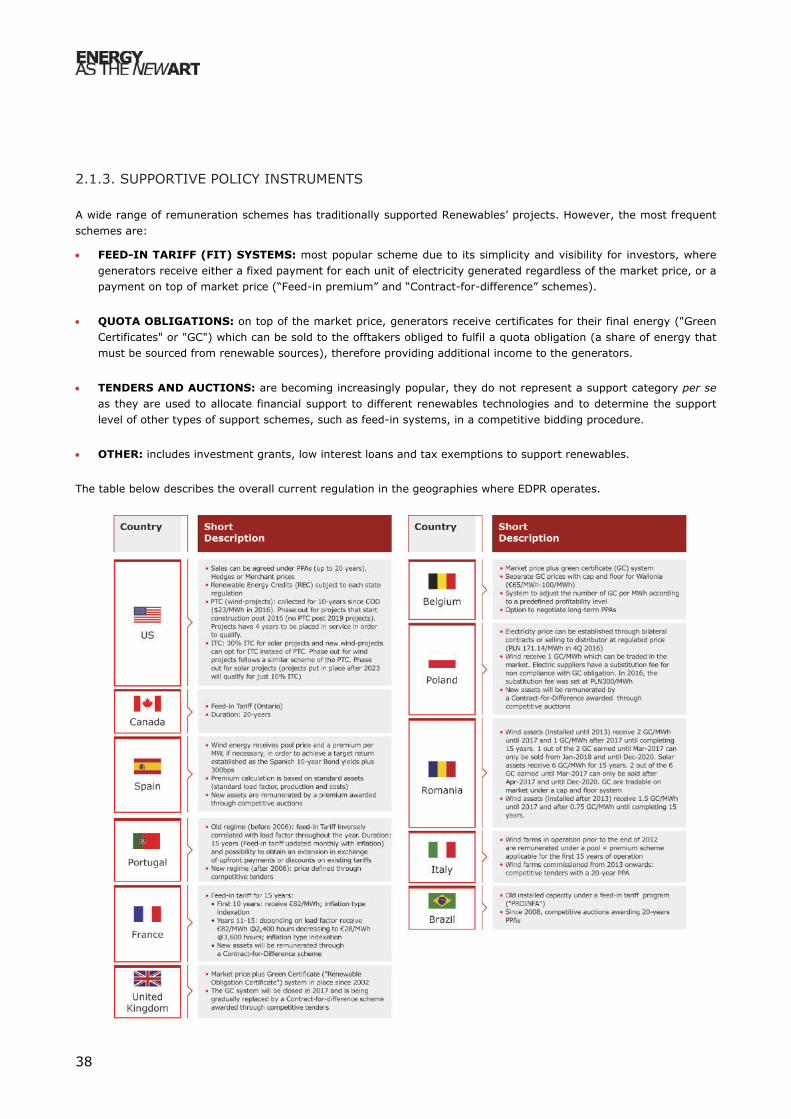
2.1.3. SUPPORTIVE POLICY INSTRUMENTS
A wide range of remuneration schemes has traditionally supported Renewables’ projects. However, the most frequent schemes are:
FEED-IN TARIFF (FIT) SYSTEMS: most popular scheme due to its simplicity and visibility for investors, wheregenerators receive either a fixed payment for each unit of electricity generated regardless of the market price, or apayment on top of market price (“Feed-in premium” and “Contract-for-difference” schemes).
QUOTA OBLIGATIONS: on top of the market price, generators receive certificates for their final energy ("GreenCertificates" or "GC") which can be sold to the offtakers obliged to fulfil a quota obligation (a share of energy thatmust be sourced from renewable sources), therefore providing additional income to the generators.
TENDERS AND AUCTIONS: are becoming increasingly popular, they do not represent a support category per seas they are used to allocate financial support to different renewables technologies and to determine the supportlevel of other types of support schemes, such as feed-in systems, in a competitive bidding procedure.
OTHER: includes investment grants, low interest loans and tax exemptions to support renewables.
The table below describes the overall current regulation in the geographies where EDPR operates.

39
MANAGEMENT REPORTEDPR 2016
EUROPE: REDESIGNING POWER MARKETS FOR DECARBONISATION
On the 30th November 2016, The European Commission (EC) presented the Clean Energy legislative package, the so-called “Winter Package”, unveiling the post-2020 EU regulatory framework. The proposals represent a key piece of the EC’s pledge to create an EU-wide Energy Union and includes five main areas: Renewable Energy Directive, Market Design review, Governance, Efficiency and Security of Supply.
The package consists of eight legislative proposals, including the “Energy Union Governance Regulation” and a new “Renewable Energy Directive”, together with four non-legislative documents and nine other reports and initiatives.
All the legislative proposals still need the approval of the European Parliament and the Council of the European Union, which could materialize at the end of 2018.
The “Renewable Energy Directive” seeks to cement commitments made in the Paris Agreement, where the EU pledged to cut GHG (greenhouse gases) by 40% on 1990 levels by 2030 and increase by 27% its share of renewables. Proposals also include plans to increase energy efficiency levels by 30% by 2030.
The EC, as part of the new governance framework, will monitor the completion of the climate and energy 2030 targets. In view to fulfil the targets, Member States (MS) will be required to develop “2030 National Energy and climate plans” in which each MS will set the pathway to deliver their objectives. If those plans do not add up to the EU’s binding target,
the EC will be able to trigger measures at EU level to fill the gap.
The new Renewable Energy Directive proposal also advocates for 3 years of visibility for renewable energy support, as it requires MS to define at least a 3-year schedule for the allocation of support, including timing, capacity and budget. It also requires MS to ensure that any modification of their support scheme does not negatively affect the economics of renewable energy projects.
The 2030 targets imply that almost half of electricity in Europe will be generated by renewables in 2030. The EC acknowledges this fact and seeks to integrate renewables into power markets, enhancing their flexibility while making them fit for an increasingly share of variable generation.
The most relevant recent regulatory developments in the European countries where EDPR is present are below described (for additional information, please refer to Note 01 of EDPR Consolidated Annual Accounts).
SPAIN
On January 2016, the first auction of renewables’ capacity was held, designed to provide a similar remuneration scheme to the one that applies to current installations (ruled by RD 413/2014). Following this framework, tender participants were requested to bid discounts on the “initial investment” parameter that determines the “investment premium” that would eventually be awarded. The auction was very competitive, around 5 times oversubscribed for onshore wind. EDP Renováveis was awarded 93 MW of wind energy.
The Spanish Government announced a new renewables’ capacity auction for the first months of 2017 requiring projects to be completed by December 2019.
PORTUGAL
On October 2016, the Portaria 268-B/2016 on the clawback of non-refundable subsidies received from public development programs was published.
“We are on the brink of a clean energy revolution” (Miguel Arias Cañete, EU Commissioner for Climate Action and Energy)
40
FRANCE
On April 2016, the government enacted the “Programmation Pluriannuelle des Investissements” which set renewables’ capacity targets by technology, including a provisional timetable of the renewable tenders to be launched until 2019.
A new Contract-for-difference (CfD) scheme was released in December 2016 for wind farms having requested a PPA in 2016. The strike price will be equal to the value of the current feed-in-tariff (similar tenure, indexation and adjustment after year 10), plus a management fee to compensate balancing costs (2.8€/MWh). The market reference price will be the production weighted average Day Ahead Market price, using a representative production profile for wind industry.
It was also disclosed the draft decree for the 2017 CfD for wind farms with less than six wind turbines, where the CfD tenure extended from 15 to 20 years, being the strike price of 72€/MWh plus the management fee.
ITALY
Final approval of the new Decree envisaging tenders for 2016 in June. This decree follows the provisions of 2011 Italian RES (Renewable Energy Sources) Law and as such, although with some small adjustments, is very similar to the one approved in 2012 which set the framework for the first three onshore wind tenders. The new decree envisaged one sole 800 MW onshore wind tender.
The Energy Agency of Italy, Gestore dei Servizi Energetici (GSE) released in December 2016 a list of projects that won offtake contracts in 2016 tender. EDP Renováveis won PPAs for 6 wind farms totaling 127 MW with an awarded price of 66€/MWh and in case the realized market price is lower than the awarded price, the difference will be paid by GSE.
POLAND
On June 2016 the so-called “Wind Turbine Investment Act” was approved, introducing, among other measures, new minimum distance restrictions for new wind farms and increased real estate burden.
Also on June 2016, some amendments of the RES Act Chapter 4 were approved. Although the core of the new auction system remained unchanged, some modifications were introduced, namely technology baskets for future tenders, improving the treatment of biomass, biogas and cofiring technologies.
On November 2016, the Polish government disclosed a draft ordinance detailing the amount and value of energy planned to be auctioned in 2017. The draft states that baseload renewables (dedicated biomass and biogas) will have a share of around 50% of the total 2017’s auction budget but new onshore wind could also compete for an amount up to 150 MW.
ROMANIA
The Romanian government approved the draft ordinance setting a quota of 8.3% for 2017.
On October 2016, the Ministry of Energy published for consultation a draft amendment to the current RES Law and released a new draft in November, incorporating some improvements over the previous version. Among other amendments, an extension of the GC scheme until 2031, a removal of the indexation of the GC parameters and the extension of the GC recovery for wind energy from 2018 to 2025. Regarding PV projects, the draft amendments propose an extension of the GC postponement until end of 2024, fixing the recovery from 2025 to 2030.
UNITED KINGDOM
In November 2016, the Department for Business, Energy and Industrial Strategy (BEIS) released details on the next CfD round. The second allocation round is expected to begin in April 2017 with projects to compete for GBP 290 million of annual support for the delivery years 2021/22 and 2022/23 (although offshore projects might be phased up to two years subsequent to 2022/23). It will only include less established technologies, as offshore wind. The administrative strike price for offshore wind is set at 105 GBP/MWh for projects deploying in 2021/2022 and 100 GBP/MWh for projects deploying in 2022/2023.

41
MANAGEMENT REPORTEDPR 2016
NORTH AMERICA TO CONTINUE LEADING THE WAY
Historically, the typical framework of wind development in the US has been decentralized, with no national feed-in tariff, involving the combination of three key drivers of the top line:
PTCs: production tax credits are the dominant form of wind incentives in the US, and represent an extra source ofrevenue per unit of electricity ($23/MWh in 2016), over the first 10 years of the asset’s life.
ITCs: investment tax credits equal to 30% of the initial capex are the primary incentive for solar.
PPAs: long-term, bilateral power purchase agreements by which a wind developer can sell its output at a fixedprice, usually adjusted for a negotiated escalator.
In addition, many states have passed legislation, principally in the form of renewable portfolio standards (RPS), which require utilities to purchase a certain percentage of their energy supply from renewable sources, setting penalties to those that do not comply. Utilities can invest directly in renewable generation assets, purchase electricity from other renewable generators or purchase RECs. As a result, many utilities setup auction systems to seek long-term power purchase agreements with renewable energy generators. The relevant recent regulatory developments in North America are below described (for additional information on, please refer to Note 01 of EDPR Consolidated Annual Accounts).
UNITED STATES
On December 2015, the US Congress approved the "Consolidated Appropriations Act, 2016" that included an extension of the PTC for wind and the possibility of a 30% ITC instead of PTC and the extension of the ITC for solar. The Congress introduced a phase out of the credits. Wind projects that start construction in 2020 or late will not have PTC or ITC and solar projects placed in service after 2023 will qualify to just 10% ITC. The graphic below depicts the phase-out calendar:
On May 2016, the US Internal Revenue Service (IRS) issued guidance that wind farms have 4 years from their start of construction to be placed in service and qualify for the PTC. As a result, projects that start construction prior to year-end 2019 and are placed in service prior to year-end 2023 will be eligible for the PTC. The IRS ruling also includes a provision that allows developers to secure the PTC if 5% of a project's capital components by dollar value are safe harbored in a given year and construction is complete within 4 years. Thus, if a developer safe harbors 5% of project Capex in 2016 for a given project, the project will qualify for 100% PTC if construction is completed by year-end 2020.
On August 2015, the Environmental Protection Agency (EPA) announced the Clean Power Plan (CPP), a rule to cut carbon pollution from existing power plants. On February 2016, the Supreme Court stayed implementation of the CPP pending judicial review and as of year-end 2016, the review process is ongoing with the DC Circuit Court. A ruling is widely expected by mid-2017, however it is expected to be appealed to the Supreme Court regardless of outcome.
Regarding RPS, some states have upgraded their targets in 2015 and 2016: California and New York targeted 50% renewables by 2030, Oregon upgraded their RPS to 50% by 2040, Vermont enacted an RPS of 75% by 2032 and Michigan upgraded their RPS to 15% by 2021. In 2016, both New Jersey and Massachusetts proposed (but as of year-end 2016

42
had not yet adopted) to upgrade their RPS standards to 80% by 2050. Illinois supplemented its existing RPS standard by passing an energy bill to require utilities to source at least 4TWh of new wind and 4TWh of new solar by 2030.
RPS obligations as a percent of state retail consumption is shown in the table below.
RPS objective 2016 2025 RPS objective 2016 2025 Arizona 5.7% 14.2% Montana 7.1% 7.1%
California 24.4% 40.5% Nevada 16.6% 20.8%
Colorado 14.1% 21.7% New Hampshire 15.3% 22.7%
Connecticut 19.9% 25.6% New Jersey 14.4% 23.4%
Delaware 11.9% 22.8% New Mexico 11.5% 15.8%
District of Columbia 13.9% 26.0% New York 28.4% 30.6%
Hawaii 14.8% 24.7% North Carolina 5.7% 11.3%
Illinois 8.2% 19.2% Ohio 2.0% 9.1%
Indiana 3.2% 8.0% Oregon 11.5% 22.2%
Maine 36.6% 37.5% Pennsylvania 13.0% 17.1%
Maryland 14.5% 21.4% Rhode Island 9.4% 22.1%
Massachusetts 13.7% 21.1% Texas 5.0% 8.6%
Michigan 10.2% 10.2% Vermont 0.0% 79.5%
Minnesota 20.7% 28.4% Washington 4.5% 7.7%
Missouri 3.6% 10.9% Wisconsin 9.6% 9.6%
GROWTH PROSPECTS
Growth in the US is motivated by several forces, including primarily the planned coal capacity retirements, RPS compliance in several states and demand from commercial and industrial entities.
CANADA
New Canadian renewable supply through 2020 is backed by new targets in Alberta and Saskatchewan along with existing IESO contracts in Ontario.
MEXICO
Mexico is redesigning its energy sector beginning with the constitutional amendment in 2013 and ending with implementation by end of 2018. The reforms bring about the end of state-owned vertically-integrated monopolies and open the door to significant opportunities for private sector participation across the supply chains for oil and gas and for electricity. Mexico’s energy reforms advanced significantly in 2016 to implement changes that provide remuneration for all forms of generation including wind and solar. The key mechanisms of interest to renewable developers are the implementation of the wholesale electricity market, long-term supply auctions for supply, and financial transmission rights. Two long-term supply auctions have been conducted to date with a third planned for April 2017.

43
MANAGEMENT REPORTEDPR 2016
THE AGE OF AUCTIONS HAS ARRIVED
In recent years, the renewable energy sector has undergone a profound transformation, as the sector has witnessed a rapid decline of wind and solar PV costs, a high penetration of renewable sources, a greater competition among players and technologies, a massive adoption of renewable targets and more stringent state-aid rules, among other changes. To adjust to these trends, support mechanisms have adapted so that they ensure greater deployment of renewables in a cost-effective manner.
In this context, auctions, alone or in combination with other support schemes have often become the preferred option. Indeed, these schemes allow to control renewables’ volume deployment (in particular to avoid uncontrolled surge of new facilities) while decreasing the chances of governments over-subsidizing the sector because of a lack of information.
Latin America is probably the region with the larger experience of auctions for renewable energy. Brazil alone has contracted more than 20 GW. Other countries, most notably Peru, Chile, Mexico, Argentina and Uruguay have also held renewable auctions in the last years.
In Europe, there has been an increasingly interest in auctions, reinforced by regulation. Indeed, the “European Commission State Aid Guidelines for Environmental Protection and Energy 2014-2020” obliges all Member States to set up competitive bidding processes to grant support to all new facilities by January 2017, with only few exceptions.
Renewable developers are embracing auctions as a way to secure predictable cash flows and therefore, mitigate price volatility and regulatory risk.
2016 was a year of record for low price auctions all around the world: for instance, in wind technology Morocco (below 30 US$/MWh) and Peru (below 40 US$/MWh) are good examples, or in solar PV, prices fell to historic lows in Chile. However, the most unexpected low figures probably came from offshore projects, which have witnessed astonishing low prices like the ones in the latest offshore tender in Denmark, although the price is not directly comparable to those awarded in the UK, as the former exclude grid connections costs and are located at shallower depths, but are nevertheless substantially lower. Another example was the 700 MW of offshore wind capacity awarded by the Dutch Government in December 2016, which resulted in a 25% reduction compared to the previous auction (only a few months earlier) of neighboring projects.
Overview of 2016 selected tenders

44
2.2. Business Plan
EDPR’s value creation strategic plan through 2020 remains in line with previous architecture, supported by three pillars with defined goals: Selective Growth, Operational Excellence and Self-funding Model.
On May 2016, EDPR presented to the financial community its Business Plan for 2016-20 at the EDP Group Investor Day held in London. In the event were present several financial markets participants, including press, online participants, investors, analysts and rating agencies, demonstrating a great interest from the financial community in the group’s equity story and strategy.
EDPR increased its 2014-17 Business Plan into a new Business Plan with stronger capacity additions and technological mix. Since its inception, EDPR has been performing a strategy focused on selective growth, by investing in quality projects with predictable future cash-flows, and seamless execution, supported by core competences that yield superior profitability, all embedded within a distinctive and renowned self-funding model designed to accelerate value creation. As a result of undertaking such strategy, at the same time flexible enough to accommodate to changing business and economic environments, EDPR remains today a global leading company in the renewable energy industry.
EDPR 2020 investment case to continue to be supported by a distinctive strategic agenda which is being successfully delivered in order to outperform its 2016-20 goals.

45
MANAGEMENT REPORTEDPR 2016
2.2.1. SELECTIVE GROWTH
The selective growth strategic pillar is the key principle behind EDPR’s investment selection process, it ensures that the projects that are finally built have the best fit with the Company’s low risk profile at superior profitability. This strategy is part of the 2016-20 Business Plan growth options, as projects have been selected according to two key guidelines:
1) Low risk profile - New capacity benefits from long-term PPAs alreadysecured or long-term contracts awarded under stable regulatory frameworks. This guarantees high visibility of the project’s future cash-flows, reducing risk and locking-in project profitability.
2) High operational performance – The projects selected exhibit strongoperating metrics, namely above portfolio average load factor which improves project competitiveness and drives higher profitability.
EDPR is well on track to deliver on its business plan target growth of +3.5 GW cumulative from 2016 to 2020 (700 MW/year) – with 65% of the cumulative capacity additions target already secured and 820 MW installed in 2016. EDPR’s extensive pipeline has been an important contributing factor to the successful execution of this strategy as the availability of multiple projects coupled with strong development expertise guarantees that only the best, fully optimized projects are finally selected for investment.
65% GROWTH FROM NORTH AMERICA, DRIVEN BY PPAs ALREADY SECURED
The United States is EDPR main growth driver for the 2016-20 Business Plan timeframe. The visibility over Production Tax Credit (PTC) tax scheme, the strong demand from both utilities and commercial and industrial companies for long-term PPAs from wind energy projects, combined with EDPR’s diversified portfolio of projects in this market support this solid growth opportunity.
The December 2015 extension of the PTC, that includes a gradual phase out of the PTC value for projects that start construction before 2020, provides long-term visibility to US growth beyond 2016-20 for new wind energy projects, reinforces the strong fundamentals of the US wind market and supports EDPR’s choice to shift growth to the US.
The Business Plan for 2016-20 targets 1.8 GW of wind onshore additions in the US, of which 1.1 GW were already secured as of December 2016 and are entitled to receive 100% PTC value. More than 55% of these projects were signed with non-utilities companies, another key driver of the US market. Previously the demand for PPAs came only from traditional utilities, however, recently the direct procurement from corporations has increased substantially, adding new demand for EDPR’s US wind and solar projects.
In addition, it is worth mentioning that EDPR secured turbine components in 2016 in order to have the option to further increase its capacity and install up to 3.1 GW of wind projects until 2020, benefitting from 100% of the PTC value.
In 2014 EDPR entered the Mexican market by signing a bilateral long-term supply agreement, for the energy produced by a 200 MW wind farm which was completed in 2016, representing a sizeable entry in an attractive market. Mexico is a country with great potential for wind energy and this achievement can provide a solid platform for further growth.
In 2016 EDPR was also awarded a 20-year PPA in Ontario, Canada, which is already under development and expected to be commissioned by 2019.

46
15% GROWTH FROM EUROPE, FOCUSING ON LOW RISK FRAMEWORKS
Certain European markets continue to provide good growth opportunities supported by regulatory frameworks that provide low risk environment.
For the 2016-20 Business Plan, EDPR growth in Europe represents c.15% of the planned capacity additions, a growth supported by identified short-term opportunities and medium-term pipeline options. In terms of additions by country, EDPR has very focused targets. Firstly, in Portugal, 216 MW will be added with a 20-year feed-in tariff. Then Italy with c.200 MW target additions, of which 44 MW installed in 2016 and 127 MW awarded as a 20-year contracts in December2016 to be installed in 2018. In France, existing feed-in tariff regime provides a stable growth opportunity, driving EDPRtargeted additions to c.100 MW through pipeline development, of which 24 MW were already installed by December2016. Finally, in Spain, EDPR was awarded in January 2016, rights for the pre-registry of 93 MW of wind energy capacityin the renewable energy auction.
10% FROM BRAZIL, IN PROJECTS WITH LONG-TERM PPAs
In Brazil, EDPR already installed 120 MW related to Baixa do Feijão project, which was completed on the first quarter of 2016. On the top of that, EDPR is developing 267 MW, awarded in 2013-15, to be installed in 2017-18. These are projects with load factors above 45% and with PPAs linked to inflation, representing a mid/high double digit project IRR.
Additionally, EDPR is to remain actively prospecting opportunities in Brazil, namely auction opportunities, given the strong fundamentals of the country, with high growth of electricity demand, robust renewable resources and availability of long-term energy supply agreements through an auction system.
10% GROWTH IN SOLAR, GIVEN ITS INCREASING COMPETITIVENESS
In order to take advantage of every profitable renewable technology and considering its increasing competitiveness, EDPR included in its 2016-20 Business Plan a 10% of growth in PV solar technology. The US is the core market for this growth, where the technology is boosted by the Investment Tax Credit (ITC) scheme, while in Europe, Brazil and Mexico developing options are based on projects’ fundamentals.
ALREADY INVESTING IN OFFSHORE WIND TECHNOLOGY
Offshore projects are being developed by EDPR, to support growth options and to capture this new wave of industry development and industry leadership. These projects, located in the UK and France, are expected to start operations beyond the 2016-20 Business Plan, but are already being developed through partnerships, from which the company is also able to further develop technological expertise in a sector with such huge future prospects.
TECHNOLOGICAL MIX

47
MANAGEMENT REPORT EDPR 2016
2.2.2. OPERATIONAL EXCELLENCE
One of the strategic pillars that has always been a keystone of the company, setting it apart in the industry, is the drive to maximize the operational performance of its wind and solar plants. In this area, EDPR’s teams, namely in operations and maintenance (O&M), have established a strong track record that supports challenging targets set in the 2016-20 Business Plan. For this period, EDPR has set targets for three key metrics: Load Factor and Technical Availability, along with optimization of Core Opex1 per MW. These metrics provide an overall view of the progress in EDPR wind assessment, O&M and cost control efforts. They also serve as good indicators for the overall operational efficiency of the company.
MAINTAINING HIGH LEVELS OF AVAILABILITY >97.5%
Availability is the ratio between the energy actually generated and the energy that would have been generated without any downtime due to internal reasons, namely due to preventive maintenance or repairs. Therefore it is a clear indicator of performance of the company’s O&M practices as it focuses on reducing to a minimum any malfunctions and performing maintenance activities in the shortest possible timeframe.
The company always maintained high levels of availability and has registered availability of above 97.5% in 2016, in line with its 2016-20 Business Plan target. EDPR will continue to improve availability through new predictive maintenance optimization measures supported by the 24/7 control and dispatch centre, in reducing damages most common during extreme weather and improving the scheduling of planned stops. Also a new spare parts warehousing strategy will be key in reducing downtime during unexpected repairs.
LEVERAGING QUALITY GROWTH ON DISTINCTIVE WIND ASSESSMENT TOWARD 33% LOAD FACTOR
Load factor (or net capacity factor) is a measure of the quality of the renewable resource that reflects the percentage of maximum theoretical energy output with an equipment working at full capacity, in a given period.
Ensuring the assets generate the maximum amount of energy possible is a key success factor. With regards to the operating portfolio, optimizing load factor is linked to improving availability as above described and, if possible, introducing productivity enhancement retrofits that boost production by setting older equipment models with the most up-to-date technological improvements available to increase efficiency in the utilization of renewable resources available. With regards to wind farms and solar plants under development, maximizing load factor is mostly the expert work of energy assessment and engineering teams, which implies designing an optimal layout of the plant by fitting the positioning and choice among different equipment models with the characteristics of the site, specially the terrain, from the collected resource measurements and their estimated energy outputs.
The company has consistently maintained levels of load factor in the range of 29-30%, having registered 30% in 2016, which is slightly below the P50 (mean probability) assessment for the current fleet, given the lower wind resource in the period when compared with an average year. For 2020 EDPR has a target to reach 33% load factor, mainly on the back of the increase competitiveness of new capacity additions.
1 Supplies and Services + Personnel Costs

48
INCREASING EFFICIENCY, REDUCING CORE OPEX/MW -1%
In addition to all company initiatives to boost production, EDPR also focuses on strict cost control efforts to improve efficiency and gain additional profitability. Leveraging on the experience accumulated over time, EDPR set a target in the 2016-20 Business Plan to reduce Core Opex/MW by -1% CAGR 2015-20. Core Opex refers the costs of Supplies & Service along with Personnel Costs, which are the ones controllable by the company. The target of reducing the manageable company costs structure, also benefits from the economies of scale of a growing company. With regards to O&M, representing c. 30% of total Opex, EDPR has already delivered results from the implementation of its M3 (Modular Maintenance Model) system and self-perform program to some of the wind farms that are no longer subject to initial warranty contracts.
M3 PROGRAM AND SELF-PERFORMANCE
As EDPR’s fleet becomes more mature the initial O&M contracts signed with the turbine suppliers expire. When that happens the company needs to decide between renewing the maintenance service with the OEM2 or insourcing activities to operate the wind farm on its own, whilst maintaining high levels of availability.
Based on EDPR’s expertise, under the M3 program O&M teams will decide on the optimal balance between external contractors and in-house maintenance. Usually, EDPR keeps control of high value-added activities such as maintenance planning, logistics and remote operations while outsourcing, under direct supervision, labor-intensive tasks. This new program immediately showed savings in operational expenses and increased control over quality. During 2016 self-perform maintenance was implemented in additional facilities whose maintenance contracts were up for renewal. The self-perform program is a step further in EDPR integration of maintenance tasks and activities, which is being implemented in the US, and consequently minimizing third-parties dependency. EDPR targets to increase the share of its fleet under the M3 and Self-Perform program up to c.50% by 2020, from c.30% levels in 2015.
INCREASING PRODUCTION
For the period 2016-20, and in line with its previous targets, EDPR aims to increase its total production by 10% CAGR 2015-20. This growth is to be supported by its distinctive competences and accretive projects.
EDPR is also creating value by improving its assets by implementing new technologies on the turbines to boost the power output without requiring major component changes. Performance Analysis teams are collaborating with the manufacturers to determine the best practices to apply this new technology. For instance, installing new versions of the softwares on the older machines with the support of the manufacturer, improves the operation of the turbine and increases its efficiency. Another measure is the implementation of Vortex generators where some components are installed on the blades, modifying and improving the blades’ aerodynamics, achieving an increase in efficiency.
By monitoring real-time conditions, the rotational speed of the generator can be increased while staying within the existing loads, thus increasing the power output and the wind farm revenues, without major investments. This technology has successfully being applied on many turbines and will keep being developed in the coming years.
2 Original Equipment Manufacturer

49
MANAGEMENT REPORTEDPR 2016
2.2.3. SELF-FUNDING MODEL
EDPR self-funding model has been a cornerstone of EDPR’s strategy and its success has been crucial for funding growth.
The self-funding model relies on a combination of the Retained Cash Flow from operating assets and EDPR’s successfully Asset Rotation strategy, along with the US Tax Equity structures to finance the profitable growth of the business. This model, that was already included in the previous business plan, substitutes the initial financing strategy that depended on corporate debt from EDP, the major shareholder of EDPR.
RETAINED CASH FLOW
The primary source of funds for the company is the EBITDA generated from the existing assets, which after paying debt services costs, deduct capital distributions to equity partners and taxes is called Retained Cash Flow, meaning the amount available to pay dividends to EDPR shareholders and/or to fund new investments.
A strong Retained Cash Flow generation of c.€3.9 billion is expected for the period 2016-20, which is cash available after taxes, interests and tax equity costs and distribution to minorities.
EDPR indicated in May 2016, a dividend pay-out ratio policy in the range of 25-35% of its annual net profit, thus allowing most of the Retained Cash Flow to fund growth. The dividends paid in 2016 amounted to c.€44 million corresponding to the low end of the range relative.
ASSET ROTATION
Proceeds from asset rotation transactions are also important sources of funds for the self-funding model of EDPR in financing its profitable growth. This enables the company to cristalize the value yet to be realized from the future cash-flows of its existing projects over their long remaining lifetime and reinvest the corresponding proceeds in the development of new value accretive projects, with superior returns. These transactions involve the company selling minority stakes (typically 49% stake) at project level while maintaining full management control over them. The scope of these transactions tend to be mature projects, generally already operating and thus significantly de-risked, with high visibility of future cash-flows, that can be attractive to low risk institutional investors from whom EDPR can source a competitive cost of finance.

50
For the period 2016-20 EDPR has the target of completing €1.1 billion of Asset Rotation transaction, which as of December 2016 was already executed €550 million.
The execution of those €550 million took place in April 2016, with EDPR entering into an agreement with Vortex, a fund led by EFG Hermes which includes investments from the Gulf Cooperation Council (GCC) countries, to sell a 49% equity shareholding and outstanding shareholders loans in a portfolio of fully-owned wind onshore assets in Spain, Portugal, Belgium and France. The portfolio totalled 664 MW with 4-year average life, of which more than half located in Spain. This transaction was highly valued by the market due to the above market multiple at which EDPR was able to close the deal, €1.73 million/MW, a clear indicator of the quality of the company’s installed asset base that has attracted the interest of many institutional investors.
For the completion of the Asset Rotation target, EDPR will continue to seek accretive projects with superior returns, thus crystallizing value and accelerating profitable growth.
US TAX EQUITY
EDPR always aims to find external financing to its projects, namely through tax equity structures, typical of the US. The use of tax equity in the US enables an efficient utilization of the tax benefits provided by the project, otherwise unusable, therefore improving projects’ economics. In a simplistic view, tax equity investors contribute a sizable part of the initial project investment, receiving in return almost all of the PTCs granted to the project for first 10 years of operation along with the benefits from the accelerated depreciation.
In 2016 EDPR signed two tax equity transactions, a total funding of $457 million comprising 429 MW, related to all projects that started operations in 2016.

51
MANAGEMENT REPORTEDPR 2016
2.3. Risk Management
In line with EDPR’s controlled risk profile, Risk Management process defines the mechanisms for evaluation and management of risks and opportunities impacting the business, increasing the likelihood of the company in achieving its financial targets, while minimizing fluctuations of results.
RISK MANAGEMENT PROCESS
EDPR’s Enterprise Risk Management Process is an integrated and transversal management model that ensures the minimization of the effects of risk on EDPR's capital and earnings, as well as the implementation of best practices of Corporate Governance and transparency. The process aligns EDPR’s risk exposure with the company’s desired risk profile. Risk management policies are aimed to mitigate risks, without ignoring potential opportunities, thus, optimizing return versus risk exposure.
The process is closely followed and supervised by the Audit and Control Committee, an independent supervisory body composed of non-executive members.
Risk management is endorsed by the Executive Committee, supported by the Risk Committee and implemented in day-to-day decisions by all managers of the company.
EDPR created three distinct meetings of the Risk Committee in order to help decision-making, separating discussions on execution of mitigation strategies, from those on the definition of new policies:
RESTRICTED RISK COMMITTEE: Held every month, it is mainly focused on development risk and market riskfrom electricity price (market, basis, profile, GCs and RECs). It is the forum to discuss the evolution of projectsunder development and construction and the execution of mitigation strategies to reduce merchant exposure. Italso monitors the limits of defined risk policies, with regards to counterparty risk, operational risk and country risk.
FINANCIAL RISK COMMITTEE: Held every quarter, it is held to review main financial risks and discuss theexecution of mitigation strategies. Exchange rate risk, interest rate risk and credit risk from financial counterpartiesare most relevant risk reviewed in this committee.
RISK COMMITTEE: Held every quarter, it is the forum where new strategic analyses are discussed and new policiesare proposed for approval to the Executive Committee. Additionally, EDPR’s overall risk position is reviewed, togetherwith EBITDA@Risk and Net Income@Risk.
RISK MAP AT EDPR
Risk Management at EDPR is focused on covering all risks of the company. In order to have a holistic view, they are classified in five Risk Categories.

ENERGYAS THE NEWART
ANNUAL REPORTEDP RENOVÁVEIS 2016
ElectricityPrice Risk
InterestRate Risk
ExchangeRate Risk
Inflation Risk
Liquidity Risk
CommodityPrice Risk
ElectricityProduction Risk
Energy ProductionRisk
Wind TurbinePrice Risk
Equipment PerformanceRisk
Wind TurbineSupply Risk
Regulatory Risk(renewables)
Country Risk Invest. DecisionsCriteria Risk
CompetitiveLandscape Risk Reputational Risk
Corp. Organizationand Governance
Energy Planning
MeteorologicalChanges
TechnologyDisruptions Risk
CounterpartyCredit Risk
CounterpartyOperational Risk
Risk Categories Risk Groups
Mark
et
Ris
ks
Co
un
terp
art
yR
isk
Op
era
tio
nal
Ris
kB
usi
ness
Ris
kS
trate
gic
Ris
k
Development Risk Legal Claims Risk(Compliance)
Execution Risk Personnel Risk
Processes Risk InformationTechnologies Risk
Operation Risk(damage to Physical Assetsand Equip. Performance)
ElectricityPrice Risk
InterestRate Risk
ExchangeRate Risk
Inflation Risk
Liquidity Risk
CommodityPrice Risk
ElectricityProduction Risk
Energy ProductionRisk
Wind TurbinePrice Risk
Equipment PerformanceRisk
Wind TurbineSupply Risk
Regulatory Risk(renewables)
Country Risk Invest. DecisionsCriteria Risk
CompetitiveLandscape Risk Reputational Risk
Corp. Organizationand Governance
Energy Planning
MeteorologicalChanges
TechnologyDisruptions Risk
CounterpartyCredit Risk
CounterpartyOperational Risk
• Hedge of market exposure through long term power purchase agreements (PPA) or short-term financial hedges• Natural FX hedging, with debt and revenues in same currency• Execution of FX hedging for net investment (after deducting local debt)• Execution of FX hedging to eliminate FX transaction risk, mainly in Capex• Fixed interest rates• Alternative funding sources such as Tax equity structures and Multilateral/ Project Finance agreements
• Counterparty exposure limits by counterparty and at EDPR level• Collateral requirement if limits are exceeded• Monitoring of compliance with internal policy
• Supervision of suppliers by EDPR’s engineering team• Flexible CODs in PPAs to avoid penalties• Partnerships with strong local teams• Monitor recurrent operational risks during construction and development• Close Follow-up of O&M costs, turbine availability and failure rates• Insurance against physical damage and business interruption• Strict compliance with legal requirements and zero tolerance for unethical behavior or fraud• Attractive remuneration packages and training for personnel• Revision of all regulations that affects EDPR activity (environmental, taxes…)• Control of internal procedures• Redundancy of servers and control centres of wind farms
• Careful selection of energy markets based on country risk and energy market fundamentals• Diversification in markets and remuneration schemes• Active involvement in all major wind associations in all markets where EDPR is present• Signing of medium term agreements with turbine manufacturers to ensure visibility of turbine
prices and supply• Relying on a large base of turbine suppliers to ensure supply
• Careful selection of countries• Worst case profitability analysis of every new investment considering all risks factors• Risk-return metrics at project and equity level• Consideration of stress case scenarios in the evolution of energy markets for new investment decisions• Follow-up of cost effectiveness of renewables technologies and potential market disruptions
Risk Categories Risk Groups Mitigation Strategies
Mark
et
Ris
ks
Co
un
terp
art
yR
isk
Op
era
tio
nal
Ris
kB
usi
ness
Ris
kS
trate
gic
Ris
k
During 2016, EDPR redefined the Enterprise Risk Management Framework for the company, framing all existing risk policies/procedures under each Risk Category:
• Market Risk: Energy Price Hedging Policy, FTR participation procedure, US Active Scheduling Procedure.• Counterparty Risk: Counterparty Risk Policy.• Operational Risk: Operational Risk Policy.• Strategic Risk: Country Risk Policy.
Additionally, in 2016 EDPR reassessed Operational Risk for the company, executing a bottom-up analysis across all departments, as stated in EDPR’s Operational Risk Policy. The new assessment replaces the one executed in 2014 and it will be used when evaluating Net Income@risk, the structural risk measure that considers all risk factors and is recurrently monitored by the Risk Committee.
Within each Risk Category, risks are classified in Risk Groups. The full description of the risks and how they are managed can be found in the Corporate Governance chapter. The graph above summarizes the Risk Categories, the Risk Groups and the Risk Management mitigation strategies at EDPR.
Development Risk Legal Claims Risk(Compliance)
Execution Risk Personnel Risk
Processes Risk InformationTechnologies Risk
Operation Risk(damage to Physical Assetsand Equip. Performance)
Defined as the risk of loss resulting from inadequate or failed internal processes, people and systems or from external events (such as an increase in equipment default rates, increasing O&M, or natural disasters).
Potential loss in the company's earnings due to adverse changes in business margins. Such losses can result, above all, from a serious increase in equipment prices or changes in the regulatory environment. Changes in electricity prices and wind production are considered market risks.
It refers to risks coming from macroeconomic, political, social or environmental situation in countries where EDPR is present, as well as those coming from a change in competitive landscape, from technology disruptions, from changes in energy markets or from governance decisions (investment decisions criteria, Corporate Governance and Reputational issues).
Risk that counterparty to a transaction could default before final settlement of the transaction’s cash flows. A direct economic loss would occur if transactions with the counterparty had positive economic value at the time of default. Even in the case of not defaulting, it may not comply with its contract obligations (timing, quality, etc.), implying additional higher costs due to its replacement orto delays in fulfilling the contract.
It refers to the risk to EDPR resulting from movements in market prices. Due to the relationship between wind production and electricity price production risk is considered within market risk.In particular, market risks are changes in electricity prices, production risk, interest rates, foreign exchange rates and other commodity prices.
52

ENERGYAS THE NEWART
MANAGEMENT REPORTEDPR 2016
ElectricityPrice Risk
InterestRate Risk
ExchangeRate Risk
Inflation Risk
Liquidity Risk
CommodityPrice Risk
ElectricityProduction Risk
Energy ProductionRisk
Wind TurbinePrice Risk
Equipment PerformanceRisk
Wind TurbineSupply Risk
Regulatory Risk(renewables)
Country Risk Invest. DecisionsCriteria Risk
CompetitiveLandscape Risk Reputational Risk
Corp. Organizationand Governance
Energy Planning
MeteorologicalChanges
TechnologyDisruptions Risk
CounterpartyCredit Risk
CounterpartyOperational Risk
Risk Categories Risk Groups
Mark
et
Ris
ks
Co
un
terp
art
yR
isk
Op
era
tio
nal
Ris
kB
usi
ness
Ris
kS
trate
gic
Ris
k
Development Risk Legal Claims Risk(Compliance)
Execution Risk Personnel Risk
Processes Risk InformationTechnologies Risk
Operation Risk(damage to Physical Assetsand Equip. Performance)
ElectricityPrice Risk
InterestRate Risk
ExchangeRate Risk
Inflation Risk
Liquidity Risk
CommodityPrice Risk
ElectricityProduction Risk
Energy ProductionRisk
Wind TurbinePrice Risk
Equipment PerformanceRisk
Wind TurbineSupply Risk
Regulatory Risk(renewables)
Country Risk Invest. DecisionsCriteria Risk
CompetitiveLandscape Risk Reputational Risk
Corp. Organizationand Governance
Energy Planning
MeteorologicalChanges
TechnologyDisruptions Risk
CounterpartyCredit Risk
CounterpartyOperational Risk
• Hedge of market exposure through long term power purchase agreements (PPA) or short-term financial hedges• Natural FX hedging, with debt and revenues in same currency• Execution of FX hedging for net investment (after deducting local debt)• Execution of FX hedging to eliminate FX transaction risk, mainly in Capex• Fixed interest rates• Alternative funding sources such as Tax equity structures and Multilateral/ Project Finance agreements
• Counterparty exposure limits by counterparty and at EDPR level• Collateral requirement if limits are exceeded• Monitoring of compliance with internal policy
• Supervision of suppliers by EDPR’s engineering team• Flexible CODs in PPAs to avoid penalties• Partnerships with strong local teams• Monitor recurrent operational risks during construction and development• Close Follow-up of O&M costs, turbine availability and failure rates• Insurance against physical damage and business interruption• Strict compliance with legal requirements and zero tolerance for unethical behavior or fraud• Attractive remuneration packages and training for personnel• Revision of all regulations that affects EDPR activity (environmental, taxes…)• Control of internal procedures• Redundancy of servers and control centres of wind farms
• Careful selection of energy markets based on country risk and energy market fundamentals• Diversification in markets and remuneration schemes• Active involvement in all major wind associations in all markets where EDPR is present• Signing of medium term agreements with turbine manufacturers to ensure visibility of turbine
prices and supply• Relying on a large base of turbine suppliers to ensure supply
• Careful selection of countries• Worst case profitability analysis of every new investment considering all risks factors• Risk-return metrics at project and equity level• Consideration of stress case scenarios in the evolution of energy markets for new investment decisions• Follow-up of cost effectiveness of renewables technologies and potential market disruptions
Risk Categories Risk Groups Mitigation Strategies
Mark
et
Ris
ks
Co
un
terp
art
yR
isk
Op
era
tio
nal
Ris
kB
usi
ness
Ris
kS
trate
gic
Ris
k
During 2016, EDPR redefined the Enterprise Risk Management Framework for the company, framing all existing risk policies/procedures under each Risk Category:
• Market Risk: Energy Price Hedging Policy, FTR participation procedure, US Active Scheduling Procedure.• Counterparty Risk: Counterparty Risk Policy.• Operational Risk: Operational Risk Policy.• Strategic Risk: Country Risk Policy.
Additionally, in 2016 EDPR reassessed Operational Risk for the company, executing a bottom-up analysis across all departments, as stated in EDPR’s Operational Risk Policy. The new assessment replaces the one executed in 2014 and it will be used when evaluating Net Income@risk, the structural risk measure that considers all risk factors and is recurrently monitored by the Risk Committee.
Within each Risk Category, risks are classified in Risk Groups. The full description of the risks and how they are managed can be found in the Corporate Governance chapter. The graph above summarizes the Risk Categories, the Risk Groups and the Risk Management mitigation strategies at EDPR. The full description of the risks and how they are managed can be found in the Corporate Governance chapter.
Development Risk Legal Claims Risk(Compliance)
Execution Risk Personnel Risk
Processes Risk InformationTechnologies Risk
Operation Risk(damage to Physical Assetsand Equip. Performance)
Defined as the risk of loss resulting from inadequate or failed internal processes, people and systems or from external events (such as an increase in equipment default rates, increasing O&M, or natural disasters).
Potential loss in the company's earnings due to adverse changes in business margins. Such losses can result, above all, from a serious increase in equipment prices or changes in the regulatory environment. Changes in electricity prices and wind production are considered market risks.
It refers to risks coming from macroeconomic, political, social or environmental situation in countries where EDPR is present, as well as those coming from a change in competitive landscape, from technology disruptions,from changes in energy markets or from governance decisions (investment decisions criteria, Corporate Governance and Reputational issues).
Risk that counterparty to a transaction could default before final settlement of the transaction’s cash flows. A direct economic loss would occur if transactions with the counterparty had positive economic value at the time of default. Even in the case of not defaulting, it may not comply with its contract obligations (timing, quality, etc.), implying additional higher costs due to its replacement orto delays in fulfilling the contract.
It refers to the risk to EDPR resulting from movements in market prices. Due to the relationship between wind production and electricity price production risk is considered within market risk.In particular, market risks are changes in electricity prices, production risk, interest rates, foreign exchange rates and other commodity prices.

54
EDPR RISK MATRIX BY RISK CATEGORY
EDPR Risk Matrix is a qualitative assessment of likelihood and impact of the different risk categories within the company. It is dynamic and it depends on market conditions and future internal expectations.
FOCUS ON ERM FRAMEWORK AT EDPR
A corporation can manage risks in two different ways, one risk at a time on a largely and compartmentalized basis, or all risks together within a coordinated and strategic framework. The latter approach is called “Enterprise Risk Management” and is the approach used at EDPR.
Enterprise risk management (ERM) is the process of planning, organizing, leading and controlling the activities of an organization in order to minimize the effects of risk on an organization's capital and earnings. Enterprise risk management expands the process to include not just risks associated with accidental losses, but also financial, strategic and other risks.
Contents of an ERM Framework are defined similarly by different sources (Basel Committee, International Organization for Standardization and academic literature). In the case of EDPR, it was decided to follow Basel guidelines for ERM, adapted to the specificities of the renewable electricity generation business.

MANAGEMENT REPORTEDPR 2016
3 Execution
Economic
Operational Performance 59Financial Performance 61
Stakeholders
Employees 70Communities 74Suppliers 77Media 80
Safety First 81
Environment 82
Innovation 84

SUNAS THE NEWART

SUNAS THE NEWART

16

59
MANAGEMENT REPORTEDPR 2016
3 Execution
3.1 Economic
3.1.1 OPERATIONAL PERFORMANCE
Installed capacity increased 770 MW including 200 MW in a new country: Mexico.
EDPR continues to deliver solid selective growth With a top quality portfolio, EDPR has a strong track record and proven capability to execute superior projects and deliver on targets. The installed asset base of 10.4 GW is not only young, on average 6 years, it is also mostly certified in terms of environmental and health and safety standards. Since 2008, EDPR has more than doubled its installed capacity by adding 6 GW, resulting in a total installed capacity of 10,408 MW (EBITDA + Net Equity). As of year-end 2016, EDPR had installed 5,163 MW in Europe, 5,041 MW in North America and 204 MW in Brazil.
2016 installations concentrated in North America The largest growth in installed capacity occurred due to the completion of 629 MW in North America. This includes EDPR’s first 200 MW in Mexico. All of the MW had previously secured PPA contracts, thus providing long-term stability and visibility on the revenue stream.
In Europe 72 MW were installed, 44 MW in Italy, 24 MW in France and 4 MW in Portugal. The 22 net MW added in Europe includes the deconsolidation (in the 1Q16) of 50 MW, following the completion of the cross sale of two wind farms in Poland, by which EDPR sold its 60% share in a 50 MW wind farm and bought the remaining 35% share in a 54 MW wind farm (already fully accounted as EBITDA MW). Finally, 2016 saw the completion of EDPR’s largest to date project in Brazil, Baixa do Feijão wind farm (120 MW).
3%
16%
82%
+770 MW in 2016
EU
BR
NA
23%
12%15%
48%
2%
10.4 GW EBITDA + Net Equity
SP
PT
RoE
NA
BR
YE16 YE15 Var. YE16 YE15 Var. YE16 YE15 Var. Spain 2,194 2,194 - 26% 26% +0pp 4,926 4,847 +2%
Portugal 1,251 1,247 +4 28% 27% +1pp 3,047 1,991 +53%
Rest of Europe 1,541 1,523 +18 25% 27% -2pp 3,257 3,225 +1%
France 388 364 +24 23% 26% -3pp 777 785 -1%
Belgium 71 71 - 21% 25% -4pp 128 152 -16%
Italy 144 100 +44 28% 28% -0pp 258 210 +23%
Poland 418 468 -50 25% 28% -3pp 951 951 -0%
Romania 521 521 - 25% 26% -1pp 1,143 1,127 +1%
Europe 4,986 4,965 +22 26% 26% -0pp 11,230 10,062 +12%
US 4,631 4,203 +429 33% 32% +1pp 12,501 11,031 +13%
Canada 30 30 - 28% 27% +1pp 75 72 +4%
M exico 200 +200
North America 4,861 4,233 +629 33% 32% +1pp 12,576 11,103 +13%
Brazil 204 84 +120 35% 30% +4pp 666 222 +200%
EB IT D A 10 ,0 52 9 ,2 8 1 +770 3 0 % 2 9 % +0 p p 2 4 ,4 73 2 1,3 8 8 +14 %
Other equity consolidated 356 356
Spain 177 177
United States 179 179
EB IT D A + Equit y co nso l. 10 ,4 0 8 9 ,6 3 7 +770
MW NCF GWh

60
14% Increase in YoY generation
EDPR generated 24.5 TWh during 2016. When adding the over 2 TWh produced from our equity projects, enough clean energy to serve 53% of the electricity demand of Portugal.
The 14% year-on-year increase in the electricity output benefited from the capacity additions over the last 12 months and ENEOP consolidation.
EDPR achieved a 30% load factor during 2016 (vs 29% in 2015) reflecting the benefits of a balanced portfolio across different geographies.
EDPR also achieved a stellar 98% availability. The company continues to leverage on its competitive advantages to maximize wind farm output and on its diversified portfolio to minimize the wind volatility risk.
Premium performance and diversified portfolio delivers balanced output
EDPR’s operations in North America were the main driver for the electricity production growth in 2016, increasing by +13% YoY to 12.6 TWh and represented 51% of the total output. This performance was driven by EDPR’s unique ability to capture the wind resource available along with the contribution from new additions. EDPR achieved a 33% load factor in North America, +1pp vs. 2015.
Production growth in Europe increased 12% vs 2015 to 11.2 TWh mainly supported by ENEOP consolidation (+1.0 TWh vs 2015) and by 2% output increase in Spain and 1% in rest of Europe with lower wind resource being offset by the higher installed capacity.
EDPR achieved a 28% load factor in Portugal (+1pp) reflecting an above average wind resource. In the period, EDPR delivered a load factor of 26% in Spain, once again a solid premium over the Spanish market average load factor (+2pp).
The Rest of Europe operations delivered a 25% load factor (27% in 2015) and posted higher year on year generation (+1%). Higher production in Italy (+49 GWh) and Romania (+16 GWh) was partially offset by weaker performances in Belgium (-24 GWh) and France (-8 GWh), with weaker wind resource offsetting capacity additions. Poland remained stable year on year with the new capacity offsetting lower load factor.
248 MW of 2017 additions already under construction consolidating a young fleet in continuous growth
By the end of 2016, EDPR had 248 MW under construction all related to projects to be delivered in 2017 with long term secured remuneration.
In US, EDPR started the works of the 100 MW Meadow Lake V project in Indiana. In Brazil EDPR has 127 MW under construction related to the JAU&Aventura projects after successfully bidding in the A5 auction for 20 year PPAs.
Finally in Europe, 21 MW were under construction, of which 18 MW in France and 3 MW in Portugal.
As a result of continuous growth effort, EDPR also has a young portfolio with an average operating age of 7 years, with an estimate of over 18 years of useful life remaining to be captured.
In Europe, EDPR’s portfolio had an average age of 7 years, in North America 6 years, and in Brazil 3 years.
9.2
7.7
6.7
7.0
4.3
4.7
2.2
6.0
3.1
2.9
6.5
0 10 20 30
Spain
Portugal
France
Belgium
Poland
Romania
Italy
US
Canada
Brazil
EDPR
Assets' Average Age and Useful Life (years)
52% 51%
15% 13%
9% 12%
23% 20%
1% 3%
FY15 FY16
NA RoE PT SP BR
21.4 TWh 24.5 TWh

61
MANAGEMENT REPORTEDPR 2016
3.1.2. FINANCIAL PERFORMANCE
Revenues increased 7% YoY to 1.7 billion euros and EBITDA summed 1.2 billion euros. In 2016, EDPR revenues totalled 1,651 million euros, an increase of 104 million euros when compared with 2015 mainly from capacity additions with an above portfolio average wind resource and with YoY comparison negatively impacted by an update, in 2015, of TEI’s post-flip residual interest accretion. Despite the lower than long-term average wind resource, EDPR’s output in the period increased 14%. The average selling price decreased by 5% mainly as a result of capacity additions mix (product vs price).
Reported EBITDA increased 3% year on year to 1,171 million euros, with 29 million euros negative impact lower than average wind resource, leading to an EBITDA margin of 71%. If adjusted by non-recurring items, 2016 EBITDA increased 12% and EBITDA per MW in operation increased 1% to 128 thousand euros. Net Operating Costs totalled 480 million euros, with higher capacity in operation. Core opex (defined as Supplies and Services along with Personnel Costs) per average MW in operation decreased 5% YoY as a consequence of EDPR’s strict control over costs and O&M programs in place.
Net profit reached 56 million euros All in all, Net Profit totalled 56 million euros and Adjusted Net Profit 104 million euros, if adjusted for non-recurring events (one-offs: 2015 +59 million euros; 2016 -47 million euros).
Retained cash flow incresed 13% yoy to 698 million euros, capturing assets’ cash generation capabilities. Despite the challenging year EDPR was able to deliver a robust cash-flow generation. Following EBITDA cash-generation, income tax of the period, interests, banking and derivatives expenses and minority dividends/interest payments, 2016 Retained Cash-Flow increased 13% to €698m.
Capital expenditures (Capex) totalled 1,029 million euros reflecting the capacity added in the period, the capacity under construction and enhancements in capacity already in operation. Pursuing its asset roation strategy, in 2016, EDPR received proceeds of 1,189 million euros from the sale of non-controlling interests. On the back of its Asset Rotation strategy was completed the settlement of Axium transaction, signed in November 2015, EFG Hermes deal, signed in April 2016, and was completed the closing of European transactions with CTG, signed in December 2015.
In the period, Net Debt totaled 2,755 milion euros, lower YoY by 952 million euros.
Financial Highlights (€m) 2016 2015 % / €
Income StatementRevenues 1,651 1,547 +7%
EBITDA 1,171 1,142 +3%
Net Profit (at t ributable to EDPR equity holders) 56 167 (66%)
Cash-FlowOperat ing Cash-Flow 869 701 +24%
Retained Cash-Flow 698 616 +13%
Net investments 96 719 (87%)
Balance SheetAssets 16,734 15,736 +998
Equity 7,573 6,834 +739
Liabilit ies 9,161 8,902 +259
LiabilitiesNet Debt 2,755 3,707 -952
Inst itut ional Partnerships 1,520 1,165 +355

62
INCOME STATEMENT
Solid top line performance EDPR revenues increased 7% year on year to 1,651 million euros, despite the lower than long-term average wind resource and propelled by capacity additions with an above portfolio average wind resource and with YoY comparison negatively impacted by 2015 update of TEI´s post-flip residual interest accretion.
Other operating income amounted 54 million euros, benefitting from a capital gain related to Polish wind farm cross-sale and with year on year comparison impacted by the gain subsequent to the control acquisition of certain assets of ENEOP (2015). Operating Costs (Opex) totalled 534 million euros, with higher capacity in operation. In detail, Core Opex totalled 399 million euros, with Core Opex per Avg. MW and per MWh decreasing by 5% and 8% respectively, reflecting strict control over costs and EDPR’s asset management strategy. Other operating costs decreased by 54 million euros to 135 million euros, mainly explained by lower write-offs in the period.
In 2016, EBITDA increased 3% year on year to 1,171 million euros, leading to an EBITDA margin of 71%. If adjusted by one-offs, 2016 EBITDA increased 12% and EBITDA per MW in operation increased 1% to 128 thousand euros.
Operating income (EBIT) decreased 2% YoY to 564 million euros, on the back of 8% increase in depreciation and amortization costs (including provisions, impairments and net of government grants), due to capacity additions. In 2016 EDPR’s provisions totalled 5 million euros related to Portuguese subsidies’ clawback from public development programs.
At the financing level, Net Financial Expenses increased 23%. Net interest costs decreased 6%, benefitting from the lower cost of debt in the period after debt renegotiations with EDP and others. Institutional Partnership costs were 11 million euros higher year on year, reflecting mainly new tax equity deals, while capitalized expenses remained flat. Forex differences and derivatives had a positive impact of 10 million euros in the period. Other financial expenses increased by 77 million euros, including one-offs mainly from debt repayment/restructuring and 14 million euros from discontinue hedge accounting related to Spanish operations, while year on year comparison is also impacted by ENEOP consolidation in September 2015.
Pre-Tax Profit increased to 214 million euros, with income taxes totaling 38 million euros. Non-controlling interests increased to 120 million euros mainly due to EDPR settlement of asset rotation and CTG deals. All in all, Net Profit totalled 56 million euros and Adjusted Net Profit 104 million euros if adjusted for non-recurring events.
Consolidated Income Statement (€m) 2016 2015 % / €
R evenues 1,6 51 1,54 7 +7%
Other operat ing Income 54 162 (67%)
Supplies and services (305) (293) +4%
Personnel costs (94) (84) +11%
Other operat ing costs (135) (189) (29%)
Operat ing Costs (net) (480) (405) +19%
EB IT D A 1,171 1,14 2 +3 %
EBITDA/Net Revenues 71% 74% (3pp)
Provisions (4.7) 0.2 -
Depreciation and amortisat ion (624) (587) +6%
Amort ization of government grants 22 23 (3%)
EB IT 56 4 578 ( 2 %)
Financial Income / (expenses) (350) (285) +23%
Share of prof its of associates (0.2) (2) (88%)
Pre- t ax p ro f it 2 14 2 9 1 ( 2 7%)
Income taxes (38) (45) (17%)
Prof it of the period 176 245 (28%)
N et Pro f it Equit y ho ld ers o f ED PR 56 16 7 ( 6 6 %)
Non-controlling interest 120 79 +52%

63
MANAGEMENT REPORTEDPR 2016
BALANCE SHEET
Total equity increases by 739 million euros Total Equity of 7.6 billion euros increased by 739 million euros in 2016, of which 585 million euros attributable to non-controlling interests. The increased equity attributable to the shareholders of EDPR by 154 million euros is due to mainly the 56 million euros of Net Profit and 160 million euros of Asset Rotation transactions, reduced by the 44 million euros in dividend payments.
Total liabilities increased 3% by +259 million euros, mainly in accounts payable (+488 million euros) and institutional partnerships (+355 million euros), offset by a reduction in financial debt (-814 million euros).
With total liabilities of 9.2 billion euros, the debt-to-equity ratio of EDPR stood at 121% by the end of 2016, which is a decrease from the 130% in 2015. Liabilities were mainly composed of financial debt (37%), liabilities related to institutional partnerships in the US (17%) and accounts payable (30%).
Liabilities to tax equity partnerships in the US stood at 1,520 million euros, and including +628 million dollars of new tax equity proceeds received in the 2016. Deferred revenues related to institutional partnerships primarily represent the non-economic liability associated to the tax credits already realized by the institutional investor, arising from accelerated tax depreciation, and yet to be recognized as income by EDPR throughout the remaining useful lifetime of the respective assets.
Deferred tax liabilities reflect the liabilities arising from temporary differences between the accounting and the tax basis of assets and liabilities. Accounts payables include trade suppliers, PP&E suppliers, deferred income related to investment grants received and derivative financial instruments.
As total assets totalled 16.7 billion euros in 2016, the equity ratio of EDPR reached 45%, versus 43% in 2015. Assets were 80% composed of net PP&E - property, plant and equipment, reflecting the cumulative net invested capital in renewable energy generation assets.
Total net PP&E of 13.4 billion euros changed to reflect 1,156 million euros of new additions during the year and 256 million euros from forex translation (mainly as the result of a US Dollar appreciation), reduced by 620 million euros for depreciation charges, impairment losses and write-offs.
Net intangible assets of 1.6 billion euros mainly include 1.4 billion euros from goodwill registered in the books, for the most part related to acquisitions in the US and Spain, while accounts receivable are mainly related to loans to related parties, trade receivables, guarantees and tax receivables.
Statement of Financial Position (€m)
2016 2015 % / €
AssetsProperty, plant and equipment, net 13,437 12,612 +825
Intangible assets and goodwill, net 1,596 1,534 +62
Financial investments, net 348 340 +8
Deferred tax assets 76 47 +29
Inventories 24 23 +1
Accounts receivable – t rade, net 266 222 +44
Accounts receivable – other, net 338 338 (0)
Collateral deposits 0 110 (110)
Cash and cash equivalents 46 73 (27)
Assets held for sale 603 437 +166
T o t al A sset s 16 ,73 4 15,73 6 +9 9 8
2016 2015 % / €
EquityShare capital + share premium 4,914 4,914 -
Reserves and retained earnings 1,155 891 +264
Net prof it (equity holders of EDPR) 56 167 (110)
Non-controlling interests 1,448 863 +585
T o t al Eq uit y 7,573 6 ,8 3 4 +73 9
LiabilitiesFinancial debt 3,406 4,220 (814)
Inst itut ional partnerships 1,520 1,165 +355
Provisions 275 121 +154
Deferred tax liabilit ies 365 316 +49
Deferred revenues frominst itut ional partnerships
819 791 +28
Accounts payable – net 2,776 2,288 +488
T o t al Liab il it ies 9 ,16 1 8 ,9 0 2 +2 59
T o t al Eq uit y and Liab ili t ies 16 ,73 4 15,73 6 +9 9 8

64
CASH FLOW STATEMENT
Strong operating cash-flow In 2016, EDPR generated Operating Cash-Flow of 869 million euros, an increase of 24% year on year, reflecting EBITDA performance and reinforcing the generation capabilities of its assets in operation.
The key items that explain 2016 cash-flow evolution are the following:
Operating Cash-Flow, which is the EBITDA net of income tax and adjusted by non-cash items (namely income from US institutional partnerships) and net of changes in working capital, increased 24% to 869 million euros.
Capital expenditures with capacity additions, ongoing construction and development works totalled 1,029 million euros. Other net investing activities amounted 20 million euros, mostly reflecting EDPR investments in projects developed in partnership and equipment suppliers invoices already booked but not yet paid.
Pursuing its Asset Rotation strategy, in 2016 occurred the settlement of Axium transaction, EFG Hermes deal and the settlement of European transactions with CTG, for a combined amount of 1,189 million euros.
Proceeds from new institutional tax equity financing structure totalled 624 million euros, related to the 199 MW Waverly wind farm tax equity signed in the 4Q15 along with 2016 projects of 429 MW. Payments to institutional partnerships totalled 172 million euros contributing to the reduction of Institutional Partnership liability. Total net dividends and other capital distributions paid to minorities amounted to 146 million euros (including 44 million euros to EDPR shareholders). In the period, Forex & Other had a negative impact increasing Net Debt by 207 million euros.
In terms of Retained Cash Flow, which captures the cash generated by operations to re-invest, distribute dividends and amortize debt, it increased 13% to 698 million euros. In December 2016, Net Debt & Institutional Partnership Liability decreased by 597 million euros.
Cash Flow (€m) 2016 2015 % / €
EBITDA 1,171 1,142 +3% Current Income Tax (50) (51) (3%)
Net interest costs (179) (188) (5%)
Share of prof its of associates (0.2) (2) (88%)
FFO ( F unds f ro m op erat ions) 9 4 2 9 0 1 +5%
Net interest costs 179 188 (5%)
Income from associated companies 0.2 2 (88%)
Non-cash items adjustments (209) (263) (20%)
Changes in working capital (43) (127) (66%)
Operat ing C ash F low 8 6 9 70 1 +2 4 %
Capex (1,029) (903) +14%
Financial Investments (31) (157) (80%)
Changes in working capital related to PP&E suppliers 10 26 (61%)
Government Grants 0.8 1.5 (44%)
N et Op erat ing C ash F low ( 18 1) ( 3 3 0 ) ( 4 5%)
Sale of non-controlling interests and shareholders' loans 1,189 395 -
Proceeds/(Payments) related to Inst itut ional partnerships 452 68 -
Net interest costs (post capitalisat ion) (156) (165) (6%)
Dividends net and other capital distribut ions (146) (115) +26%
Forex & Other (207) (277) (25%)
D ecrease / ( Increase) in N et D eb t 9 52 ( 4 2 5) ( 3 2 4 %)

65
MANAGEMENT REPORT EDPR 2016
FINANCIAL DEBT
Long-term and stable debt profile EDPR’s total Financial Debt decreased by 952 million euros to 2.8 billion euros, reflecting the settlement of Asset Rotation transactions, the cash flow generated by the assets and the investments done in the period.
Loans with EDP group, EDPR’s principal shareholder, accounted for 77% of the debt, while loans with financial institutions represented 23%.
To continue to diversify its funding sources EDPR keeps on executing top quality projects enabling the company to secure local project finance at competitive costs. In 2016, EDPR signed a project finance transaction for its first wind farm in Mexico. The long-term contracted debt facility amounts to 278 million US Dollars.
As of December 2016, 49% of EDPR's financial debt was Euro denominated, 41% was funded in US Dollars, related to the company's investment in the US, and the remaining 10% was mostly related with debt in Polish Zloty and Brazilian Real.
EDPR continues to follow a long-term fixed rate funding strategy, matching the operating cash-flow profile with its financial costs and therefore mitigating interest rate risk. Accordingly, as of December 2016, 90% of EDPR’s financial debt had a fixed interest rate and only 3% had maturity schedule for 2017. In December 2016, 54% of EDPR’s financial debt had maturity in 2018 (reflecting a set of 10-year loans granted by EDP in 2008), 13% in 2019 and 30% in 2020 and beyond.
As of December 2016 the average interest rate was 4.0%, lower versus December 2015, reflecting debt restructuring and early debt amortized in the period. In December 2016, EDPR early amortized 364 million US Dollars with maturity scheduled for 2018/19, which was contracted in 2009 with EDP.
Institutional partnerships Liabilities referred to Institutional Partnerships increased to 1,520 million euros from 1,165 million euros in 2015, reflecting the benefits captured by the tax equity partners during the period and the establishment of a new institutional Tax Equity financing structure.
Financial Debt (€m) 2016 2015 €
Nominal Financial Debt + Accrued interests 3,406 4,220 -814
Collateral deposits associated with Debt 46 73 -27
T o t al F inancial D eb t 3 ,3 6 0 4 ,14 7 - 78 7
Cash and Equivalents 603 437 +166
Loans to EDP Group related companies and cash pooling 1 3 -1
Financial assets held for t rading 0 0 0
C ash & Eq uivalent s 6 0 5 4 3 9 +16 5
N et D eb t 2 ,755 3 ,70 7 - 9 52

66
EUROPE
Revenues In Europe, EDPR delivered revenues of 913 million euros, an increase of 81 million euros versus 2015, reflecting the impact from higher electricity output that increased 12% versus 2015 to 11.2 TWh, and despite lower average selling price. European output benefited from capacity additions over the period along with a stable 26% load factor. In 2016, European generation accounted for 46% of EDPR total output.
In detail, the increase in revenues was mainly the result of higher revenues in Portugal, with an increase of 78 million euros versus 2015 propelled by ENEOP consolidation.
Average selling price In the period, EDPR average selling price in Europe decreased 2% to 81 euros per MWh, mainly driven by a 7% lower average selling price in Portugal, due to a different mix of wind farms in operation following the consolidation of 613 MW from ENEOP in September 2015, and the 15% lower average selling price in Poland on the back of green certificates price evolution and forex translation.
Net operating costs Net Operating costs increased 106 million euros, to 247 million euros, mainly explained by the decreased in Other operating income impacted by a capital gain subsequent to the sale of EDPR 60% share in a 50 MW wind farm in Poland and with year on year comparison affected by the gain subsequent to the control acquisition of certain assets of ENEOP accounted in 2015. Supplies and Services and Personnel costs increased year on year on the back of higher capacity in operation and Other operating costs decreased 15 million euros, reflecting EDPR´s strict control over costs.
In 2016, Supplies & Services and Personnel Costs per average MW in operation decreased 3% year on year to 39 thousand euros, supported by EDPR’s asset management strategy and higher capacity in operation. Supplies & Services and Personnel Costs per MWh decreased 3% year on year to 17.1 euros benefited from the higher output in the period.
All in all, EBITDA in Europe totalled 666 million euros, leading to an EBITDA margin of 73%, while EBIT reached 360 million euros. In the period, impairments and provisions for contingencies amounted to 9 million euros.
Europe Income Statement (€m) 2016 2015 % / €
Revenues 913 832 +10% Other operat ing income 35 140 (75%)
Supplies and services (162) (151) +7%
Personnel costs (30) (27) +14%
Other operat ing costs (89) (104) (15%)
Op erat ing C o st s ( net ) ( 2 4 7) ( 14 1) +74 %
EBITDA 666 690 (3%)EBITDA/Net Revenues 73% 83% (10pp)
Provisions (5) (0) -
Depreciat ion and amort isat ion (303) (291) +4%
Amort izat ion of government grants 1 2 (36%)
EBIT 360 401 (10%)

67
MANAGEMENT REPORT EDPR 2016
NORTH AMERICA
Revenues
In 2016, Revenues increased 1% to 781 million US Dollars, on the back of the 13% increase in electricity output, offsetting the lower average selling price in the period.
Average selling price Average selling price in the region decreased 9% versus 2015, at $46 per MWh. In the US wholesale prices plus hedges were stable year on year but average realized merchant price was negatively impacted by a 200 MW PPA expiration in the first quarter of 2016 and with 2015 benefiting from the sale of 2014 REC stock. In Canada, the average selling price was $109 per MWh, 3% lower than previous year in US Dollars, penalized by forex translation (stable versus 2015 in local currency).
Net operating costs Net Operating costs summed 225 million US Dollars, 34 million US Dollars lower than in 2015, mainly explained by the decrease in Other operating costs, with year on year comparison affected by the 46 million US Dollars write-offs recognized in 2015. Personnel costs and Supplies and Services, justified by the higher capacity in operation and the Operational and Maintenance strategy, increased 9 million US Dollars. Supplies and Services and Personnel costs per average MW in operation decreased by 4% versus 2015 to 48 thousand US Dollars, reflecting EDPR focus on efficiency and control over costs along with an increase in average MW in operation. Core Opex per MWh decreased by 7% to $16, also benefitting by the higher wind resource in the period.
Institutional partnerships and government grants Income from institutional partnerships stood stable at 219 million US Dollars, reflecting new tax equity partnerships, the output of the projects generating PTCs and with year on year comparison impacted by 2015 one-off event (33 million Dollars), from an update of tax equity investors’ post-flip residual interest accretion.
In 2016, EDPR received 308 million US Dollars as part of an asset rotation transaction signed in 2015. It also received 238 million US Dollars from an institutional partnership structure signed in October 2015. In addition, EDPR completed 457 million US Dollars of tax equity financing in exchange for an interest in the 250 MW Hidalgo, the 78 MW Jericho Rise and in the 101 MW Amazon Wind Farm US Central project (Timber Road III).
All in all, EBITDA went up 8% to 555 million US Dollars, leading the EBITDA margin to increase to 71%.
North America Income Statement (US$ 2016 2015 % / €
Electricity Sales & Other 562 553 +2%
Income from Inst itut ional Partnerships 219 219 (0%)
Revenues 781 772 +1%
Other operat ing income 26 22 +18%
Supplies and services (154) (149) +4%
Personnel costs (49) (45) +9%
Other operat ing costs (48) (88) (45%)
Op erat ing C o st s ( net ) ( 2 2 5) ( 2 59 ) ( 13 %)
EBITDA 555 513 +8%EBITDA/Net Revenues 71% 66% +5pp
Provisions 0 0 (53%)
Depreciat ion and amort isat ion (343) (320) +7%
Amort izat ion of government grants 23 23 -
EBIT 235 216 +9%

68
BRAZIL
Revenues In Brazil, EDPR reached revenues of 133 million reais, representing a year on year increase of 68%, explained by an increased in electricity generation on the back of higher generation capacity and a stronger load factor.
Average selling price The average selling price in Brazil decreased 42% to R$216 per MWh, reflecting mainly the different mix of a new wind farm in operation (production versus price).
In December 2016, EDPR had 204 MW of wind-installed capacity in Brazil, of which 84 MW under incentive programs for renewable energy development (PROINFA) and 120 MW awarded according with an auction system. Under these programs the projects were awarded with long-term contracts to sell the electricity produced for 20 years, providing long-term visibility over cash-flow generation throughout the projects’ life.
Net operating costs Net Operating costs totalled 36 million reais, an increase of 2 million reais versus 2015 mainly due to lower Other operating costs, that decreased 42% reflecting EDPR´s strict control over costs and increased efficiency, and to Core Opex, that totalled 36 million reais impacted by the higher capacity in operation. Core Opex per average MW and per MWh decreased year on year by 25% and 54% respectively.
Following the outstanding top line performance, in 2016, EBITDA reached 97 million reais, an increase of 113% versus previous year, leading to a 15pp increased of the EBITDA margin.
Brazil Income Statement (R$m) 2016 2015 % / €
Revenues 133 79 +68% Other operat ing income 6 2 -
Supplies and services (28) (21) +38%
Personnel costs (8) (6) +38%
Other operat ing costs (6) (10) (42%)
Op erat ing C o st s ( net ) ( 3 6 ) ( 3 4 ) +7%
EBITDA 97 45 +113% EBITDA/Net Revenues 73% 58% +15pp
Provisions 0 0 -
Depreciat ion and amort isat ion (31) (19) +65%
Amort izat ion of government grants 0 0 +80%
EBIT 66 27 +147%
69
MANAGEMENT REPORT EDPR 2016
Other reporting topics
RELEVANT AND SUBSEQUENT EVENTS
The following are the most relevant events from 2016 that have an impact in 2017 and subsequent events from the first months of 2017 until the publication of this report.
EDPR announces the sale of a minority stake in Portuguese assets to CTG Ordinances 268-B/2016 and 69/2017 EDPR awarded long term contracts for 127 MW at the Italian wind auction EDPR concludes the sale of minority stakes in Poland and Italy EDPR established new institutional partnership structure for 328 MW and 101 MW in the US EDPR secures PPA for new 200 MW and 75 MW wind farms in the United States EDPR closed an asset rotation transaction in Europe, for a total consideration of €550 million
For additional information on these events, please refer to Note 39 of EDPR Consolidated Annual Accounts.
INFORMATION ON AVERAGE PAYMENT TERMS TO SUPPLIERS
In 2016 total payments made from Spanish companies to suppliers, amounted to €123,520 thousand with a weighted average payment period of 52 days, below the payment period stipulated by law of 60 days.

70
3.2 Stakeholders
3.2.1 EMPLOYEES
EDPR's growth in recent years has created a new labor environment that is home to three different generations, a
landscape in which it is vital for the company to be able to adapt to the changing business realities in the markets where
we operate. We offer a customized employee value proposition based on development, transparency and
flexibility, which allows us to attract and retain talent, as well as ensure the ongoing growth and development of our
employees in order to have team-oriented people capable of adjusting to the ever-changing working environment.
At EDPR:
We foster the talent of our people.
We are sustainable and efficient.
We are committed to excellence and innovation.
This commitment and execution was recognized by Great Place to Work as EDPR was once again been ranked among
the 50 best companies to work in 2016 in Spain and Poland. We are sure that a motivated workforce aligned with the
company’s strategy is one of the key drivers behind our ability to deliver on results.
DEVELOPMENT
EDPR is committed to the development of its employees, offering them an attractive professional career and aligning
their capabilities and skills with the current and future needs of the company.
The growth and development of the Group's business has led EDPR to invest in people with potential, who can contribute
to the creation of value.
Our objective is to attract talented people and to create opportunities for current employees through mobility and
development actions in order to boost the potential of our employees. The HR strategy supports different initiatives to
give them visibility and foster their professional development inside the company. Vacant positions are advertised
internally and as a consequence, 100% of new Directors have been hired internally in 2016.
The cornerstones of development at EDPR are as follows:
Mobility
Training and Development Programs
Renewable Energy School

71
MANAGEMENT REPORTEDPR 2016
MOBILITY
EDPR considers mobility, both functional and geographical, as a human resources
management tool that contributes to the organizational development. It is
considered internally as a way of stimulating employees’ motivation, skills,
productivity and personal fulfilment. The mobility processes within EDPR aim to
respond to the different challenges and needs of the Group, taking into account the
particular characteristics of the different geographies.
TRAINING AND DEVELOPMENT PROGRAMS
The development of our employees is a strategic target for EDPR. That is why we offer job-specific ongoing training
opportunities to contribute towards enhancing knowledge and skills, as well as specific development programs aligned
with the company's strategy.
In this regard, in order to support the company’s growth, aligning current and future organizational demands with
employees’ capabilities, as well as to enhance their professional development, EDPR has designed development programs
for middle management, with the goal of providing them with the proper tools to take on new responsibilities.
During 2016, EDPR carried out the following Programs:
LEAD NOW PROGRAM: an advanced program aimed at EDPR middle management to support them in their new roles.
During the program, participants have the opportunity to self-assess their management style, go further into the skills
needed to develop an efficient management approach and learn their new role in what regards the HR processes within
their teams.
EXECUTIVE DEVELOPMENT PROGRAM: an advanced development program
carried out in collaboration with a leading Business School designed to enhance the
management and leadership skills of top-performing employees from across the
business. Participants learn to take management decisions in a fast-paced and
competitive environment, among other aspects. During the program, participants
learn in-depth knowledge about our core business areas, working in teams on a
practical EDPR Business Case to analyze new strategic opportunities for the
company. This translates into the creation of several proposals capable of being
implemented once the program is concluded.
COACHING PROGRAM: program aimed at middle management, who receive coaching sessions delivered by company
executives. The coaches are given the opportunity to detect their strong points and identify areas for improvement as a
way to fine-tune their skills, always with the support of a guide who is always present at these sessions.
In addition to these specific development programs, each year, a customized Training Plan is created for all our
employees based on the results of a skills assessement between manager and the subordinate to define the specific
training needs of each employee.
These steps allow us to aligns the organization’s current and futures needs with our employees' skill sets and expertise.
In 2016, we delivered a total of 44,350 training hours, equivalent to 41 hours of training per employee. 100% of
employees received training in 2016.
2016 Internal Mobility
Functional: 59
Geographical: 5
Functional & Geographical: 11

72
RENEWABLE ENERGY SCHOOL
To achieve our training and new employees’ integration strategy, the Renewable Energy School plays a fundamental
role. Established in 2011 within the framework of the Corporate EDP University, the Energy School aims to promote the
development of individuals, facilitate learning and share knowledge generated within the Group as well as to acquire the
skills needed to ensure the sustainability of EDPR's businesses across all the markets where the company is present.
The objective of the School goes beyond mere training since it emerged also as a platform for sharing knowledge,
expertise and best practices across the company.
During 2016, 39 training sessions were delivered in Europe, the United States and Brazil, representing a total of 8,398
training hours and 1,027 attendances. A total of 735 employees took part in the School's courses, equivalent to 68% of
the total headcount. The School engaged 116 experts within the organization to deliver the training sessions, 40% of
whom were directors and heads of departments, which helped the transfer of knowledge to employees.
TRANSPARENCY
ATTRACTING TALENT
At EDPR, we strive to attract and retain professionals who seek to excel in their work in order to position the company
as the "the first choice for employees" in the labor market. In this sense, EDPR launches initiatives on an ongoing basis
to strengthen its image as a leading employer by participating at numerous job fairs and visiting prestigious universities
and business schools.
EDPR invests in the development of young people to help them becoming excellent professionals within the EDPR Group.
To this end, EDPR offers an internship program in order to provide young professionals with work experience and to
identify future employees who can contribute to the future development of the business.
During 2016, EDPR offered 65 long-term internships and 30 summer internships, of which 12% translated into new
hires. Moreover, in 2016 EDPR hired 158 employees, 31% of whom were women.
Non-discrimination and equal opportunities are enshrined in our selection processes. This is reflected in the Code of
Ethics, which contains specific clauses on non-discrimination and equal opportunities, in line with the company’s culture
of diversity.
INTEGRATION
Among our initiatives to integrate new staff we include our Welcome Day, a three-day event
for new hires, which allows them to gain basic knowledge about the company and our
business. Depending on the employee’s profile, we offer them a visit to one of the wind farms
or the remote dispatch center.
PERSONAL DEVELOPMENT PLANS
The EDP Group uses a 70.20.10 development model in which not only the theoretical training
but also initiatives related to on-the-job experience and teamwork are crucial for the
development.
The Personal Development Plans are a very effective tool that enable us to structure training
actions for the candidate aimed at widening their abilities and expertise since it requires a
reflection upon the results of their skills assessement and identify the individual's strong
points and areas where he can improve, taking into account the employee's development level, as well as the teamwork
and organizational strategy.
Visit to a Wind Farm on EDPR
Welcome Day

73
MANAGEMENT REPORTEDPR 2016
The Personal Development Plans (PDIs) launched in 2015 were reviewed in 2016, testament to our culture of continuous
feedback and ongoing improvement. These are voluntary plans, agreed between manager and employee.
FLEXIBILITY
As part of our value proposition at EDPR, we offer a competitive remuneration package, aligned with the best practices
in the market.
The general remuneration policy incorporates particular features of each geography and is sufficiently flexible so that it
can be adapted to the specific needs of each region. The fixed remuneration is supplemented by a variable bonus that
depends on an evaluation that measures individual, area and company KPIs.
In addition, we understand the importance of maintaining a work-life balance. This has led to an increase in employee’s
satisfaction while bolstering productivity and morale. At EDPR, the Work-Life Balance (WLB) is not just aimed at
employees with children, it is a set of initiatives to promote a positive working environment in which employees can
advance in their professional career and give their best. We believe that WLB must be a shared responsibility. We seek
to constantly improve our WLB measures and provide the most suitable benefits to employees. In fact, we often design
WLB benefits that are tailored to the countries where EDPR operates.
EDPR’s WLB practices have been awarded for five years now the Responsible Family Employer Certification (EFR -
Empresa Familiarmente Responsable) by Spain's MásFamilia Foundation. In this regard, EDPR has been promoted into
the “Proactive Company” category, which reflects our commitment to promoting a healthy work-life balance for our
employees.
CLIMATE ACTION PLAN 2016
A hallmark of EDPR is its ongoing commitment to seek new initiatives, programs and measures to make our company a
great place to work. This commitment to improve our HR management, making sure that employees consider the
company a challenging place, where they are willing to give their best by combining high standards of excellence with
efficiency, a company in which listening to employees' helps us stand out from the competition, in short, making EDPR
a special place to work.
In November 2015, EDP launched a new edition of its Climate Survey, which constituted another communication channel
to learn the opinions and viewpoints of our employees. Participation rates were very high as 93% of EDPR employees
have taken part in the survey, making the results representative of the general climate, as well as providing insight on
an individual level.
The results reflect high overall levels of commitment (72%), in line with those of EDP (75%) and other leading companies
employing the best practices in this area (73%). Of particular note, the most highly valued aspects by employees include
job stability, working conditions and working environment.
However, closer examination reveals improvement opportunities in certain areas, which today represent the foundations
of our Climate Action Plan 2016, which comprises 13 specific actions. These measures have been conveyed to all
employees via various platforms.

74
3.2.2 COMMUNITIES
EDPR provides long-lasting economic benefits to surrounding areas throughout the entire lifecycle of its wind farms. These benefits include, but are not limited to, infrastructure investments, tax payments, landowners’ royalty payments, job creation and direct contributions to community projects.
INFRASTRUCTURE INVESTMENTS
ROADS
The construction of a wind farm comprises the construction of new roads and the rehabilitation of existing ones in order to transport heavy equipment (i.e. wind turbines) to the site during construction works. The local communities benefit from these roads, as they provide an improved connection for local inhabitants to perform their agricultural activities. In 2016, we invested 4.7 million Euros to develop community roads.
UTILITY INFRASTRUCTURES
The integration of our generation capacity may require upgrades in the distribution and transmission grids that belong to the distribution system or transmission system operators. Most of the times, these upgrades are financially and technically supported by EDPR, indirectly benefitting the quality of electric service in the surrounding areas. This is particularly important in countries where wind energy is in its early stages. In 2016, we invested 11.4 million Euros to improve public electric facilities.
LEASES, TAXES, AND REVENUE SHARING
EDPR also provides direct economic returns to the local and regional communities by means of land leases, local taxes and property taxes. For example, in the US, property tax is paid to state and local entities in the states where the assets are held, which benefits the local communities. This revenue sharing is a large contribution to the yearly budget of rural municipalities where wind farms are located. Furthermore, during the construction of our wind farms, the local community can see an influx of temporary construction workers that provide a positive impact on the local economy through local spending and increased sales tax revenue.
HIDALGO WINDFARM Hidalgo Wind Farm contributes with significant economic benefits to the surrounding community in the form of payments to land owners, local spending and annual community investment. Along with the recurring payments to over 70 landowners within the 33,000-acre project, Hidalgo also brings approximately US$200 million in taxable assets to the counties in which the project was built. The construction of the project brought
Tax reporting
It is an ethical and civic duty to contribute to the financing of the general functions of the States where the Group is present through the payment of taxes and contributions due in accordance with the applicable Constitution and remaining laws of those States, contributing to the welfare of citizens, to a sustainable development of the Group’s local businesses and to the value creation for shareholders. The total tax contribution of EDPR Group to the public finances amounts to €142m in year 2016. Moreover, EDPR’s Social Security contribution amounts to €12m.
36%
29%
20%
14% 1%
Spain Portugal US + Canada Rest of Europe Brazil
€142min 2016
Distribution of EDPR Group's tax payments by country
29%
30%
32%
9%
Corporate Income Tax Energy TaxProperty & Land Taxes Other Tributes
€142min 2016
Distribution of EDPR Group's tax payments by tax type

75
MANAGEMENT REPORTEDPR 2016
more than 400 workers to the rural south Texas town of McCook and the continued operations of the project will ensure that a number of long-term jobs will remain in the community for the life of the project. Along with the economic benefit to the county and community, there is a significant environmental benefit as well. Now that the project is up and running it will be providing enough energy to power approximately 55,000 average Texan homes every year.
LOCAL HIRING AND PROCUREMENT PRACTICES
Although there are no in-house procedures explicitly requiring local recruitment, a high percentage of our employees and 99% of the purchases come from the locations in which the company operates. As a result, we contribute to the local economic development.
For operational activities, we usually hire members of the local community for the operation and maintenance services of the wind farms, such as wind farm management, wind turbines operation and maintenance, electrical and civil works maintenance, environmental surveillance and other support services. These practices let us benefit from local workers specific knowledge.
COMMUNITY PROJECTS
EDPR voluntarily promotes and supports social, cultural, environmental and educational initiatives with the purpose of contributing to the sustainable development of its business and in order to uphold its strategic vision.
The goal is to make a positive impact on the communities where we operate, and to maintain and enhance our reputation as a responsible company working for the common good. EDPR plans for the results it intends to achieve, and evaluates projects in which is involved in, according to international standards for corporate social investments (London Benchmarking Group).
EDPR in 2016:
1.1 million euros invested More than 150 initiatives with the community
EDP FOUNDATION IN SPAIN
The mission of the EDP Foundation is to strengthen the commitment of the EDP Group in the geographical spheres in which the group operates, with special emphasis on environmental, social, cultural and educational areas within a perspective of global sustainable development, where the efficient and responsible use and generation of energy plays a decisive role. In 2016, the EDP Foundation in Spain supported a series of initiatives financed by EDPR.
Energía Solidaria
The Energía Solidaria program aims to increase the safety, well-being and energy efficiency of the most disadvantaged families.
With the collaboration of Caritas and through different actions of energy improvement, in 2016 the number of direct beneficiaries has been 431 and 104 indirect beneficiaries.
The program has included several actions focused to cover the energy needs of families and Caritas centers (technical centers, welfare flat and rehabilitation centers). For example, energy audits were carried out in 10 families identified by Caritas, as well as the implementation of the recommended measures.

76
ROMANIA: CLOSER2YOU We are investing in relationships and the development of communities located near our operations, as well as in the legacy we want to leave for future generations. For that reason we have created the Closer2You initiative, whose first edition was held in Constanta County, Romania.
In order to help a family with three children living in poor conditions with no electricity, no water supply and without incomes for the parents due to the inability to work, this initiative addressed thermal rehabilitation of the house, replacing windows, doors and water supply. Collaboration agreements were reached with local authorities and suppliers in order to provide the family with water and more dignified conditions. The home was remodeled, making it safer and improving the family’s level of comfort.
The initiative works as a way of enriching our relationship with stakeholders and is focused on developing sustainable communities. In 2017, Closer2You will reach other countries around the world, such as Brazil, Spain, Portugal and Poland.
EUROPE: GENERATION EDPR Generation EDPR is a set of Corporate Social Responsibility (CSR) initiatives implemented by the company, namely Your Energy, University Challenge, Windexperts and Green Education.
University Challenge aims to foster the spirit of innovation and creativity within the academic community, which in turn will promote a greater bond between universities and the business world. The program reached two important milestones in 2016: in its eighth edition in Spain, one of the winning groups created a business with the objective of implementing their project (use of drones for maintenance operations in wind farms); also, the program became international with its first Polish edition.
Your Energy is an international program that helps children discovering the world of renewable energies and Green Education supports the education of children and teenagers of families with limited resources.
Because we believe there is no better way to add value to society than to support these types of projects, we will continue to invest fostering creativity and knowledge among young people.
Know more in generationedpr.edpr.com
WIND EXPERTS IN SPAIN
Wind Experts is a competition launched only in 2016 intended to educate children from 10 to 13 years about renewable energies while developing their creativity. Through a partnership with the Portuguese toy company, Science4you, nine schools responded to the challenge and more than 60 children received a model wind turbine, which they had to use to create a new structure using only recyclable materials. The goal for the future is to expand the number of schools participating in the initiative and make it international.
UNITED STATES: EMPLOYEES DONATE BOOKS TO DESERVING ORGANIZATIONS EDPR North America supports the local community with many initiatives. One of them was a book drive coordinated by EDPR NA Volunteer Committee, which asked employees to donate new and gently used books to be given to three local organizations: the Texas Children’s Hospital, Reading Aces and the Houston Center for Literacy. A total of 416 books were donated. Of those, 46 new books went to the Texas Children’s Hospital, 204 gently-used children’s books went to Reading Aces, and 166 gently-used books went to the Houston Center for Literacy.
In Spain, EDPR we held a similar initiative and 307 books were donated by employees.
YOUR ENERGY
4,700 students in Spain, Italy and Poland
UNIVERSITY CHALLENGE
44 universities in Spain and Poland
GREEN EDUCATION
119 students in Spain and Portugal
Before and after rehabilitation

77
MANAGEMENT REPORTEDPR 2016
3.2.3. SUPPLIERS
EDPR’s value creation capacity, leadership in its business areas and relationship with its stakeholders is significantly influenced by the performance of its suppliers.
EDPR bases its relationship with suppliers on trust, collaboration and creation of shared value. This results in a joint capacity to innovate, strengthen sustainability policy and improve quality of operations.
EDPR SUPPLY CHAIN
During 2016 an extensive characterization study of EDPR’s purchases was developed, aiming a deeper knowledge about the economic, social and environmental impacts of EDPR’s supply chain. EDPR expects from now on to use these results for better definition of the priorities concerning sustainability management.
A supplier is considered critical through an added critical awareness score that accounts multiple criteria: annual value spend; supply frequency; access to customers; access to technical equipment or sensitive data; supplier substitutability; component substitutability; supply failure consequence; supplier segmentation; safety risks and environmental risks. and obligations, e.g. through supply or service failure consequences, are the concerns of the identification process.
From the point of view of criticality for the business, EDPR’s suppliers segments are: Critical suppliers: Turbines, BOP (Balance of Plant) and O&M (Operation and Maintenance), and; Non-critical suppliers: indirect purchases.A new Sustainable Procurement Policy was defined and improvements were introduced in the suppliers’ management process. EDPR is reinforcing out audit procedures and will implement a significantly higher number of audits to suppliers.
SUSTAINABLE MANAGEMENT OF THE SUPPLY CHAIN
EDPR has defined policies, procedures and standards to ensure the several aspects that fill in with the sustainability of the supply chain, as 1well as the management and mitigation of any type of environmental, social or ethical risks in the supply chain.
1 Based on # of purchase orders placed in 2016 2 Critical suppliers as defined as per EDP formal corporate standard methodology 3 & 4 Based on the total invoiced volume in 2016
Over
5,060(1)
Suppliers contribute to EDPR success
99%(1) Local Purchases
(Purchases in countries of
operation of EDPR)
PROGRESS
EDP Group has defined a Sustainable Procurement Policy, which is the framework for the procurement process. The policy includes aspects of law compliance, environmental policy, respect for communities, communication with stakeholders, ethics, confidentiality, conflicts of interest, human rights and health and safety.
EDPR works with mature suppliers and companies that look to meet the demanding requirements on quality, environment and prevention, as well as to comply with the economical/financial solvency requirements.
2016 Sustainable Procurement Policy
52(2)
suppliers are considered as
critical
Critical suppliers represent
55%(3) of the invoiced volumein Europe and
67%(4) in North America

78
EDPR suppliers have successfully perform the approval processes established by EDP Group. The rule “pass or fail” is applied to suppliers. If they do not meet the main requirements set by EDPR they will not be selected to provide services.
For all suppliers considered as critical (regardless of the purchase volume) EDPR ensures from the bidding to the time of providing the service (work execution or maintenance) the compliance of technical quality, economical/financial solvency, and health, safety and environmental management.
Policies, Procedures and Standards
Procurement Policy
During 2016, an extensive characterization study of EDPR’s purchases was developed, aiming adeeper knowledge about the economic, social and environmental impacts of EDPR’s supply chain.
EDPR takes into account the 10 principles of the UN Global Compact and Ethical Code acceptance,the Health & Safety and Quality certificates, as well as technical quality and economical/financialsolvency of suppliers.
Procurement Manual
EDPR has a Procurement Manual, which includes sustainability principles to be taken into accountwhen contracting products or services.
These principles summarize the most relevant aspects for EDPR in terms of sustainability in thesupply chain: health and safety, respect for the environment, ethics, local development andinnovation.
EDPR’s Code of Ethics
EDPR is governed under a strong sense of ethics and requires itssuppliers to have no conflicts with the company’s ethical standards.
EDPR´s suppliers must know and accept by written the principlesestablished in the Code of Ethics.
EDPR’s Code of Ethics is available in www.edpr.com
UN Global Compact
EDPR is a signatory of the UN Global Compact for SustainableDevelopment and is committed to implement these principles as wellas to promote the adoption of these principles on its area of influence.
EDPR´s suppliers must accept to comply with the UN Global Compact’sten principles, on human rights, labor, environment and anti-corruptionand provide the confirmation as signatories of the UN Global Compactdirectives or a written declaration of their acceptance.
Health & Safety
System and OH&S Policy
Health & Safety System, based on the OSHAS 18001:2007 specifications require EDPR’semployees and all other individuals working on behalf of EDPR to follow best practices in thoseareas, as required in EDPR’s OH&S Policy.
The health and safety management system is supported by different manuals, control procedures,instructions and specifications which ensure the effective execution of EDPR’s OH&S Policy.
EDPR´s Health & Safety Policy are available in www.edpr.com
EDPR´s Environment
and Biodiversity
Policies
EDPR is committed to integrate the respect for the environment and environmental managementinto all phases of the business through the value chain and ensure that all stakeholders, includingsuppliers, have the necessary skills to do so.
EDPR´s suppliers shall adopt all necessary measures to ensure strict compliance with all applicableenvironmental regulations as well as EDPR´s Environment and Biodiversity Policies, internalnorms, procedures and systems in place as regards to environmental management.
EDPR has implemented an Environmental Management System (EMS) developed and certifiedaccording to the international standard ISO 14001:2004. EDPR´s suppliers shall know andunderstand the EMS and ensure the full compliance with the procedures set.
Suppliers shall make the EMS available to its employees and subcontractors. EDPR´s Environment and Biodiversity Policies are available in www.edpr.com
100% of the EDPR critical suppliers are aligned with
Global Compact criteria and
EDPR’s Code of Ethics

79
MANAGEMENT REPORTEDPR 2016
MANAGEMENT AND MITIGATION OF ENVIRONMENTAL, SOCIAL OR ETHICAL RISKS
EDPR monitors critical suppliers during their services delivery, taking into account aspects as quality, safety, health and environment (waste management, oil spills, etc.). EDPR also ensures the compliance with standards, commitments and procedures of EDPR in all value chain.
EDPR uses applications for health and safety and environmental management, including regulatory and obligation tracking, which work as collaborative tools therefore involving the entire organization and suppliers to prevent work and environmental accidents. In addition, in the wind farms are carried out drills regarding health and safety and environmental accidents or incidents.
The relevant aspects for EDPR in relation to sustainability in the supply chain are Innovation, Health and Safety, Respect for the Environment, Ethics and Local Development. These aspects are expressed in Procurement Manual.
Suppliers share with EDPR their new solutions, products or upgrades to improve collaboration between both parties.
A) During the execution phase, the construction manager works closely with a health supervisor, a safety andenvironmental supervisor and holds weekly meetings with suppliers (BOP contractor and, where applicable, the turbine supplier). Contractors receive feedback and improvement plans are established in the areas of quality, health, safety and environment through performance reports. In addition, the company also has external supervision in these areas.
B) During the wind farms operation phase, the wind farm manager is responsible for service quality and compliancewith the rules and health, safety and environmental procedures. These processes are reinforced by the management systems according to OSHAS 18001 and ISO 14001. Contractors integrate these management systems, as their performance in these areas is crucial for EDPR.

80
3.3.4. MEDIA
Mass media organizations around the world represent a very important stakeholder group to EDPR. EDPR’s corporate reputation and brand visibility depends on media organizations, which is why we take great care in each interaction we have with them. We keep all media organizations informed about the initiatives that the company carries out, whether these are related to financial issues, company performance, corporate social responsibility or any other relevant happenings.
For that purpose, the Department of Communication and Stakeholders Management has developed a series of communication channels to make the transmission of information as dynamic and fluid as possible. One of the main channels is the corporate website (www.edpr.com), which includes three large sections dedicated to media: news, where all the company’s official communications are publicized; media center, a content repository where the media can obtain photographs, videos and other materials; and finally, contact information. Other media communication channels are press conferences, interviews with company managers and conference calls.
In 2016, interactions with the media generated news primarily in the markets of Portugal, Spain, North America, Poland and Italy, but generally, in all markets where we operate. These news reflect the company’s strategy for each of these markets. Portugal was the largest source of the news items, with notable positive coverage of EDPR’s image, including information about the company’s share price, financial performance, our partnership with China Three Gorges (CTG), education initiatives, plans for expansion and investment (especially foreign investment), new contracts and energy production data. In Spain, the company’s expansion plans were especially noteworthy, while in the United States and Canada, news tended to focus mostly on Power Purchase Agreements (PPA).

81
MANAGEMENT REPORTEDPR 2016
3.3. Safety first
Zero accidents mindset
Guaranteeing the health, safety and well-being of our employees and contractors is a top priority at EDPR and this commitment is supported by our Health and Safety policy.
At EDPR, we are conscious that we work in a sector that is particularly sensitive to the occupational risk, therefore we place special emphasis on prevention by training, communicating and certifying our facilities.
As an integral part of our health and safety strategy, employees participate in training courses and risk assessment activities based on the potential risks associated with their position. Our employees follow the guidelines rigorously and strive to achieve a safe workplace for all those who provide services in our facilities.
Health & Safety committees and subcommittees throughout EDPR support the implementation of health and safety measures by means of collecting information from different operational levels and involving employees with the establishment and communication of a preventative plan.
In order to achieve our zero accidents target, EDPR has implemented health and safety management systems based on the OSHAS 18001:2007 specifications. The standards and procedures of these systems are adapted to the specificities of each geography where they are implemented and are developed based on the country’s regulation and industry’s best practices. Our commitment to the health and safety of our employees and contractors is further supported through the OHSAS 18001 certification and we are working actively to have all installed capacity certified by 2020.
Indicators:
The implementation of our health and safety management systems allows us to manage and prevent future accidents with the objective of reaching our zero accident goal. During 2016, EDPR registered 25 accidents. The trend is decreasing in Europe, US and Brazil but it is partially offset by higher short-term absence accidents in Mexico, impacted by higher construction activity in the country. Additionally, the severity rate increased, due to one long-term absence coming from 2015 and nine during 2016, which have led to 83% of the total days lost.
Overall, the trend is improving despite the increase in the number of accidents in Mexico. A greater focus on communication of our policies plus the realization of the benefits from OHSAS certification that will occur in 2018 in Mexico will help to improve these statistics.
Europe, US and Brazil have lower H&S indicators due to more training hours and emergency plans both for staff and contractors.
Training & emergency plans:
Note: Includes staff and contractors data.
27
25
4.63
3.78
2015 2016
# accidents with absence
Frequency rate

ENERGYAS THE NEWART
ANNUAL REPORT EDPR 2016
3.4. EnvironmentLife cycle approach in the environmental management
Wind power is one of the most environmentally friendly ways of producing energy. Its contribution to global warmingis significantly lower than the one from fossil fuel based energy sources. The impact of our business on the environment is small but nevertheless EDPR works on a daily basis to hold itself to a higher standard.
Incorporate respect for the environment and management of environmental aspects in all phases of business processes throughout the value chainis one of the pillars of our environmental strategy.
Life cycle assessments revealed that most wind farm and solar plant environmental impacts are concentrated in the raw materials’ extraction and components’ manufacturing stages.2
EDPR is not directly involved in those upstream processes but is committed to promote sustainable practices in the supply chain according to EDP Sustainable Procurement Policy to better respondto the increasing needs of sustainability and the development of our supply chain.
Raw Materials Extraction and Components Manufacturing Stages
Wind farm set up, including construction and installation works, is concentrated in a short period of time and has a very limited impact compared withupstream processes. Nevertheless it is closely followed by our highly qualified teams to minimize potential disturbances.
A thorough process based on our in-house expertise ensures the location of EDPR facilities in the best sites, assuring top-class construction standards and respect for the environment and local communities.
During the construction process, we work to minimize impacts and disturbances and return the land to its initial integrity. In 2016, more than 63 ha were restored. In most cases, wind turbines and access roads occupy less than one percent of the land in the entire project area and the remaining land is still available for traditionalactivities.
Wind Farm Set Up
1 2
The operation stage is the core of our business. As an owner and operator, EDPR is committed to maintaining long-term operations of our projects for the benefit of our stakeholders while always keeping our environmental impact to a minimum. The proper management of the environmental aspects during operation is achieved through the Environmental Management System (EMS), developed in accordance with the ISO 14001 international standard and certified by an independent certifying organization. 89% of EDPR’s installed capacityis covered by ISO 14001 certification1.The operating phase can be extended beyond the useful life by repowering the windfarms, replacing old equipment by new one with greater capacity and performance, producing clean energy for a few years more.
1 Calculation based on 2016YE installed capacity. In 2015, calculation was based on 2014YE installed capacity. 2 According to the Life Cycle Assessments of our main turbine suppliers.
Operation Stage
3
At the end of their useful life wind turbines are dismantled to return the environment to its original state. Although EDPR has not yet dismantled any facility, from the environmental point of view there are two main aspects to consider: land restoration and proper treatment of the wastes generated. Properly managing wind turbines at the end of its life from a sustainable point of view, is crucial to maximize the environmental positive impacts of wind energy from a life cycle approach. Wind turbines’ recycling at the end of their service life avoids impacts associated to raw materials’ extraction, providing significant environmental benefits and contributing to create a circular economy.
The average recyclability of wind turbines has been calculated as 80-90%.2 The components contributingto recyclability are metal parts manufactured from iron, steel, aluminum and copper. But the industry facesa challenge regarding wind turbine blades since landfills are currently the main destination for composites in Europe. EDPR supports R3FIBER project, an innovative solution that provides a green technology to recycle wind blades to obtain high quality fibers that can be reusedin various sectors, contributing to circular economy.
End of Useful Life
4
Climate change is already having an impact on biodiversity, and is projected to become a more significant threatin the coming decades. Wind and solar energy provides a major contribution to protecting biodiversity from climate change since its contribution to global warming is significantly less than fossil fuel based energy sources.
EDPR wind farms, with a projected life span of 25 years, will pay back its life cycle energy costs in less than a year2, which means more than 24 years of a wind farm’s life just producing clean energy.
82 91
EDPR is renewing its entire fleet and hybrids will make up 70% of its new fleet of vehicles. In line with its core business, EDPR has chosen hybrid vehicles based on their low fuel consumption and reduced emissions All vehicles will be incorporated into the EDPR fleet gradually over 2017 in Spain, France, Italy, Poland and Romania, as well as Brazil.

ENERGYAS THE NEWART
MANAGEMENT REPORTEDPR 2016
3.4. EnvironmentLife cycle approach in the environmental management
Wind power is one of the most environmentally friendly ways of producing energy. Its contribution to global warmingis significantly lower than the one from fossil fuel based energy sources. The impact of our business on the environment is small but nevertheless EDPR works on a daily basis to hold itself to a higher standard.
Incorporate respect for the environment and management of environmental aspects in all phases of business processes throughout the value chainis one of the pillars of our environmental strategy.
Life cycle assessments revealed that most wind farm and solar plant environmental impacts are concentrated in the raw materials’ extraction and components’ manufacturing stages.2
EDPR is not directly involved in those upstream processes but is committed to promote sustainable practices in the supply chain according to EDP Sustainable Procurement Policy to better respondto the increasing needs of sustainability and the development of our supply chain.
Raw Materials Extraction and Components Manufacturing Stages
Wind farm set up, including construction and installation works, is concentrated in a short period of time and has a very limited impact compared withupstream processes. Nevertheless it is closely followed by our highly qualified teams to minimize potential disturbances.
A thorough process based on our in-house expertise ensures the location of EDPR facilities in the best sites, assuring top-class construction standards and respect for the environment and local communities.
During the construction process, we work to minimize impacts and disturbances and return the land to its initial integrity. In 2016, more than 63 ha were restored. In most cases, wind turbines and access roads occupy less than one percent of the land in the entire project area and the remaining land is still available for traditionalactivities.
Wind Farm Set Up
1 2
The operation stage is the core of our business. As an owner and operator, EDPR is committed to maintaining long-term operations of our projects for the benefit of our stakeholders while always keeping our environmental impact to a minimum. The proper management of the environmental aspects during operation is achieved through the Environmental Management System (EMS), developed in accordance with the ISO 14001 international standard and certified by an independent certifying organization. 89% of EDPR’s installed capacity is covered by ISO 14001 certification1.The operating phase can be extended beyond the useful life by repowering the windfarms, replacing old equipment by new one with greater capacity and performance, producing clean energy for a few years more.
1 Calculation based on 2016YE installed capacity. In 2015, calculation was based on 2014YE installed capacity. 2 According to the Life Cycle Assessments of our main turbine suppliers.
Operation Stage
3
At the end of their useful life wind turbines are dismantled to return the environment to its original state. Although EDPR has not yet dismantled any facility, from the environmental point of view there are two main aspects to consider: land restoration and proper treatment of the wastes generated. Properly managing wind turbines at the end of its life from a sustainable point of view, is crucial to maximize the environmental positive impacts of wind energy from a life cycle approach. Wind turbines’ recycling at the end of their service life avoids impacts associated to raw materials’ extraction, providing significant environmental benefits and contributing to create a circular economy.
The average recyclability of wind turbines has been calculated as 80-90%.2 The components contributingto recyclability are metal parts manufactured from iron, steel, aluminum and copper. But the industry facesa challenge regarding wind turbine blades since landfills are currently the main destination for composites in Europe. EDPR supports R3FIBER project, an innovative solution that provides a green technology to recycle wind blades to obtain high quality fibers that can be reusedin various sectors, contributing to circular economy.
End of Useful Life
4
Climate change is already having an impact on biodiversity, and is projected to become a more significant threatin the coming decades. Wind and solar energy provides a major contribution to protecting biodiversity from climate change since its contribution to global warming is significantly less than fossil fuel based energy sources.
EDPR wind farms, with a projected life span of 25 years, will pay back its life cycle energy costs in less than a year2, which means more than 24 years of a wind farm’s life just producing clean energy.
90 83
EDPR is renewing its entire fleet and hybrids will make up 70% of its new fleet of vehicles. In line with its core business, EDPR has chosen hybrid vehicles based on their low fuel consumption and reduced emissions All vehicles will be incorporated into the EDPR fleet gradually over 2017 in Spain, France, Italy, Poland and Romania, as well as Brazil.

ENERGYAS THE NEWART
84
Offshore TechnologyKey priority for offshore wind is to continue to follow a cost decrease path, achieving a sustainable and as fast as possible LCOEand reducing technology risks in the coming years mainly by economies of scale, technology innovation and higher capacity turbines (>6 MW).
The most capital intensive areas of offshore wind industry are the turbines, foundations and installation. Since the offshore wind market is evolving moving further from shore into deep waters and with increased average turbine capacity, innovation in foundations and in installation that address the deeper waters challenge are key drivers for LCOE reduction and increased competitiveness.
EDPR is developing a portfolio of solutions, namely creating technology innovative options for intermediate and deep water markets. Knowledge and experience acquired with WindFloat and DemoGravi3 technologies places EDPR as a front runner in the offshore wind business innovation paving the way to achieve competitiveness in future commercial projects by challenging the offshore
wind supply chain.
Windfloat ProjectThe WindFloat 1 showed the physical survivability of the platform on a harsh environment and set the tone forthe pre-commercial phase, in order to prove economic viability.
After 5 consistent years of operation with more than 17 GW of electricity produced demonstration period is over. This milestone represents EDPR successful innovation approach to the offshore market by addressing the real problem of lack of solutions for deep waters.
After successfully reaching the end of the lifetime of the first phase of the project, the next step in the development of WindFloat technology will be the pre-commercial phase, named ‘WindFloat Atlantic’ (WFA), the first worldwide full scale floating wind power plant.
With a total capacity of 25 MW in a 100 meters depth area in the Portuguese coast of Viana do Castelo, each of the 3 platforms will be equipped with a 8 MW commercial turbine. Under NER300 funding programme, this project has attracted renowned world players, such as Repsol, Trust Wind, Mitsubishi Corporaton and ChyiodaCorporation. COD is expected in the summer of 2019.
Demogravi3 ProjectFunded by the EU Horizon 2020 Program aims to demonstrate and validate an innovative hybrid concrete-steel, self-buoyant bottom standing foundation technology for offshore wind power plants located in intermediate water depths between 35 and 60m. The complete unit (turbine and foundation) will be built and fully assembled inshore, transported to the site, water ballasted to be installed in the seabed, and decommissioned without the need of using heavy lift vessels.
The European consortium developing this project is leaded by EDPR and is composed by a highly complementary and fit for purpose mix of commercial companies and non-profit entities: TYPSA, ASM Energia, Univ. Politécnica de Madrid, WavEC, AccionaInfraestructuras, Fraunhofer Gesellschaft IWES, Gavin & Doherty Geo Solutions and Global Maritime AS.The project will have a duration of 4 years. Installation will take place in summer 2017, at the consented and grid connected site of Aguçadoura (Portugal).
3.5. Innovation
EDPR, as a global renewable energy leading company, is proactively and consistently looking for new research and innovative initiatives and solutions focused on the reduction of the cost of energy through-out the life cycle of its assets. Also, EDPR is addressing the challenges related with the required capabilities to fit in the near future power and market systems, ensuring adequate technological skills and preserving our competitive advantage in the sector.
Currently research and innovation actions and efforts at EDPR are mainly focused on addressing challenges related with investigation of the main trends in offshore and onshore wind and solar energy, energy storage and flexible grid integration solutions, new O&M procedures and strategies.

MANAGEMENT REPORTEDPR 2016
Energy StorageBattery energy storage is a relevant source of flexibility that will play an important rolein renewables development and integration, since it can balance power variability andsupply more economically to the grid. In addition, the rapidly falling cost of batteriesprovides particular interest for EDPR’s future investments in energy storage.
The ‘Stocare’ demonstration project, embedded in Cobadin wind power plant, is the firstone to use Lithium ion batteries for electricity storage in Romania and also marks thebeginning of using combined energy storage solutions and renewable power generationin EDPR, since the end of 2016.
Cobadin’s 1MW/1MWh energy storage system supplied by Siemens works as a proof ofconcept, aiming to evaluate its potential to enhance renewables power plantseconomics and integration in the electrical system. The innovative energy managementand control platform now being developed aims to provide solutions that respond tooutput fluctuations in energy production and test new forms of power control under real conditions to maximize yield, besides obtaining operational experience andknowledge from testing different use cases, allowing EDPR to evaluate the future business case by calculating the overall costs, revenues and savings, alongside with risks and opportunities identification.
Benefits from this project will result from the reduction of forecast errors from the activepower schedule submitted day-ahead to reduce balancing costs and an advancedcurtailment management to minimize energy losses. In addition, as remunerationschemes for ancillary services become increasingly available in certain markets, it alsoaims to test applications such as frequency regulation and voltage support, through the development of algorithms and optimization of control schemes that could later be usedin other projects and markets.
Solar TechnologyHybrid Wind And PV Pilot ProjectEDPR is developing a demonstration pilot project in Spain of an hybrid technology (wind+photovoltaic) power plant sharing the same BoP infrastructure. The objective is to validate this concept both technical and commercially, to allow the definition of the business case for a real size project based on wind and solar resources complementarity.CPV-LAB ProjectA test platform embedded in a commercial photovoltaic power plant under construction in Portugal, to evaluate the performance of new photovoltaic technologies such as CPV, glass-glass and bifacial, with the objective of gaining experience and creating solid knowledge in order to maximize profitability in future investments.
Operation and MaintenanceThe maturity of the wind onshore market, with a growing amount of operating capacity and with turbines becoming increasingly complex, highlights to EDPR the need to devote more efforts to advanced O&M solutions and strategies aimed at achieving cost reduction and increase energy yield due to enhanced data analysis and O&M procedures.With so many sources, volumes and variety of data available, significant innovation efforts are required to properly treat and analyze such wealth of information to create added value knowledge in asset operations.
EDPR is starting to incorporate big data technologies using advanced analytics predictive models for wind turbines lifetime optimization and to build reliable and streamlined end-of-life strategies.
EDPR is also involved in several initiatives to enable predictive maintenance, related with the use of new enhanced sensors, condition monitoring systems and airborne drones for inspection to open new possibilities for data collection.
85

86

MANAGEMENT REPORTEDPR 2016
4 Sustainability
Materiality Assessment 91
Economic Performance 93
Environmental Performance 97
Social Performance 106
Reporting Principles 124

SUSTAINABILITYAS THE NEWART

SUSTAINABILITYAS THE NEWART

90

91
MANAGEMENT REPORTEDPR 2016
4 Sustainability
4.1. Materiality assessment (G4-18, G4-20, G4-21, G4-26, G4-27)
The macro-economic context, where the challenges of sustainability are increasing, summing up with the diversity of EDPR’s stakeholders, results in a large and complex list of important issues, which must be prioritized according to its relevance and significance. An issue is considered material when it influences the decision, the action and the performance of an organization and its stakeholders.
4.1.1 BACKGROUND AND OBJECTIVES
EDPR’s material issues were identified and the results achieved supported the preparation of this Management Report, as reflected in the company’s management strategy and, in particular, in its agenda for sustainability.
4.1.2 METHODOLOGY
The methodology adopted is based on the Accountability standards and information is collected corporately and in business units.
Materiality is obtained by the interception of the issues identified by stakeholders with the importance given internally by the business.
The topics identified by the company are prioritized according to the frequency with which they appear in different categories analysed.
RELEVANCE FOR SOCIETY
The relevance for society is determined by the importance/impact of a specific theme from a perspective external to the company, designated as society perspective. Therefore the society vision reflects the vision of the several stakeholder groups that have influence on or are influenced by EDPR’s activities. This vision must be obtained through sources that ensure independence from the company by means of collecting on most cases external data.
In parallel, the establishment of a society vision is also supported by documents, analysis and international/national specific studies that allow a broad perspective of the emerging trends in the sustainability area. Consequently, the company considers that the vision of the several stakeholders reflects the vision of society, thus allowing the assessment of the expectations outside EDPR.
RELEVANCE FOR BUSINESS
The vision of the business is obtained through the evaluation of the importance/impact of a specific theme from a perspective internal to the company. This vision is originated from the analysis of the defined business strategic goals as these depict the current positioning and concerns of EDPR and reflects the future vision of the business.
RESULTS (G4-18, G4-19, G4-20, G4-21, G4-26, G4-27) The materiality matrix describes visually and promptly the most sensitive and impacting themes by comparing the relevance to society with the relevance to the business. The critical and sensitive themes for the business, obtained from the analysis of the materiality matrix, allows the company to drive the strategy and support the decision making process as well as to focus the report of information based on shared interests between company and stakeholder, thus facilitating the relationship among them.

92

93
MANAGEMENT REPORTEDPR 2016
4.2. Economic Performance
G4 DISCLOSURE ON MANAGEMENT APPROACH
Renewable energies have a strong influence in the local communities. Assets are usually constructed in remote locations, bringing positive economic benefits to the local communities, while contributing to the world fight against climate change.
Additionally, we believe that innovation is key to sustain competitive advantage and support growth. For us, innovation is about new technologies for more renewable energy - such as offshore wind - but that is not all: it is also about attitude, looking for ongoing improvement every day at what we do. A detailed disclosure of different projects lead by EDPR can be found at Innovation section.
G4 EC1 - DIRECT ECONOMIC VALUE GENERATED AND DISTRIBUTED
Assets are usually constructed in remote locations, bringing positive economic benefits to the local communities.
€m 2016 2015
Economic value generated and distributed
Turnover 1,485 1,372
Other income 251 359
Gains/(losses) on the sale of f inancial assets 2 0
Share of prof it in associates 0 -2
Financial income 54 61
Economic value generated 1,792 1,790
Cost of raw material and consumables used 31 22
Supplies and services 305 293
Other costs 135 189
Personnel costs 94 84
Financial expenses 404 347
Current tax 50 51
Dividends 153 129
Eco no mic value d ist r ib ut ed 1,172 1,115
Eco no mic value accumulat ed 6 2 0 6 75
1,172
620
Economic Value Generated in 2016
Value DistributedValue Accumulated
1,792 m€generated

94
G4 EC2 - FINANCIAL IMPLICATIONS AND OTHER RISKS AND OPPORTUNITIES FOR THE ORGANIZATION'S ACTIVITIES DUE TO CLIMATE CHANGE
Human activities are releasing critical amounts of carbon dioxide and other greenhouse gases (GHG), which trap heat and steadily drive up our planet’s temperature, eventually compromising our climate. As anthropogenic GHG result primarily from the combustion of fossil fuels, effective action in the energy sector is, consequentially, essential to tackle climate change issues. According to IRENA reaching a 30% renewables share by 2030, coupled with higher energy efficiency, would be enough to prevent global temperatures from rising more than 2°C above preindustrial levels. It is becoming increasingly clear that the investments required to reduce emissions will be modest in comparison with the benefits from avoided climate change damages. Therefore, renewable energy is a cornerstone for achieving climate targets and onshore wind, because of its maturity and competitiveness, is expected to be at the forefront of the required transformation of our energy sector.
For additional information refer to the Business Environment Section.
G4 EC3 - COVERAGE OF THE ORGANIZATION'S DEFINED BENEFIT PLAN OBLIGATIONS Information on EDPR benefit plan obligations, can be found in Note 10 in our Financial Statements.
G4 EC4 - FINANCIAL ASSISTANCE RECEIVED FROM GOVERNMENT Information on EDPR financial assistance received from government through Production Tax Credits, Cash Grants and other Tax savings in the US, can be found in Income from institutional partnerships in US wind farms and Amortization of deferred income (government grants) in our Consolidated Income Statement and additional details on Note 7, Note 12 and Note 30 in our Financial Statements.
G4 EC5 - RANGE OF RATIOS OF STANDARD ENTRY LEVEL WAGE COMPARED TO LOCAL MINIMUM WAGE AT SIGNIFICANT LOCATIONS OF OPERATION The values presented in the table above shows the average standard entry-level wage compared to the local minimum wage for each one of the countries where we have presence. To protect the privacy of employees’ wages in those countries where our headcount is smaller, we do not disclose the information by country and gender.
% 2016 2015
Standard entry level wage vs local minimum wage
Europe 253% 259%
North America 234% 224%
Brazil 337% 270%
Note: 2015 Europe % restated. Belgium information was removed to protect the privacy of employees in the country due to the small headcount.
The cost of doubling therenewable energy shareby 2030 would be US$290 billion per year whichis expected to be at least4 and up to 15 times lessthan the external costsavoided. Source: IRENA
Reducing electricty price When wind production is available, the market price goes down, for the same level of electricity demand and up to 15 times.
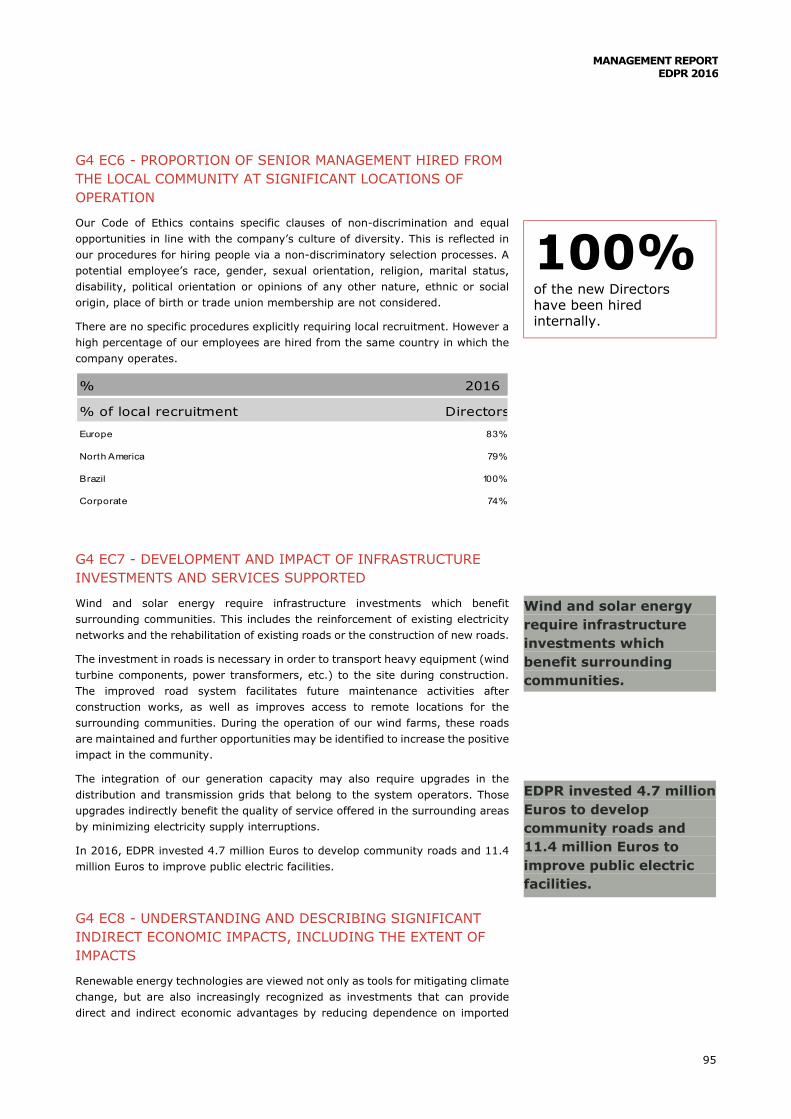
95
MANAGEMENT REPORTEDPR 2016
G4 EC6 - PROPORTION OF SENIOR MANAGEMENT HIRED FROM THE LOCAL COMMUNITY AT SIGNIFICANT LOCATIONS OF OPERATION
Our Code of Ethics contains specific clauses of non-discrimination and equal opportunities in line with the company’s culture of diversity. This is reflected in our procedures for hiring people via a non-discriminatory selection processes. A potential employee’s race, gender, sexual orientation, religion, marital status, disability, political orientation or opinions of any other nature, ethnic or social origin, place of birth or trade union membership are not considered.
There are no specific procedures explicitly requiring local recruitment. However a high percentage of our employees are hired from the same country in which the company operates.
G4 EC7 - DEVELOPMENT AND IMPACT OF INFRASTRUCTURE INVESTMENTS AND SERVICES SUPPORTED
Wind and solar energy require infrastructure investments which benefit surrounding communities. This includes the reinforcement of existing electricity networks and the rehabilitation of existing roads or the construction of new roads.
The investment in roads is necessary in order to transport heavy equipment (wind turbine components, power transformers, etc.) to the site during construction. The improved road system facilitates future maintenance activities after construction works, as well as improves access to remote locations for the surrounding communities. During the operation of our wind farms, these roads are maintained and further opportunities may be identified to increase the positive impact in the community.
The integration of our generation capacity may also require upgrades in the distribution and transmission grids that belong to the system operators. Those upgrades indirectly benefit the quality of service offered in the surrounding areas by minimizing electricity supply interruptions.
In 2016, EDPR invested 4.7 million Euros to develop community roads and 11.4 million Euros to improve public electric facilities.
G4 EC8 - UNDERSTANDING AND DESCRIBING SIGNIFICANT INDIRECT ECONOMIC IMPACTS, INCLUDING THE EXTENT OF IMPACTS
Renewable energy technologies are viewed not only as tools for mitigating climate change, but are also increasingly recognized as investments that can provide direct and indirect economic advantages by reducing dependence on imported
% 2016
% of local recruitment Directors
Europe 83%
North America 79%
Brazil 100%
Corporate 74%
Wind and solar energy require infrastructure investments which benefit surrounding communities.
EDPR invested 4.7 million Euros to develop community roads and 11.4 million Euros to improve public electric facilities.
100% of the new Directors have been hired internally.

96
fuels (and hence, improving trade balances), enhancing local air quality and safety, advancing energy access and security, propelling economic development, and, creating jobs.
For additional information on indirect economic impacts of our energy, please refer to the Business Environment Section.
G4 EC9 - PROPORTION OF SPENDING ON LOCAL SUPPLIERS AT SIGNIFICANT LOCATIONS OF OPERATION
At EDPR, there is no specific policy or in-house procedure for preferring locally based suppliers.
However, under equal commercial terms, we choose local suppliers in order to enhance the socio-economic sustainability of the 12 countries across Europe and the Americas where we are present. In this way, around 99%* of the purchases were sourced from local suppliers (purchases in countries of operation of EDPR).
Additionally, during the construction of our projects, the local community can see an influx of temporary local construction workers and suppliers that provide a positive impact on the local economy.
Note: * is based on # of purchase orders placed in 2016. For additional information, please refer to Suppliers Section
99%* of the purchases were sourced from local suppliers.
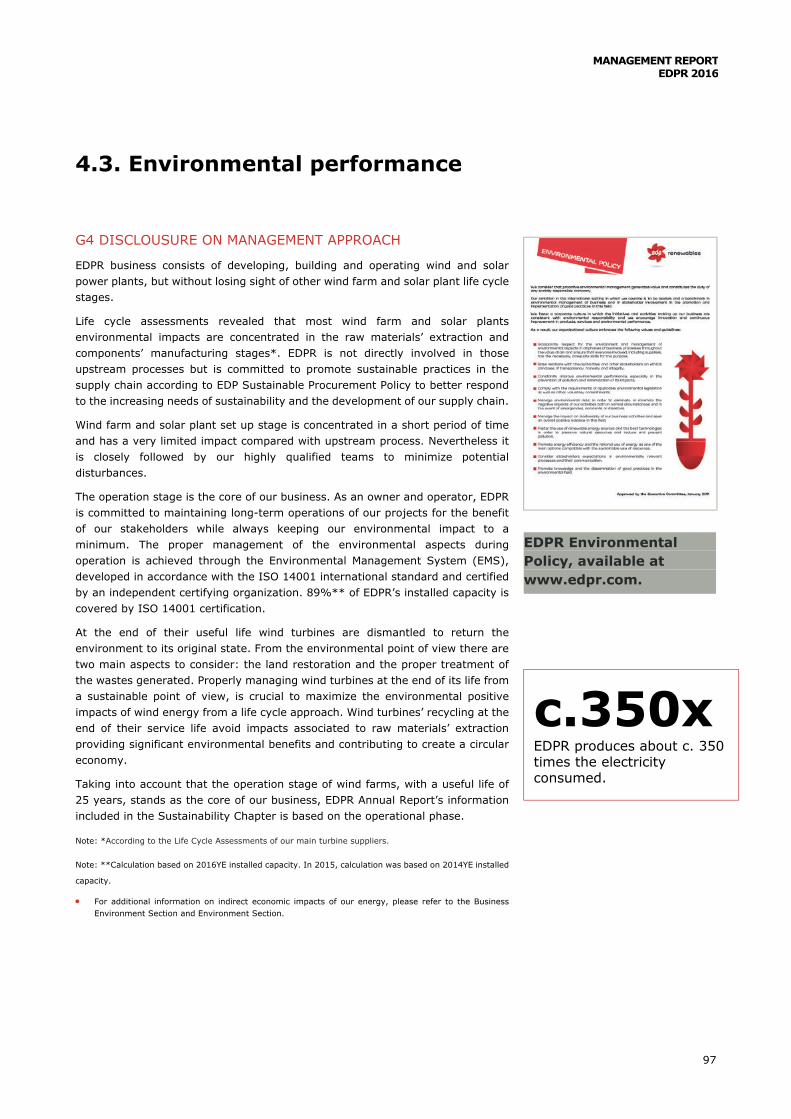
97
MANAGEMENT REPORTEDPR 2016
4.3. Environmental performance
G4 DISCLOUSURE ON MANAGEMENT APPROACH
EDPR business consists of developing, building and operating wind and solar power plants, but without losing sight of other wind farm and solar plant life cycle stages.
Life cycle assessments revealed that most wind farm and solar plants environmental impacts are concentrated in the raw materials’ extraction and components’ manufacturing stages*. EDPR is not directly involved in those upstream processes but is committed to promote sustainable practices in the supply chain according to EDP Sustainable Procurement Policy to better respond to the increasing needs of sustainability and the development of our supply chain.
Wind farm and solar plant set up stage is concentrated in a short period of time and has a very limited impact compared with upstream process. Nevertheless it is closely followed by our highly qualified teams to minimize potential disturbances.
The operation stage is the core of our business. As an owner and operator, EDPR is committed to maintaining long-term operations of our projects for the benefit of our stakeholders while always keeping our environmental impact to a minimum. The proper management of the environmental aspects during operation is achieved through the Environmental Management System (EMS), developed in accordance with the ISO 14001 international standard and certified by an independent certifying organization. 89%** of EDPR’s installed capacity is covered by ISO 14001 certification.
At the end of their useful life wind turbines are dismantled to return the environment to its original state. From the environmental point of view there are two main aspects to consider: the land restoration and the proper treatment of the wastes generated. Properly managing wind turbines at the end of its life from a sustainable point of view, is crucial to maximize the environmental positive impacts of wind energy from a life cycle approach. Wind turbines’ recycling at the end of their service life avoid impacts associated to raw materials’ extraction providing significant environmental benefits and contributing to create a circular economy.
Taking into account that the operation stage of wind farms, with a useful life of 25 years, stands as the core of our business, EDPR Annual Report’s information included in the Sustainability Chapter is based on the operational phase.
Note: *According to the Life Cycle Assessments of our main turbine suppliers.
Note: **Calculation based on 2016YE installed capacity. In 2015, calculation was based on 2014YE installed
capacity.
For additional information on indirect economic impacts of our energy, please refer to the Business Environment Section and Environment Section.
EDPR Environmental Policy, available at www.edpr.com.
c.350x EDPR produces about c. 350 times the electricity consumed.

98
G4 EN3 - ENERGY CONSUMPTION WITHIN THE ORGANIZATION
Wind turbines and solar panels require a small amount of electricity to operate. This energy consumption is generally self-consumed. Given the intermittency of wind generation we sometimes need to consume electricity from the grid.
Note: Gas conversion factor according to Agência Portuguesa de Ambiente.
Note: 2015 Gas data and offices Electricty consumption restated.
G4 EN6 - REDUCTION OF ENERGY CONSUMPTION
Our activity is based on clean energy generation, and we produce about 350 times the electricity we consume. However, we are conscious about promoting a culture of rational use of resources and we promote many internal campaigns to promote sustainable behaviors as is explained in our website www.edpr.com.
G4 EN8 - TOTAL WATER WITHDRAWAL BY SOURCE Generation from wind energy does not consume water in its operational processes. The water is consumed mainly for human use. The consumption of water per electricity generated accounts for 0.76 litres/MWh. Even so, the company actively seeks to adopt more eco-efficient practices. An example of this is that in 2016 38 substations had rainwater collection and treatment systems installed to cover their own water supply needs. For additional information about what sets EDPR apart in terms of environmental management, please refer to Sustainability section at www.edpr.com.
WATER CONSUMPTION PER TECHNOLOGY
MWh 2016 2015 %
Energy consumption
Wind farms: Electricity consumption (MWh) 67,423 66,602 1%
Offices: Electricity consumption (MWh) 3,776 3,666 3%
Gas (MWh) 1,009 996 1%

99
MANAGEMENT REPORTEDPR 2016
G4 EN11 - OPERATIONAL SITES OWNED, LEASED, MANAGED IN, OR ADJACENT TO, PROTECTED AREAS AND AREAS OF HIGH BIODIVERSITY VALUE OUTSIDE PROTECTED AREAS

100
G4 EN12 - DESCRIPTION OF SIGNIFICANT IMPACTS OF ACTIVITIES, PRODUCTS, AND SERVICES ON BIODIVERSITY IN PROTECTED AREAS AND AREAS OF HIGH BIODIVERSITY VALUE OUTSIDE PROTECTED AREAS
Potential environmental impacts are analyzed in detail in the environmental impact studies of the projects. Additionally feasible alternatives are assessed and preventive, corrective and compensation measures are determined.
The company has defined general procedures in its Environmental Management System to prevent, correct or compensate impacts in the environment. In addition, efforts are intensified with specific monitoring procedures in the small number of sites located inside or close to protected areas.
For additional information, visit our environmental information on the sustainability section our website, www.edpr.com.
G4 EU13 - BIODIVERSITY OF OFFSET HABITATS COMPARED TO THE BIODIVERSITY OF THE AFFECTED AREAS
In the small number of sites located inside or close to protected areas, we intensify our efforts with specific monitoring procedures, as defined in our Environmental Management System.
For additional information, visit our environmental information on the sustainability section our website, www.edpr.com.
G4 EN13 - HABITATS PROTECTED OR RESTORED
After the construction period, it is our duty to return the site to its initial state. Therefore, we perform morphological restoration and reseeding works. In 2016, almost 63 ha of affected land were restored.
The Castilla y León Natural Heritage Foundation is linked to the Castilla y León Regional Government and seeks to promote, maintain and manage the natural heritage of the region of Castilla y León.
EDPR, the EDP Foundation and the Castilla y León Natural Heritage Foundation signed a cooperation agreement in December 2014 to work together on a series of environmental initiatives aimed at protecting the red kite.
The agreement finalized in December 2016 following a total investment of €204,600, which allowed for a series of measures to be put in place:
Measures aimed at enhancing knowledge of red kite biology, including radio-collaring birds of different ages, installing a video camera in a red kite nest and tracking red kite populations in low-density areas. Measures to improve food sources for the red kite, including advice to formers in low-density areas on the placement of carrion to improve trophic resources, the creation of specific feeding points with photo-trap monitoring and improvements to the dunghill at the Las Batuecas – Sierra de Francia national park. Measures designed to reduce unnatural red kite deaths, analysing poisonings and incidences with wind farms and electrical infrastructure. The company plans to continue to work with the Castilla y León Natural Heritage Foundation in 2017 through a new cooperative agreement.
EDPR Biodiversity Policy, available at www.edpr.com.
Potential environmental impacts are analyzed in detail in the environmental impact studies of the projects.

101
MANAGEMENT REPORTEDPR 2016
G4 EN15 - DIRECT GREENHOUSE GAS (GHG) EMISSIONS (SCOPE 1)
EDPR’s Scope 1 emissions represent 2,108 tons of CO2 equivalent. 1,904 tones are emitted by transportation related to our windfarms operation, 179 tones by gas consumption in our offices and the rest of it is related to SF6.
Part of the equipment used for electricity generation purposes contains SF6 gasses and during 2016 we registered emissions of 1 kg of this gas, which is equivalent almost to 25t CO2 eq.
Note: Emissions were estimated according to GHG Protocol (including official sources such as IPCC or the U.S Department of Energy)
G4 EN16 - ENERGY INDIRECT GREENHOUSE GAS (GHG) EMISSIONS (SCOPE 2)
EDPR’s CO2 indirect emissions represent 8,655 tons, 8,489 tons driven by electricity consumption by the wind farms and solar plants and 166 tons electricity consumption by the offices.
In 2016, 100% of the emissions related to electricity consumption in windfarms and offices in Spain and US have been compensated by the certifications of origin and RECs obtained from our renewable energy generation. As a result, there is a reduction in the reported emissions year on year.
Note 1: The emission factors used are based on the following sources: Portugal - EDP, Turbogás, Pego, Rede Eléctrica Nacional (REN), and Entidade Reguladora dos Serviços Energéticos (ERSE); Spain – Red Eléctrica de España (REE); Brazil - Ministry of Science and Technology - SIN (National Interconnected System); USA - Emissions & Generation Resource Integrated Database (eGRID) for each state emission factor; Other European Countries - CERA, Global Insight.
Note 2: Electricity consumption emissions were calculated with the global emission factors of each country
and state within the US.
G4 EN17 – OTHER INDIRECT GREENHOUSE GAS (GHG) EMISSIONS (SCOPE 3)
Our work requires our employees to travel and commute. Based on our estimates, the transportation used by our employees accounted for a total of 5,470 tons of CO2 emissions.
Note: Emissions were estimated according to GHG Protocol, by following the DEFRA standard. Employee
commuting emissions were calculated from data collected in a survey to all employees.
24.9
1.1
6.80.4
CO2 eq emitted in 2015 (k tons)
Wind Farms Energy ConsumptionOffices Energy ConsumptionEmployees transportationSF6
8.490.34
7.37
0.02
CO2 eq emitted in 2016 (k tons)
Wind Farms Energy ConsumptionOffices Energy ConsumptionEmployees transportationSF6

102
G4 EN19 - REDUCTION OF GREENHOUSE GAS (GHG) EMISSIONS
Our core business activity inherently implies the reduction GHG emissions. Wind and solar energy has zero carbon emissions, contributing to the world’s fight against climate change and does not produce harmful SOx, NOx, or mercury emissions, protecting valuable air and water resources. We estimated that our activities avoided the emission of 20,078 thousand tons of CO2.
Our emissions represent 0.1% of the total amount of emissions avoided and 53% of our total emissions are from the necessary electricity consumption by the wind farms. Even though our activity is based on the clean energy generation, we are conscious about promoting a culture of rational use of resources. During 2016, we continued promoting initiatives that foster environmental best practices in our offices.
In 2016, 100% of the emissions related to electricity consumption in windfarms and offices in Spain and US have been compensated by the certifications of origin and RECs obtained from our renewable energy generation. As a result, there is a reduction in the reported emissions year on year.
Note: To calculate the emissions avoidance, the energy generation has been multiplied by the CO2 eq
emission factors of each country and state within the US. We considered the emission factor of just fossil
fuel energy, as we considered that by increasing the generation of renewable energy, we are displacing these
technologies, while other renewable technologies and nuclear plants will continue with its quota of
generation.
G4 EN23 - TOTAL WEIGHT OF WASTE BY TYPE AND DISPOSAL METHOD
The main contribution to the hazardous waste produced by wind farms is related to oil and oil-related wastes such as oil filters or oil containers, used mainly for lubrication of the turbines. The consumption of this oil is based on certain pre-defined replacement time frequencies (between 2 and 5 years, based on the component, oil type and manufacturer). During 2016, the recovery rate was 87% impacted by a significant spill with a volume of 65 metric tons of soil contaminated. Excluding this fact the recovery rate would have been 97% which certifies that the company has been actively working to improve the recycling rate of its hazardous wastes, through authorized waste haulers.
As a reminder, the increase in hazardous wastes in 2015 was mainly due to the contamined soil driven by a significant spill. This soil was removed and fully restored. The increase in non-hazardous wastes in 2015 was driven by metals and glassfiber from 2 nacelles burned. These metals where fully recovered. On the basis of these pick values during the previous year, both hazardous and non-hazardous wastes in 2016 have decreased.
Even though our activity inherently implies the reduction GHG emissions, EDPR goes one-step forward compensating 100% of the emissions related to grid connection of our windfarms and offices in Spain and US.

103
MANAGEMENT REPORTEDPR 2016
The following table summarizes the amount wastes generated per GWh in our facilities and the rate of recycling.The following table summarizes the amount wastes generated:
Annual fluctuations in hazardous waste generated are heavily dependent on the pluri-annual oil replacement programs above mentioned. Non-hazardous wastes generated by the company include metals, plastics, paper or domestic garbage which is recycled in their vast majority.
Note 1: In Europe, the method of disposal has been indicated by the waste hauler, while in the US the disposal
method has been determined by the organizational standards of the waste hauler.
Note 2: For the purposes of this report, all wastes have been classified as Hazardous or Non-hazardous
according to European Waste Catalogue; however, in each country where EDPR has a geographic presence,
each wind farm is required to adhere to national law by following company procedures for handling, labelling,
and storage of wastes to ensure compliance. In cases, like in the United States, when our operations generate
small quantities of substances which fall into additionally-regulated categories such as used oils and universal
wastes–we follow strict standards for handling and disposal of these waste types to ensure we remain
compliant with all applicable laws.
2016 2015 (%)
Waste generated by EDPR 1
Total waste (kg/GWh) 48.8 72.8 -33%
Total hazardous waste (kg/GWh) 26.4 32.7 -19%
% of hazardous waste recovered 87% 73% 18%
2016 2015 (%)
Waste generated by EDPR 1
T ot al wast e ( t ) 1,19 5 1,556 - 2 3 %
Total hazardous wastes (t ) 647 700 -7%
Total hazardous waste disposed (t) 84 186 -55%
Total hazardous waste recovered (t) 563 514 10%
Total non-hazardous wastes (t ) 547 856 -36%
Total non-hazardous waste disposed (t ) 227 608 -63%
Total non-hazardous waste recovered (t ) 320 248 29%

104
G4 EN24 - TOTAL NUMBER AND VOLUME OF SIGNIFICANT SPILLS
Given our activity and our locations, oil spills and fires are the major environmental risks the company faces. The Environmental Management System is designed and implemented to prevent emergency situations from happening. But in case they happen, the system covers the identification and management of these, including the near-miss situations.
EDPR defines as significant spill the ones above 0.16 m3 that reached the ground. Additionally, EDPR registers near miss situations, when registered incident does not reach the category of significant spill. In 2016, we had 3 significant spills with a total volume of 0.61 m3 of oil spilled, and 1 incipient fire and 6 fires without environmental impact. All cases were properly managed: oil spills were confined early and contaminated soil was collected and managed. Additionally, 52 near miss were registered driven by small oil leaks that did not reach bare soil.
EDPR performs regular environmental drills to guarantee that our employees are familiar with the risks and have received the appropriate training to prevent and act, if necessary.
G4 EN29 - MONETARY VALUE OF SIGNIFICANT FINES AND TOTAL NUMBER OF NON-MONETARY SANCTIONS FOR NON-COMPLIANCE WITH ENVIRONMENTAL LAWS AND REGULATIONS
During 2016, the company did not receive any penalty for non-compliance with environmental laws and regulations.
G4 EN30 - SIGNIFICANT ENVIRONMENTAL IMPACTS OF TRANSPORTING PRODUCTS AND OTHER GOODS AND MATERIALS USED FOR THE ORGANIZATION'S OPERATIONS, AND TRANSPORTING MEMBERS OF THE WORKFORCE
The main environmental impact was from employees traveling and commuting for business activities.
For additional information about our emissions registered due to employees’ transportation, please refer to the EN15 Indicator.
G4 EN31 - TOTAL ENVIRONMENTAL PROTECTION EXPENDITURES AND INVESTMENTS BY TYPE
In 2016, 3.3 million euros were invested and 5.7 million euros were expended in environmental related activities (includes personnel costs).
For additional information about environmental protection expenditures and investments, please refer to Note 40 in our Financial Statements.
G4 EN32 - PERCENTAGE OF NEW SUPPLIERS THAT WERE SCREENED USING ENVIRONMENTAL CRITERIA
EDPR´s Environment and Biodiversity Policies reflect a responsible management of the environment along the whole value chain. According to these policies, EDPR
EDPR performs regular environmental drills to guarantee that our employees are familiar with the risks and have received the appropriate training to prevent and act, if necessary.
3.3 million euros were invested and 5.7 million euros expended in environmental related activities.

105
MANAGEMENT REPORTEDPR 2016
is committed to ensure that everyone involved, including suppliers, has the necessary, adequate skills for the purpose.
The suppliers of EDPR shall adopt all necessary measures to ensure strict compliance with all applicable environmental regulations as well as EDPR´s Environment and Biodiversity Policies, internal norms, procedures and systems in place as regards to environmental management.
EDPR has implemented, for all its wind farms in operation, an Environmental Management System (EMS) developed according to the international standard ISO 14001:2004. EDPR´s suppliers shall know and understand the EMS and ensure the full compliance with the procedures set. Supplier shall make the EMS available to its employees and subcontractors.
EDPR’s critical suppliers (defined as per EDP formal corporate standard methodology) in Corporate, Europe and Brazil and in North America that had environmental systems: 88% of EDPR’s critical suppliers had environmental systems.
For further information please refer to Suppliers Section.
G4 EN33 - SIGNIFICANT ACTUAL AND POTENTIAL NEGATIVE ENVIRONMENTAL IMPACTS IN THE SUPPLY CHAIN AND ACTIONS TAKEN
In 2015, EDPR carried out a study to characterize its Supply Chain, including the analysis of the exposure to economic, social and environmental risks. This analysis was performed using ESCHER (Efficient Supply Chain Economic and Environmental Reporting) methodology developed by PwC. For the ESCHER calculation routine PwC used EDP Group 2014 data.
The study allowed EDPR to determine the following results:
300* thousand ton GHG emissions associated to EDPR’s direct and indirect Supply Chain, 5%* of which related to direct suppliers.
Through this study, EDPR aims to identify areas where should focus its improvement activities in order to significantly reduce its exposure to risk and optimize impacts.
Note: Analysis performed by PwC using ESCHER (Efficient Supply Chain Economic and Environmental
Reporting) tool, based on 2014 purchasing data. This study is still representative of EDPR reality and
companies in the sector perform these studies every 2/3 years. Data presented in this chapter resulting from
this study is marked with an *.
For further information please refer to Suppliers Section.
G4 EN34 - NUMBER OF GRIEVANCES ABOUT ENVIRONMENTAL IMPACTS FILED, ADDRESSED, AND RESOLVED THROUGH FORMAL GRIEVANCE MECHANISMS
EDPR has no knowledge of any environmental formal grievance recorded during 2016 in any of its grievance channels.

106
4.4. Social performance
4.4.1. LABOR PRACTICES AND DECENT WORK
G4 DISCLOUSURE ON MANAGEMENT APPROACH
EDPR's growth in recent years has created a new labor environment that is home to three different generations, a landscape in which it is vital for the company to be able to adapt to the changing business realities in the markets where we operate. We offer a customized employee value proposition based on development, transparency and flexibility, which allows us to attract and retain talent, as well as ensure the ongoing growth and development of our employees in order to have team-oriented people capable of adjusting to the ever-changing working environment.
Development: EDPR is committed to the development of its employees, offering them an attractive professional career and aligning their capabilities and skills with the current and future needs of the company. The growth and development of the Group's business has led EDPR to invest in people with potential, who can contribute to the creation of value. Our objective is to attract talented people and to create opportunities for current employees through mobility and development actions in order to boost the potential of our employees. The HR strategy supports different initiatives to give them visibility and foster their professional development inside the company. The cornerstones of development at EDPR are mobility, training and Development Programs and Renewable Energy School.
Transparency: At EDPR, we strive to attract, integrate and develop our professionals who seek to excel in their work in order to position the company as the "the first choice for employees" in the labor market.
Flexibility: As part of our value proposition at EDPR, we offer a competitive remuneration package, aligned with the best practices in the market. In addition, we understand the importance of maintaining a work-life balance. It is a set of initiatives to promote a positive working environment in which employees can advance in their professional career and give their best. We believe that WLB must be a shared responsibility. We seek to constantly improve our WLB measures and provide the most suitable benefits to employees. In order to improve company's people management performance, EDP launches every two years the Organizational Climate Study. This study is a strategic Human Resources tool and one of the widest channels we have for collecting our employees’ feedback on the company's people management performance
In addition to these three pillars, guaranteeing the health, safety and well-being of our employees is top priority at EDPR. This stern commitment is supported by our Health and Safety policies and initiatives, as well as, a strong track record. EDPR has a zero accidents goal stated in our Health & Safety policy.
Note: WLB (Work Life Balance)
For additional information on our Human Resources strategy, please refer to the Employees Section.
1,083 employees from
33 nationalities.

107
MANAGEMENT REPORTEDPR 2016
G4 10 - TOTAL WORKFORCE BY EMPLOYMENT TYPE, EMPLOYMENT CONTRACT, AND REGION.
In 2016, EDPR had 1,083 employees. 20% worked at EDPR holding, 41% in the European Platform, 36% in the North American Platform and 3% in Brazil.
The average number of contractors’ workers during the period has been 806 in Europe, 1,441 in North America and 98 in Brazil.
G4 LA1 - TOTAL NUMBER AND RATE OF EMPLOYEE TURNOVER BY AGE GROUP, GENDER, AND REGION
Throughout the year, EDPR hired 158 employees while 93 are no longer with the company, resulting in a turnover ratio of 12%, which is slightly lower than the previous year.
Workforce Breakdown 2016 % Female 2015 % Female
Tot al 1,0 8 3 3 3 % 1,0 18 3 2 %
By Employment type:
Full t ime 1,050 31% 996 30%
Part t ime 33 94% 22 100%
By Employment Contract:
Permanent 1,066 33% 1,001 32%
Temporary 17 24% 17 35%
By Country:
Spain 373 34% 359 33%
Portugal 72 10% 62 10%
France 53 38% 48 31%
Belgium 2 0% 2 0%
Poland 38 37% 40 30%
Romania 32 38% 33 36%
Italy 23 35% 22 36%
UK 34 47% 37 43%
USA 410 33% 373 33%
Canada 5 0% 5 0%
Brazil 34 29% 32 25%
M exico 7 29% 5 20%

108
G4 EU17 - DAYS WORKED BY CONTRACTOR AND SUBCONTRACTOR EMPLOYEES INVOLVED IN CONSTRUCTION, OPERATION AND MAINTENANCE ACTIVITIES
Contractors involved in construction, operation and maintenance activities worked 575,403 days during 2016.
G4 EU18 - PERCENTAGE OF CONTRACTOR AND SUBCONTRACTOR EMPLOYEES THAT HAVE UNDERGONE RELEVANT HEALTH AND SAFETY TRAINING
As an integral part of our health & safety strategy, we conduct several training courses and risk assessment activities according to the potential risks identified for each position within the company.
We are equally concerned with the health and safety standard of our employees and contractors. To this extent our contractors are subject to a health and safety screening when they bid to work for our company. Once the contractor is selected, they are required to present proof of having completed the required training. 95% of contractors have undergone relevant health and safety training during 2016 given by EDPR. Nevertheless, is mandatory for the companies that work with EDPR to assure that all the contractors have undergone health and safety courses.
2,345 contractors involved in construction and operation and maintenance activities during 2016.
Employee Turnover New Hires Departures Turnover
T o t al 158 9 3 12 %0
By Age Group: Less than 30 years old 73 26 23%
Between 30 and 39 years old 65 37 10%
Over 40 years old 20 30 7%
0
By Gender:29
Female 49 21 10%
M ale 109 72 12%
40
By Country:13
Spain 23 10 4%
Portugal 11 2 9%
France 12 7 18%
Belgium 0 0 0%
Poland 4 6 13%
Romania 3 3 9%
Italy 2 0 4%
UK 1 3 6%
USA 92 58 18%
Canada 1 0 10%
Brazil 5 2 10%
M exico 4 0 29%

109
MANAGEMENT REPORTEDPR 2016
G4 LA2 - BENEFITS PROVIDED TO FULL-TIME EMPLOYEES THAT ARE NOT PROVIDED TO TEMPORARY OR PART-TIME EMPLOYEES, BY MAJOR OPERATIONS
As a responsible employer we offer quality employment that can be balanced with personal life. The package of benefits provided to full-time employees does not differ from that offered to part-time employees, and generally it goes beyond what is agreed in collective bargaining agreements. This benefits package includes medical insurance, life insurance, pension plan and conciliation measures.
G4 LA3 - RETURN TO WORK AND RETENTION RATES AFTER PARENTAL LEAVE, BY GENDER
In 2016, 70 employees enjoyed a maternal or paternal leave. All returned but after that four of them extended their leave.
EDPR recognized with ESR certificate – Socially Responsible Company - and ranked among the 50 best companies to work in Spain and Poland.
Parental leave Maternal Paternal Return to work
Spain 15 15 30
Portugal 1 3 4
France 1 3 4
Belgium 0 1 1
Poland 3 2 5
Romania 0 2 2
Italy 0 1 1
UK 1 1 2
USA 6 13 19
Canada 0 0 0
Brazil 0 2 2
M exico 0 0 0
T o t al 2 7 4 3 70
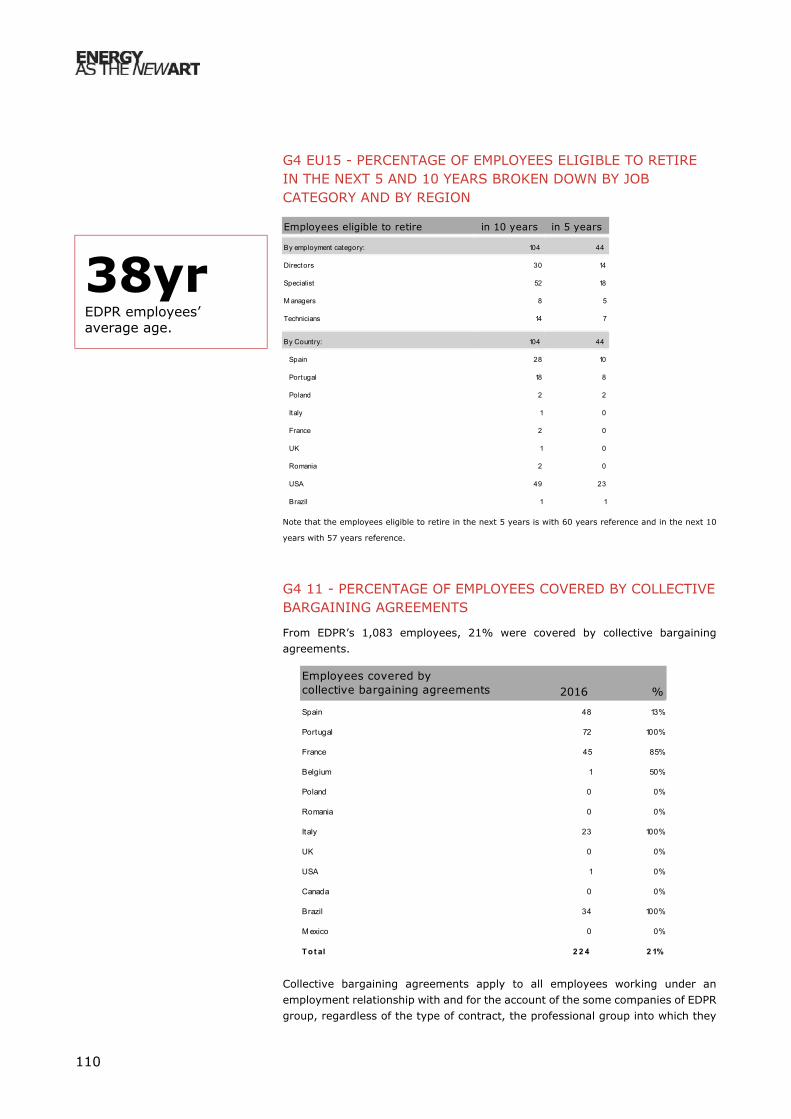
110
G4 EU15 - PERCENTAGE OF EMPLOYEES ELIGIBLE TO RETIRE IN THE NEXT 5 AND 10 YEARS BROKEN DOWN BY JOB CATEGORY AND BY REGION
Note that the employees eligible to retire in the next 5 years is with 60 years reference and in the next 10
years with 57 years reference.
G4 11 - PERCENTAGE OF EMPLOYEES COVERED BY COLLECTIVE BARGAINING AGREEMENTS
From EDPR’s 1,083 employees, 21% were covered by collective bargaining agreements.
Collective bargaining agreements apply to all employees working under an employment relationship with and for the account of the some companies of EDPR group, regardless of the type of contract, the professional group into which they
Employees eligible to retire in 10 years in 5 years
By employment category: 104 44
Directors 30 14
Specialist 52 18
M anagers 8 5
Technicians 14 7
By Country: 104 44
Spain 28 10
Portugal 18 8
Poland 2 2
Italy 1 0
France 2 0
UK 1 0
Romania 2 0
USA 49 23
Brazil 1 1
Employees covered by collective bargaining agreements 2016 %
Spain 48 13%
Portugal 72 100%
France 45 85%
Belgium 1 50%
Poland 0 0%
Romania 0 0%
Italy 23 100%
UK 0 0%
USA 1 0%
Canada 0 0%
Brazil 34 100%
M exico 0 0%
T o t al 2 2 4 2 1%
38yr EDPR employees’ average age.

111
MANAGEMENT REPORTEDPR 2016
are classified, their occupation or job. However, matters relating to the corporate organization itself, the laws of each country or even usage and custom in each country result in certain groups being expressly excluded from the scope of collective bargaining agreements.
For further information please refer to the Employee relations Section.
G4 LA4 - MINIMUM NOTICE PERIOD(S) REGARDING SIGNIFICANT OPERATIONAL CHANGES, INCLUDING WHETHER IT IS SPECIFIED IN COLLECTIVE AGREEMENTS
Per country case law, EDPR may have a minimum period which it must comply with for giving formal notice of organizational changes at the companies in the Group with an impact on employees. However, it is customary to communicate significant events to the affected groups in advance.
As an employer in the United States, EDPR complies with the Worker Adjustment and Retraining Notification (WARN) Act Guide to Advance Notice of Closings and Layoffs.
G4 LA5 - PERCENTAGE OF TOTAL WORKFORCE REPRESENTED IN FORMAL JOINT MANAGEMENT-WORKER HEALTH AND SAFETY COMMITTEES THAT HELP MONITOR AND ADVISE ON OCCUPATIONAL HEALTH AND SAFETY PROGRAMS
A significant part of our organization plays a fundamental role in the implementation of our health and safety policy. The company created health and safety committees that collect information from different operational levels and involve employees in the definition and communication of a preventive plan.
During 2016, 4.0% of our employees attended health and safety committee meetings, representing 62% of our workforce. All EDPR geographies have active health and safety committees in place.

112
G4 LA6 - RATES OF INJURY, OCCUPATIONAL DISEASES, LOST DAYS, AND ABSENTEEISM, AND NUMBER OF WORK-RELATED FATALITIES BY REGION
1 Injury Rate calculated as [# of accidents/Hours worked * 1,000,000]
2 Lost Work Day Rate calculated as [# of working days lost/Hours worked * 1,000,000]
3 Minor first aid injuries are not included and number of days is calculated as the number of calendar days
There have been only an accident with a woman involved, which took place in Italy, with a 10 days absence.
G4 LA9 - AVERAGE HOURS OF TRAINING PER YEAR PER EMPLOYEE BY EMPLOYEE CATEGORY
For a complete description of our Training and Human Resources strategy, please refer to the Employees Section.
EDPR did not record any fatal accidents during 2015 and 2016.
Europe and US have lower H&S indicators due to more training hours and emergency plans both for staff and contractors.
44,35038,619
2016 2015
Number of Training Hours (#)
H&S Indicators (EDPR and contractors personnel)3 2016 2015
Number of industrial accidents 25 27
Europe 13 15
North America 12 3
Brazil 0 9
Number of industrial fatal accidents 0 0
Europe 0 0
North America 0 0
Brazil 0 0
Working days lost by accidents caused 1,124 881
Europe 820 735
North America 304 57
Brazil 0 89
Injury Rate (IR)1: 4 5
Europe 5 5
North America 3 1
Brazil 0 13
Lost work day rate (LDR)2: 170 151
Europe 309 269
North America 83 24
Brazil 0 125
Training Metrics 2016 2015
Number of Training Hours (# ) 44,350 38,619
Training Investment (k€) 1,492 1,607
Number of Attendances (# ) 9,024 6,459

113
MANAGEMENT REPORTEDPR 2016
G4 LA10 - PROGRAMS FOR SKILLS MANAGEMENT AND LIFELONG LEARNING THAT SUPPORT THE CONTINUED EMPLOYABILITY OF EMPLOYEES AND ASSIST THEM IN MANAGING CAREER ENDINGS
We strive to offer our total workforce with opportunities to develop professionally and assume new roles to reach the goals of the company. Employees are encouraged to take advantage of the functional and geographic mobility opportunities.
For a complete description of our Training and Human Resources strategy, please refer to the Employees Section.
G4 LA11 - PERCENTAGE OF EMPLOYEES RECEIVING REGULAR PERFORMANCE AND CAREER DEVELOPMENT REVIEWS, BY GENDER
All of EDPR’s employees, regardless of their professional category, are evaluated every two years to determine their development potential by providing the most suitable training. EDPR creates tailored development plan to address specific needs.
Moreover, EDPR offers the possibility to all employees to define a Personal Development Plan. This plan is very effective tool that enable us to structure training actions for the candidate aimed at widening their abilities and expertise since it requires a reflection upon the results of their skills assessment and identify the individual's strong points and areas where he can improve, taking into account the employee's development level, as well as the teamwork and organizational strategy.
The Personal Development Plans (PDIs) launched in 2015 were reviewed in 2016, testament to our culture of continuous feedback and ongoing improvement. These are voluntary plans, agreed between manager and employee.
The potential assessment process is independent from performance appraisal and is based on a 360 degree evaluation model which considers feedback from oneself, peers, subordinates and the manager.
G4 LA12 - COMPOSITION OF GOVERNANCE BODIES AND BREAKDOWN OF EMPLOYEES PER EMPLOYEE CATEGORY ACCORDING TO GENDER, AGE GROUP, MINORITY GROUP MEMBERSHIP, AND OTHER INDICATORS OF DIVERSITY A detailed description of the governance bodies can be found at the Corporate Governance Chapter of
this report, Annex - Biographies. Please refer to LA1 and LA13 to employees related information.
Our Code of Ethics contains specific clauses of non-discrimination and equal opportunities in line with the company’s culture of diversity.
“EDPR undertakes to ensure that its labor policies and procedures prevent unjustified discrimination and different treatment on the basis of ethnic or social origin, gender, sexual orientation, age, creed, marital status, disability, political orientation, opinion, birthplace or trade union membership.”
Principles of Action –
Code of Ethics

114
G4 LA13 - RATIO OF BASIC SALARY OF MEN TO WOMEN BY EMPLOYEE CATEGORY
n/a: no women in these categories.
G4 LA14 - PERCENTAGE OF NEW SUPPLIERS THAT WERE SCREENED USING LABOR PRACTICES CRITERIA
EDPR is governed by a strong sense of ethics and requires that its suppliers do not have conflicts with EDPR ethical standards. In this way, the acceptance of alignment with the spirit of EDPR’s Code of Ethics is required. As part of a supplier qualification process the supplier shall provide a written declaration of acceptance of the principles established in EDPR’s Code of Ethics.
Additionally, the EDP Group and EDPR, have a Procurement Manual, which includes a chapter that guides each Purchasing Department to put sustainability principles into practice. Therefore when procuring and contracting goods and services EDPR appeals to all reasonable endeavors so that selected suppliers accept to comply with the UN Global Compact’s ten principles in the areas of human rights, labor, the environment and anti-corruption. Procedures to guarantee this accomplishment are defined.
100% of the EDPR critical suppliers (defined as per EDP formal corporate standard methodology) are aligned with Global Compact criteria and EDPR’s Code of Ethics.
For further information please refer to Suppliers Section.
G4 LA15 - SIGNIFICANT ACTUAL AND POTENTIAL NEGATIVE IMPACTS FOR LABOR PRACTICES IN THE SUPPLY CHAIN AND ACTIONS TAKEN
In 2016, 83% of EDPR’s critical suppliers (as defined as per EDP formal corporate standard methodology) had an Occupation Health & Safety System (OHS) in place.
EDPR completed 13,156 hours of training on OHS to its suppliers, involving 165 companies and 2,227 workers. Additionally, EDPR carried out 1,052 audits to suppliers in the scope of OHS.
For further information please refer to Suppliers Section.
M/F Salary Ratio M/F Salary
Board Directors (nom executive) n/a
Directors 111%
Specialist 108%
M anagers 106%
Technicians 97%

115
MANAGEMENT REPORTEDPR 2016
G4 LA16 - NUMBER OF GRIEVANCES ABOUT LABOR PRACTICES FILED, ADDRESSED, AND RESOLVED THROUGH FORMAL GRIEVANCE MECHANISMS
In 2016, EDPR did not record any contingencies related to labor practices.
4.4.2. HUMAN RIGHTS
G4 DISCLOUSURE ON MANAGEMENT APPROACH
EDPR became a signatory to the UN Global Compact, an initiative of the United Nations launched in 2000 that defines guideline directives for businesses that opt to contribute to sustainable development.
EDPR also has a Code of Ethics that contains specific clauses for the respect for human rights. In compliance with the Code, EDPR expresses its total opposition to forced or compulsory labor and recognizes that human rights should be considered fundamental and universal, based on conventions, treaties and international initiatives like the United Nations
Universal Declaration of Human Rights, the International Labor Organization and the UN Global Compact.
EDPR is governed by a strong sense of ethics and requires that its suppliers do not have conflicts with EDPR ethical standards. In this way, the acceptance of alignment with the spirit of EDPR’s Code of Ethics is required. As part of a supplier qualification process the supplier shall provide a written declaration of acceptance of the principles established in EDPR’s Code of Ethics.
Additionally, the EDP Group Sustainable Procurement Policy includes a reference to the promotion of respect for dignity and human rights and rejection of any form of forced labor or child labor, harassment, discrimination, abuse or other types of physical or psychological violence. Moreover, EDPR’s suppliers must know and accept by written the principles stablishes in EDPR’s Code Of Ethics and the UN Global Compact principles.
For further information about the Code of Ethics and the Ethics Channel please visit the Section 5Corporate Governance, C.II. Reporting Of Irregularities or visit our ethics information on the corporategovernance section, in our website, www.edpr.com. Moreover, additional information is detailed in theIntegrity and ethics section.
For further information regarding Suppliers please refer to Suppliers Section.
G4 HR1 - TOTAL NUMBER AND PERCENTAGE OF SIGNIFICANT INVESTMENT AGREEMENTS AND CONTRACTS THAT INCLUDE HUMAN RIGHTS CLAUSES OR THAT UNDERWENT HUMAN RIGHTS SCREENING
EDPR has a Code of Ethics that contains specific clauses for the respect for human rights. Our Procurement Manual also includes a chapter to put the UN Global Compact principles into practice.
EDPR did not record any incident related to labor practices or discrimination.
EDPR Code of Ethics , available at www.edpr.com.

116
G4 HR2 - TOTAL HOURS OF EMPLOYEE TRAINING ON POLICIES AND PROCEDURES CONCERNING ASPECTS OF HUMAN RIGHTS THAT ARE RELEVANT TO OPERATIONS, INCLUDING THE PERCENTAGE OF EMPLOYEES TRAINED
There is a strong commitment by the Company in relation to the dissemination and promotion of compliance with the Code of Ethics, which includes a Human Rights section, available to all employees through training, questionnaires, and open discussions of the findings. To this extent, from March to December 2016, EDP offered an online Ethics training (“Ética EDP") available to all employees of both Europe/Brazil and North America. This course achieved a major participation of around 900 EDPR employees.
G4 HR3 - TOTAL NUMBER OF INCIDENTS OF DISCRIMINATION AND CORRECTIVE ACTIONS TAKEN
In 2016, EDPR did not record any incidents of discrimination.
G4 HR4 - OPERATIONS IDENTIFIED IN WHICH THE RIGHT TO EXERCISE FREEDOM OF ASSOCIATION AND COLLECTIVE BARGAINING MAY BE AT SIGNIFICANT RISK, AND ACTIONS TAKEN TO SUPPORT THESE RIGHTS
In 2015, EDPR carried out a study to characterize its Supply Chain, based on an analysis of the exposure to economic, social and environmental risks. This analysis was performed using ESCHER (Efficient Supply Chain Economic and Environmental Reporting) methodology developed by PwC. For the ESCHER calculation routine PwC used EDP Group 2014 data related to suppliers. The study allowed EDPR to determine the following results:
~0%* EDPR’s direct suppliers identified in which the right to exercise freedom of association and collective bargaining may be at significant risk.
Note: Analysis performed by PwC using ESCHER (Efficient Supply Chain Economic and Environmental
Reporting) tool, based on 2014 purchasing data. This study is still representative of EDPR reality and
companies in the sector perform these studies every 2/3 years. Data presented in this chapter resulting from
this study is marked with an *.
For further information regarding Suppliers please refer to Suppliers Section.
G4 HR5 - OPERATIONS AND SUPPLIERS IDENTIFIED AS HAVING SIGNIFICANT RISK FOR INCIDENTS OF CHILD LABOR, AND MEASURES TAKEN TO CONTRIBUTE TO THE EFFECTIVE ABOLITION OF CHILD LABOR
EDPR’s Code of Ethics has specific clauses against child or forced labor. The company did not identify any operation that could have a significant risk for incidents of child labor, forced and compulsory labor or indigenous rights.
However, in 2015, EDPR carried out a study to characterize its Supply Chain, based on an analysis of the exposure to economic, social and environmental risks. This analysis was performed using ESCHER (Efficient Supply Chain Economic and Environmental Reporting) methodology developed by PwC. For the ESCHER calculation routine PwC used EDP Group 2014 data related to suppliers.
EDPR Ethical Process guarantees transparency and confidentiality.
Ethics Ombudsman
Ethics Committee
Board of Directors
ETHICS PROCESS

117
MANAGEMENT REPORTEDPR 2016
The study allowed EDPR to determine the following results:
~0%* EDPR’s direct suppliers identified as having significant risk for incidents of child labor.
Note: Analysis performed by PwC using ESCHER (Efficient Supply Chain Economic and Environmental
Reporting) tool, based on 2014 purchasing data. This study is still representative of EDPR reality and
companies in the sector perform these studies every 2/3 years. Data presented in this chapter resulting from
this study is marked with an *.
For further information about the Code of Ethics and the Ethics Channel please visit the Section 5 Corporate Governance, C.II. Reporting Of Irregularities or visit our ethics information on the corporate governance section, in our website, www.edpr.com. Moreover, additional information is detailed in the Integrity and ethics section.
For further information please refer to Suppliers Section.
G4 HR6 - OPERATIONS AND SUPPLIERS IDENTIFIED AS HAVING SIGNIFICANT RISK FOR INCIDENTS OF FORCED OR COMPULSORY LABOR, AND MEASURES TO CONTRIBUTE TO THE ELIMINATION OF ALL FORMS OF FORCED OR COMPULSORY LABOR
EDPR’s Code of Ethics has specific clauses against child or forced labor. The company did not identify any operation that could have a significant risk for incidents of forced and compulsory labor or indigenous rights.
However, in 2015, EDPR carried out a study to characterize its Supply Chain, based on an analysis of the exposure to economic, social and environmental risks. This analysis was performed using ESCHER (Efficient Supply Chain Economic and Environmental Reporting) methodology developed by PwC.
For the ESCHER calculation routine PwC used EDP Group 2014 data related to suppliers.
The study allowed EDPR to determine the following results:
~0%* EDPR’s direct suppliers identified as having significant risk for incidents of forced or compulsory labor.
Note: Analysis performed by PwC using ESCHER (Efficient Supply Chain Economic and Environmental
Reporting) tool, based on 2014 purchasing data. This study is still representative of EDPR reality and
companies in the sector perform these studies every 2/3 years. Data presented in this chapter resulting from
this study is marked with an *.
For further information about the Code of Ethics and the Ethics Channel please visit the Section 5 Corporate Governance, C.II. Reporting Of Irregularities or visit our ethics information on the corporate governance section, in our website, www.edpr.com. Moreover, additional information is detailed in the Integrity and ethics section.
For further information please refer to Suppliers Section.

118
G4 HR8 - TOTAL NUMBER OF INCIDENTS OF VIOLATIONS INVOLVING RIGHTS OF INDIGENOUS PEOPLES AND ACTIONS TAKEN
EDPR did not identify any operation that could have a significant risk for incidents with indigenous rights.
G4 HR9 - TOTAL NUMBER AND PERCENTAGE OF OPERATIONS THAT HAVE BEEN SUBJECT TO HUMAN RIGHTS REVIEWS OR IMPACT ASSESSMENTS
EDPR has renewable plants in operation in 11 countries and is present in 12 countries, all of which are within the scope of the Code of Ethics premises and regulation.
G4 HR10 - PERCENTAGE OF NEW SUPPLIERS THAT WERE SCREENED USING HUMAN RIGHTS CRITERIA
EDPR is governed by a strong sense of ethics and requires that its suppliers do not have conflicts with EDPR ethical standards. In this way, the acceptance of alignment with the spirit of EDPR’s Code of Ethics is required. As part of a supplier qualification process the supplier shall provide a written declaration of acceptance of the principles established in EDPR’s Code of Ethics.
Additionally, the EDP Group and EDPR, has a Procurement Manual, which includes a chapter that guides each Purchasing Department to put sustainability principles into practice. Therefore when procuring and contracting goods and services EDPR appeals to all reasonable endeavors so that selected suppliers accept to comply with the UN Global Compact’s ten principles in the areas of human rights, labor, the environment and anti-corruption. Procedures to guarantee this accomplishment are defined.
100% of the EDPR critical suppliers (defined as per EDP formal corporate standard methodology) are aligned with Global Compact criteria and EDPR’s Code of Ethics.
For further information please refer to Suppliers Section.
G4 HR11 - SIGNIFICANT ACTUAL AND POTENTIAL NEGATIVE HUMAN RIGHTS IMPACTS IN THE SUPPLY CHAIN AND ACTIONS TAKEN
In 2015, EDPR carried out a study to characterize its Supply Chain, based on an analysis of the exposure to economic, social and environmental risks. This analysis was performed using ESCHER (Efficient Supply Chain Economic and Environmental Reporting) methodology developed by PwC. For the ESCHER calculation routine PwC used EDP Group 2014 data related to suppliers.
The study allowed EDPR to determine the following results:
~0%* EDPR’s direct suppliers identified as having significant risk for incidents of child labor, forced or compulsory labor, freedom of association
Through this study, EDPRR aims to identify areas where should focus its improvement activities in order to significantly reduce its exposure to risk and optimize impacts.

119
MANAGEMENT REPORTEDPR 2016
Note: Analysis performed by PwC using ESCHER (Efficient Supply Chain Economic and Environmental
Reporting) tool, based on 2014 purchasing data. This study is still representative of EDPR reality and
companies in the sector perform these studies every 2/3 years. Data presented in this chapter resulting from
this study is marked with an *.
For further information please refer to Suppliers Section.
G4 HR12 - NUMBER OF GRIEVANCES RELATED TO HUMAN RIGHTS FILED, ADDRESSED, AND RESOLVED THROUGH FORMAL GRIEVANCE MECHANISMS
In 2016, EDPR did not record any incidents related to human rights practices in any of its grievance channels.
Additional information on the Whistleblowing Channel and the Ethics Channel can be found at Section 5 Corporate Governance, C. II. Reporting Of Irregularities or visit our ethics information on the corporate governance section, in our website, www.edpr.com. Moreover, additional information is detailed in the Integrity and ethics Section.
4.4.3. SOCIETY
G4 DISCLOUSURE ON MANAGEMENT APPROACH
Renewable energy technologies are viewed not only as tools for mitigating climate change, but are also increasingly recognized as investments that can provide direct and indirect economic advantages by reducing dependence on imported fuels (and hence, improving trade balances), enhancing local air quality and safety, advancing energy access and security, propelling economic development, Land leases and taxes are a large contribution to the yearly budget for the municipalities where it is present. In addition, EDPR devoted 1.1 million Euros in social projects to support education and community related activities and total tax contribution to the public finances amounts to €142m in year 2016.
Additional information on the Communities Section of this report and in our website www.edpr.com.
G4 SO1 - PERCENTAGE OF OPERATIONS WITH IMPLEMENTED LOCAL COMMUNITY ENGAGEMENT, IMPACT ASSESSMENTS, AND DEVELOPMENT PROGRAMS
We are well aware of the impact that our activity has in the local communities where we develop our wind farms and how we can maximize those potential benefits for the company and the inhabitants of the surrounding areas through an open communication with our stakeholders. Therefore, we establish a relationship of trust and collaboration with the communities where we have presence from the very initial stages of our projects, organizing informative sessions, we hold open dialogs with these communities, to explain the benefits of wind energy. We also organize volunteering and sport activities to promote a sustainable development of the society. Our business generates further indirect positive impacts in the areas where we are present, through local hiring and procurement and the development of infrastructures and the payment of taxes and rents.
Additional information on the Communities Section of this report and in our website www.edpr.com.
36%
29%
20%
14% 1%
Spain Portugal US + CanadaRest of Europe Brazil
€142min 2016
Distribution of EDPR Group's tax payments by country
29%
30%
32%
9%
Corporate Income Tax Energy TaxProperty & Land Taxes Other Tributes
€142min 2016
Distribution of EDPR Group's tax payments by tax type

120
G4 SO2 - OPERATIONS WITH SIGNIFICANT ACTUAL OR POTENTIAL NEGATIVE IMPACTS ON LOCAL COMMUNITIES
Wind farm energy is a long lasting economic development driver for the municipalities where it is present. EDPR performance of studies assessing the impact on the environment and the community before the construction, these studies include the most significant issues for the affected areas such as emissions, wastes, changes to land use, changes in landscape, health and safety impacts, affected economic activities, impacts on infrastructure, existence of historical and cultural heritage, presence of indigenous communities, and the need to displace local populations.
During operation, grievance mechanisms are also available to ensure that suggestions or complaints are properly recorded and addressed. This allows us not only to solve the complaints but to introduce improvements in our processes. A good example is the way we handle the complaints related to possible interferences with TV signal. We have set a procedure involving the town halls to facilitate and speed up the collection of these complaints as soon as they arise, a proper analysis and communication with the plaintiff and a fast satisfactory resolution.
EDPR has different programs in place to assess and manage the impact on communities, and to maximize the shared value of our projects.
Additional information on the Communities Section of this report and in our website www.edpr.com.
G4 SO3 - TOTAL NUMBER AND PERCENTAGE OF OPERATIONS ASSESSED FOR RISKS RELATED TO CORRUPTION AND THE SIGNIFICANT RISKS IDENTIFIED
EDPR analyses all the new markets were enters operations through a Market overview. This study also evaluates the corruption risk.
EDPR during 2015, implemented an Anti-Bribery Policy of application to all EDPR Group. This Anti-Corruption Policy involves a series of new procedures regarding the relationships of EDPR employees with external parties, namely the approval of certain actions regarding hospitality to and from external parties, charitable donations, and sponsorships.
Additional information on the Whistleblowing Channel and the Ethics Channel can be found at Section 5 Corporate Governance, C. II. Reporting Of Irregularities or visit our ethics information on the corporate governance section, in our website, www.edpr.com. Moreover, additional information is detailed in the Integrity and ethics Section.
G4 SO4 - COMMUNICATION AND TRAINING ON ANTI-CORRUPTION POLICIES AND PROCEDURES
There is a strong commitment by the Company in relation to the dissemination and promotion of compliance with the Code of ethics , which includes Bribery & Corruption section, available to all employees through training, questionnaires, and open discussions of the findings. To this extent, from March to December 2016, EDP offered an online Ethics training (“Ética EDP") available to all employees of both Europe/Brazil and North America. This course achieved a major participation of around 900 EDPR employees.
Anti-Bribery Policy is available at www.edpr.com.

121
MANAGEMENT REPORTEDPR 2016
Additional information on the Whistleblowing Channel and the Ethics Channel can be found at Section 5 Corporate Governance, C. II. Reporting Of Irregularities or visit our ethics information on the corporate governance section, in our website, www.edpr.com. Moreover, additional information is detailed in the Integrity and ethics Section.
G4 SO5 - CONFIRMED INCIDENTS OF CORRUPTION AND ACTIONS TAKEN
EDPR has no knowledge of any corruption-related incidents recorded during 2016.
Moreover, the company has internal procedures to monitor compliance with the Code of Ethics and defines actions to be taken in case of incidents.
Additional information on the Whistleblowing Channel and the Ethics Channel can be found at Section 5 Corporate Governance, C. II. Reporting Of Irregularities or visit our ethics information on the corporate governance section, in our website, www.edpr.com. Moreover, additional information is detailed in the Integrity and ethics Section.
G4 SO6 -TOTAL VALUE OF FINANCIAL AND IN-KIND CONTRIBUTIONS TO POLITICAL PARTIES, POLITICIANS, AND RELATED INSTITUTIONS BY COUNTRY
EDPR made no contributions to political parties in 2016.
G4 SO7 - TOTAL NUMBER OF LEGAL ACTIONS FOR ANTI-COMPETITIVE BEHAVIOUR, ANTI-TRUST, AND MONOPOLY PRACTICES AND THEIR OUTCOMES
EDPR has no knowledge of any legal actions for anti-competitive behavior, anti-trust or monopoly practices recorded during 2016.
G4 SO8 - MONETARY VALUE OF SIGNIFICANT FINES AND TOTAL NUMBER OF NON-MONETARY SANCTIONS FOR NON-COMPLIANCE WITH LAWS AND REGULATIONS During 2016, the company received a total penalty of 382,115 euros. More than half of the amount related to a legislation change that created an overlap of an area designated to public use with the layout of one of our wind farms. The rest is mainly tax- related.
G4 SO9 - PERCENTAGE OF NEW SUPPLIERS THAT WERE SCREENED USING CRITERIA FOR IMPACTS ON SOCIETY
EDPR is governed by a strong sense of ethics and requires that its suppliers do not have conflicts with EDPR ethical standards. In this way, the acceptance of alignment with the spirit of EDPR’s Code of Ethics is required. As part of a supplier qualification process the supplier shall provide a written declaration of acceptance of the principles established in EDPR’s Code of Ethics.
Additionally, the EDP Group and EDPR, has a Procurement Manual, which includes a chapter that guides each Purchasing Department to put sustainability principles into practice. Therefore when procuring and contracting goods and services EDPR appeals to all reasonable endeavors so that selected suppliers accept to comply
EDPR carried out a study to characterize its Supply Chain, including the analysis of the exposure to economic, social and environmental risks.

122
with the UN Global Compact’s ten principles in the areas of human rights, labor, the environment and anti-corruption. Procedures to guarantee this accomplishment are defined.
100% of the EDPR critical suppliers (defined as per EDP formal corporate standard methodology) are aligned with Global Compact criteria and EDPR’s Code of Ethics.
For further information please refer to Suppliers Section.
G4 SO10 - SIGNIFICANT ACTUAL AND POTENTIAL NEGATIVE IMPACTS ON SOCIETY IN THE SUPPLY CHAIN AND ACTIONS TAKEN
In 2015, EDPR carried out a study to characterize its Supply Chain, based on an analysis of the exposure to economic, social and environmental risks. This analysis was performed using ESCHER (Efficient Supply Chain Economic and Environmental Reporting) methodology developed by PwC. For the ESCHER calculation routine PwC used EDP Group 2014 data related to suppliers.
The study allowed EDPR to determine the following results:
More than 20 000* employment associated to EDPR’s Supply Chain More than 735* Million EUR gross value added associated to EDPR’s Supply Chain
Through this study, EDPR aims to identify areas where should focus its improvement activities in order to significantly reduce its exposure to risk and optimize impacts.
Note: Analysis performed by PwC using ESCHER (Efficient Supply Chain Economic and Environmental
Reporting) tool, based on 2014 purchasing data. This study is still representative of EDPR reality and
companies in the sector perform these studies every 2/3 years. Data presented in this chapter resulting from
this study is marked with an *.
Additional information on Suppliers Section.
G4 SO11 - NUMBER OF GRIEVANCES ABOUT IMPACTS ON SOCIETY FILED, ADDRESSED, AND RESOLVED THROUGH FORMAL GRIEVANCE MECHANISMS (G4-27)
EDPR has registered 83 complains during 2016 regarding society impacts. 59 in France related to possible interferences with TV signal and 10 to noise. All of them with related cost corrective actions valuated in EUR 22,276.
Additional information on the Whistleblowing Channel and the Ethics Channel can be found at Section 5 Corporate Governance, C. II. Reporting Of Irregularities or visit our ethics information on the corporate governance section, in our website, www.edpr.com. Moreover, additional information is detailed in the Integrity and ethics Section.
123
MANAGEMENT REPORTEDPR 2016
4.4.4. PRODUCT RESPONSIBILITY
G4 DISCLOUSURE ON MANAGEMENT APPROACH
Our core business and health & safety initiatives are focused on the electricity generation and not in its final consumption.
G4 EU25 - NUMBER OF INJURIES AND FATALITIES TO THE PUBLIC INVOLVING COMPANY ASSETS, INCLUDING LEGAL JUDGMENTS, SETTLEMENTS AND PENDING LEGAL CASES OF DISEASES
During 2016, EDPR did not identify injuries or fatalities to the public involving company assets.

124
4.5. Reporting principles This is the seventh year EDPR publishes an integrated report describing the company’s performance, with respect to the three pillars of sustainability: economic, environmental and social.
Information is presented according to G4 guidelines of the Global Reporting Initiative (GRI) for Sustainability Reporting and provides also information on the additional electricity sector supplement indicators directly related to the company business, which is the power generation from renewable sources, basically wind. A full GRI G4 Content Index for the report can be found in our website www.edpr.com.
UNITED NATIONS GLOBAL COMPACT
Global Compact is an initiative of the United Nations launched in 2000 that defines guideline directives for businesses that opt to contribute to sustainable development. EDPR has become signatory of this initiative and is committed to put these principles into practice, informing society of the progress it has achieved.
In addition, the company has a Code of Ethics that contains specific clauses on the respect for human rights. In compliance with the Code, EDPR expresses its total opposition to forced or compulsory labor and recognizes that human rights should be considered fundamental and universal, based on conventions, treaties and international initiatives like the United Nations Universal Declaration of Human Rights, the International Labor Organization and the Global Compact.
Our Procurement Manual also includes a chapter that guides each Purchasing Department to put these principles into practice, therefore when procuring and contracting goods and services EDPR appeals to all reasonable endeavors so that selected suppliers accept to comply with the UN Global Compact’s ten principles in the areas of human rights, labor, the environment and anti-corruption.
To learn more about the UN Global Compact, please visit www.unglobalcompact.org.
GLOBAL REPORTING INITIATIVE
The GRI guidelines define a set of indicators and recommendations to create a global standard for disclosing information concerning the three sustainability pillars: economic, environmental and social performance. A company’s adherence to these guidelines means that it concurs with the concept and practices of sustainability.
The GRI framework defines a list of principles to help organizations ensure that the content of the report is balanced and accurate. EDPR applied these principles as the basis for the 2016 Management Report.
To learn more about the GRI guidelines, please visit www.globalreporting.org.
GRI COVERAGE
This Management Report follows G4 Guidelines in its accordance with Core Option.
TIMELINESS The information presented in this report
relates to FY2016. EDPR is committed to
report sustainability information at least once
a year. Additionally, sustainability information
is reported in market reports.
COMPLETENESS AND BALANCE
Unless otherwise stated, this report covers all
the company’s subsidiaries and is presented
in a balanced and objective perspective.
STAKEHOLDER INCLUSIVENESS The concerns and the feedback received from
our stakeholders were taken into account
during the report’s creation.
For additional information about our
stakeholders, please refer to The Company
and Stakeholders Section or visit our website.
ACCURACY, CLARITY, COMPARABILITY AND RELIABILITY The information presented follows the GRI
guidelines aim to make information
comparable, traceable, accurate and reliable.
SUSTAINABILITY CONTEXT
This report is placed in the context of the
company strategy to contribute to the
sustainable development of society, whenever
possible.
MATERIALITY
This report includes the relevant information
for the company’s stakeholders, as derived
from the materiality studies performed.

16