24
AFA PROTECTIVE SYSTEMS, INC. 2016 ANNUAL REPORT

AFA PROTECTIVE SYSTEMS, INC.
2 0 1 6 A N N UA L R E P O R T

AFA’s Central Station service consists of a detecting system installed in subscribers’
premises and frequently owned, serviced, monitored, inspected and maintained by AFA.
The vast majority of signals from subscribers’ premises are transmitted to AFA’s Central
Stations via subscribers’ telephone lines, GSM cellular networks or over the Internet. AFA presently
operates redundant UL Listed and FM Approved state-of-the-art computerized Central Stations
servicing the United States. Our Central Stations operate twenty-four hours a day, seven days
a week and monitor AFA subscriber locations, as well as locations for customers of approximately
104 Alarm Dealers who do not have their own central stations. Upon receipt of an alarm signal,
AFA personnel take the appropriate action, which may include alerting Fire or Police Departments,
verifying an alarm condition, notifying its subscribers, and dispatching AFA personnel or other
response agents to the protected premises.
Corpor ate profile
Originally founded in 1873, AFA has provided uninterrupted central station alarm service to its customers
for longer than anyone in the industry.

•Fire detection systems;
•Burglar and vandalism protection;
•Monitoring of subscriber-owned systems;
•Access control systems;
•Smoke detection;
•Installation, maintenance and testing of high-rise life safety systems;
•Sprinkler alarm supervision;
•Elevator alarm supervision;
•Closed circuit TV (CCTV) systems;
•Remote video surveillance;
•Video verification of alarm;
•Industrial process supervision, including temperature;
•Sump pump and air conditioning supervision;
•Flood detection;
•Boiler supervision;
•Remote access to and control of alarm system;
•Investigator response.
The majority of the Company’s revenues comes from the sale and installation of specialized alarm systems including sophisticated high-rise fire and life safety systems which the Company designs and installs to meet proliferating fire and life safety codes. The Company is also a provider of video surveillance systems and intrusion related services whereby customers can remotely view and control their own systems.
AFA does not manufacture detecting equipment. Technology continues to change rapidly and new equipment is so readily available that AFA can better meet subscribers’ needs by selecting quality products available from the industry’s top suppliers.
AFA’s core revenues include the recurring annual service fees paid by customers for Central Station monitoring, inspection and maintenance services.
1
the primary sCope of afa’s serviCes inCludes:
In 2016, the Company made some positive strides shifting its focus more towards emphasizing recurring revenue projects and eschewing low margin outright sales opportunities. Despite this welcome shift, our year-to-year earnings did not improve. This can be attributed to two primary factors. First, as this shift was taking place throughout the year, the actual sales made were not fully installed and hence not realized in 2016. Second, the ongoing burden of rising healthcare costs continued to weigh heavily on earnings. Still the good news, including higher quantity and quality sales, low attrition, and our first growth in recurring revenue in three years, provided us with a solid base with which to move forward.
Net income in 2016 amounted to $326,000 or $2.01 per share as compared to $538,000 or $3.32 per share in 2015. Cash flow from operating activities in 2016 amounted to $756,000 or $4.67 per share as compared to $5,336,000 or $32.98 per share in 2015. This disparity between the years in cash flow from operations was caused primarily from changes in certain working capital accounts. Overall revenues fell slightly from the prior year: $75,030,000 in 2016 as compared to $76,355,000 in 2015.
Once again, the Company’s gross attrition rate was among the industry’s best, coming in at 8.0%. As with the prior year, this result was adversely affected by two losses in the National Accounts Division. These two accounts represented a quarter of the overall attrition, meaning the rate of attrition in our core business was outstanding. Meanwhile, new sales bookings increased to $38,840,000, highlighted by a 20% increase in sales of new recurring revenues. These factors weighed heavily in the Company’s $561,000 growth in annual recurring revenue during the year. Moreover, our year-end backlog rose to an all-time high of $15,490,000, almost 10% higher than at the end of 2015. Taken together, these factors all point to a solid base entering 2017.
Our National Accounts Division had a very good year. Moving further away from its former reliance on one major account, 2016 saw this Division achieve its highest amount ever of gross sales outside of that account, including its highest amount ever of recurring revenue sales. Although we did lose two chain accounts, these were more than offset by new accounts and
additional services sold to existing accounts during the year, turning 2016 into one of the Division’s best years ever.
The Northern branches continued to carry the Company in 2016. The flagship New York branch had a spectacular year. The branch exceeded expectations in every important metric, including new booked sales, earnings and an all-time best 4.2% gross attrition rate.
The New England branch also came through with positive results, posting double-digit increases in sales, earnings and recurring revenue growth.
So far in 2017, the Northeast branches are continuing their stellar performance.
Results in our middle section branches were fair. Both New Jersey branches and our Mid-Atlantic office continued to be positive contributors, although not as strong as in the prior year. We are aware that this region should be performing better and are working with local management to get these branches’ operating results more on an upward trajectory rather than a holding pattern.
The Southern branches continued to depress the overall Company results. The Georgia office, beset by huge costs and low margins, underwent a substantial transformation during the year. During the first six months of 2016, we restructured the branch to eliminate a large portion of the outright sale infrastructure which generated low margin business. In its place we installed personnel dedicated to generating more recurring revenue. The fact that these infrastructure changes took place throughout the year meant their benefits were not realized for the entire period. The result was that the office generated a loss for the year and a deep dip in sales. However, recurring revenue held constant throughout the year and we expect the changes we made to have a positive impact in 2017.
Similarly, the Florida branch was a victim of carryover low margin sales that resulted in an operating loss. While we corrected this going forward in the middle of the year, it was too late to translate into a profitable year. Based on our current structure there, we expect the branch to be marginally profitable in 2017.
2
AFA Protective Systems, Inc. and Subsidiaries letter to our shareholders

The North Carolina branch, streamlined in the prior year and no longer encumbered by low margin sales, was finally able to generate an operating profit.
Consistent with my message last year, we followed through on our initiatives to complement our Company-wide focus to improve margins and grow recurring revenue. In 2016, our gross margin on all sales improved slightly. I note that this result was encumbered by some sales made during previous periods when our low margin sales were not as restricted. Going forward, we expect this metric to further improve. As previously noted, our recurring revenue base enjoyed noticeable organic growth during the year. This was partly attributable to a revised commission plan we installed for our sales representatives that increased incentives for recurring revenue-based sales. At the end of 2016, we decided to take this approach to a new level and incentivize sales of recurring revenue even further. Our sales representatives have responded and consequently our recurring revenue base has grown in the first quarter of 2017 by an additional $420,000. We are hopeful that the benefits many of our sales representatives have realized under these new initiatives will be contagious and encourage all of our representatives to promote these types of sales which are the most beneficial to the Company.
One negative trend that has taken hold over the past couple of years is the increasing commoditization of alarm services, especially by large accounts and in particular of monitoring services. Procurement departments in large organizations have come under increasing pressure to cut costs and in doing so have concentrated strictly on their base contract costs, without regard to additional expenses and aggravation others in their organizations inevitably incur when dealing with low cost and less service conscious competitors. While we strive to educate our existing customer base and prospects as to the advantages of dealing with our Company—a reliable full service provider that has been in business for nearly a century and a half—the fact remains that for the time being, some shortsighted procurers would rather save a few dollars for their own departments while causing others within their organizations to suffer consequential additional expenses far outweighing those “savings.” It is incumbent upon us and our legitimate competitors to try and educate upper management in these organizations for their
own benefit as well as ours. At this point in time it is too early to tell how significant this trend will become or how long it will last. However, one thing for sure is that pricing in the large National Account arena has become more important than ever.
While our sales focus and results are going in the right direction, we still have obstacles on the cost side that impinge upon our earnings ability. By far the most serious issue on the cost side is the universal problem of rising health care costs. In 2016, the Company’s net cost of providing health care benefits for its employees amounted to 7% of its total revenues. This is simply too high for the Company to absorb at the present time and still generate acceptable earnings. We have diligently explored all avenues for controlling costs while providing our employees and their families the best possible coverage at a reasonable cost to both the Company and the employees. We are monitoring our experience this year and will react accordingly to bring this metric to an acceptable level.
Right now is an exciting time at the Company. The heightened emphasis on recurring revenue has energized everyone within, as all of our employees recognize the importance that metric holds for the Company’s as well as their own well-being. As we continue to grow that base it should translate into better earnings and cash flow for many years to come.
Robert D. KleinmanChairman and Chief Executive Officer
3
December 31, 2016 2015ASSetS
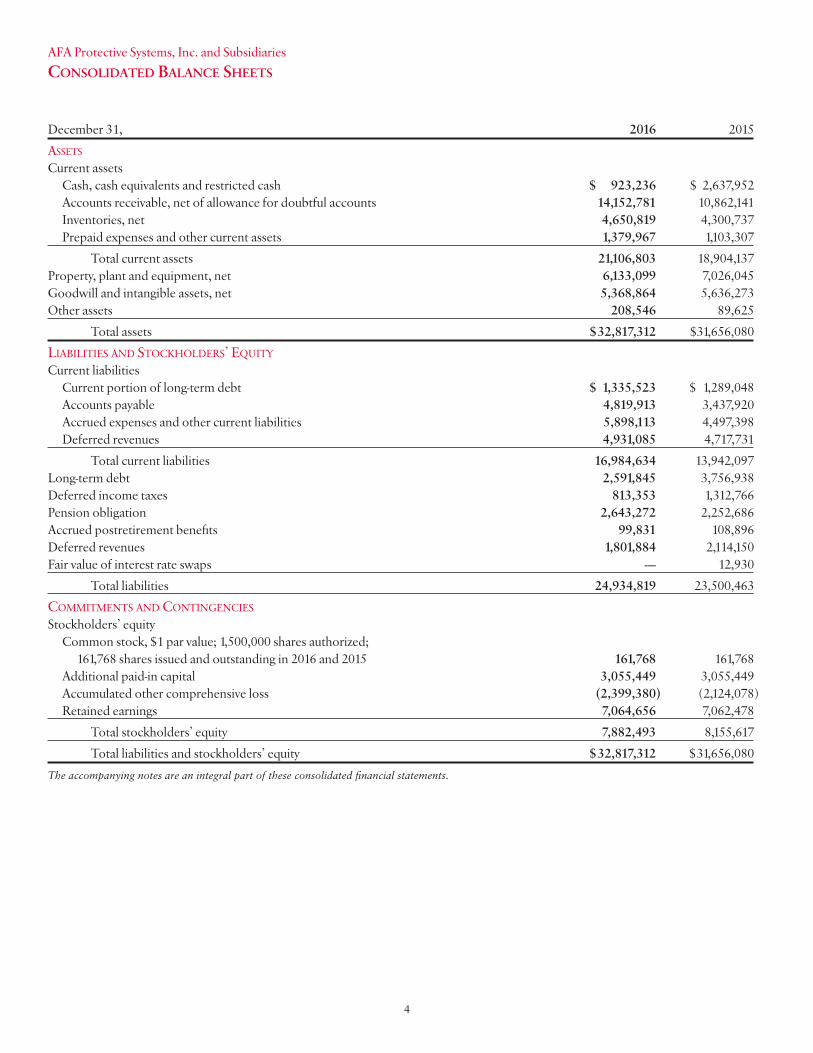
Current assets Cash, cash equivalents and restricted cash $ 923,236 $ 2,637,952 Accounts receivable, net of allowance for doubtful accounts 14,152,781 10,862,141 Inventories, net 4,650,819 4,300,737 Prepaid expenses and other current assets 1,379,967 1,103,307 Total current assets 21,106,803 18,904,137 Property, plant and equipment, net 6,133,099 7,026,045 Goodwill and intangible assets, net 5,368,864 5,636,273 Other assets 208,546 89,625 Total assets $32,817,312 $31,656,080 LiAbiLitieS And StockhoLderS’ equityCurrent liabilities Current portion of long-term debt $ 1,335,523 $ 1,289,048 Accounts payable 4,819,913 3,437,920 Accrued expenses and other current liabilities 5,898,113 4,497,398 Deferred revenues 4,931,085 4,717,731 Total current liabilities 16,984,634 13,942,097 Long-term debt 2,591,845 3,756,938 Deferred income taxes 813,353 1,312,766 Pension obligation 2,643,272 2,252,686 Accrued postretirement benefits 99,831 108,896 Deferred revenues 1,801,884 2,114,150 Fair value of interest rate swaps ‑— 12,930 Total liabilities 24,934,819 23,500,463 commitmentS And contingencieSStockholders’ equity Common stock, $1 par value; 1,500,000 shares authorized; 161,768 shares issued and outstanding in 2016 and 2015 161,768 161,768 Additional paid-in capital 3,055,449 3,055,449 Accumulated other comprehensive loss (2,399,380) (2,124,078) Retained earnings 7,064,656 7,062,478 Total stockholders’ equity 7,882,493 8,155,617 Total liabilities and stockholders’ equity $32,817,312 $31,656,080 The accompanying notes are an integral part of these consolidated financial statements.
4
AFA Protective Systems, Inc. and Subsidiaries Consolidated BalanCe sheets

Years Ended December 31, 2016 2015Revenues Sales $ 43,372,292 $ 45,337,695 Service 31,657,893 31,016,879 75,030,185 76,354,574 Costs and expenses Cost of sales 32,339,768 33,897,732 Cost of services, exclusive of depreciation and amortization 21,069,967 20,623,227 Depreciation and amortization 2,188,854 2,238,354 Selling, general, and administrative 18,744,862 18,506,852 74,343,451 75,266,165 Income from operations 686,734 1,088,409 Interest and dividend income 139,291 106,049 Interest expense (153,311) (175,713) Income before provision for income taxes 672,714 1,018,745 Provision for income taxes 347,000 481,000 Net income $ 325,714 $ 537,745 Earnings per share $ 2.01 $ 3.32 Weighted average number of shares outstanding 161,768 161,768 Dividends per share $ 2.00 $ 2.00 Comprehensive income Net income $ 325,714 $ 537,745 Unrealized gain (loss) on minimum pension and postretirement liability, net of taxes (284,304) 25,506 Interest rate swap, net of taxes 9,002 3,064 Comprehensive income $ 50,412 $ 566,315 The accompanying notes are an integral part of these consolidated financial statements.
5
AFA Protective Systems, Inc. and Subsidiaries Consolidated statements of inCome and Comprehensive inCome

Accumulated Additional Other Number of Common Paid-in Comprehensive Retained Shares Stock Capital Loss Earnings TotalBalances at December 31, 2014 161,868 $161,868 $ 3,055,349 $ (2,152,648) $ 6,848,318 $ 7,912,887 Net income — — — — 537,745 537,745 Cash dividends — — — — (323,585) (323,585) Purchase and retirement of common stock (100) (100) 100 — — —Unrealized gain (loss) on minimum pension and postretirement liability, net — — — 25,506 — 25,506Interest rate swap, net — — — 3,064 — 3,064 Balances at December 31, 2015 161,768 161,768 3,055,449 (2,124,078) 7,062,478 8,155,617 Net income — — — — 325,714 325,714 Cash dividends — — — — (323,536) (323,536)Unrealized gain (loss) on minimum pension and postretirement liability, net — — — (284,304) — (284,304)Interest rate swap, net — — — 9,002 — 9,002 Balances at December 31, 2016 161,768 $161,768 $3,055,449 $(2,399,380) $7,064,656 $7,882,493 The accompanying notes are an integral part of these consolidated financial statements.
6
AFA Protective Systems, Inc. and Subsidiaries Consolidated statements of stoCkholders’ equityYears Ended December 31, 2016 and 2015
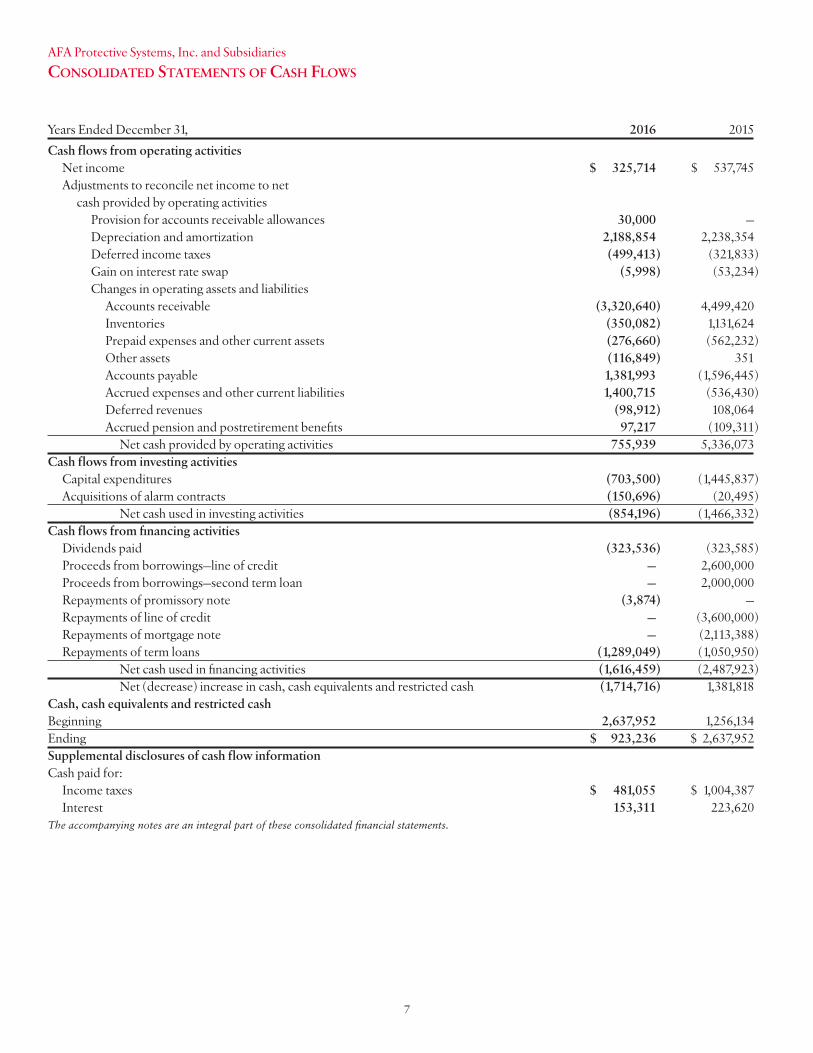
Years Ended December 31, 2016 2015Cash flows from operating activities Net income $ 325,714 $ 537,745 Adjustments to reconcile net income to net cash provided by operating activities Provision for accounts receivable allowances 30,000 — Depreciation and amortization 2,188,854 2,238,354 Deferred income taxes (499,413) (321,833) Gain on interest rate swap (5,998) (53,234) Changes in operating assets and liabilities Accounts receivable (3,320,640) 4,499,420 Inventories (350,082) 1,131,624 Prepaid expenses and other current assets (276,660) (562,232) Other assets (116,849) 351 Accounts payable 1,381,993 (1,596,445) Accrued expenses and other current liabilities 1,400,715 (536,430) Deferred revenues (98,912) 108,064 Accrued pension and postretirement benefits 97,217 (109,311) Net cash provided by operating activities 755,939 5,336,073 Cash flows from investing activities Capital expenditures (703,500) (1,445,837) Acquisitions of alarm contracts (150,696) (20,495) Net cash used in investing activities (854,196) (1,466,332)Cash flows from financing activities Dividends paid (323,536) (323,585) Proceeds from borrowings—line of credit — 2,600,000 Proceeds from borrowings—second term loan — 2,000,000 Repayments of promissory note (3,874) — Repayments of line of credit — (3,600,000) Repayments of mortgage note — (2,113,388) Repayments of term loans (1,289,049) (1,050,950) Net cash used in financing activities (1,616,459) (2,487,923) Net (decrease) increase in cash, cash equivalents and restricted cash (1,714,716) 1,381,818 Cash, cash equivalents and restricted cash Beginning 2,637,952 1,256,134 Ending $ 923,236 $ 2,637,952 Supplemental disclosures of cash flow information Cash paid for: Income taxes $ 481,055 $ 1,004,387 Interest 153,311 223,620The accompanying notes are an integral part of these consolidated financial statements.
7
AFA Protective Systems, Inc. and Subsidiaries Consolidated statements of Cash flows

1. organization and Basis of presentationDescription of the Business
AFA Protective Systems, Inc. and Subsidiaries (the “Company”) is engaged in the installation, operation, maintenance and sale of protective systems to safeguard life and property from a variety of hazards. Operations are conducted primarily in the eastern United States.
Basis of PresentationThe financial statements include the accounts of AFA Protective
Systems, Inc. and its subsidiaries, all of which are wholly owned. All intercompany balances and transactions have been eliminated in consolidation.
Organizational Changes In November 2016, the Company acquired certain assets,
primarily customer alarm maintenance and monitoring contracts, of Pro-Tech Security Ltd. for $325,000 funded through an initial $100,000 payment, customer payments of $50,696, and the balance in the form of a promissory note (see Note 6). The purchase price was allocated primarily to alarm contract intangibles and is being amortized over five years.
2. summary of signifiCant aCCounting poliCiesUse of Estimates
The preparation of financial statements in conformity with accounting principles generally accepted in the United States of America requires management to make estimates and assumptions that affect the reported amounts of assets, liabilities, and disclosure of contingent assets and liabilities at the date of the financial statements, and the reported amounts of revenue and expenses during the reporting period. Actual results could differ from those estimates. Significant estimates include accounting for long-term contracts, the allowance for doubtful accounts, inventory obsolescence, intangible assets, certain accruals, pension and postretirement benefits and income taxes.
Cash, Cash Equivalents and Restricted CashCash, cash equivalents and restricted cash include short-
term investments with original maturities of 90 days or less. At December 31, 2015, cash and cash equivalents included money market funds of $86,839. Cash and cash equivalents held at financial institutions may at times exceed federally insured amounts. Restricted cash is comprised of cash withheld from employees to fund flexible spending accounts that are maintained for the employee healthcare plan. The Company believes it mitigates its risks by investing in or through major financial institutions.
Accounts ReceivableAccounts receivable are carried at original invoice amounts
less an estimate made for uncollectible receivables based on a review of all outstanding amounts on a regular basis. Management determines the allowance for doubtful accounts by regularly evaluating individual customer receivables and considering a customer’s financial condition, credit history and current economic conditions. Accounts receivable are written off when deemed uncollectible. Recoveries of accounts receivable previously written off are recorded when received.
InventoriesInventories consist of finished goods, work in progress and
parts which are carried at the lower of cost (on a first-in, first-out basis) or market. Inventory reserves, which are charged to cost of sales, are established for slow moving, excess and obsolete stock on hand and are re-evaluated periodically to give effect to sales results and changing market conditions.
Property, Plant and EquipmentProperty, plant and equipment are recorded at their historical
cost and depreciated over their estimated useful lives, which range from 3 to 30 years. Maintenance and repairs are charged to expense as incurred; renewals and improvements that extend the life of the asset are capitalized. Upon retirement or sale, the asset cost and related accumulated depreciation are eliminated from the respective accounts and the resulting gains or loss, if any, is included in the results of operations for the year. Leasehold improvements are amortized over the shorter of the lease term or remaining useful life of the related assets.
Central station equipment, equipment in subscribers’ premises and other equipment are depreciated primarily by accelerated methods. The straight-line method is used for buildings and leasehold improvements. For income tax purposes, installation costs are deducted as incurred and accelerated methods and rates are used for all other assets.
Long‑Lived AssetsLong-lived assets are reviewed for impairment whenever events
or changes in business circumstances indicate the carrying value of the assets may not be recoverable. In reviewing for impairment, the Company compares the carrying value of the assets to the estimated undiscounted future cash flows expected from the use of the assets and their eventual disposition. When the estimated undiscounted future cash flows are less than their carrying amount, an impairment loss is recognized equal to the difference between the assets’ fair value and its carrying amount. The Company believes the future cash flows to be received from its long-lived assets exceed the assets’ carrying value, and accordingly, the Company has not recognized any impairment losses for the years ended December 31, 2016 and 2015.
8
AFA Protective Systems, Inc. and Subsidiaries notes to Consolidated finanCial statements
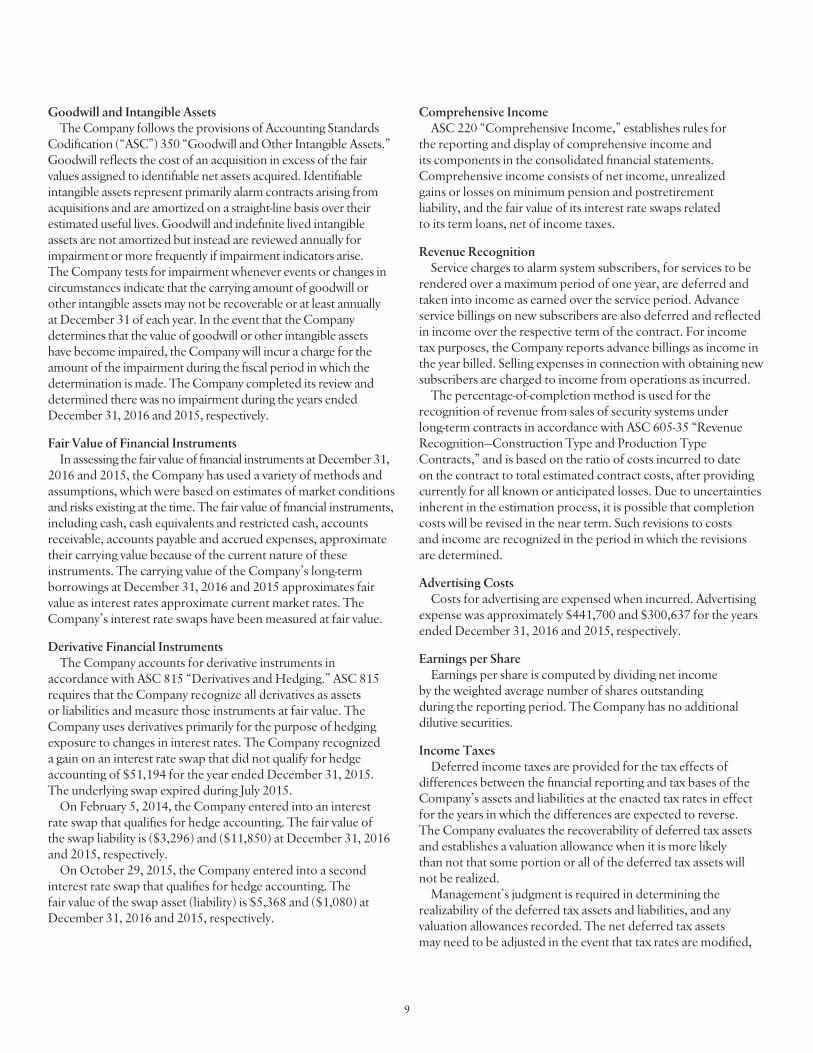
Goodwill and Intangible AssetsThe Company follows the provisions of Accounting Standards
Codification (“ASC”) 350 “Goodwill and Other Intangible Assets.” Goodwill reflects the cost of an acquisition in excess of the fair values assigned to identifiable net assets acquired. Identifiable intangible assets represent primarily alarm contracts arising from acquisitions and are amortized on a straight-line basis over their estimated useful lives. Goodwill and indefinite lived intangible assets are not amortized but instead are reviewed annually for impairment or more frequently if impairment indicators arise. The Company tests for impairment whenever events or changes in circumstances indicate that the carrying amount of goodwill or other intangible assets may not be recoverable or at least annually at December 31 of each year. In the event that the Company determines that the value of goodwill or other intangible assets have become impaired, the Company will incur a charge for the amount of the impairment during the fiscal period in which the determination is made. The Company completed its review and determined there was no impairment during the years ended December 31, 2016 and 2015, respectively.
Fair Value of Financial InstrumentsIn assessing the fair value of financial instruments at December 31,
2016 and 2015, the Company has used a variety of methods and assumptions, which were based on estimates of market conditions and risks existing at the time. The fair value of financial instruments, including cash, cash equivalents and restricted cash, accounts receivable, accounts payable and accrued expenses, approximate their carrying value because of the current nature of these instruments. The carrying value of the Company’s long-term borrowings at December 31, 2016 and 2015 approximates fair value as interest rates approximate current market rates. The Company’s interest rate swaps have been measured at fair value.
Derivative Financial InstrumentsThe Company accounts for derivative instruments in
accordance with ASC 815 “Derivatives and Hedging.” ASC 815 requires that the Company recognize all derivatives as assets or liabilities and measure those instruments at fair value. The Company uses derivatives primarily for the purpose of hedging exposure to changes in interest rates. The Company recognized a gain on an interest rate swap that did not qualify for hedge accounting of $51,194 for the year ended December 31, 2015. The underlying swap expired during July 2015.
On February 5, 2014, the Company entered into an interest rate swap that qualifies for hedge accounting. The fair value of the swap liability is ($3,296) and ($11,850) at December 31, 2016 and 2015, respectively.
On October 29, 2015, the Company entered into a second interest rate swap that qualifies for hedge accounting. The fair value of the swap asset (liability) is $5,368 and ($1,080) at December 31, 2016 and 2015, respectively.
Comprehensive IncomeASC 220 “Comprehensive Income,” establishes rules for
the reporting and display of comprehensive income and its components in the consolidated financial statements. Comprehensive income consists of net income, unrealized gains or losses on minimum pension and postretirement liability, and the fair value of its interest rate swaps related to its term loans, net of income taxes.
Revenue RecognitionService charges to alarm system subscribers, for services to be
rendered over a maximum period of one year, are deferred and taken into income as earned over the service period. Advance service billings on new subscribers are also deferred and reflected in income over the respective term of the contract. For income tax purposes, the Company reports advance billings as income in the year billed. Selling expenses in connection with obtaining new subscribers are charged to income from operations as incurred.
The percentage-of-completion method is used for the recognition of revenue from sales of security systems under long-term contracts in accordance with ASC 605-35 “Revenue Recognition—Construction Type and Production Type Contracts,” and is based on the ratio of costs incurred to date on the contract to total estimated contract costs, after providing currently for all known or anticipated losses. Due to uncertainties inherent in the estimation process, it is possible that completion costs will be revised in the near term. Such revisions to costs and income are recognized in the period in which the revisions are determined.
Advertising CostsCosts for advertising are expensed when incurred. Advertising
expense was approximately $441,700 and $300,637 for the years ended December 31, 2016 and 2015, respectively.
Earnings per ShareEarnings per share is computed by dividing net income
by the weighted average number of shares outstanding during the reporting period. The Company has no additional dilutive securities.
Income Taxes Deferred income taxes are provided for the tax effects of differences between the financial reporting and tax bases of the Company’s assets and liabilities at the enacted tax rates in effect for the years in which the differences are expected to reverse. The Company evaluates the recoverability of deferred tax assets and establishes a valuation allowance when it is more likely than not that some portion or all of the deferred tax assets will not be realized. Management’s judgment is required in determining the realizability of the deferred tax assets and liabilities, and any valuation allowances recorded. The net deferred tax assets may need to be adjusted in the event that tax rates are modified,
9

or management’s estimates of future taxable income change, such that deferred tax assets or liabilities are expected to be recovered or settled at a different tax rate than currently estimated. In addition, valuation allowances may need to be adjusted in the event that management’s estimate of future taxable income changes from the amounts currently estimated. The Company recognizes tax liabilities when, despite the Company’s belief that its tax return positions are supportable, the Company believes that certain positions may not be fully sustained upon review by tax authorities. Benefits from tax positions are measured at the largest amount of benefit that is greater than 50 percent likely of being realized upon settlement. To the extent that the final tax outcome of these matters is different than the amounts recorded, such differences impact income tax expense in the period in which such determination is made. Interest and penalties, if any, related to accrued liabilities for tax positions are included in interest expense.
Concentration of Credit RiskFinancial instruments, which potentially subject the Company
to concentrations of credit risk, are primarily trade accounts receivable. Customers in the commercial real estate industry, principally commercial building properties, account for a substantial portion of trade receivables. Credit risk with respect to trade receivables is generally minimized due to the large corporations and other organizations the Company services. Accounts receivable due from a major customer amounted to $1,707,909 and $1,054,119 at December 31, 2016 and 2015, respectively. Billings to this customer amounted to $6,547,943 and $8,087,369 for the years ended December 31, 2016 and 2015, respectively.
Subsequent EventsThe Company evaluated all events or transactions that
occurred through April 12, 2017, the date these consolidated financial statements were available to be issued. The Company did not identify any other subsequent events that would have required adjustment for further disclosure in these consolidated financial statements.
3. aCCounts reCeivaBle, netAccounts receivable consists of the following:
December 31, 2016 2015Trade receivables, including progress bills and amounts due on completed contracts $12,351,293 $ 9,649,081 Costs and estimated earnings in excess of billings on uncompleted contracts 1,981,488 1,363,060 14,332,781 11,012,141 Less: Allowance for doubtful accounts (180,000) (150,000) $14,152,781 $10,862,141
Cost and estimated earnings on uncompleted contracts and related amounts billed were as follows:
December 31, 2016 2015Costs incurred on uncompleted contracts $ 6,789,823 $ 4,064,118 Estimated earnings 2,159,614 1,249,558 8,949,437 5,313,676 Less: Billings to date (7,244,789) (4,180,091) 1,704,648 1,133,585 Costs and estimated earnings in excess of billings (included in accounts receivable) (1,981,488) (1,363,060)Billings in excess of costs (included in accrued expenses and other current liabilities) $ (276,840) $ (229,475)
Costs and estimated earnings in excess of billings on uncompleted contracts arise in the consolidated balance sheets when revenues have been recognized but the amounts cannot be billed under the terms of the contracts. Such amounts are recoverable from customers based upon various measures of performance, including achievement of certain milestones or completion of the contract. Substantially all amounts recorded as costs and estimated earnings in excess of billings on uncompleted contracts at December 31, 2016, are expected to be billed and collected within one year.
10
AFA Protective Systems, Inc. and Subsidiaries notes to Consolidated finanCial statements (continued)

4. property, plant and equipment, netProperty, plant and equipment, net consists of the following:
Estimated December 31, Lives 2016 2015Land $ 242,000 $ 242,000 Buildings 30 4,679,235 4,679,235 Equipment in subscribers’ premises 10-25 10,818,948 11,905,801 Central station and other equipment 3-10 3,476,072 3,652,029 Installations in progress * 154,008 481,205 19,370,263 20,960,270 Less: Accumulated depreciation (13,237,164) (13,934,225) $ 6,133,099 $ 7,026,045
* Depreciation expense commences once equipment is fully installed and operational.
Depreciation expense was $1,596,445 and $1,644,843 for the years ended December 31, 2016 and 2015, respectively.
5. goodwill and intangiBle assets, netGoodwill and intangible assets, net consists of the following:
Estimated December 31, Lives 2016 2015Goodwill — $ 441,301 $ 441,301 Alarm contracts and contract intangibles 4-15 years 7,297,536 7,005,035 Non compete and other agreements 5 years 119,344 86,845 Gross goodwill and intangibles 7,858,181 7,533,181 Less: Accumulated depreciation (2,489,317) (1,896,908) $ 5,368,864 $ 5,636,273
Amortization of intangible assets was $592,409 and $582,704 during the years ended December 31, 2016 and 2015, respectively. Future estimated amortization expense is as follows as of December 31, 2016:
Years ending December 31,2017 $ 636,274 2018 628,778 2019 628,688 2020 506,323 2021 407,500 Thereafter 2,120,000 $4,927,563
6. long-term deBtLong-term debt consists of the following:
December 31, 2016 2015Term loan $ 2,090,271 $ 3,093,605 Second term loan 1,666,667 1,952,381 Promissory note 170,430 — 3,927,368 5,045,986 Less: Current portion (1,335,523) (1,289,048) $ 2,591,845 $ 3,756,938
On December 1, 2010, the Company obtained a $5,500,000 five-year term loan from its primary bank collateralized by a blanket U.C.C. filing against its assets. On January 31, 2014, the Company refinanced its term loan combining outstanding advances of $3,000,000 on its working capital line of credit with the balance due on its term loan. The new $5,108,307 five-year term loan maintains the same terms and conditions as the loan it superseded, with repayment to be made in monthly principal installments of $83,611 with an interest rate of LIBOR plus 1.75%. In connection with the refinanced term loan, the Company entered into a new interest rate swap to fix its interest rate at 2.98% over the life of the term loan. The interest rate swap matures in 2019. The Company’s bank debt has been classified in accordance with the new financing terms.
On October 26, 2015, the Company obtained a second term loan combining outstanding advances of $1,400,000 on its working capital line of credit and $600,000 of additional borrowings. The new $2,000,000 five-year term loan maintains the same terms and conditions as the other existing term loan, with repayment to be made in monthly principal installments of $23,809 with an interest rate of LIBOR plus 1.75%. In connection with the second term loan, the Company entered into a new interest rate swap to fix its interest rate at 3.12% over the life of the term loan. The interest rate swap matures in 2020. The Company’s bank debt has been classified in accordance with the new financing terms.
The term loan agreements contain various restrictive covenants which include, but are not limited to, maintenance of certain income to debt service ratios and certain adjusted earnings requirements, as defined. During 2016, the Company obtained waivers from its lender for not meeting certain financial ratios. In connection with the waivers, the term loan agreements were amended on December 31, 2016 to revise certain financial ratios.
During October 2015, in conjunction with the new term loan, the Company increased its available working capital line of credit with its primary bank from $3,600,000 to $5,600,000. The line of credit is collateralized by a blanket U.C.C. filing against its assets and expires July 31, 2017. Interest is payable at the Prime Rate. Use of the funds are unrestricted. As of December 31, 2016, the Company had no outstanding advances against its line of credit.
11

In November 2016, the Company acquired certain assets, primarily customer alarm maintenance and monitoring contracts, of Pro-Tech Security Ltd. for $325,000 of which $174,341 was in the form of a promissory note to the seller, with repayment to be made in 45 monthly principal installments of $3,874.
Future maturities of long-term debt are as follows: Years ending December 31,2017 $1,335,523 2018 1,335,523 2019 415,806 2020 840,516 $3,927,368
12
AFA Protective Systems, Inc. and Subsidiaries notes to Consolidated finanCial statements (continued)
8. Common stoCkIssuance of Employee Stock Appreciation Rights
The Company issued stock appreciation rights to certain employees in January 2013 and 2007 which will be payable only upon sale of the Company or change in its control, as defined. Since the sale of the Company or change in its control, as defined, are contingent events, no compensation expense will be recorded until such events are probable.
9. inCome taxesComponents of the provision for income taxes are as follows:
December 31, 2016 2015CurrentFederal $ 520,165 $ 666,539 State and local 142,712 155,338 662,877 821,877 DeferredFederal (268,934) (296,034)State and local (46,943) (44,843) (315,877) (340,877) $ 347,000 $ 481,000
7. deferred revenuesDeferred revenues consist of annual service and other charges and advance service charges. Annual service and other charges represent
customer billings for services not yet rendered for which the maximum billing period is one year and have been reflected as a current liability. Advance service charges consist of charges billed to customers at the time of new installations. The portion of these charges expected to be recognized within one year has been classified as current on the consolidated balance sheets at December 31, 2016 and 2015. An analysis of deferred revenues is as follows: Annual Service Advance and Other Service Charges Charges TotalBalances at December 31, 2014 $ 3,706,183 $ 3,017,634 $ 6,723,817 Billings 29,841,695 1,283,248 31,124,943 Amortizations to income (29,897,647) (1,119,232) (31,016,879)Balances at December 31, 2015 3,650,231 3,181,650 6,831,881 Billings 30,680,626 878,354 31,558,980 Amortizations to income (30,462,172) (1,195,720) (31,657,892)Balances at December 31, 2016 $ 3,868,685 $2,864,284 $ 6,732,969

13
A reconciliation of the federal statutory rate and the Company’s effective tax rate follows: 2016 2015Federal statutory rate 34.0% 34.0%State and local income taxes, net of federal income tax benefit 8.6 7.2Other items 9.0 6.0 Effective rate 51.6% 47.2%
The effective tax rate differed from the federal statutory tax rate primarily as result of state income taxes, tax credits and certain expenses not deductible for income tax purposes.
The tax effects of the significant temporary differences which comprise the deferred tax assets and liabilities at December 31 are as follows:
December 31, 2016 2015Deferred Tax AssetsAdvance service revenue $ 1,249,200 $ 1,371,700 Benefit plans 1,110,432 957,896 Other 211,000 101,600 Deferred tax assets 2,570,632 2,431,196 Deferred Tax LiabilitiesIntangibles (1,212,185) (1,373,062)Depreciation (2,071,700) (2,266,800)Other (100,100) (104,100) Net deferred tax liabilities $ (813,353) $(1,312,766)
Liabilities for uncertain tax positions reflected as of December 31, 2016 are not significant and it is not anticipated that they will materially change in the next 12 months. With limited exceptions, the Company is no longer subjected to tax audits by taxing authorities for years through 2012 for all jurisdictions. Although the outcome of tax audits is always uncertain, the Company believes that its tax positions will generally be sustained under audit.
Interest expense and penalties related to income tax matters are recognized as a component of interest expense. For the years ended December 31, 2016 and 2015, the Company did not record any liabilities or expenses related to tax penalties and related interest.
10. pension and postretirement BenefitsThe Company maintains a noncontributory defined benefit
pension plan for its hourly union employees who meet certain requirements of age, length of service and hours worked per year. The benefits provided are based upon years of service and the employee’s compensation during the last five years of employment. The Company’s funding policy is to contribute annually at least the minimum amount required by Federal regulations. Effective October 15, 1996, the collective bargaining agreement covering the New York/New Jersey union employees was terminated following a strike, which resulted in a workforce reduction. Accordingly, the plan was amended effective December 31, 1996, to eliminate benefit accruals for the remaining New York/New Jersey employees. Effective January 1, 1997, the plan was further amended to provide those participants whose benefits were frozen due to the termination of the union agreement, to have their benefits determined using the method applicable for early retirement if they continue in service until then. In conjunction with the Company’s collective bargaining agreement effective August 1, 2007 covering its Massachusetts union employees effective February 1, 2008, the plan was amended to eliminate benefit accruals for the Massachusetts employees, and new employees are no longer eligible to enter the plan.
The Company provides certain health care and life insurance benefits to retired employees who have attained age 62 or 20 years of service at the date of retirement, whichever is later. Eligible retirees under age 65 are covered by the Company’s health insurance plan, at a cost to the retiree equal to the Company’s cost for an active employee. After attaining age 65, an eligible retiree’s health care benefit coverage becomes coordinated with Medicare, with the retiree paying a portion of the cost of the coverage in excess of certain amounts. Effective December 31, 1996, the Company eliminated future benefits for employees who had not already retired or had given notice of retirement at that date. The Company’s funding policy is generally to pay covered expenses as they are incurred.

14
AFA Protective Systems, Inc. and Subsidiaries notes to Consolidated finanCial statements (continued)
The following is a reconciliation of the benefit obligation, fair value of plan assets and funded status of the Company’s defined benefit and other postretirement benefit plans measured at December 31, 2016 and 2015, respectively: Other Pension Benefits Postretirement Benefits 2016 2015 2016 2015Change in Benefit ObligationBenefit obligation at beginning of year $8,507,953 $8,556,425 $125,596 $ 231,356 Service cost — — — —Interest cost 355,059 335,133 3,916 7,132 Change in assumptions 237,377 (387,368) 391 (85,822)Actuarial loss (gain) 366,007 293,320 2,701 (12,025)Benefits paid (349,902) (289,557) (17,273) (15,045)Benefit obligation at end of year 9,116,494 8,507,953 115,331 125,596 Change in Plan AssetsFair value of plan assets at beginning of year 6,255,267 6,267,582 — —Actual return on plan assets 267,857 (22,758) — — Employer contribution 300,000 300,000 17,273 15,045 Benefits paid (349,902) (289,557) (17,273) (15,045)Fair value of plan assets at end of year 6,473,222 6,255,267 — — Benefit obligations in excess of fair value $2,643,272 $2,252,686 $115,331 $125,596
The change in actuarial assumptions for the pension benefits relates to the use of an updated mortality table in 2015 and the change in discount rate in 2016 and 2015. The discount rate is updated annually for the determination of net periodic pension cost. In 2015, the Plan actuary reviewed and assessed a new mortality table, the scale MP-2015 table, in determining the actuarial present value of accumulated plan benefits.
Amounts recognized in the consolidated balance sheet consist of:
Other Pension Benefits Postretirement Benefits 2016 2015 2016 2015Noncurrent pension liability $(2,643,272) $(2,252,686) $ — $ —Current portion of liability for postretirement benefits — — (15,500) (16,700)Noncurrent liability for postretirement benefits — — (99,831) (108,896) Net amount recognized $(2,643,272) $(2,252,686) $(115,331) $(125,596)
Amounts recognized in accumulated other comprehensive loss consist of:
Other Pension Benefits Postretirement Benefits 2016 2015 2016 2015Actuarial loss $3,956,251 $3,480,737 $45,193 $46,868
The amounts shown above have been recognized in accumulated other comprehensive loss totaling $2,400,866, net of deferred income tax assets of $1,600,578, at December 31, 2016, and accumulated other comprehensive loss totaling $2,116,408, net of deferred income tax assets of $1,411,196, at December 31, 2015.

Amounts recorded in other comprehensive loss consist of:
Other Pension Benefits Postretirement Benefits 2016 2016 Before Tax Net of Before Tax Net of Tax (Expense) Tax Tax (Expense) Tax Amount or Benefit Amount Amount or Benefit AmountNet actuarial (gain) loss arising during the year $649,854 $259,942 $389,912 $ 3,092 $1,237 $ 1,855 Less: Amortization included in net periodic pension cost 174,340 69,736 104,604 4,766 1,907 2,859 Net change during the year $475,514 $190,206 $285,308 $(1,674) $ (670) $(1,004)
Components of net periodic pension and other postretirement benefits cost:
Other Pension Benefits Postretirement Benefits 2016 2015 2016 2015Interest cost $ 355,059 $ 335,133 $3,916 $ 7,132 Expected return on plan assets (314,327) (318,372) — —Amortization of net losses 174,340 173,679 4,766 18,065 Total $ 215,072 $ 190,440 $8,682 $25,197
Amounts recorded in accumulated other comprehensive loss expected to be recognized as a component of net periodic pension cost in 2017 are as follows: Other Pension Postretirement Benefits BenefitsActuarial loss $190,240 $4,676
Weighted average assumptions used to determine the benefit obligation and net periodic pension and other postretirement benefits cost as of and for the years ended December 31:
Other Pension Benefits Postretirement Benefits 2016 2015 2016 2015Discount rate used for net periodic cost 4.19% 3.85% 3.34% 3.25% Discount rate used for benefit obligation 3.97% 4.19% 3.28% 3.34%Expected return on plan assets 5.10% 5.10% — —
The expected return on plan assets has been determined based on historical rates of return.The assumed increase in health care cost trend rate at the end of 2016 was 8%, gradually decreasing to 5% by the year 2019 and is
expected to remain at that level thereafter. A one percentage point increase or decrease in these trend rates would not have a significant effect on the accumulated benefit obligation at December 31, 2016 and the net periodic pension and other postretirement benefits cost for 2016.
15
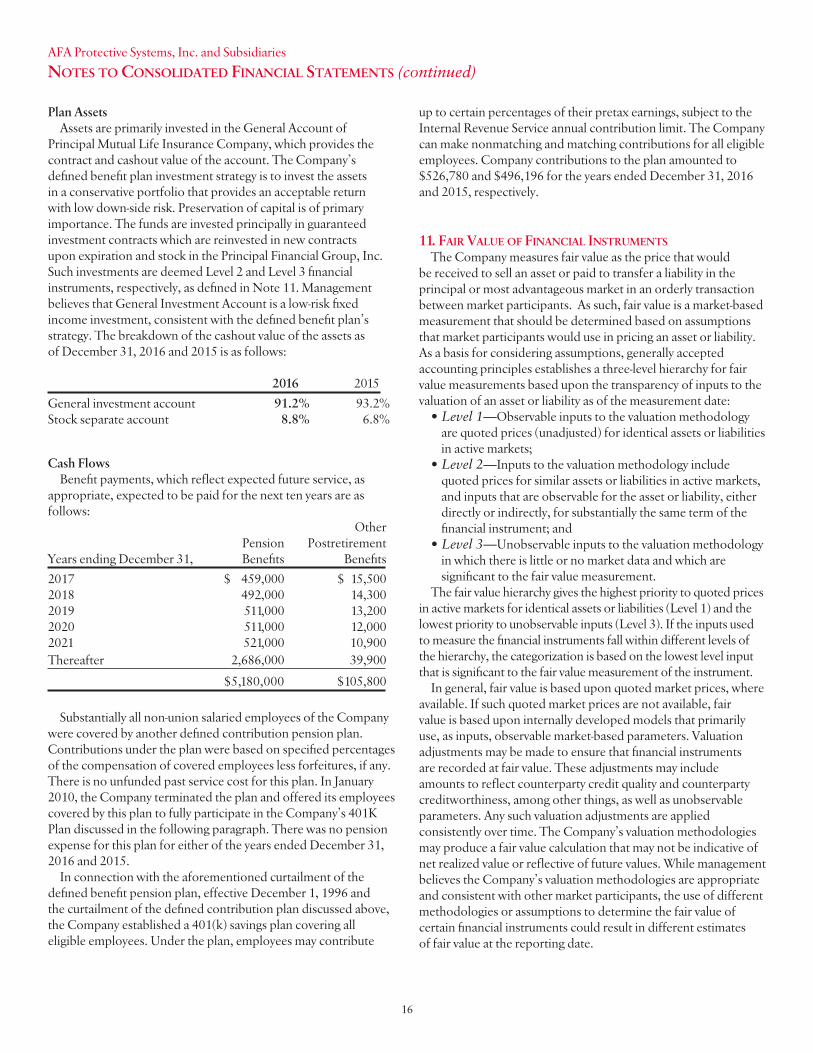
Plan AssetsAssets are primarily invested in the General Account of
Principal Mutual Life Insurance Company, which provides the contract and cashout value of the account. The Company’s defined benefit plan investment strategy is to invest the assets in a conservative portfolio that provides an acceptable return with low down-side risk. Preservation of capital is of primary importance. The funds are invested principally in guaranteed investment contracts which are reinvested in new contracts upon expiration and stock in the Principal Financial Group, Inc. Such investments are deemed Level 2 and Level 3 financial instruments, respectively, as defined in Note 11. Management believes that General Investment Account is a low-risk fixed income investment, consistent with the defined benefit plan’s strategy. The breakdown of the cashout value of the assets as of December 31, 2016 and 2015 is as follows:
2016 2015General investment account 91.2% 93.2%Stock separate account 8.8% 6.8%
Cash FlowsBenefit payments, which reflect expected future service, as
appropriate, expected to be paid for the next ten years are as follows: Other Pension PostretirementYears ending December 31, Benefits Benefits2017 $ 459,000 $ 15,500 2018 492,000 14,300 2019 511,000 13,200 2020 511,000 12,000 2021 521,000 10,900 Thereafter 2,686,000 39,900 $5,180,000 $105,800
Substantially all non-union salaried employees of the Company were covered by another defined contribution pension plan. Contributions under the plan were based on specified percentages of the compensation of covered employees less forfeitures, if any. There is no unfunded past service cost for this plan. In January 2010, the Company terminated the plan and offered its employees covered by this plan to fully participate in the Company’s 401K Plan discussed in the following paragraph. There was no pension expense for this plan for either of the years ended December 31, 2016 and 2015.
In connection with the aforementioned curtailment of the defined benefit pension plan, effective December 1, 1996 and the curtailment of the defined contribution plan discussed above, the Company established a 401(k) savings plan covering all eligible employees. Under the plan, employees may contribute
up to certain percentages of their pretax earnings, subject to the Internal Revenue Service annual contribution limit. The Company can make nonmatching and matching contributions for all eligible employees. Company contributions to the plan amounted to $526,780 and $496,196 for the years ended December 31, 2016 and 2015, respectively.
11. fair value of finanCial instrumentsThe Company measures fair value as the price that would
be received to sell an asset or paid to transfer a liability in the principal or most advantageous market in an orderly transaction between market participants. As such, fair value is a market-based measurement that should be determined based on assumptions that market participants would use in pricing an asset or liability. As a basis for considering assumptions, generally accepted accounting principles establishes a three-level hierarchy for fair value measurements based upon the transparency of inputs to the valuation of an asset or liability as of the measurement date:
• Level 1—Observable inputs to the valuation methodology are quoted prices (unadjusted) for identical assets or liabilities in active markets;
• Level 2—Inputs to the valuation methodology include quoted prices for similar assets or liabilities in active markets, and inputs that are observable for the asset or liability, either directly or indirectly, for substantially the same term of the financial instrument; and
• Level 3—Unobservable inputs to the valuation methodology in which there is little or no market data and which are significant to the fair value measurement.
The fair value hierarchy gives the highest priority to quoted prices in active markets for identical assets or liabilities (Level 1) and the lowest priority to unobservable inputs (Level 3). If the inputs used to measure the financial instruments fall within different levels of the hierarchy, the categorization is based on the lowest level input that is significant to the fair value measurement of the instrument.
In general, fair value is based upon quoted market prices, where available. If such quoted market prices are not available, fair value is based upon internally developed models that primarily use, as inputs, observable market-based parameters. Valuation adjustments may be made to ensure that financial instruments are recorded at fair value. These adjustments may include amounts to reflect counterparty credit quality and counterparty creditworthiness, among other things, as well as unobservable parameters. Any such valuation adjustments are applied consistently over time. The Company’s valuation methodologies may produce a fair value calculation that may not be indicative of net realized value or reflective of future values. While management believes the Company’s valuation methodologies are appropriate and consistent with other market participants, the use of different methodologies or assumptions to determine the fair value of certain financial instruments could result in different estimates of fair value at the reporting date.
16
AFA Protective Systems, Inc. and Subsidiaries notes to Consolidated finanCial statements (continued)

17
Cash equivalents consisting of money market funds are reported at fair value utilizing Level 1 Inputs. The General investment account is a contract provision that allows a fixed interest account in a group contract with the underlying investment custodian, which primarily consists of intermediate-term, fixed income investment and is reported utilizing Level 3 Inputs. The Stock separate account consists of equities and is reported at fair value utilizing Level 2 Inputs. Derivatives are reported at fair value utilizing Level 2 Inputs. The Company obtained dealer quotations to assist in the valuation of its interest rate swaps. Level 1 Level 2 Level 3 Total FairDecember 31, 2016 Inputs Inputs Inputs ValueGeneral investment account $ — $ — $5,914,194 $5,914,194 Srock separate account — 559,028 — 559,028Derivative assets — 2,072 — 2,072 Level 1 Level 2 Level 3 Total FairDecember 31, 2015 Inputs Inputs Inputs ValueCash equivalents $86,839 $ — $ — $ 86,839 General investment account — — 5,831,083 5,831,083 Stock separate account — 424,184 — 424,184 Derivative liabilities — 12,930 — 12,930
The following table sets forth a summary of changes in fair value of the pension’s Level 3 investments for the years ended December 31, 2016 and 2015: 2016 2015Balances at January 1, $5,831,083 $5,791,572 Deposits 300,000 300,000Investment return 133,013 29,068 Benefit payments and credits (349,902) (289,557) Balances at December 31, $5,914,194 $5,831,083
12. Commitments and ContingenCiesLeases
The Company is obligated under the terms of noncancelable operating leases for office, storage and operating facilities (real property) through 2021 for approximate aggregate minimum rentals as follows:
Years ending December 31, 2017 $ 1,170,1002018 987,2002019 932,9002020 728,0002021 415,100Thereafter 28,000 $4,261,300
Certain leases are renewable and substantially all leases provide for payment of various cost escalations. Rent expense for all operating leases, including motor vehicles, was approximately $2,251,000 and $2,230,000 for the years ended December 31, 2016 and 2015, respectively.
Other Various claims incident to the ordinary course of business,
some of which have resulted in litigation, are pending against the Company. In the opinion of management, disposition of these matters will not have a material adverse effect on its consolidated financial position, results of operations or cash flows.

To the Board of Directors ofAFA Protective Systems, Inc.:
We have audited the accompanying consolidated financial statements of AFA Protective Systems, Inc. and its subsidiaries, which comprise the consolidated balance sheets as of December 31, 2016 and 2015, and the related consolidated statements of income and comprehensive income, stockholders’ equity, and of cash flows for the years then ended.
Management’s Responsibility for the Consolidated Financial StatementsManagement is responsible for the preparation and fair presentation of the consolidated financial statements in accordance with
accounting principles generally accepted in the United States of America; this includes the design, implementation, and maintenance of internal controls relevant to the preparation and fair presentation of consolidated financial statements that are free from material misstatement, whether due to fraud or error.
Auditors’ ResponsibilityOur responsibility is to express an opinion on the consolidated financial statements based on our audits. We conducted our
audits in accordance with auditing standards generally accepted in the United States of America. Those standards require that we plan and perform the audit to obtain reasonable assurance about whether the consolidated financial statements are free from material misstatement.
An audit involves performing procedures to obtain audit evidence about the amounts and disclosures in the consolidated financial statements. The procedures selected depend on our judgment, including the assessment of the risks of material misstatement of the consolidated financial statements, whether due to fraud or error. In making those risk assessments, we consider internal controls relevant to the Company’s preparation and fair presentation of the consolidated financial statements in order to design audit procedures that are appropriate in the circumstances, but not for the purpose of expressing an opinion on the effectiveness of the Company’s internal controls. Accordingly, we express no such opinion. An audit also includes evaluating the appropriateness of accounting policies used and the reasonableness of significant accounting estimates made by management, as well as evaluating the overall presentation of the consolidated financial statements. We believe that the audit evidence we have obtained is sufficient and appropriate to provide a basis for our audit opinion.
OpinionIn our opinion, the consolidated financial statements referred to above present fairly, in all material respects, the financial position
of AFA Protective Systems, Inc. and its subsidiaries as of December 31, 2016 and 2015, and the results of their operations and their cash flows for the years then ended in accordance with accounting principles generally accepted in the United States of America.
Melville, New YorkApril 12, 2017
18
AFA Protective Systems, Inc. and Subsidiaries report of independent auditors
19
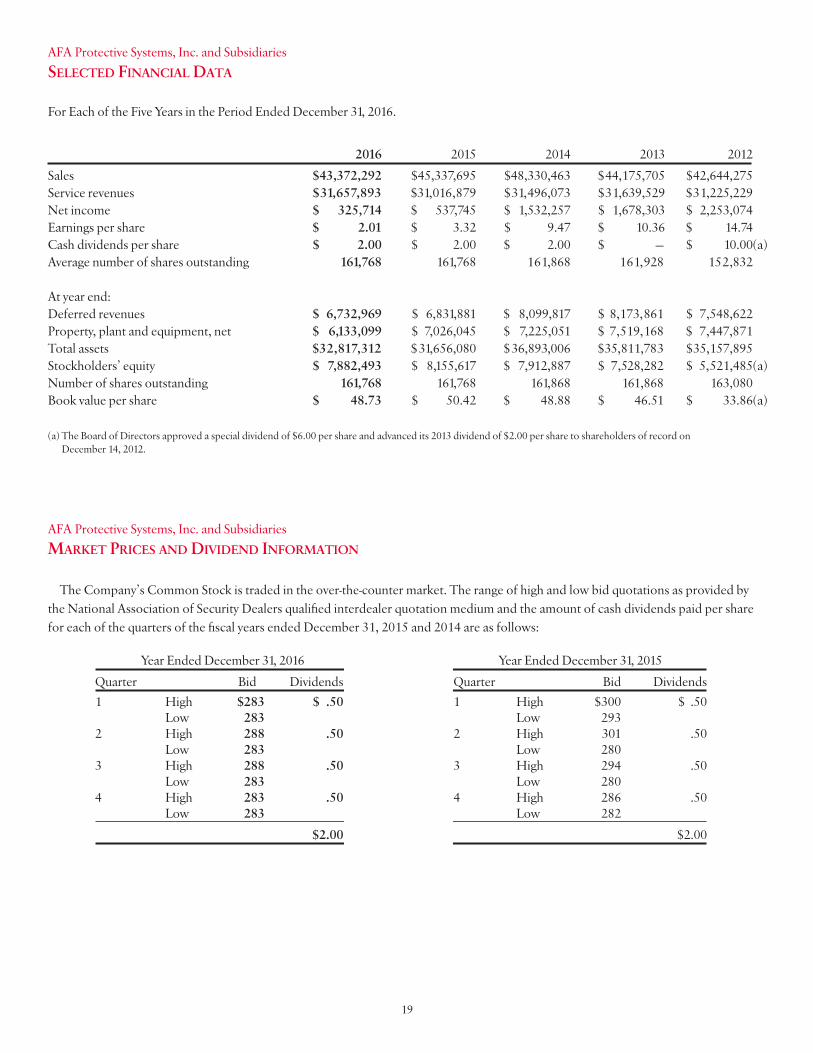
AFA Protective Systems, Inc. and Subsidiaries seleCted finanCial data
AFA Protective Systems, Inc. and Subsidiaries market priCes and dividend information
The Company’s Common Stock is traded in the over-the-counter market. The range of high and low bid quotations as provided by the National Association of Security Dealers qualified interdealer quotation medium and the amount of cash dividends paid per share for each of the quarters of the fiscal years ended December 31, 2015 and 2014 are as follows:
Year Ended December 31, 2016 Year Ended December 31, 2015 Quarter Bid Dividends Quarter Bid Dividends 1 High $283 $ .50 1 High $300 $ .50 Low 283 Low 293 2 High 288 .50 2 High 301 .50 Low 283 Low 280 3 High 288 .50 3 High 294 .50 Low 283 Low 280 4 High 283 .50 4 High 286 .50 Low 283 Low 282 $2.00 $2.00
For Each of the Five Years in the Period Ended December 31, 2016. 2016 2015 2014 2013 2012Sales $43,372,292 $45,337,695 $48,330,463 $44,175,705 $42,644,275Service revenues $31,657,893 $31,016,879 $31,496,073 $31,639,529 $31,225,229Net income $ 325,714 $ 537,745 $ 1,532,257 $ 1,678,303 $ 2,253,074Earnings per share $ 2.01 $ 3.32 $ 9.47 $ 10.36 $ 14.74Cash dividends per share $ 2.00 $ 2.00 $ 2.00 $ — $ 10.00(a)Average number of shares outstanding 161,768 161,768 161,868 161,928 152,832 At year end: Deferred revenues $ 6,732,969 $ 6,831,881 $ 8,099,817 $ 8,173,861 $ 7,548,622Property, plant and equipment, net $ 6,133,099 $ 7,026,045 $ 7,225,051 $ 7,519,168 $ 7,447,871Total assets $32,817,312 $ 31,656,080 $36,893,006 $35,811,783 $ 35,157,895Stockholders’ equity $ 7,882,493 $ 8,155,617 $ 7,912,887 $ 7,528,282 $ 5,521,485(a)Number of shares outstanding 161,768 161,768 161,868 161,868 163,080Book value per share $ 48.73 $ 50.42 $ 48.88 $ 46.51 $ 33.86(a) (a) The Board of Directors approved a special dividend of $6.00 per share and advanced its 2013 dividend of $2.00 per share to shareholders of record on
December 14, 2012.

20
exeCutive offiCe
155 Michael Drive Syosset, NY 11791 (516) 496-2322
regional offiCes
florida
6013 Benjamin Road Suite 201 Tampa, FL 33634 (727) 556-2905
217 Altamonte Commerce Blvd. Suite 1234 Altamonte Springs, FL 32714 (407) 812-9200
6535 Nova Drive Suite 111 Davie, FL 33317 (954) 473-0022
georgia 805C Franklin Court Marietta, GA 30067 (770) 794-9000
metropolitan new york 519 Eighth Avenue New York, NY 10018 (212) 279-5000
170 Eileen Way Syosset, NY 11791 (516) 496-2322
10 Skyline Drive Hawthorne, NY 10532 (914) 347-5481
mid-atlantiC 4643 Benson Avenue Halethorpe, MD 21227 (410) 247-8305
520 Fellowship Road Suite D-404 Mt. Laurel, NJ 08054 (856) 231-4242
national aCCounts 150 Wood Road Suite 301 Braintree, MA 02184 (781) 848-6200
new england 200 High Street Boston, MA 02110 (617) 772-5900
48 Capital Drive Wallingford, CT 06492 (203) 265-0202
240 Chestnut Street Warwick, RI 02888 (401) 461-2770
new Jersey 961 Joyce Kilmer Avenue North Brunswick, NJ 08902 (732) 846-4000
north Carolina 894-D Elm Street Fayetteville, NC 28303 (910) 423-4054
1135 Four Lakes Drive Suite G Matthews, NC 28105 (704) 246-7920
AFA Protective Systems, Inc. and Subsidiaries exeCutive and regional offiCes

4
Corporate information
Board of direCtors
Asher Bernstein President, Bernstein Management Corp., a real estate company, New York, NY
Stephen Hess* President, Hess Associates, Manhasset, NY
Stephen Genatt* President, Genatt Associates, New Hyde Park, NY
David M. Kleinman Vice President and Secretary, AFA Protective Systems, Inc.
Richard D. Kleinman President, AFA Protective Systems, Inc.
Robert D. Kleinman Chairman of the Executive Committee and Board of Directors, AFA Protective Systems, Inc.
Fredric Mack Partner, The Mack Company Fort Lee, NJ
Thomas Von Essen Independent consultant in the fire safety industry and former Fire Commissioner of the City of New York
*Members of Audit Committee
offiCers
Robert D. Kleinman Chairman of the Board of Directors, Chief Executive Officer and General Counsel
Richard D. Kleinman President and Chief Operating Officer
Ronald K. Rothman Senior Vice President of Sales and Business Development
Stephen P. Hyle Vice President and Director of National Accounts
David M. Kleinman Vice President and Secretary
Joseph H. Goren Chief Financial Officer and Treasurer
registrar and transfer agent
Computershare Inc. Meidinger Tower 462 S. 4th Street Louisville, KY 40202
independent auditors
PricewaterhouseCoopers LLP 401 Broad Hollow Road Melville, NY 11747
annual meeting
The Annual Meeting of Stockholders will be held on Thursday, June 1 at 11:30 a.m. at the Company’s Corporate Headquarters, 155 Michael Drive, Syosset, New York. All stockholders are invited to attend. A formal Notice of Meeting accompanies this report.

AFA Protective SyStemS, inc.155 Michael DriveSyosset, NY 11791
Telephone: 516-496-2322Fax: 516-496-2848
www.afap.com


