AFFIRMATIVE ACTION BANS AND MINORITY EMPLOYMENT: WASHINGTON STATE’S INITIATIVE 200 A Thesis submitted to the Faculty of the Graduate School of Arts and Sciences of Georgetown University in partial fulfillment of the requirements for the degree of Master of Public Policy in Public Policy By Anthony Colello, B.S. Washington, DC 15, April, 2011
Transcript
AFFIRMATIVE ACTION BANS AND MINORITY EMPLOYMENT:
WASHINGTON STATE’S INITIATIVE 200
A Thesis submitted to the Faculty of the
Graduate School of Arts and Sciences of Georgetown University
in partial fulfillment of the requirements for the degree of
Master of Public Policy in Public Policy
By
Anthony Colello, B.S.
Washington, DC 15, April, 2011
ii
Copyright 2011 by Anthony Colello All Rights Reserved
iii
AFFIRMATIVE ACTION BANS AND MINORITY EMPLOYMENT:
WASHINGTON STATE’S INITIATIVE 200
Anthony J. Colello, B.S.
Thesis Advisor: Adam Thomas, PhD.
ABSTRACT
Affirmative action has been one of the most divisive issues in recent American political
discourse. While the issue has been debated for years, recent legislative events have created
opportunities to utilize natural experiments to explore the effects of affirmative action policies.
Washington State passed Initiative 200 in 1998. I-200 effectively eliminated affirmative action
for all state employers and contractors. I-200 now presents a unique natural experiment for study.
Updating Caitlin Myers’ (2007) study of California’s Proposition 209, I utilize CPS data from
years surrounding the passage of I-200 to ascertain what impact the removal of affirmative action
requirements may have had on the labor market outcomes of minorities residing in Washington
State. The results presented herein suggest that there was an increased likelihood of
unemployment for black workers in Washington State. Other results indicate an increase in the
likelihood of employment and a decrease in non-participation in the labor force for Hispanic
workers in Washington State. Taken together, these results hint at the possibility of labor force
crowd-out for non-black minority workers as a result of affirmative action policies. I conclude by
recommending topics for further research in this area.
iv
For his unwavering dedication to this project, I want to thank Adam Thomas.
Affirmative action has long been an issue of contentious debate in America. Since
its inception during the Civil Rights movement of the 1960s, affirmative action, as a
policy, has engendered vigorous and at times vitriolic debate. However, recently, it
appears that public opinion on the subject may be converging. A recent survey that
resulted from interviews of a nationwide sample of more than 2,000 adults indicates that
support for affirmative action programs designed to improve minority employment
outcomes has improved steadily in recent years, rising from 58% in 1995 to a new high
of 70% in 2007. (Pew Research Center, 2007).
While this survey result indicates what seems to be a solidifying of popular
support for affirmative action programs, the fact remains that an increasing number of
states are choosing to ban affirmative action programs. First in California, and more
recently in Washington State, voters have voted to ban affirmative action programs at the
state level. This is a surprising occurrence given the high level of national support for
these programs.
Regardless of the explanation for this conundrum, it is clear that voters and
policymakers will be forced to make important decisions regarding the future of
affirmative action programs in America relatively soon. In order to make informed
decisions as to the worthiness of these programs, it is essential that decision makers
understand these programs’ effects.
Advocates of affirmative action policies believe that minority employees live and
work on an “unequal playing field” (American Affirmative Action Association, n.d.). The
body of evidence regarding the existence of racial and gender discrimination in the
2
workplace has grown in recent years. In their survey paper, Holzer and Neumark (2000)
conclude that the preponderance of evidence suggests that discrimination against
minority populations exists.1 In order to substantiate their contention, the authors rely
heavily on studies that utilize the “audit methodology” from Bendick, Jackson and
Reinoso (1994), Fix and Struyk (1994), and Kenny and Wissoker (1994) to demonstrate
that distinct differences in the probability of being hired exist across races that cannot be
fully explained by unobserved characteristics or other omitted variables, and thus,
support a racial discrimination hypothesis. The audit methodology approach eliminates
potential biases by creating matched pairs of job applicants that are identical along all
qualifications but are of different ethnicities. The pairs of applicants are then presented to
unknowing employers for review. By controlling for all other differences between
candidates other than race through the matching process, these studies are essentially
randomized experiments and can pinpoint racial discrimination as the primary factor in
hiring decisions.
If one believes that discrimination truly does exist in the labor market, one could
argue that steps should be taken to remediate this inequity. Therefore, advocates for
affirmative action who believe in the veracity of the results from the aforementioned
studies might contend that society has not made a meaningful attempt to give equal
opportunity to minorities. Following the argument to its logical conclusion, proponents
1 The authors contend that recent studies have not empirically proven Gary Becker’s argument that competitive markets eliminate discrimination, and they cite studies that utilize earnings and employment regressions from O’Neill (1990), Blau and Kahn (1998), and Neal and Johnson (1996) to demonstrate the black-white and female-male wage differentials, which the aforementioned authors attribute largely to racial discrimination after controlling for other omitted variables (such as cognitive ability, motivation etc.) as clearly as possible. Although not cited by the authors because it was published after the authors’ publication date, Betrand and Mullainathan (2004) also provide a resume audit study similar to those aforementioned.
3
argue that affirmative action policies are necessary in order to give these potential
employees a chance to compete with their non-minority counterparts.
Contrarily, if racial and gender discrimination cannot clearly be proven to be the
driving force behind wage or hiring probability differentials between minorities and non-
minorities or females and males, then one might argue that giving preferential treatment
to these groups in either hiring or wages amounts to reverse discrimination. Summarizing
the opposition, Reyna, Tucker, Korfmacher and Henry (2005) explain that opponents
believe that affirmative action amounts to placing more importance on race or gender
than on merit, and thus undermines basic principles of fairness upon which American
democracy is founded.
On the whole, Holzer and Neumark (2000) present convincing evidence
supporting the existence of discrimination in the labor market. Therefore, this paper seeks
to determine what impact affirmative action policies have had at counteracting this
discrimination. While a number of studies have been conducted that use EEO-1 firm-
level or individual level CPS data in order to ascertain the impact of affirmative action
programs, far less work has been done that makes use of natural experiments.2 This study
utilizes Washington State’s Initiative-200 (I-200) in a similar manner as Myers’ (2007)
usage of California’s Proposition 209, namely, as a natural experiment, in order to answer
the following research question: Did the removal of affirmative action programs
authorized by the passage of I-200 result in significant changes in black-white wage
2 The following studies utilize EEO-1 data to study the potential effects of affirmative action policies on a number of different employment outcomes: Leonard (1984), Smith and Welch (1984), Rodgers and Spriggs (1996), Ashenfelter and Heckman (1976), and Goldstein and Smith (1976). Smith and Welch (1977) and Leonard (1985) utilize CPS data to ascertain whether affirmative action policies have had an effect on black-white wage differentials. Of these studies, only Myers (2007) utilizes the “natural experiment” approach in the realm of labor markets.
4
differentials or minority employment, unemployment or non-participation rates amongst
Washington State residents?
5
CONCEPTUAL FRAMEWORK
Figure 1 graphically represents the process through which I-200 may have
impacted minority employment outcomes. The two boxes at the top of the chart indicate
the impacts of both individual and macro-level characteristics on the probability that a
person is employed, unemployed, not participating in the labor force and finally on his or
her real wage. A person’s employment status and wage are determined by a number of
factors, including but not limited to: one’s level of education, family background,
experience, ability, productivity, motivation, age and gender. To the degree that an
individual’s race, and not any other factor, negatively affects one’s ability to be
employed and wage earned, discrimination exists.
If this discrimination is present, then one’s initial predicted employment outcome
circle is being produced by an uneven playing field. Affirmative action policies are
predicated on the fact that, historically, minority employees lag behind their non-minority
counterparts in both overall employment and wages.3 Thus, affirmative action programs
and compliance reviews have been utilized in an effort to narrow racial earnings and
employment rate gaps. These programs, illustrated by the box beneath the first predicted
employment outcome circle, require that firms make an effort to avoid “underutilization”
of minorities. To ensure that minorities are not underutilized, firms may be subject to
compliance reviews conducted by the federal government (Equal Employment
Opportunity Commission, n.d.).4 Theoretically, these enforcement mechanisms help
3 Barksy, Bound, Charles and Lupton (2002), Kamalich and Polachek (1982) and Neal (2004) offer conclusions regarding the existence of the black-white wage differential. Card and Krueger (1993) provide a comprehensive overview of the changes in black-white earnings over the last 70 years. 4 The Equal Employment Opportunity Commission (EEOC) defines Underutilization: “Underutilization occurs when the percentage of employees in a protected group (women or minorities) is less than the available percentage for that protected group. Underutilization is calculated for employees in each job group. The declaration of underutilization does not amount to an admission of impermissible conduct. It is
6
minorities both to obtain employment and to gain competitive wages. If this were the
case, the post-affirmative-action predicted employment outcome would differ from the
pre-affirmative-action predicted employment outcome. In Washington State, I-200 has
removed state affirmative action programs and thus, if the programs were effective in
altering minority employment outcomes, their removal should have resulted in
employment outcomes in Washington State that are different than those observed before
I-200’s implementation. The third and final predicted employment outcome in the chart
represents these new employment outcomes.
neither a finding of discrimination nor a finding of a lack of good faith affirmative action efforts. Rather, underutilization is a technical targeting term used exclusively by affirmative action planners who seek to apply good faith efforts to increase in the future the percentage of utilization of minorities and women in a work force.”
7
Predicted Affirmative Action
Employment Outcome
Predicted Washington
Employment Outcome
Predicted Employment
Outcome
FIGURE 1: INITIATIVE 200 AND MINORITY EMPLOYMENT OUTCOMES
Macro Characteristics
Firm Size Industry Type
Geographic Location
Individual Characteristics
Race Gender Ability
Motivation Education Level
Experience Marital Status
Number of Children Citizenship Status
Affirmative Action Programs Implemented
Initiative 200
8
LITERATURE REVIEW Since their implementation, researchers have attempted to analyze the
effectiveness of affirmative action policies. The degree to which affirmative action has
been successful at accomplishing its mission can be quantitatively studied. Holzer and
Neumark (2000) argue that, in order to appropriately address affirmative action policies,
one must study recruitment, hiring practices and upward mobility. In addition to these
three criteria, a fourth measure has emerged from recent literature, namely, black-white
wage differentials.
Holzer and Neumark provide a comprehensive study of affirmative action
policies’ effects on firms’ recruitment processes. Logically, it is assumed that the
adoption of affirmative action policies and enforcement of these policies through
compliance reviews will result in wider recruitment of minority applicants. Holzer and
Neumark confirm this assumption, explaining that firms that utilize affirmative action in
their recruiting processes are more likely to seek out minority candidates more actively
and screen those applicants more intensely. The authors also contend that these firms are
more likely to ignore stigmatizing traits when they make hiring decisions (Holzer and
Neumark 2000).5
While Holzer and Neumark provide one of the few in depth recruitment analyses,
the literature regarding the effects of affirmative action policies on hiring is extensive. As
a proxy for affirmative action’s effect on hiring decisions, studies have predominately
focused on the impact affirmative action has had on minorities’ share of employment.
Leonard (1984-a), (Leonard 1984-b), Leonard (1985), Rodgers and Spriggs (1996),
5 Stigmatizing traits include but are not limited to: race, criminal record, drug test status, references, education, welfare recipient status.
9
Ashenfelter and Heckman (1976), and Goldstein and Smith (1976) each utilize EEO-1
firm-level data and compare contractor to non-contractor firms in order to ascertain the
effects that affirmative action has had on the overall employment share of minority
populations.6 In each study, the authors find that increases in minority employment were
statistically significantly associated with being a federal contractor and thus subject to
affirmative action policies and requirements (Leonard 1984-a, et al.).
Many authors have focused their studies on compliance reviews conducted by the
Office of Federal Contact Compliance (OFCC) in particular. In a case study analysis of
firms in Chicago, Heckman and Wolpin (1976) find that the actions taken by the OFCC
to enforce affirmative action policies were associated with increases in black male
employment shares. However, results for other minority groups are not shown to be
statistically significant, which the authors attribute to the limited sample size for groups
of interest other than black males (Heckman and Wolpin, 1976).7
In a subsequent case study of black economic status in the textile industry of
South Carolina, Heckman and Payner (1989) find that the introduction of affirmative
action programs and compliance reviews were associated with a statistically significant
increase in black employment. Leonard (1990) contends that while positive associations
between affirmative action and black male employment persist, this relationship was
smaller in magnitude during the 1980s than previous authors had suggested. Opposing
this contention from Leonard, Rodgers and Spriggs (1996) provide evidence of an
increasingly positive and statistically significant association between affirmative action
6 Ashenfelter and Heckman (1976) and Goldstein and Smith (1976) also address occupational advancement. These findings are discussed in subsequent sections. 7 The average firm in this sample had 25.4 black males, 13.6 black females, 88 white females and 156.4 white males on staff. The authors also indicate that they use the smallest sample of any study of which they are aware. (Heckman and Wolpin, 1976).
10
policies and black male employment between 1982 and 1992. In the most recent of this
type of study, Holzer and Neumark (2000) utilize micro-level data drawn from four major
cities (Boston, Detroit, Atlanta and Los Angeles) to measure differences in hiring and
recruitment of minorities in firms that use affirmative action and in those that do not.
Holzer and Neumark’s results are consistent with those of previous studies, excluding
Leonard (1990), finding that affirmative action policies are associated with increases in
overall employment of minorities, most clearly, amongst black males.
While affirmative action policies’ impacts on recruitment and hiring practices
have been extensively studied, there is a corresponding dearth of up-to-date quality
scholarly work focusing on changes in upward mobility. Increased occupational
advancement of minorities has received far less attention than increased overall
employment. Ashenfelter and Heckman (1976), Goldstein and Smith (1976) and Burman
(1973) address this issue directly.
Ashenfelter and Heckman, Goldstein and Smith, and Burman all utilize a similar
methodology but apply it to different samples. Each of the authors compares contractor
and non-contractor firms to estimate the changes in labor market status for minorities
during the period 1970-1972. With slight variation in coefficient estimates resulting from
differing definitions of the dependent variable of interest, these three studies come to
strikingly similar results, namely, that affirmative action is not statistically significantly
associated with improvements in the occupational position of black workers.
In addition to recruitment, hiring and upward job mobility, a fourth criterion by
which to judge the relative effectiveness of affirmative action policies has been utilized,
namely, black-white wage differentials. While a substantial amount of the literature on
11
affirmative action has utilized EEO-1 data, studies that have focused on the wage-
differential criterion have tended to utilize Current Population Survey (CPS) data
(Freeman (1973), Freeman (1981), Card and Krueger (1993) Brown (1984), Vroman
(1990), Smith and Welch (1977), Leonard (1985) and Myers (2007)).
While Freeman (1973), Freeman (1981), Card and Krueger (1993), Brown (1984)
and Vroman (1990) each utilize CPS data to analyze the cause of the post-1964 black
male earnings gains, more targeted analysis of affirmative action policies’ relationship
with wage differentials were conducted by both Smith and Welch (1977) and Leonard
(1985). Using CPS data, Smith and Welch (1977) present findings on the association
between being subjected to a compliance review and the black-white wage differential in
a particular firm. The authors find that over the period 1967-1974, these compliance
programs had a negligible impact on aggregate black male wages. Leonard (1985)
however, uses a cross-section of CPS data from 1973 and 1978 to conclude that working
in industries where affirmative action policies are most commonly practiced and
rigorously enforced is associated with higher wages for black males than is working in
other industries.
Since the publication of Leonard (1985), changes in affirmative action laws
brought about by state propositions and initiatives have allowed researchers to utilize new
methods for estimating affirmative action policies’ effects on wage differentials. Starting
with California’s Proposition 209 and continuing with Washington’s Initiative 200, a new
legislative trend, namely, the banning of affirmative action policies, has developed. The
banning of affirmative action by an individual state creates the opportunity for a “natural
experiment” in which the state that has banned affirmative action becomes a treatment
12
group, and a comparable state (or states) that has not implemented such a ban make up
the control group.8 These natural experiments have been utilized extensively by
researchers who are concerned with affirmative action policies’ effects on the higher
education system, including Hinrichs (2010), Tienda (2003), Bucks (2005), Card and
Krueger (2005) and Long (2004).
However, in comparison, the usage of these natural experiments by researchers
concerned with the effects of affirmative action policies on labor market outcomes has
been relatively scant. Myers’ (2007) study is an attempt to remedy the problem of a
dearth of quality studies in this subject area. Using CPS data from 1994-2001, Myers
(2007) estimates the changes in wage rate differentials and employment, unemployment
and nonparticipation rates for minorities that are associated with the passage of
California’s Proposition 209.9
Proposition 209 removed affirmative action programs that focused on education,
contracting, and public hiring at both the state and local levels (federal programs
continued to be implemented in these areas). While previous studies have relied upon
EEO-1 data and comparisons across contractor statuses to isolate the impact of
affirmative action policies, Myers contends that this approach presents a self-selection
issue. Myers argues that firms that have chosen to be federal contractors have done so for
a particular reason. Myers assumes that these federal contractors have recognized
affirmative action requirements and chosen to become federal contractors either because
of, or in spite of, these requirements. For example, these contractors may simply be
conducting work that is usually done by low-skilled workers who are likely to be part of a
8 Myers utilizes a treatment group that consists of observations from each state outside of California, except for Washington State. 9 Myers defines these measures as “labor market outcomes”.
13
minority group anyway, and therefore, are unconcerned with affirmative action
requirements. If this is the case, any comparison that utilizes these firm types will be
necessarily biased because they have selected into the treatment group. Conversely,
utilizing this approach alleviates selection bias concerns insofar as Proposition 209
represents a policy development that affects the functioning of economic actors within
the state of California alone, leaving all other non-California state actors unaffected.
Assuming this assumption holds, Proposition 209 represents an exogenous shock to
California’s labor markets, and thus, a uniquely clean natural experiment opportunity.
While different factors affect minority labor outcomes differently across states, this
approach allows Myers to control for those factors insofar as their effects remain constant
across the time period.
Myers utilizes a triple difference model that relies on the following three
dimensions. The first dimension is along racial lines. The second dimension is time (pre
and post Proposition 209). The final dimension is geographic (California and the rest of
the nation).10 This triple-difference approach is based upon Myers’ underlying identifying
assumption that in the absence of the policy change mandated by Proposition 209, the
change in labor market outcomes for minorities relative to white outcomes in California
would have been the same as those in any other state across this time period. The triple-
difference model allows Myers to attribute changes in minority labor outcomes relative to
white outcomes across states to what she assumes to be the only factor that is
differentially changing across the time period, namely, the change in affirmative action
policy mandated by Proposition 209. Myers concludes that there was a considerable drop
in employment post-Proposition 209’s passage. Over the course of the five-year period, 10 Myers drops any observations from Washington State.
14
Myers reports that the relative employment for minorities in California declined by 2.8
percentage points but that real wages did not show corresponding changes (Myers, 2007).
Initiative 200, which is closely modeled after Proposition 209, was passed by
Washington State voters in 1998 and now provides an opportunity to expand upon
Myers’ findings and add to the relatively small body of literature that utilizes these
natural experiments to analyze the labor market effects produced by affirmative action
policies. Utilizing CPS data, I investigate whether changes in minority wages and
employment, unemployment and nonparticipation rates in Washington State are
associated with the passage of I-200 in the same manner as was found in California post
Proposition 209 by Myers.
15
ISSUE BACKGROUND
Many of the affirmative action policies known to the American public today are a
product of a series of Executive Orders and court rulings. In 1961, President John F.
Kennedy signed Executive Order 10925, hereafter EC 10925, which created the
President’s Committee on Equal Opportunity.11 EC 10925 mandated that government
contractors “take affirmative action to ensure that applicants are employed, and
employees are treated during employment without regard to their race, creed, color, or
national origin” (UC Irvine Office of Equal Employment and Diversity, 2002). In 1968,
following his Executive Order 11246 that necessitated contractors conduct hiring
“without regard to race, religion and national origin” (UC Irvine Office of Equal
Employment and Diversity, 2002), President Lyndon Johnson amended his Order to
include sex/gender.
Holzer and Neumark (2000) explain that defining affirmation action as a singular
policy is difficult. Nonetheless, it is possible to coalesce court rulings and Orders into a
set of current requirements for federal contractors (Holzer and Neumark 2000). As the
body of law stands today, any employer who obtains a contract from the federal
government worth $50,000 or more and employs at least fifty persons must file an EEO-1
form with the federal government. The EEO-1 form requires employers to indicate the
racial makeup of their workforce and report any underutilization of minority workers. If
an employer reports this problem, he or she is required to remedy the problem through
the use of goals and timetables (Holzer and Neumark, 2000). In order to ensure that
federal contractors and subcontractors are abiding by this body of nondiscrimination
11 A Commission later renamed the “Equal Employment Opportunity Commission” after the passage of the Civil Rights Act of 1964.
16
laws, Executive Order 12086 created the Office of Federal Contract Compliance
Programs (OFCCP). The OFCCP, which is the primary enforcement mechanism for
affirmative action policies, conducts compliance reviews to ensure contractor adherence.
Initiative 200
In 1998, I-200 effectively banned the use of preferential treatment “on the basis of
race, sex, color, ethnicity, or national origin in the operation of public employment,
public education, or public contracting” (Office of Secretary of State Sam Reed, 1998).
The law passed with 52.44% of the vote and took effect immediately (Washington State
Board of Elections, 1998). In addition, I-200 does not change existing federal law that
continues to hold federal contractors responsible for meeting various affirmative action
requirements. However, state contractors and all state employers, who were also subject
to state affirmative action laws that mirrored federal requirements prior to I-200 have
been released from these requirements.
As noted previously, I-200 was closely modeled after Proposition 209. Therefore,
Myers’ (2007) study of Proposition 209 provides a useful methodological model on
which to base a study of I-200. This study will implement a methodology that is similar
to that of Myers so as to expand upon Myers’ findings and judge the degree to which the
California results can be extrapolated to other populations.
17
DATA AND METHODOLOGY
The current study utilizes data from the outgoing rotation groups of the Current
Population Survey (CPS) for the years surrounding the passage and implementation of I-
200. In order to allow for lead-up and implementation effects to be accounted for, I do
not use data from the year on either side of 1998. After I drop 1997 and 1999, I pool data
from four years before (1993, 1994, 1995 and 1996) and four years after (2000, 2001,
2002 and 2003) the implementation of I-200. Myers (2007) focuses on an individual year
on each side of the program implementation; however, my treatment group sample size is
considerably smaller because Washington State has fewer residents than does California.
Therefore, I have pooled multiple years of data rather than relying on one year to one
year comparisons.
In order to limit my study population to working aged persons, I drop all students
and any person outside of the ages 18-65. So as to provide a true control group that stands
outside of the influence of a similar program, I drop all observations from California over
these years.12 Myers similarly drops all observations from Washington State. Lastly, any
person who reports being employed but reports zero hours worked and no wages is
dropped from the sample so as to remedy possible human measurement error. After each
of these alterations has been made, the study sample that is remaining is detailed in Table
1 and Table 2.
I utilize a triple-difference model to analyze the effects of I-200. The use of a
triple-difference model is based upon three major divisions in the data.13 The data are
12 Observations from Michigan, a state wherein a similar ban was passed in 2008, were not dropped as Michigan’s Proposition 2 occurred well after the time period of interest even if accounting for lead-up effects. 13 These are also the three divisions used in Myers’ study.
18
first divided into pre-reform and post-reform periods. As described above, the reform
period includes both years surrounding the year of I-200’s passage. Therefore, the pre-
reform period is defined as 1993-1996, and the post-reform period is defined as 2000-
2003. Secondly, the data divides individuals into race and gender categories. Mutually
exhaustive and exclusive, the categories divide individuals into Male, Female, as well as
White, Black, Hispanic, or Other, subgroups, as shown in Table 1. These categories are
then combined or separated for various regressions. For ease of exposition, when seeking
to estimate the impact of the Initiative on the various non-white minority groups’
employment outcomes, each group’s coefficient reflects a comparison to a white male
baseline.
Lastly, the data are divided along geographic lines. In one set of regressions,
Washington State is used as the treatment group, while the rest of the country (without
California) is combined to create a control group. In a second set of regressions,
Washington State is used as the treatment group, while Oregon is used as a control group.
Oregon was chosen as the control group because it is demographically, geographically
and economically similar to Washington State (US Census Bureau, 2010).
Given these divisions, I utilize a triple-difference model to estimate the effects of
I-200 on specific labor market outcomes. I focus on labor market outcomes: wage,
employment, unemployment, and non-participation (defined as “not in the labor force”),
each of which is defined by a 0-1 binary dummy variable. The three employment
outcomes should be considered as exhaustive categories. Every person within the sample
must be either employed, unemployed, or choosing to not be in the labor force. The
19
model for any of these previously noted outcomes, y, is then given by the following
equation:
yikt = (Xit)γ + β1(Post-98t) + β2(WAk) + β3(MINORITYi) + β4(Post-98t * WAk) + β5(Post-98t * MINORITYi) + β6(WAk * MINORITYi) + β7(Post-98t * WAk * MINORITYi) + εikt Where: i indexes for an individual, k indexes for the location and t indexes for the time
period. The (Xit) vector includes the constant term and all of the controls utilized in the
model, which include: the age, marital status, education level, and citizenship status of
the individual, as well as whether the individual resides in a metropolitan location. These
controls are nearly identical to those used by Myers. The marital status and metro
variables each take the form of 0-1 binary dummies, with 1 indicating the individual is
married and living in a metro area respectively. The age variable is simply a continuous
variable ranging from 18 to 65 in years. Lastly, the education level variable is a
categorical variable defining the level of educational attainment of the individual. (The
educational categories are defined further in Table 4). The Post-98 variable represents a
0-1 dummy for the pre-reform or post-reform period. The WA variable is a 0-1 dummy
for being in the control or treatment group for geographic location. Finally, the
MINORITY variable is a 0-1 dummy for being in the minority group of interest for a
particular regression.
In order to estimate the impact of the Initiative on wages for different populations
of interest, I utilize a log-wage Ordinary Least Square regression.
For each of the other three outcomes of interest: employment, unemployment, or
not in labor force, each of which is a binary dummy variable, I utilize an OLS model to
estimate the relationship between the Initiative on the probability of each outcome. For
the population of interest, the coefficient on β7 measures the additional impact of the
20
Initiative on employment, unemployment, or not being in the labor force. This coefficient
is then analyzed for statistical and substantive significance.
21
DESCRIPTIVE FINDINGS
The total number of observations with non-missing values for the variables of
interest is 1,108,987. Table 1 provides descriptive statistics for the variables of interest.
Table 2 details the racial makeup of the treatment and control groups. Table 3 details the
frequencies of the categorical variables of interest. Finally, Table 4 provides written
descriptions of each of the variables of interest. At the end of the thesis, Appendix I
provides the STATA code that was used to produce the tables shown below.
As shown in Table 1, the mean age of the population was 39.57 years. Nearly half
of the population was female, and 62% of the population was married. The average
hourly wage in the sample was $18.77/hour in 2009 real dollars. Turning to Table 2,
1,092,252 observations came from states other than Washington, while 16,735
observations came from Washington State. Referencing Table 3, nearly 8% of the sample
members did not finish high school. Roughly two-thirds of the population obtained a
high-school degree or GED, while 28.2% attended college but did not graduate and
18.9% graduated from college with a degree. Roughly three quarters of sample members
were employed, 3.9% of sample members were unemployed, and 22.4% of sample
members were not in the labor force. Nearly 80% of the sample identified as White, 9.7%
as Black, 7.3% as Hispanic, and 4.3% as Other. About half of the sample comes from
observations before 1998, with the remainder coming from observations after 1998.
22
TABLE 1 DESCRIPTIVE STATISTICS OF STUDY SAMPLE
CPS OUTGOING ROTATION 1993-1996 AND 2000-2003
Variable Obs Mean Min Max Range Std Dev Variance Post98 1,108,987 .52 0 1 1 .49 .24
Washington State Resident 1,108,987 .01 0 1 1 .12 .01
Metropolitan Area 1,108,987 .75 0 1 1 .42 .18
TABLE 2 SAMPLE SIZES
Group Nation Washington White Male 440,114 7,493 White Female 418,720 6,918 Black Male 47,160 221 Black Female 61,049 204 Hispanic Male 45,303 448 Hispanic Female 33,988 274 Other Male 23,422 581 Other Female 22,496 596 Total 1,092,252 16,735
23
TABLE 3 CATEGORICAL VARIABLE FREQUENCIES
Demographic Characteristic Number of Cases Percentage of Sample
Gender Male 564,742 50.9 Female 544,245 49.1 Age Group (years) 18-64 1,108,987 100 Education Level Less Than High School 92,035 8.2 High School 391,588 35.3 Some College 313,140 28.2 College 210,467 18.9 Advanced 101,757 9.5 Race/Ethnicity White 873,245 78.7 Black 108,634 9.7 Hispanic 80,013 7.3 Other 47,095 4.3 Marital Status Unmarried 420,749 37.9 Married 688,238 62.1 Geographic Location Washington State 16,735 1.5 Rest of Nation 1,092,252 98.5 Overall Sample 1,108,987 100
Contextual Characteristic Number of Cases Percentage of Sample
Labor Force Status
Employed 1,115,278 73.6
Unemployed 60,294 3.9
Not In Labor Force 340,401 22.4
Reside in Metropolitan Area
Non-Metropolitan Area 270,005 24.4
Metropolitan Area 838,982 75.6
WA
Not In Washington 1,092,252 1.5
In Washington 16,735 98.5
POST98
Pre-98 521,726 47.1
Post-98 587,261 52.9
Overall Sample 1,108,987 100
25
TABLE 4 VARIABLE DESCRIPTIONS
Variable Name Variable Description
Year A continuous variable that indicates the year from which the observation is taken. Possible values range from 1993 to 2003.
Age A continuous variable that indicates the age of the respondent in years. Possible values range from 18 to 65.
Gender A 0-1 binary dummy variable. A response of 0 indicates male while a response of 1 indicates female.
Education Level A categorical variable that measures the level of educational attainment of the respondent. Possible responses range from: less than 1st grade, 1st-11th grades, 12th grade-no diploma, High School graduate or GED, Some college but no degree, Associate Degree in an Occupational/Vocational Program, Associate degree in an Academic program, Bachelor’s Degree, Master’s Degree, Professional Degree, or Doctorate.
Race A categorical variable that indicates the race of the respondent. White = 1, Black = 2, Hispanic = 3 and Other = 4.
Marital Status A 0-1 binary dummy variable. A response of 0 indicates that the respondent in unmarried while a response of 1 indicates the respondent is married.
Citizenship A categorical variable that indicates the respondent’s citizenship status. Born in the US = 1, Born in Puerto Rico = 2, Foreign born with US parents = 3, Foreign born and naturalized = 4 and Foreign born = 5.
Hourly Wage (Real $ 2009) A continuous variable that measures the real, inflation adjusted, hourly wage, of the respondent in 2009 real dollars.
State (Census State Code) A categorical variable that indicates the respondent’s state residence. The responses take on values from the Census Coding.
Metropolitan Area A 0-1 binary dummy variable. A response of 0 indicates that the respondent does not live in a metropolitan area while a response of 1 indicates that the respondent does live in a metropolitan area.
Labor Force Status A categorical variable that indicates the labor force status of the respondent. Employed = 1, Unemployed = 2, Not in Labor Force = 3.
26
REGRESSION RESULTS
Tables 5 and 6 present the coefficients on the triple difference coefficients from
each of the study’s OLS regressions.14 Complete results from every regression can be
found in Appendix II, Tables A-1 through A-8. Each Table in Appendix II contains
results from four different regressions that focus on different race groups using the same
control variables. Each coefficient appears in bold above a robust standard error reported
in parentheses.
The regressions focus on four different labor market outcomes: real wage,
employment, unemployment and labor force non-participation. When taken together,
employment, unemployment and non-participation account for the entire working aged
population. These categories are included in order to differentiate between the individuals
who purposefully choose not to participate in the labor force and those who cannot find
work despite concerted efforts.
For each regression, it is expected that the removal of affirmative action programs
that give preference to minority workers will result in worse employment outcomes for
minority workers and better employment outcomes for white workers. If employers are
no longer required to meet diversity requirements, and white workers are more highly
qualified on average, or are given preferential treatment due to racial discrimination, then
it could be assumed that the removal of affirmative action programs will result in
improved outcomes for white workers.
The results presented in Table 5 are produced by regressions that utilize the rest of
the nation as a control group. Table 6 provides results from those regressions that use
14 These regressions are not weighted as all of them control for factors that are used to formulate CPS weights.
27
Oregon as a control group.15 Estimates for the minority working population as a whole, as
well as disaggregated racial groups, are provided. For ease of exposition, I limit my
minority race-specific findings for Blacks, Hispanics and Other Race persons to
comparisons against a white baseline.
Unemployment:
Of the results presented in Table 5, the statistically significant finding associated
with the change in the probability of Black unemployment stands out. The black
unemployment result indicates that in the time period following the passage of I-200, the
probability of unemployment for blacks in Washington State, when compared to the
baseline group of whites, was 4.1 percentage points higher than their black counterparts
in the rest of the nation over the same time period. Table 5 also indicates that no other
unemployment findings were statistically significant at conventional levels.
Employment:
Referencing Table 5, none of the coefficients indicate a statistically significant
change in the probability of employment for any racial group when compared to a white
baseline group. The directions of these changes are sometimes perplexing, however. If
affirmative action programs in Washington State were at all effective in increasing
minority employment rates, as alluded to earlier, one would expect to see a reduction in
the probability of these populations being employed following their removal. However,
according to the results presented in Table 5, this is not the case. Table 5 presents
estimates that suggest that Black, Hispanic and Other Race workers, when disaggregated
and compared to a white baseline, all appear to have increased probabilities of
15 Table 5 provides OLS estimates as indicated in the table’s title. Logit estimation of theses models was also completed, and the results were similar to those reported here with respect to both direction and significance level.
28
employment following the banning of affirmative action in Washington State. This
pattern is repeated when the groups are aggregated to form the “Minority” subgroup.
These coefficients are imprecisely estimated. Though not statistically significant at any
conventional level, these are perplexing results.
While the estimated effects of I-200 on minority employment probabilities were
not particularly conclusive when comparing Washington with the rest of the nation, a
comparison of Washington to the demographically and economically similar state of
Oregon produces important findings. The coefficient on the triple difference estimate for
the Hispanic employment variable is highly statistically significant (Table 6). This
coefficient indicates that the probability of employment for Hispanic workers in
Washington, when compared to a white worker baseline, is 9.6 percentage points higher
than the probability of employment for Hispanic workers in Oregon, when compared to a
white baseline, following I-200. This increase is both statistically and economically
significant.
While not statistically significant at conventional levels (p>.135), the estimate of
the black triple difference coefficient (Table 6) must be discussed, as it is a confounding
result and not far from statistically relevant levels of significance. While this result runs
counter to logical assumptions regarding employment outcomes for blacks following the
banning of affirmative action, it is possible that this result reflects the fact that federal
affirmative action programs continue to be implemented in Washington State. As a large
federal contractor, the Boeing Company is subject to federal affirmative action laws.
During this study’s time period, Boeing received a number of large contracts from the
federal government. These contracts required that affirmative action requirements be met.
29
It is conceivable that Boeing, as well as other companies that are subject to federal
affirmative action laws were able to employ enough black workers during this time
period to mitigate the potential negative effects of I-200 for black workers.
Non-Participation:
The results from Table 5 do not provide a clear indication as to the impact of I-
200 on the probability of labor force non-participation. As was the case with the
employment results, these estimates move in a direction that is unexpected. According to
the estimates, none of which is statistically significant at traditional levels, Black and
Hispanic workers in Washington State witnessed decreases in their probabilities of non-
participation, when compared to a white baseline group, following the introduction of I-
200, by 6.3 and 3.4 percentage points respectively. In addition, when aggregated, the
minority population witnessed a reduction of 2.5 percentage points in the probability of
non-participation.
As is the case with the employment outcome, comparisons of non-participation
probabilities for minority populations in Washington State with those of the rest of the
nation do not yield significant results. However, as was the case with employment, a
comparison of Washington State to Oregon does yield significant results for Hispanic
workers. According to the coefficient on the triple difference estimate for Hispanic
workers, the probability of non-participation for Hispanic workers in Washington, when
compared to a white worker baseline, is 7.6 percentage points lower than the probability
of non-participation for Hispanic workers in Oregon, when compared to a white baseline,
following I-200. Therefore, when taken with the previous result, it appears that Hispanic
30
workers in Washington are simultaneously participating more often and finding
employment more often following I-200 than are Hispanic workers in Oregon.
Real Wages:
Estimates regarding the change in real wages are given in Tables 5 and 6. While
each of the estimates indicates an increase in real wages for each race’s workers in
Washington State following I-200, none of these results is statistically significant at
conventional levels.
Note: *Indicates coefficient is significant at the p > .10 level. ** Indicates coefficient is significant at p > .05 level. *** Indicates coefficient is significant at p > .001 level.
Note: *Indicates coefficient is significant at the p > .10 level. ** Indicates coefficient is significant at p > .05 level. *** Indicates coefficient is significant at p > .001 level.
TABLE 5 OLS TRIPLE DIFFERENCES SUMMARY
WASHINGTON AND REST OF NATION STUDY
Variable Unemployment Employment NILF Real Wage Black .041**
(.019) .022
(.042) -.063 (.040)
.001 (1.26)
Hispanic .005 (.019)
.028 (.035)
-.034 (.033)
.027 (.716)
Other Race -.007 (.013)
.010 (.026)
-.006 (.024)
.677 (.735)
Minority .007 (.010)
.018 (.019)
-.025 (.018)
.465 (.524)
TABLE 6 OLS TRIPLE DIFFERENCES SUMMARY
WASHINGTON AND OREGON STUDY
Variable Unemployment Employment NILF Real Wage Black -.028
(.035) .105
(.070) -.076 (.065)
.615 (2.05)
Hispanic -.020 (.024)
.096** (.044)
-.076* (.042)
1.07 (.966)
Other Race .007 (.020)
-.041 (.040)
.033 (.038)
-1.06 (1.08)
Minority -.009 (.014)
.037 (.028)
-.027 (.026)
.284 (.737)
31
IMPLICATIONS Affirmative action programs were originally intended to aid minority workers in
overcoming racial discrimination in the workplace, obtaining employment and gaining
competitive wages. The degree to which these programs have been successful at
accomplishing these goals has long been an issue of intense debate. With the increasing
number of states choosing to ban affirmative action, new opportunities have arisen to
study the effectiveness of these programs. This paper utilizes a natural experiment
produced by Washington’s I-200 to answer questions about the impact of affirmative
action programs on minority employment outcomes.
While all efforts have been made to produce strong econometric results, this
project is subject to certain limitations. First, unlike the previous study of this kind
produced by Myers that focused on the highly populated state of California, this project
focused on the more sparsely populated state of Washington. As such, the sample size
used as the treatment group for analysis is significantly smaller than that of Myers. It is
possible that with a larger sample more significant results would have been found for
more variables of interest than are produced by this project. Secondly, affirmative action
programs are implemented at two levels: state and federal. Therefore, while Washington
State has banned affirmative action for Washington state employers, there are firms in
Washington that are subject to federal affirmative action laws that are still in place. The
effects of these programs are not directly controlled for in this study. Thirdly, affirmative
action programs, as discussed in the introduction, are targeted at firms of specific types
and sizes. Therefore, there are many firms in Washington State for whom the banning of
affirmative action did not matter. However, because the inclusion of a “firm-type”
32
variable or a “firm-size” variable would have severely limited my sample size, this
control has not been used in this paper’s analysis. Lastly, and perhaps most importantly,
it is possible that this analysis fails to control for an event other than I-200 that
disproportionately affected minority employment outcomes in Washington State over this
time period and did not affect the control group, whether that control group is defined as
the rest of the nation, or Oregon.
Despite these limitations, the results produced by the implementation of a triple-
difference OLS model provide important insights into the impact of affirmative action
programs being banned at the state level. When taken together, the three significant
results regarding Washington workers presented herein: an increase in the probability of
being unemployed for black workers, an increase in the probability of being employed for
Hispanic workers and a decrease in the probability of non-participation for Hispanic
workers, suggest that affirmative action programs may simultaneously aid black workers
in finding employment and crowd out workers from other minority groups. First, the
results suggest that black workers in Washington are more likely to be unemployed
following the passage of I-200. This indicates that affirmative action programs may have
been successful in increasing employment opportunities for black workers in Washington
State, and their removal as mandated by I-200 may have resulted in a loss of these
opportunities. To the extent that one believes affirmative action is necessary to help
reduce pre-existing discrimination in the workplace by granting increased access to
employment opportunities to black workers, this should be a concerning result.
Perhaps more interesting however, are the results pertaining to Hispanic workers.
The results suggest that while black workers witness negative employment results as a
33
result of I-200, Hispanic workers in Washington are shown to have improved
employment outcomes following the removal of affirmative action programs. This result
would seem to indicate that while black workers have benefitted from affirmative action
programs, other minority groups have not.
A potential explanation for this finding is that the increased hiring of black
workers as a result of affirmative action has led to the crowding out of other minority
workers from the labor market. Black workers may have been the primary targets of these
programs, and as a result, it is plausible that affirmative action programs were subjected
to a systemic bent toward African Americans over other minority groups. Assuming
minority groups tend to compete for similar jobs, it is then possible that affirmative
action programs would improve employment outcomes for black workers, while
simultaneously worsening employment outcomes for other minority groups. Therefore,
when these programs were removed and black workers were no longer given the
preference over their counterparts of other minority groups, employment outcomes for
members of these other minority groups actually improved. This finding indicates that
affirmative action, despite being targeted at improving employment outcomes for all
minority groups, may have in fact, helped only certain minority groups and left others
relatively worse off.
This second finding provides an opportunity for groundbreaking new research in
the field of affirmative action policy. More information and future studies are needed to
ascertain exactly how this dynamic influences programs’ enforcement mechanisms in
other states around the country. If it is the case that Hispanic, or other non-black minority
groups, are shown to have improved employment outcomes while black workers’
34
outcomes are worsened following the removal of affirmative action programs, it will be
necessary to reexamine the practices that have lead to this uneven outcome. Further
research into the extent to which black workers have been the primary target group of
affirmative action, and the effects that this has had on workers of other minority groups,
would then be needed. Investigations into this issue should take the form of both
quantitative and qualitative studies. The results of these studies have the potential to
change how affirmative action programs are implemented at both the state and federal
levels.
Despite these interesting results, much of the affirmative action picture remains
unclear. While the three significant results provide starting points for compelling future
research, it is important to recognize that the vast majority of the coefficients produced in
this study were not significant. This lack of significance is useful in some cases as it
substantiates previous findings. For example, as was the case for Myers’ study, this
project does not provide statistically significant evidence that eliminating affirmative
action has real wage effects. However, the large number of insignificant results also
indicates that there is still much that remains unexplained about the impacts of
affirmative action on minority labor market outcomes.
This study provides insight into Washington State’s experience with affirmative
action programs. As more states begin to ban these programs, there will be additional
research opportunities to determine whether Washington’s experience can be
extrapolated to other states. Regardless of future findings, this project suggests that
affirmative action programs may have had important impacts on labor market outcomes
for minority populations. Regardless of one’s personal contentions about the need for
35
these programs, their effects must be studied and used to make informed decisions
regarding future policy.
36
APPENDIX I: STATA CODE
set mem 1g use "E:\AJC\AJC Thesis Data 11.18.10.dta" tabstat year age female educ92 wbho married ownchild forborn prcitshp state metro centcity suburb, s(mean sd variance skewness N sum range min max) tabstat lfstat rw_p8_no, s(mean sd variance skewness N sum range min max) table year table female table wbho table female wbho table female wbho if state==91 table educ92 table ownchild table married table prcitshp table suburb table forborn table metro table rural table lfstat table centcity table state table WA table POST98 reg rw year age educ female wbho married metro WA POST98 sample2 = e(sample) sample = e(sample sample = e(sample) gen sample = e(sample) gen sample2 = e(sample) sum year age educ female wbho if sample2==1 gen sample3 = e(sample) sum lfstat if sample3==1 reg rw year age educ female wbho married metro WA POST98 sum year age educ female wbho married metro WA POST98 if sample2==1 sum year age educ female wbho married metro WA POST98 if sample2==1 table lfstat if sample3==1 table educ if sample2==1 table POST98 if sample2==1 **Creating Dummy Variables** gen WA=0 replace WA=1 if state=91
37
gen WAOR=0 replace WAOR=1 if state=91 replace WAOR=1 if state=92 gen POST98=0 replace POST98=1 if year==1998 replace POST98=1 if year>1998 gen Black=0 replace Black=1 if wbho==2 gen White=0 replace White=1 if wbho==1 gen Hispanic=0 replace Hispanic=1 if wbho==3 gen Otherrace=0 replace Otherrace=1 if wbho==4 gen Minority=0 replace Minority=1 if wbho==2 replace Minority=1 if wbho==3 replace Minority=1 if wbho==4 gen WhiteBlack=0 replace WhiteBlack=1 if wbho==1 replace WhiteBlack=1 if wbho==2 gen WhiteHispanic=0 replace WhiteHispanic=1 if wbho==1 replace WhiteHispanic=1 if wbho==3 gen WhiteOtherrace=0 replace WhiteOtherrace=1 if wbho==1 replace WhiteOtherrace=1 if wbho==5 gen WhiteMinority=0 replace WhiteMinority=1 if wbho==1 replace WhiteMinority=1 if Minority==1 **General Interactions** gen WAPOST98 = WA*POST98
38
**Black Interactions** gen BlackWA = Black*WA gen BlackPOST98 = Black*POST98 gen BlackPOST98WA = Black*POST98*WA **Hispanic Interactions** gen HispanicWA = Hispanic*WA gen HispanicPOST98 = Hispanic*POST98 gen HispanicPOST98WA = Hispanic*POST98*WA **OtherRace Interactions** gen OtherraceWA = Otherrace*WA gen OtherracePOST98 = Otherrace*POST98 gen OtherracePOST98WA = Otherrace*POST98*WA **Minority Interactions** gen MinorityWA = Minority*WA gen MinorityPOST98 = Minority*POST98 gen MinorityPOST98WA = Minority*POST98*WA **White Interactions** gen WhiteWA = White*WA gen WhitePOST98 = White*POST98 gen WhitePOST98WA = White*POST98*WA **Regressions** **Black Logits** logit empl age female married educ prcitshp metro WA POST98 WAPOST98 Black BlackWA BlackPOST98 BlackPOST98WA if WhiteBlack==1
39
logit unem age female married educ prcitshp metro WA POST98 WAPOST98 Black BlackWA BlackPOST98 BlackPOST98WA if WhiteBlack==1 logit nilf age female married educ prcitshp metro WA POST98 WAPOST98 Black BlackWA BlackPOST98 BlackPOST98WA if WhiteBlack==1 **Black OLSs** reg empl age female married educ prcitshp metro WA POST98 WAPOST98 Black BlackWA BlackPOST98 BlackPOST98WA if WhiteBlack==1, r reg unem age female married educ prcitshp metro WA POST98 WAPOST98 Black BlackWA BlackPOST98 BlackPOST98WA if WhiteBlack==1, r reg nilf age female married educ prcitshp metro WA POST98 WAPOST98 Black BlackWA BlackPOST98 BlackPOST98WA if WhiteBlack==1, r reg rw age female married educ prcitshp metro WA POST98 WAPOST98 Black BlackWA BlackPOST98 BlackPOST98WA if WhiteBlack==1, r **White Logits** logit empl age female married educ prcitshp metro WA POST98 WAPOST98 White WhiteWA WhitePOST98 WhitePOST98WA logit unem age female married educ prcitshp metro WA POST98 WAPOST98 White WhiteWA WhitePOST98 WhitePOST98WA logit nilf age female married educ prcitshp metro WA POST98 WAPOST98 White WhiteWA WhitePOST98 WhitePOST98WA **White OLSs** reg empl age female married educ prcitshp metro WA POST98 WAPOST98 White WhiteWA WhitePOST98 WhitePOST98WA, r reg unem age female married educ prcitshp metro WA POST98 WAPOST98 White WhiteWA WhitePOST98 WhitePOST98WA, r reg nilf age female married educ prcitshp metro WA POST98 WAPOST98 White WhiteWA WhitePOST98 WhitePOST98WA, r reg rw age female married educ prcitshp metro WA POST98 WAPOST98 White WhiteWA WhitePOST98 WhitePOST98WA, r **Hispanic Logits** logit empl age female married educ prcitshp metro WA POST98 WAPOST98 Hispanic HispanicWA HispanicPOST98 HispanicPOST98WA if WhiteHispanic==1 logit unem age female married educ prcitshp metro WA POST98 WAPOST98 Hispanic HispanicWA HispanicPOST98 HispanicPOST98WA if WhiteHispanic==1 logit nilf age female married educ prcitshp metro WA POST98 WAPOST98 Hispanic HispanicWA HispanicPOST98 HispanicPOST98WA if WhiteHispanic==1 **Hispanic OLSs**
40
reg empl age female married educ prcitshp metro WA POST98 WAPOST98 Hispanic HispanicWA HispanicPOST98 HispanicPOST98WA if WhiteHispanic==1, r reg unem age female married educ prcitshp metro WA POST98 WAPOST98 Hispanic HispanicWA HispanicPOST98 HispanicPOST98WA if WhiteHispanic==1, r reg nilf age female married educ prcitshp metro WA POST98 WAPOST98 Hispanic HispanicWA HispanicPOST98 HispanicPOST98WA if WhiteHispanic==1, r reg rw age female married educ prcitshp metro WA POST98 WAPOST98 Hispanic HispanicWA HispanicPOST98 HispanicPOST98WA if WhiteHispanic==1, r **Other Race Logits** logit empl age female married educ prcitshp metro WA POST98 WAPOST98 Otherrace OtherraceWA OtherracePOST98 OtherracePOST98WA logit unem age female married educ prcitshp metro WA POST98 WAPOST98 Otherrace OtherraceWA OtherracePOST98 OtherracePOST98WA logit nilf age female married educ prcitshp metro WA POST98 WAPOST98 Otherrace OtherraceWA OtherracePOST98 OtherracePOST98WA **Other Race OLSs** reg empl age female married educ prcitshp metro WA POST98 WAPOST98 Otherrace OtherraceWA OtherracePOST98 OtherracePOST98WA, r reg unem age female married educ prcitshp metro WA POST98 WAPOST98 Otherrace OtherraceWA OtherracePOST98 OtherracePOST98WA, r reg nilf age female married educ prcitshp metro WA POST98 WAPOST98 Otherrace OtherraceWA OtherracePOST98 OtherracePOST98WA, r reg rw age female married educ prcitshp metro WA POST98 WAPOST98 Otherrace OtherraceWA OtherracePOST98 OtherracePOST98WA, r **Minority Logits** logit empl age female married educ prcitshp metro WA POST98 WAPOST98 Minority MinorityWA MinorityPOST98 MinorityPOST98WA if WhiteMinority==1 logit unem age female married educ prcitshp metro WA POST98 WAPOST98 Minority MinorityWA MinorityPOST98 MinorityPOST98WA if WhiteMinority==1 logit nilf age female married educ prcitshp metro WA POST98 WAPOST98 Minority MinorityWA MinorityPOST98 MinorityPOST98WA if WhiteMinority==1 **Minority OLSs** reg empl age female married educ prcitshp metro WA POST98 WAPOST98 Minority MinorityWA MinorityPOST98 MinorityPOST98WA if WhiteMinority==1, r reg unem age female married educ prcitshp metro WA POST98 WAPOST98 Minority MinorityWA MinorityPOST98 MinorityPOST98WA if WhiteMinority==1, r
41
reg nilf age female married educ prcitshp metro WA POST98 WAPOST98 Minority MinorityWA MinorityPOST98 MinorityPOST98WA if WhiteMinority==1, r reg rw age female married educ prcitshp metro WA POST98 WAPOST98 Minority MinorityWA MinorityPOST98 MinorityPOST98WA if WhiteMinority==1, r **Washington and Oregon Only Regressions** **Blacks** reg empl age female married educ prcitshp metro WA POST98 WAPOST98 Black BlackWA BlackPOST98 BlackPOST98WA if WhiteBlack==1 & WAOR==1, r reg unem age female married educ prcitshp metro WA POST98 WAPOST98 Black BlackWA BlackPOST98 BlackPOST98WA if WhiteBlack==1 & WAOR==1, r reg nilf age female married educ prcitshp metro WA POST98 WAPOST98 Black BlackWA BlackPOST98 BlackPOST98WA if WhiteBlack==1 & WAOR==1, r reg rw age female married educ prcitshp metro WA POST98 WAPOST98 Black BlackWA BlackPOST98 BlackPOST98WA if WhiteBlack==1 & WAOR==1, r **Whites** reg empl age female married educ prcitshp metro WA POST98 WAPOST98 White WhiteWA WhitePOST98 WhitePOST98WA if WAOR==1, r reg unem age female married educ prcitshp metro WA POST98 WAPOST98 White WhiteWA WhitePOST98 WhitePOST98WA if WAOR==1, r reg nilf age female married educ prcitshp metro WA POST98 WAPOST98 White WhiteWA WhitePOST98 WhitePOST98WA if WAOR==1, r reg rw age female married educ prcitshp metro WA POST98 WAPOST98 White WhiteWA WhitePOST98 WhitePOST98WA if WAOR==1, r **Hispanics** reg empl age female married educ prcitshp metro WA POST98 WAPOST98 Hispanic HispanicWA HispanicPOST98 HispanicPOST98WA if WhiteHispanic==1 & WAOR==1, r reg unem age female married educ prcitshp metro WA POST98 WAPOST98 Hispanic HispanicWA HispanicPOST98 HispanicPOST98WA if WhiteHispanic==1 & WAOR==1, r reg nilf age female married educ prcitshp metro WA POST98 WAPOST98 Hispanic HispanicWA HispanicPOST98 HispanicPOST98WA if WhiteHispanic==1 & WAOR==1, r reg rw age female married educ prcitshp metro WA POST98 WAPOST98 Hispanic HispanicWA HispanicPOST98 HispanicPOST98WA if WhiteHispanic==1 & WAOR==1, r **Other Race**
42
reg empl age female married educ prcitshp metro WA POST98 WAPOST98 Otherrace OtherraceWA OtherracePOST98 OtherracePOST98WA if WAOR==1, r reg unem age female married educ prcitshp metro WA POST98 WAPOST98 Otherrace OtherraceWA OtherracePOST98 OtherracePOST98WA if WAOR==1, r reg nilf age female married educ prcitshp metro WA POST98 WAPOST98 Otherrace OtherraceWA OtherracePOST98 OtherracePOST98WA if WAOR==1, r reg rw age female married educ prcitshp metro WA POST98 WAPOST98 Otherrace OtherraceWA OtherracePOST98 OtherracePOST98WA if WAOR==1, r **Minority** reg empl age female married educ prcitshp metro WA POST98 WAPOST98 Minority MinorityWA MinorityPOST98 MinorityPOST98WA if WhiteMinority==1 & WAOR==1, r reg unem age female married educ prcitshp metro WA POST98 WAPOST98 Minority MinorityWA MinorityPOST98 MinorityPOST98WA if WhiteMinority==1 & WAOR==1, r reg nilf age female married educ prcitshp metro WA POST98 WAPOST98 Minority MinorityWA MinorityPOST98 MinorityPOST98WA if WhiteMinority==1 & WAOR==1, r reg rw age female married educ prcitshp metro WA POST98 WAPOST98 Minority MinorityWA MinorityPOST98 MinorityPOST98WA if WhiteMinority==1 & WAOR==1, r
43
APPENDIX II: FULL REGRESSION RESULTS
Note: “Real Wage” as measured in real 2009 American dollars. * Indicates coefficient is significant at the p > .10 level. ** Indicates coefficient is significant at p > .05 level. *** Indicates coefficient is significant at p > .001 level. Black Sample Size: 848,766. Black R-Squared 0.2638. Black Overall F-Test: 0.00. Hispanic Sample Size: 826,787. Hispanic R-Squared: 0.2690. Hispanic Overall F-Test: 0.00. Other Race Sample Size: 962,611. Other Race R-Squared: 0.2661. Other Race Overall F-Test: 0.00. Minority Sample Size: 962,611. Minority R-Squared: 0.2682. Minority Overall F-Test: 0.00.
TABLE A-1 REGRESSION RESULTS
REAL WAGE OUTCOME WASHINGTON AND REST OF NATION STUDY
Variable Black Hispanic Other Race Minority Age .175***
(.001) .173*** (.001)
.172*** (.000)
.170*** (.001)
Female -5.06*** (.024)
-5.25*** (.024)
-4.95*** (.022)
-4.91*** (.022)
Married 2.04*** (.025)
2.12*** (.025)
2.12*** (.023)
2.00*** (.023)
Education 4.69*** (.013)
4.67*** (.013)
4.71*** (.012)
4.64*** (.012)
Citizenship Status -.187*** (.019)
-.249*** (.015)
-.422*** (.010)
-1.79*** (.011)
Metropolitan Area 3.16*** (.025)
3.15*** (.025)
2.86*** (.023)
2.97*** (.023)
Washington State (WA)
.347** (.161)
.350** (.161)
.523*** (.155)
.358** (.161)
Post-98 1.48*** (.026)
1.48*** (.026)
1.38*** (.023)
1.49*** (.026)
WA*Post98 .244 (.209)
.247 (.209)
.290 (.199)
.250 (.209)
Race -1.74*** (.050)
-1.05*** (.067)
.031 (.093)
-1.36*** (.040)
Race*WA -.456 (1.12)
.152 (.624)
-.967 (.610)
-.104 (.448)
Race*Post98 -.512*** (.065)
-.342*** (.007)
.043 (.117)
-.345*** (.050)
Race*Post98*WA .001 (1.26)
.027 (.716)
.677 (.735)
.465 (.524)
44
Note: “Employment” measured as the probability of being employed. * Indicates coefficient is significant at the p > .10 level. ** Indicates coefficient is significant at p > .05 level. *** Indicates coefficient is significant at p > .001 level. Black Sample Size: 1,146,600. Black R-Squared .0923. Black Overall F-Test: 0.00. Hispanic Sample Size: 1,109,855. Hispanic R-Squared: 0.0938. Hispanic Overall F-Test: 0.00. Other Race Sample Size: 1,311,977. Other Race R-Squared: 0.0898. Other Race Overall F-Test: 0.00. Minority Sample Size: 1,311,977. Minority R-Squared: 0.0911. Minority Overall F-Test: 0.00.
TABLE A-2 REGRESSION RESULTS
EMPLOYMENT OUTCOME WASHINGTON AND REST OF NATION STUDY
Variable Black Hispanic Other Race Minority Age -.006***
(.000) -.006***
(.000) -.006***
(.000) -.006***
(.000) Female -.118***
(.000) -.138***
(.000) -.120***
(.000) -.129***
(.000) Married .029***
(.000) .020*** (.000)
.034*** (.000)
.029*** (.000)
Education .074*** (.000)
.068*** (.000)
.075*** (.000)
.072*** (.000)
Citizenship Status -.012*** (.000)
-.010*** (.000)
-.009*** (.000)
-.005*** (.000)
Metropolitan Area .012*** (.00)
.011*** (.000)
.009*** (.000)
.013*** (.000)
Washington State (WA)
-.033*** (.005)
-.034*** (.005)
-.024*** (.005)
-.033*** (.005)
Post-98 .005*** (.000)
.006*** (.000)
.010*** (.000)
.005*** (.000)
WA*Post98 -.009 (.006)
-.009 (.006)
-.010* (.006)
-.009 (.006)
Race -.067*** (.002)
-.053*** (.002)
-.060*** (.003)
-.066*** (.001)
Race*WA .043 (.035)
.004 (.031)
-.007 (.022)
.004 (.016)
Race*Post98 .022*** (.002)
.043*** (.003)
.009** (.003)
.029*** (.001)
Race*Post98*WA .022 (.242)
.028 (.035)
.014 (.026)
.018 (.019)
45
Note: “Unemployment” measured as the probability of being unemployed. * Indicates coefficient is significant at the p > .10 level. ** Indicates coefficient is significant at p > .05 level. *** Indicates coefficient is significant at p > .001 level. Black Sample Size: 1,146,600. Black R-Squared .0163. Black Overall F-Test: 0.00. Hispanic Sample Size: 1,109,855. Hispanic R-Squared: 0.0120. Hispanic Overall F-Test: 0.00. Other Race Sample Size: 1,311,977. Other Race R-Squared: 0.0146. Other Race Overall F-Test: 0.00. Minority Sample Size: 1,311,977. Minority R-Squared: 0.0157. Minority Overall F-Test: 0.00.
TABLE A-3 REGRESSION RESULTS
UNEMPLOYMENT OUTCOME WASHINGTON AND REST OF NATION STUDY
Variable Black Hispanic Other Race Minority Age -.001***
(.000) -.000***
(.000) -.001***
(.000) -.001***
(.000) Female -.009***
(.000) -.009***
(.000) -.009***
(.000) -.010***
(.000) Married -.020***
(.000) -.020***
(.000) -.022***
(.000) -.020***
(.000) Education -.008***
(.000) -.007***
(.000) -.009***
(.000) -.008***
(.000) Citizenship Status .001***
(.000) .000
(.000) -.000 (.000)
-.002*** (.000)
Metropolitan Area -.003*** (.000)
-.002*** (.000)
-.001*** (.000)
-.003*** (.000)
Washington State (WA)
.014*** (.002)
.014*** (.002)
.009*** (.002)
.014*** (.002)
Post-98 -.000 (.000)
-.000* (.000)
-.001*** (.000)
-.000 (.000)
WA*Post98 .002 (.003)
-002 (.003)
.004 (.003)
-.002 (.003)
Race .025*** (.001)
.013*** (.017)
.012*** (.001)
.021*** (.000)
Race*WA -.048*** (.014)
-.008 (.017)
-.000 (.011)
-.014* (.008)
Race*Post98 -.004*** (.001)
-.008*** (.001)
-.001 (.001)
-.006*** (.000)
Race*Post98*WA .931** (.019)
.005 (.019)
-.007 (.013)
.007 (.010)
46
Note: “Not in labor force” measured as the probability of not being in the labor force. * Indicates coefficient is significant at the p > .10 level. ** Indicates coefficient is significant at p > .05 level. *** Indicates coefficient is significant at p > .001 level. Black Sample Size: 1,146,600. Black R-Squared .1072. Black Overall F-Test: 0.00. Hispanic Sample Size: 1,109,855. Hispanic R-Squared: 0.1105. Hispanic Overall F-Test: 0.00. Other Race Sample Size: 1,311,977. Other Race R-Squared: 0.1048. Other Race Overall F-Test: 0.00. Minority Sample Size: 1,311,977. Minority R-Squared: 0.1053. Minority Overall F-Test: 0.00.
TABLE A-4 REGRESSION RESULTS
NOT IN THE LABOR FORCE OUTCOME WASHINGTON AND REST OF NATION STUDY
Variable Black Hispanic Other Race Minority Age .007***
(.000) .007*** (.000)
.007*** (.000)
.007*** (.000)
Female .128*** (.000)
.147*** (.000)
.140*** (.000)
.139*** (.000)
Married -.009*** (.000)
-.000*** (.000)
-.011*** (.000)
-.008** (.000)
Education -.065*** (.000)
-.060*** (.000)
-.065*** (.000)
-.063*** (.000)
Citizenship Status .011*** (.000)
.010 (.000)
.009*** (.000)
.007*** (.000)
Metropolitan Area -.009*** (.000)
-.009*** (.000)
-.007*** (.000)
-.010*** (.000)
Washington State (WA)
.019*** (.005)
.019*** (.005)
.014** (.004)
.019*** (.005)
Post-98 -.005*** (.000)
-.005*** (.000)
-.009*** (.000)
-.005*** (.000)
WA*Post98 .006*** (.006)
.007*** (.006)
.006 (.006)
.007 (.006)
Race .041*** (.001)
.039*** (.030)
.048*** (.003)
.045*** (.001)
Race*WA .004 (.035)
.003 (.030)
.007 (.020)
.009 (.015)
Race*Post98 -.017*** (.002)
-.035*** (.002)
-.008** (.003)
-.023*** (.001)
Race*Post98*WA -.063 (.040)
-.034 (.033)
-.006 (.024)
-.025 (.018)
47
Note: “Employment” measured as the probability of being employed. * Indicates coefficient is significant at the p > .10 level. ** Indicates coefficient is significant at p > .05 level. *** Indicates coefficient is significant at p > .001 level. Black Sample Size: 35,080. Black R-Squared .0818. Black Overall F-Test: 0.00. Hispanic Sample Size: 36,674. Hispanic R-Squared: 0.0812. Hispanic Overall F-Test: 0.00. Other Race Sample Size: 40,109. Other Race R-Squared: 0.0795. Other Race Overall F-Test: 0.00. Minority Sample Size: 40,109. Minority R-Squared: 0.0793. Minority Overall F-Test: 0.00.
TABLE A-5 REGRESSION RESULTS
EMPLOYMENT OUTCOME WASHINGTON AND OREGON STUDY
Variable Black Hispanic Other Race Minority Age -.007***
(.000) -.006***
(.000) -.006***
(.000) -.006***
(.000) Female -117***
(.004) -.130***
(.004) -.129***
(.004) -.129***
(.004) Married .025***
(.004) .019*** (.004)
.020*** (.004)
.020** (.004)
Education .068*** (.002)
.067*** (.002)
.065*** (.002)
.065*** (.002)
Citizenship Status -.025*** (.003)
-.013*** (.002)
-.009*** (.002)
-.011*** (.002)
Metropolitan Area .045*** (.005)
.042*** (.005)
.044*** (.005)
.044*** (.005)
Washington State (WA)
-.023** (.007)
-.023** (.007)
-.027** (.007)
-.023** (.007)
Post-98 -.017** (.006)
-.017** (.006)
-.019** (.006)
-.017 (.006)
WA*Post98 .014 (.009)
.014 (.009)
.020** (.009)
.014 (.009)
Race -.035 (.044)
.051** (.025)
-.038 (.026)
.000** (.017)
Race*WA .004 (.057)
-.092** (.039)
-.034 (.034)
-.059 (.023)
Race*Post98 -.061 (.056)
-.025 (.027)
.068** (.030)
.010 (.020)
Race*Post98*WA .105 (.070)
.096** (.044)
-.041 (.049)
.037 (.028)
48
Note: “Unemployment” measured as the probability of being unemployed. * Indicates coefficient is significant at the p > .10 level. ** Indicates coefficient is significant at p > .05 level. *** Indicates coefficient is significant at p > .001 level. Black Sample Size: 35,080. Black R-Squared .0163. Black Overall F-Test: 0.00. Hispanic Sample Size: 36,674. Hispanic R-Squared: 0.0147. Hispanic Overall F-Test: 0.00. Other Race Sample Size: 40,109. Other Race R-Squared: 0.0142. Other Race Overall F-Test: 0.00. Minority Sample Size: 40,109. Minority R-Squared: 0.0142. Minority Overall F-Test: 0.00.
TABLE A-6 REGRESSION RESULTS
UNEMPLOYMENT OUTCOME WASHINGTON AND OREGON STUDY
Variable Black Hispanic Other Race Minority Age -.000***
(.000) -.000***
(.000) -.000***
(.000) -.000***
(.000) Female -.015***
(.002) -.014***
(.002) -.013***
(.002) -.013***
(.002) Married -.032***
(.002) -.029***
(.002) -.028***
(.002) -.028** (.002)
Education -.008*** (.001)
-.009*** (.001)
-.009*** (.000)
-.009*** (.000)
Citizenship Status -.000 (.001)
-.000 (.001)
-.001 (.001)
-.002** (.001)
Metropolitan Area -.006** (.002)
-.008** (.002)
-.009*** (.002)
-.009*** (.002)
Washington State (WA)
.008** (.003)
.008** (.003)
.008** (.003)
.008** (.003)
Post-98 .013 (.003)
.013*** (.003)
.016*** (.003)
.013** (.003)
WA*Post98 -.011 (.004)
-.011** (.004)
-.013** (.004)
-.011 (.004)
Race -.007 (.019)
-.008 (.012)
.007 (.012)
.002 (.008)
Race*WA -.016 (.024)
.011 (.021)
.007 (.017)
.005 (.011)
Race*Post98 .065** (.029)
.017 (.014)
-.016 (.015)
.010 (.010)
Race*Post98*WA -.028 (.035)
-.020 (.024)
.007 (.020)
-.009 (.014)
49
Note: “Not in labor force” measured as the probability of not being in the labor force. * Indicates coefficient is significant at the p > .10 level. ** Indicates coefficient is significant at p > .05 level. *** Indicates coefficient is significant at p > .001 level. Black Sample Size: 35,080. Black R-Squared .1047. Black Overall F-Test: 0.00. Hispanic Sample Size: 36,674. Hispanic R-Squared: 0.1035. Hispanic Overall F-Test: 0.00. Other Race Sample Size: 40,109. Other Race R-Squared: 0.1007. Other Race Overall F-Test: 0.00. Minority Sample Size: 40,109. Minority R-Squared: 0.1007. Minority Overall F-Test: 0.00.
TABLE A-7 REGRESSION RESULTS
NOT IN LABOR FORCE OUTCOME WASHINGTON AND OREGON STUDY
Variable Black Hispanic Other Race Minority Age .008***
(.000) .007*** (.000)
.007*** (.000)
.007*** (.000)
Female .133*** (.004)
.145*** (.004)
.143*** (.003)
.143*** (.003)
Married .006 (.004)
.010*** (.004)
.008* (.004)
.007* (.004)
Education -.059*** (.002)
-.058*** (.002)
-.056*** (.001)
-.056*** (.001)
Citizenship Status .019*** (.003)
.013*** (.002)
.011*** (.001)
.013*** (.002)
Metropolitan Area -.038*** (.005)
-.034*** (.005)
-.035*** (.004)
-.035*** (.004)
Washington State (WA)
.014* (.007)
.014* (.007)
.018** (.007)
.014** (.007)
Post-98 .003 (.006)
.003 (.006)
.003 (.006)
.003 (.006)
WA*Post98 -.002 (.008)
-.002 (.008)
-.006 (.008)
-.002 (.008)
Race .043 (.041)
-.042* (.023)
.030 (.025)
-.003 (.016)
Race*WA .0111 (.054)
.080** (.037)
.026 (.032)
-.054** (.022)
Race*Post98 -.004 (.051)
.008 (.025)
-.051* (.029)
-.020 (.018)
Race*Post98*WA -.076 (.065)
-.076* (.042)
.033 (.038)
-.027 (.026)
50
Note: “Real Wage” as measured in real 2009 American dollars. * Indicates coefficient is significant at the p > .10 level. ** Indicates coefficient is significant at p > .05 level. *** Indicates coefficient is significant at p > .001 level. Black Sample Size: 25,386. Black R-Squared .2313. Black Overall F-Test: 0.00. Hispanic Sample Size: 26,505. Hispanic R-Squared: 0.2443. Hispanic Overall F-Test: 0.00. Other Race Sample Size: 28,889. Other Race R-Squared: 0.2431. Other Race Overall F-Test: 0.00. Minority Sample Size: 28,899. Minority R-Squared: 0.2435. Minority Overall F-Test: 0.00.
TABLE A-8 REGRESSION RESULTS
REAL WAGE OUTCOME WASHINGTON AND OREGON STUDY
Variable Black Hispanic Other Race Minority Age .017***
(.006) .172*** (.006)
.171*** (.005)
.169*** (.005)
Female -5.28*** (.144)
-5.21*** (.139)
-5.12*** (.133)
-5.12*** (.133)
Married 2.60*** (.147)
2.48*** (.141)
2.45*** (.135)
2.43** (.135)
Education 4.25 (.082)
4.20*** (.079)
4.27*** (.074)
4.24*** (.074)
Citizenship Status -.152*** (.126)
-.241** (.094)
-.451*** (.060)
-.311*** (.074)
Metropolitan Area 2.51*** (.157)
2.44*** (.148)
2.32*** (.144)
2.34*** (.144)
Washington State (WA)
1.00*** (.227)
1.00*** (.227)
.911*** (.219)
1.011*** (.227)
Post-98 1.80*** (.211)
1.80*** (.211)
1.68*** (.299)
1.80*** (.211)
WA*Post98 .002 (.296)
.007 (.296)
.053 (.280)
.011 (.296)
Race -.739 (1.46)
.033 (.655)
-1.64** (.592)
-.570 (.469)
Race*WA -1.18 (1.84)
-1.60* (.862)
.793 (.826)
-.720 (.626)
Race*Post98 -1.29 (1.61)
-1.58* (.658)
1.79** (.811)
-.238 (.521)
Race*Post98*WA .615 (2.05)
1.07 (.966)
-1.06 (1.08)
.284 (.737)
51
REFERENCE LIST:
American Affirmative Action Association. (n.d.) Position Paper . Retrieved from http://www.affirmativeaction.org/about.html
Arrow, K. (1998). What Has Economics to Say About Racial Discrimination? The
Journal of Economic Perspectives, 12 (2), 91-100. Ashenfelter, O., Heckman, J. (1976). Measuring the Effect of an Antidiscrimination
Program. In Ashenfelter, Orley and James Blum, eds., Evaluation the Labor Market Effects of Social Programs Industrial Relations Section.
Barsky, R., Bound, J., Charles, K., Lupton, J. (2002). Accounting for the Black-White
Wealth Gap: A Non-Parametric Approach. Journal of the American Statistical Association, 97 (459), 663-673.
Bell, M. P., Harrison, D.A., and M. E. McLaughlin, M.E. (2000). Forming, Changing,
and Acting on Attitude Toward Affirmative Action Programs in Employment: A Theory-Driven Approach. Journal of Applied Psychology, 85, 784-798.
Bendick, M., Jackson, C., Reinoso, V. (2004). Measuring employment Discrimination
Through Controlled Experiments. Review of Black Political Economy, 23 (1), 25-58.
Blau, F., Kahn. L. (1997). Swimming Upstream: Trends in the Gender Wage Differential
in the 1980s. Journal of Labor Economics, 15 (1),1-42. Brown, S., Hirschman, C. (2006). The End of Affirmative Action in Washington State
and Its Impact on the Transition from High School to College. Sociology of Education 79 (2), 106-130.
Brown, C. (1984). Black/White Earnings Ratios Since the Civil Rights Act of 1964: The
Importance of Labor Market Dropouts. Quarterly Journal of Economics, 99, 31-44.
Bucks, B. (2005). Affirmative Access Versus Affirmative Action: How Have Texas’
Race-Blind Policies Affected College Outcomes? Mimeo. Card, D., Krueger, A. (2005). Would the Elimination of Affirmative Action Affect
Highly Qualified Minority Applicants? Evidence from California and Texas. Industrial and Labor Relations Review, 58 (3), 416-434.
-----. (1993). Trends in Relative Black-White Earnings Revisited. The American
Economic Review, 83 (2), 85-91.
52
Chay, K. (1995). The Impact of Federal Civil Rights Policy on Black Economic Progress: Evidence from the Equal Employment Opportunity Act of 1972. Industrial and Labor Relations Review, 51 (4), 608-632.
Donahue, J., Heckman, J. (1991). Continuous Versus Episodic Change: The Impact of
Civil Rights Policy on the Economic Status of Black. Journal of Economic Literature, 29 (4), 1603-1643.
Fix, M., Struyk, R. (1994). Clear and Convincing Evidence. Washington, DC: Urban
Institute Press. Fraser, J., Kick, E. (2000). The Interpretive Repertoires of Whites on Race-Targeted
Policies. Claims Making of Reverse Discrimination. Sociological Perspectives, 43, 13-28.
Freeman, R. (1973). Changes in the Labor Market for Black Americans, 1948-1972.
Brookings papers on Economic Activity, 67-120. ------. (1981). Black Economic Progress After 1964: Who Has Gained and Why? In
Rosen, Sherwin, eds. Studies in Labor Markets, 247-294. Goldstein, M., Smith, R. (1976). The Estimated Impact of the Antidiscrimination
Program Aimed at Federal Contractors. Industrial and Labor Relations Review, 29 (4), 523-543.
Kenney, G., Wissoker, D. (1994). An Analysis of the Correlates of Discrimination Facing
Young Hispanic Jobseekers. American Economic Review, 84 (3), 674-683. Heckman, J., Payner, B. (1989). Determining the Impact of Federal Antidiscrimination
Policy on the Economic Status of Blacks: A Study of South Carolina. The American Economic Review, 79 (1), 138-177.
Heckman, J., Wolpin, K.. (1976). Does the Contract Compliance Program Work? An
Analysis of Chicago Data. Industrial and Labor Relations Review, 29, (4), 544-564.
Hinrichs, P. (2010). The Effects of Affirmative Action Bans on College Enrollment,
Educational Attainment, and the Demographic Composition of Universities Georgetown University Working Paper.
Holzer, H., Neumark, D. 2000. Assessing Affirmative Action. Journal of Economic
Literature, 38 (3), 83-568. -----.(1999(. Are Affirmative Action Hires Less Qualified? Evidence from Employer-
Employee Data on New Hires. Journal of Labor Economics, 17 (3), 534-569.
53
-----. (2000). What Does Affirmative Action Do?. Industrial and Labor Relations Review 53 (2), 240-271.
Holzer, H. (1998). Why Do Small Establishment Hire Fewer Blacks Than Large Ones?.
The Journal of Human Resources, 33 (4) 896-914. Kalev, A., Kelley, E., Dobbin, F. (2006). Best Practice or Best Guesses? Assessing the
Efficacy of Corporate Affirmative Action and Diversity Policies. American Sociological Review, 71 (4), 589-617.
Kamalich, R., Polacheck, S. (1982). Discrimination: Fact or Fiction? An Examination
Using an Alternative Approach. Southern Economic Journal, 49 (2), 450. Kravitz, D. A., Kleinberg, S.L. (2000). Reactions to Two Versions of Affirmative Action
Among Whites, Blacks, and Hispanics. Journal of Applied Psychology, 85, 597-611.
Leonard, J. (1996). Affirmative Action: Thirty Years Later: Wage Disparities and
Affirmative Action in the 1980’s. The American Economic Review, 86 (2), 285-289.
-----. (1984). The Impact of Affirmative Action on Employment. Journal of Labor
Economics, (2) 4, 439-463. -----. (1985). Affirmative Action as Earnings Redistribution: The Targeting of
Compliance Reviews. Journal of Labor Economics, 3 (3), 363-384. -----. (1984). Antidiscrimination or Reverse Discrimination: The Impact of Changing
Demographics, Title VII, and Affirmative Action on Productivity. The Journal of Human Resources, 19 (2), 145-174.
-----. (1989). Women and Affirmative Action. The Journal of Economic Perspectives 3
(1), 61-75. -----. (1984). Employment and Occupational Advance Under Affirmative Action. The
Review of Economics and Statistics, 66 (3), 377-385. -----. (1990). The Impact of Affirmative Action Regulation and Equal Employment Law
on Black Employment. The Journal of Economic Perspectives, 4 (4), 47-63. -----. (1985). What Promises Are Worth: The Impact of Affirmative Action Goals. The
Journal of Human Resources, 20 (1), 3-20. Long, M. (2004). College Applications and the Effect of Affirmative Action.
Journal of Econometrics, 121 (1), 319-342.
54
Mullainathan, S., Bertrand, M.. 2004. Are Emily and Greg More Employable than Lakisha and Jamal? A Field Experiment on Labor Market Discrimination. Harvard University.
Murrell, A., Jones, R. 1996. Assessing Affirmative Action: Past, Present, and Future.
Journal of Social Issues, 52 (4), 77-92. Myers, C. (2007). A Cure for Discrimination? Affirmative Action and the Case of
Pew Research Center. (March, 2007). Trends in Political Values and Core Attitides (1987-2007). Retreived from http://people-press.org/2007/03/22/trends-in-political-values-and-core-attitudes-1987-2007/
Neal, D., Johnson, W. (1996). The Role of Premarket Factors in Black-White Wage
Differences. Journal of Political Economy, 105 (5), 869-895. Neal, D. (2004). The Measured Black-White Wage Gap Among Women is Too Small.
The Journal of Political Economy, 121 (1) 21-28. Office of the Secretary of State Sam Reed. Official (n.d.) Text of Initiative 200. Retrieved
from http://www.sos.wa.gov/elections/1998/i200_text.aspx O’Neill, J. (1990). The Role of Human Capital in Earnings Differences between Black
and White Men. Journal of Economic Perspectives, 4 (4), 13-17. O’Neill, D., O’Neill, J. (1992). Affirmative Action in the Labor Market. Annals of the
American Academy of Political and Social Science, 523, 88-93. Reyna, C., Tucker, A., Korfmacher, W., Henry, P.J. (2005) Political Psychology, 26 (5),
667-682. Rodgers, W,. Spriggs, W.E. (1996). The Effect of Federal Contractor Status on Racial
Differences in Establishment- Level Employment Shares: 1979-1992. American Economic Review, 86 (2), 290-93.
Smith, J., Welch, F. (1984). Affirmative Action and Labor Markets. Journal of Labor
Economics, 2 (2), 269-301. Tienda, M., Leicht, K., Sullivan, T., Maltese, M., Lloyd. K.,
(2003). Closing The Gap?: Admissions & Enrollments at the Texas Public Flagships Before and After Affirmative Action” mimeo.
55
UC Irvine Office of Equal Employment and Diversity. (2002). A Brief History of Affirmative Action. Retrieved from http://www.oeod.uci.edu/aa.html
United States Census Bureau. Current Population Survey [Data file]. Available from
http://www.ceprdata.org/index.php
United States Census Bureau. (2020). State Fact Sheets – Oregon. Retrieved from http://quickfacts.census.gov/qfd/states/41000.html
United States Census Bureau. (2010). State Fact Sheets – Washington. Retrieved from


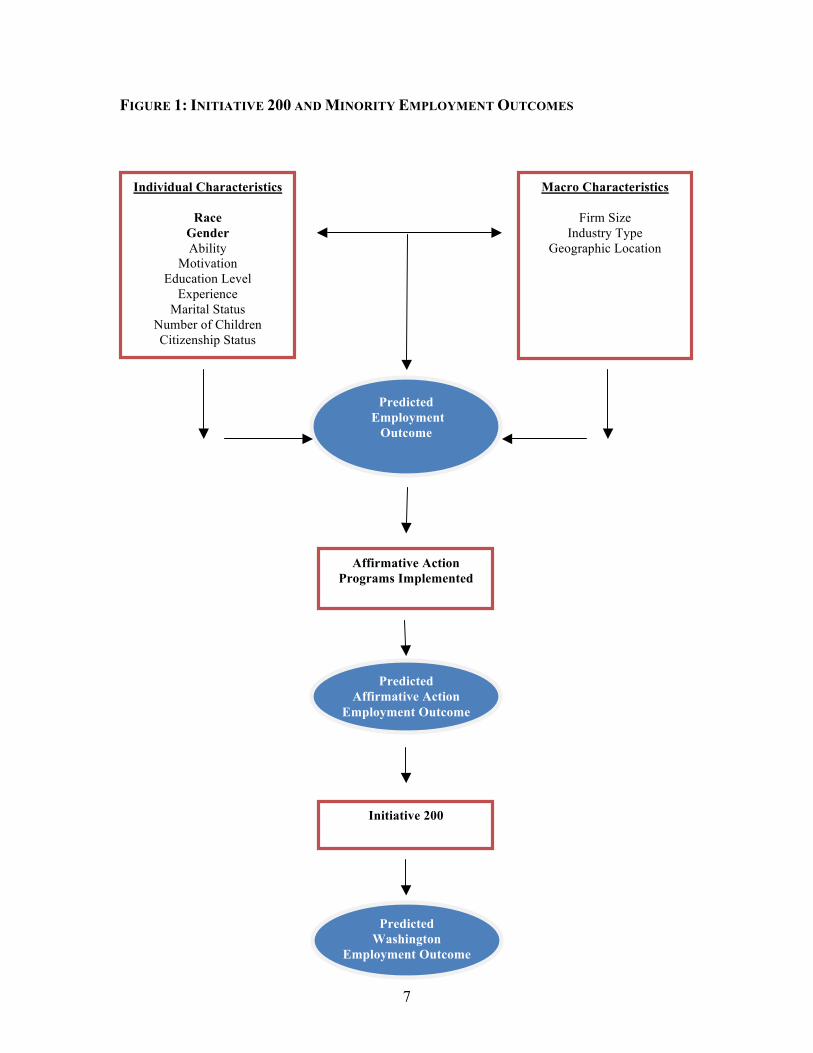

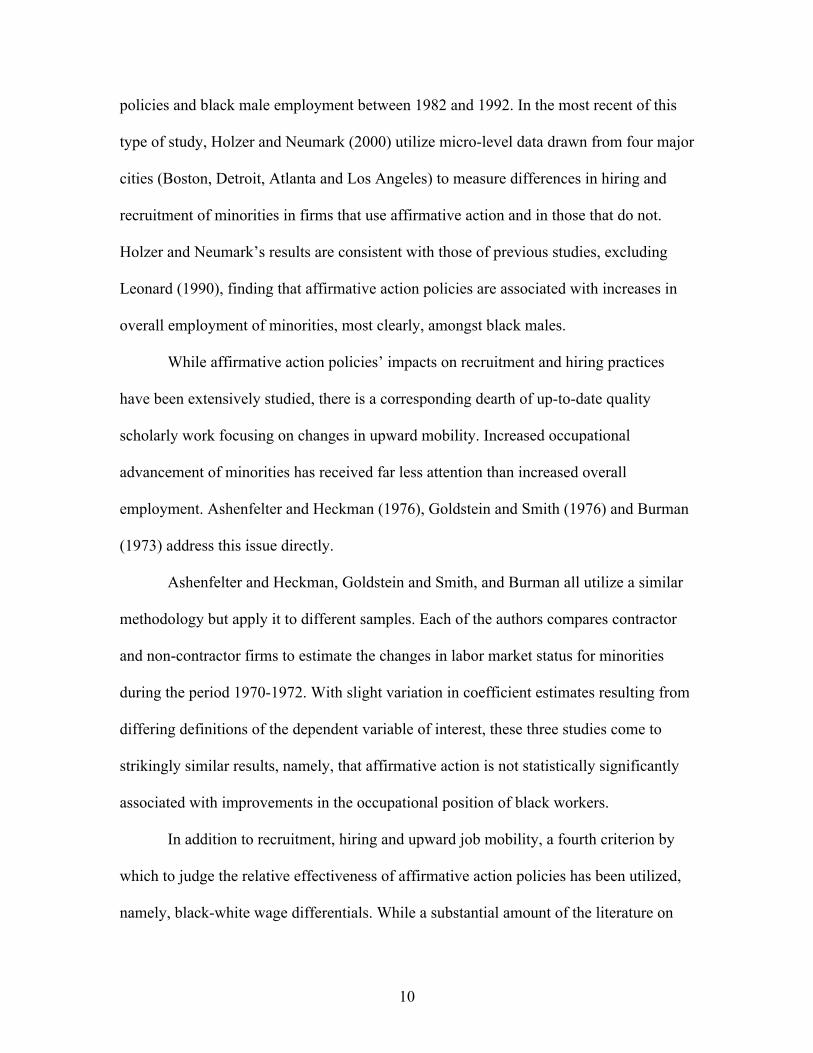


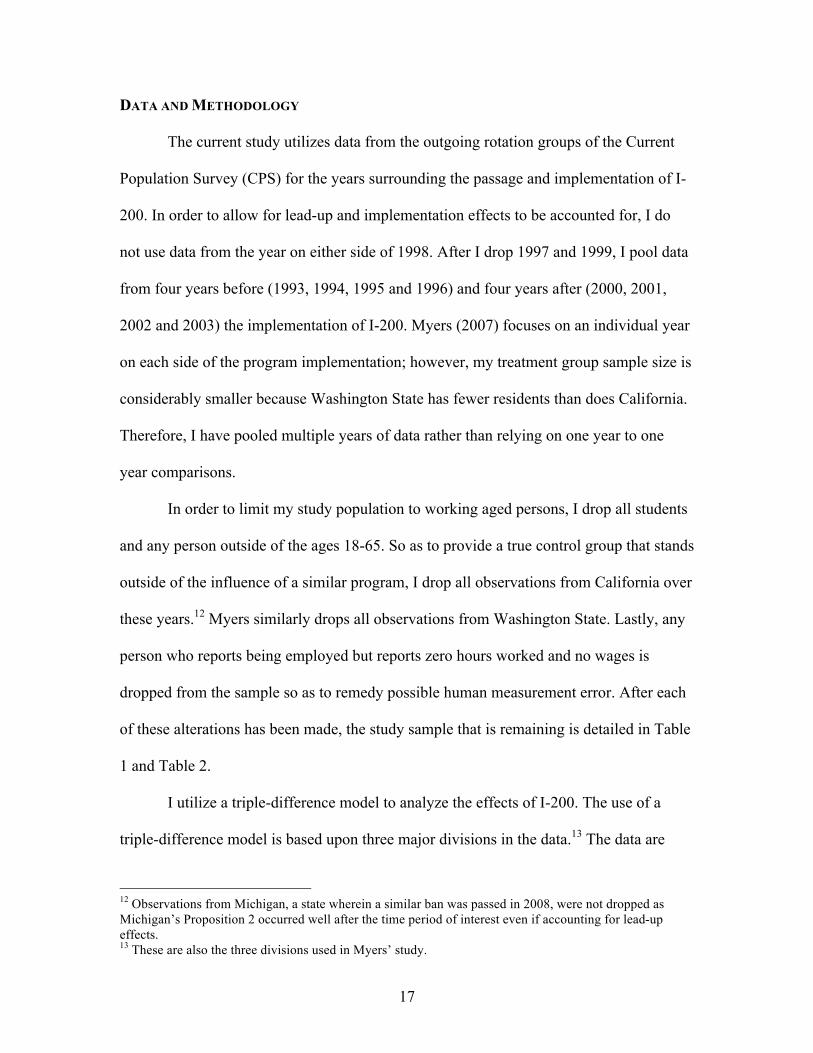


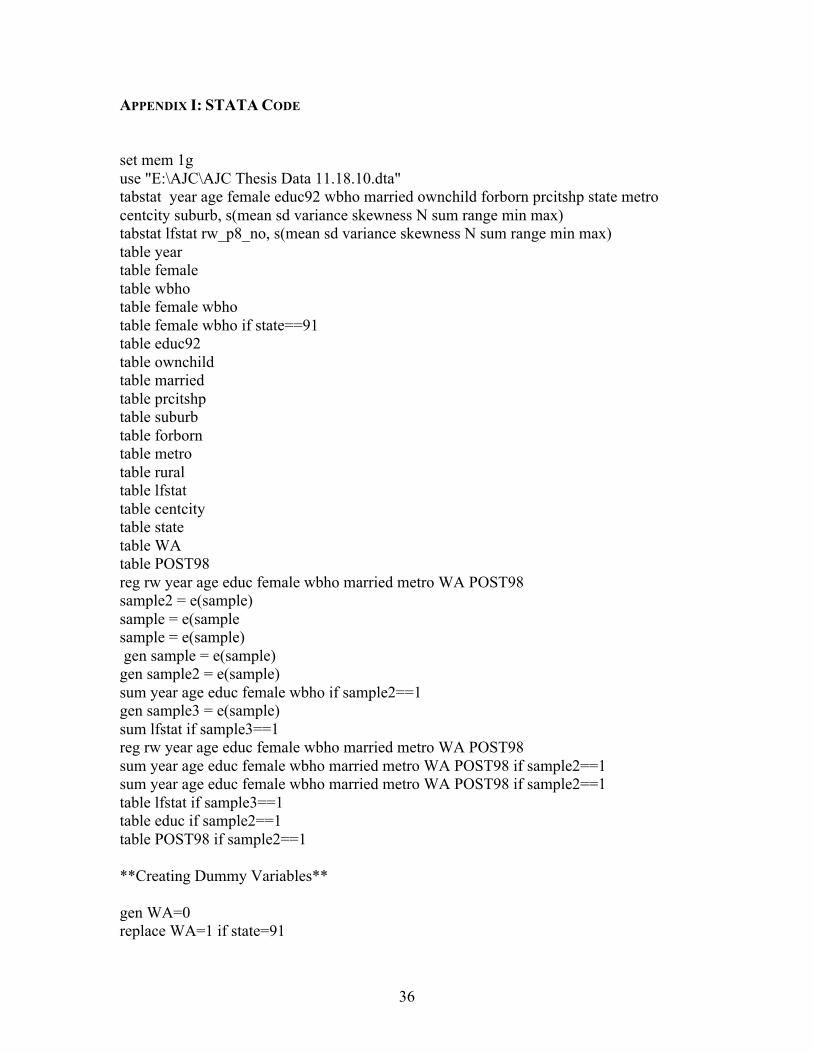
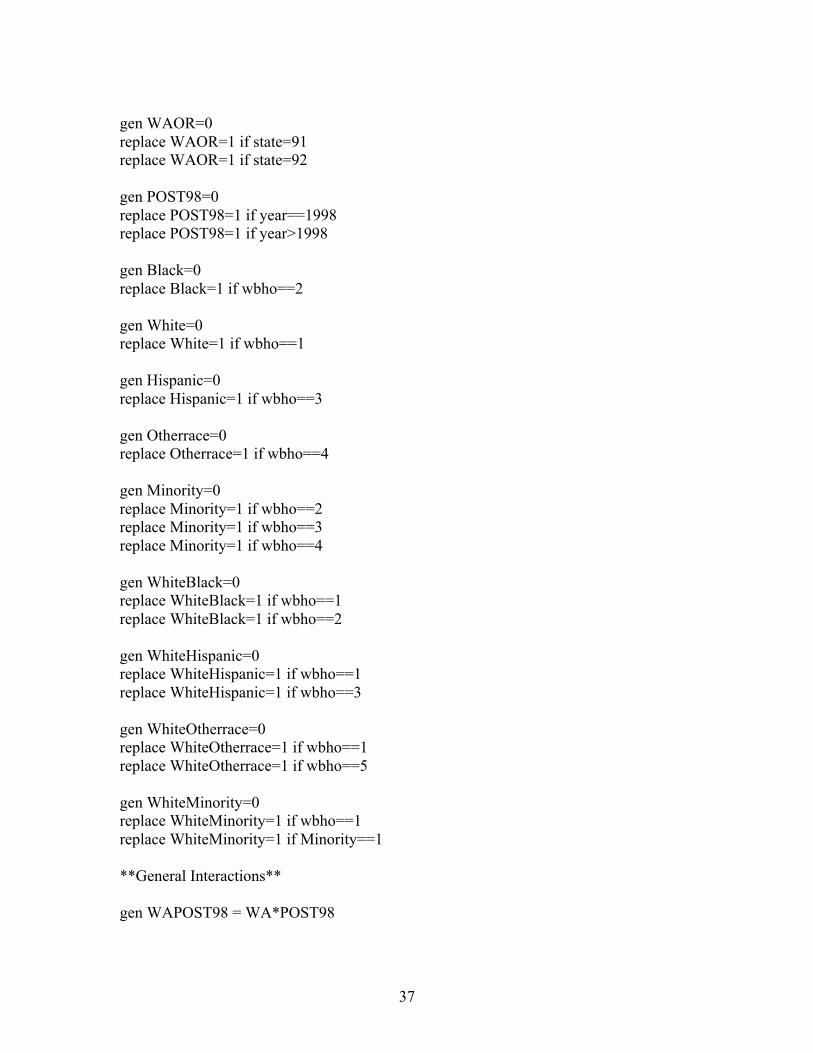


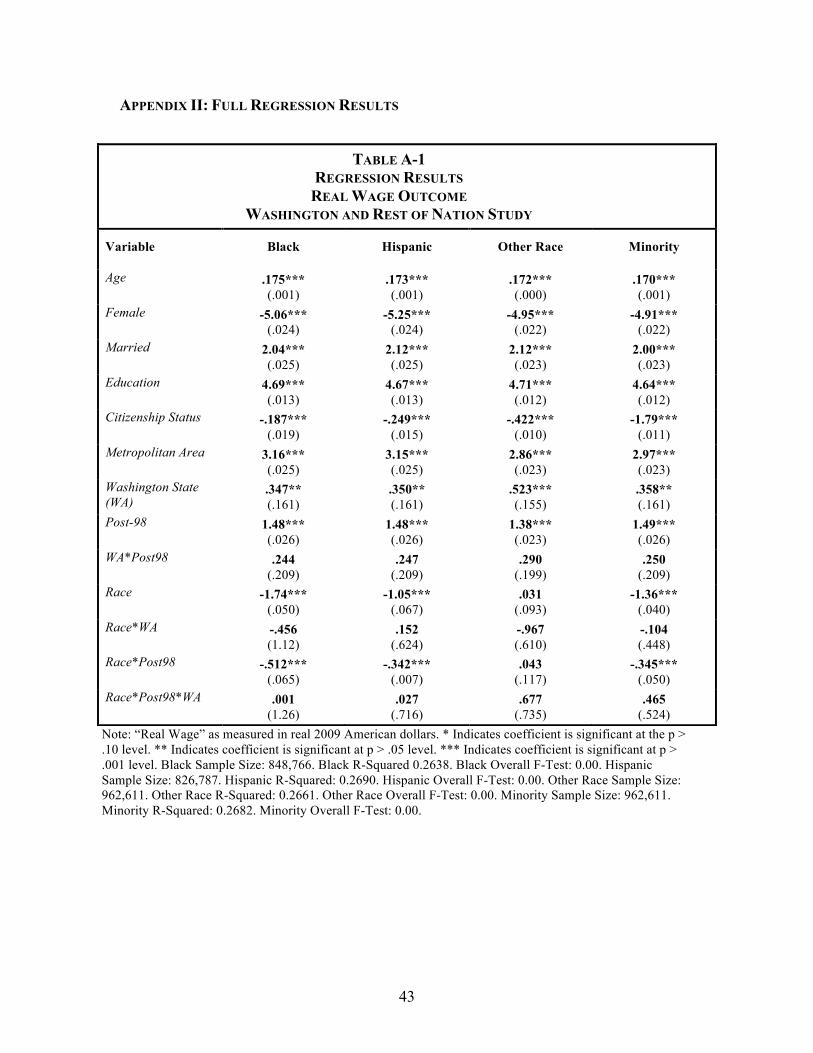

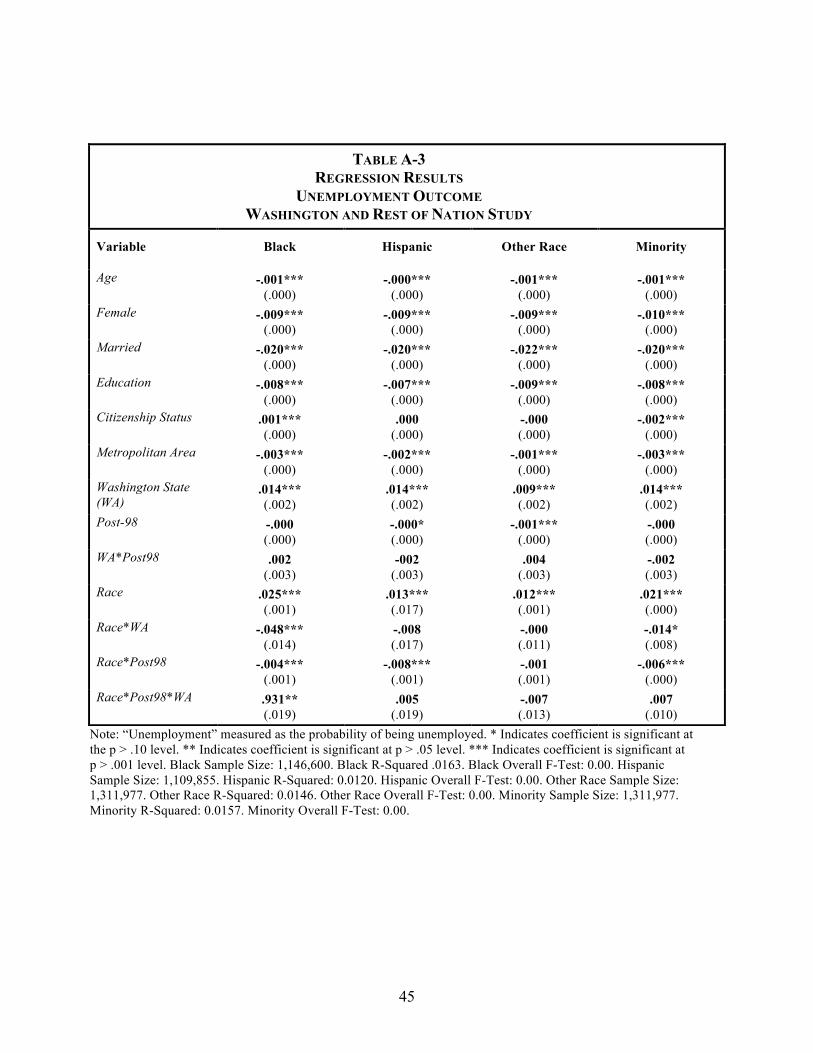


![35 Affirmative Action Employment Act 29 of 1998[1]](https://static.documents.pub/doc/80x56/577d1e821a28ab4e1e8ea6b4/35-affirmative-action-employment-act-29-of-19981.jpg)


