‘AFFO PROD Endpo Recomm Ground For Wom 2018. ORDABLE DUCT AVA oint Surv mended cita Work and U men (ANF4 E NUTRIT AILABILIT vey Repo ation: University o W) product TIOUS FO TY AND C ort – Mar f Ghana. En availability OODS FO CONSUM rch 2018 ndpoint Surv y and consu R WOME MPTION S 8 vey Report: umption stud EN (ANF4 STUDY Affordable dy. Accra, G 4W) ‐ GIZ e Nutritious Ghana; Mar Z‘ Food rch
Transcript
‘AFFO
PROD
Endpo
Recomm
Ground
For Wom
2018.
ORDABLE
DUCT AVA
oint Surv
mended cita
Work and U
men (ANF4
E NUTRIT
AILABILIT
vey Repo
ation:
University of
W) product
TIOUS FO
TY AND C
ort – Mar
f Ghana. En
t availability
OODS FO
CONSUM
rch 2018
ndpoint Surv
y and consu
R WOME
MPTION S
8
vey Report:
umption stud
EN (ANF4
STUDY
Affordable
dy. Accra, G
4W) ‐ GIZ
e Nutritious
Ghana; Mar
Z‘
Food
rch
ANF4W E
COORD
Partners
Funding
INVEST
Princip
Fabian
Daniel
Co‐Inv
James
Nicolai
Bradle
Nathan
Endpoint Surv
DINATION
s
TIGATORS
pal Investig
n Rohner
B Sarpong
vestigators
P Wirth
i Petry
y A Woodru
niel Boaten
ey, Ghana, 20
N AND IMP
S AND INS
ators
uff
g
017
PLEMENT
STITUTION
Ground
Univers
Ground
Ground
Ground
Univers
TING AGEN
NAL AFFIL
Work
sity of Ghan
Work
Work
Work
sity of Ghan
NCIES
IATIONS
a
a
‐ ii ‐
ANF4W Endpoint Survey, Ghana, 2017 ‐ iii ‐
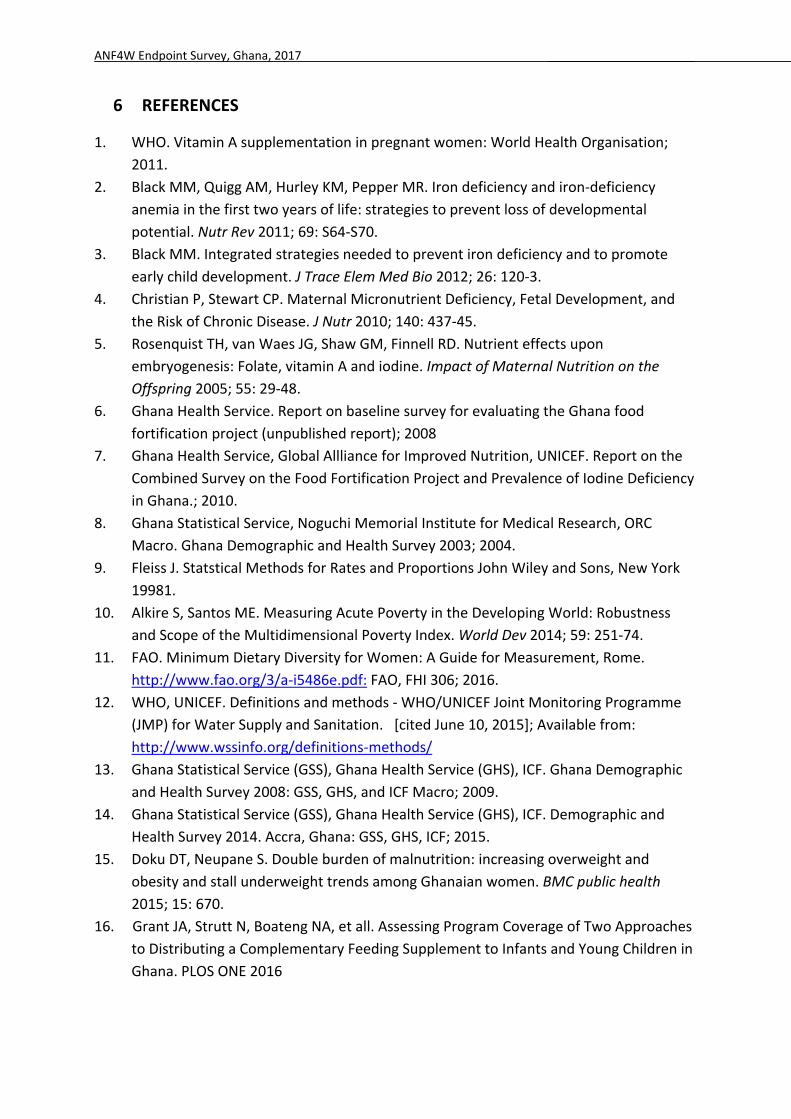
TABLE OF CONTENTS
List of figures ............................................................................................................................. iv
List of tables ............................................................................................................................... v
ACKNOWLEDGEMENTS ............................................................................................................. vi
ABBREVIATIONS ........................................................................................................................ vi
2 METHODOLOGY ................................................................................................................. 14 2.1 Survey design and sampling procedure .................................................................. 14 2.2 Study populations ................................................................................................... 15 2.3 Sample size determination ..................................................................................... 15 2.4 Approvals and ethical considerations ..................................................................... 16 2.5 Training of survey teams ........................................................................................ 16 2.6 Field work ................................................................................................................ 16 2.7 Data management and analysis .............................................................................. 17
2.7.1 Data analysis ............................................................................................ 17 2.7.2 Calculation of awareness, access, desirability, purchase and consumption
.................................................................................................................. 17 2.7.3 Calculation of wealth ............................................................................... 17 2.7.4 Minimum dietary diversity in women ...................................................... 17 2.7.5 Water and sanitation ............................................................................... 17
3 RESULTS ............................................................................................................................. 19 3.1 Access to mass media ............................................................................................. 21 3.2 Obaasima seal recognition ..................................................................................... 26 3.3 Information about consumer behaviour: Lola Milk biscuits .................................. 30 3.4 Information about consumer behaviour: Samba Shito sauce ................................ 33 3.5 Information about consumer behaviour: Tom Vita porridge ................................. 35
5 INTERPRETATION & RECOMMENDATIONS ....................................................................... 38 5.1 Interpretation of findings in more detail ................................................................ 40
Number food groups, mean 282 4.74 (4.41, 5.07) 292 4.17 (3.91, 4.43) <0.011 The n’s are un‐weighted numbers in each subgroup; sum of subgroups may not equal total because of missing data; 2 All figures are proportions except for mean age of respondents. Percentages are weighted for inaccurate EA size used
during the first stage of sampling; 3 CI=confidence interval, calculated taking into account the complex sampling design; 4Improved source = water from piped system, tube well or borehole, protected well, protected spring, rainwater collection,
or bottled water. Unimproved source = water from unprotected well, unprotected spring, tanker truck or cart, surface
water or other; composite variable of main source of drinking water and treating water to make safe for drinking; 5Composite variable of toilet type and if toilet facilities are shared with non‐household members; 6 Minimum dietary diversity defined as consuming foods from ≥5 food groups in the past 24 hours.
A
3
F
b
y
si
M
e
(P
F
In
p
st
w
in
ANF4W Endpoint Su
3.1 Access to m
igure 2 gives the
both population g
oung women of r
ince among PW, o
More than half of
ither radio or TV.
PW 7%; YWRA 3%
igure 2 Women’s
n Figure 3, the sa
present the data
tratifications late
women compared
nformation broke
urvey, Ghana, 2017
mass media
different mass m
groups, television
reproductive age.
only 8% reported
the surveyed wo
. About 4% of PW
%; see supplement
s access to mass m
ame information
by geographic st
r on, e.g. by MPI
d to the overall f
n down by geogra
media channels ac
and radio are th
Although about
reading newspap
omen had access
W and 11% of YWR
tary table 1).
media, by pregna
is provided, but
tratification, desp
category): becaus
female populatio
aphy or other cat
ccessed by PW an
he dominant sour
one fifth of YWRA
pers.
to both TV and r
RA had access to
nt women (PW) a
broken down fo
pite it not being
se of the way the
on in these muni
egories.
nd YWRA without
rces of informatio
A read the newsp
radio and about o
all media channe
and young wome
r each of the tw
completely corr
e PW were selecte
icipalities on Gha
t frequencies, wh
on, followed by so
paper, this media
one quarter of PW
els and few report
en of reproductive
o surveyed muni
rect from a statis
ed, they are highl
ana. However, fo
hich are presented
ocial media/ inte
is a rather scarce
W and one third o
ted not accessing
e age (YWRA), Gh
icipalities, Sunyan
stical standpoint
y over‐represente
or programmatic
d in Figure 5. Sim
rnet, which is mo
e source of inform
of YWRA had acc
any of the four m
hana 2017
ni and Tamale. Pl
(and this will al
ed in the overall s
reasons, it may
‐ 2
milar to baseline f
ore popular amon
mation, in particul
ess to internet an
mass media sourc
lease note that w
so apply for oth
sample of surveye
be useful to hav
21
for
ng
lar
nd
es
we
er
ed
ve
A
T
p
o
n
M
F
F
ANF4W Endpoint Su
Television and rad
presents access to
of poor women h
ewspaper, which
More detailed info
igure 3 Women’s
igure 4 Women’s
urvey, Ghana, 2017
dio remain highly
o mass media by p
ad no access to a
is a medium not
ormation stratified
s access to mass m
s access to mass m
predominant in
poor and non‐poo
any mass media
used by poor wo
d by municipalitie
media, by Sunyan
media, by poor an
both regions. Soc
or groups. Of note
channel compare
omen at all and so
es or MPI is availa
ni and Tamale mu
nd non‐poor strat
cial media/ intern
e, poor women ha
ed to non‐ poor
ocial media, which
ble in supplemen
unicipalities, Ghan
tification, Ghana
net is a more imp
ad less access to
women (12.6% v
h is a medium use
ntary table 2 and 3
na 2017
2017
portant medium
mass media chan
vs. 2.6%). The diff
ed much less by p
3, respectively.
in Sunyani than i
nels overall and a
ference is especia
oor compared to
‐ 2
in Tamale. Figure
a higher proportio
ally remarkable f
non‐ poor wome
22
e 4
on
for
en.
ANF4W E
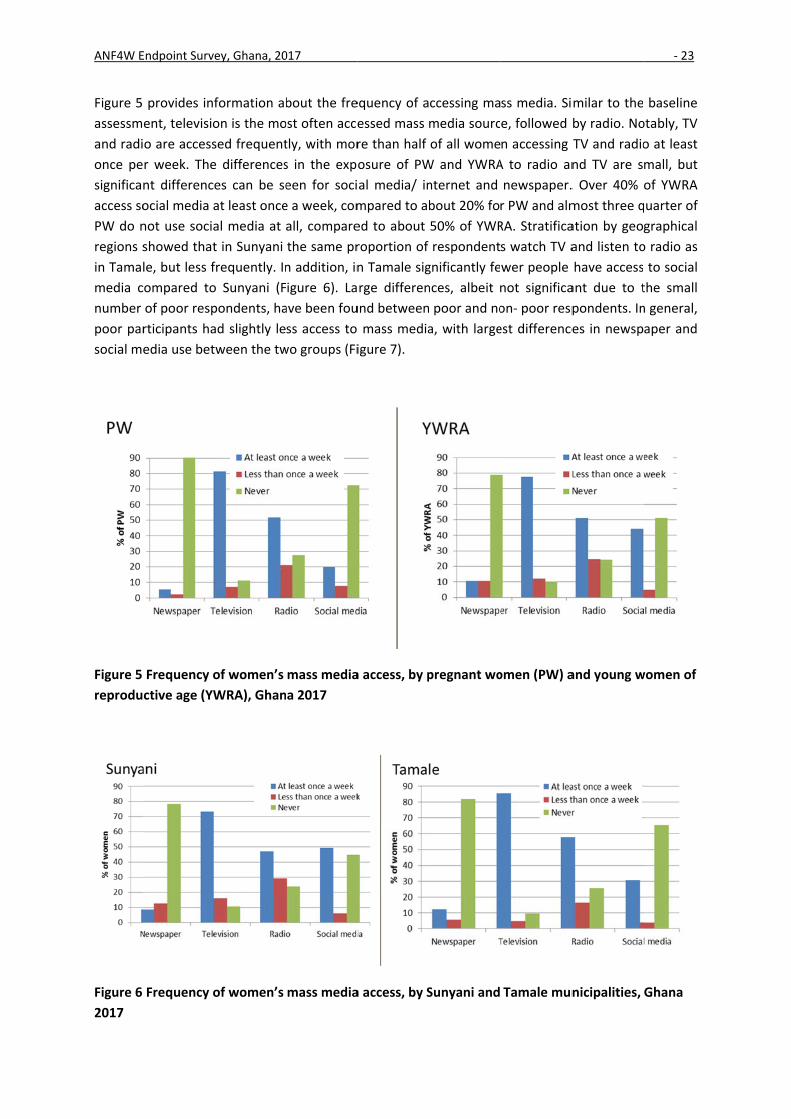
Figure 5
assessm
and radi
once pe
significa
access so
PW do n
regions s
in Tama
media c
number
poor par
social m
Figure 5
reprodu
Figure 6
2017
Endpoint Surv
provides inf
ent, televisio
o are access
r week. The
nt difference
ocial media a
not use socia
showed that
le, but less f
compared to
of poor resp
rticipants ha
edia use bet
Frequency o
ctive age (YW
Frequency o
ey, Ghana, 20
formation ab
on is the mo
sed frequent
e differences
es can be se
at least once
al media at
t in Sunyani
frequently. In
o Sunyani (F
pondents, ha
ad slightly le
tween the tw
of women’s
WRA), Ghan
of women’s
017
bout the fre
ost often acce
tly, with mor
s in the exp
een for soci
e a week, com
all, compare
the same pr
n addition, in
igure 6). La
ave been fou
ss access to
wo groups (Fi
mass media
a 2017
mass media
equency of a
essed mass
re than half
osure of PW
al media/ in
mpared to a
ed to about
roportion of
n Tamale sig
rge differen
und between
mass media
igure 7).
a access, by p
a access, by S
ccessing ma
media sourc
of all wome
W and YWRA
nternet and
bout 20% fo
50% of YWR
respondent
gnificantly fe
nces, albeit
poor and no
a, with large
pregnant wo
Sunyani and
ss media. Si
e, followed
n accessing
A to radio an
newspaper.
r PW and alm
RA. Stratifica
s watch TV a
wer people
not significa
on‐ poor resp
est difference
omen (PW) a
Tamale mun
milar to the
by radio. No
TV and radio
nd TV are s
. Over 40%
most three q
ation by geo
and listen to
have access
ant due to t
pondents. In
es in newsp
and young w
nicipalities,
‐ 23
baseline
otably, TV
o at least
mall, but
of YWRA
quarter of
graphical
o radio as
to social
the small
n general,
aper and
women of
Ghana
ANF4W E
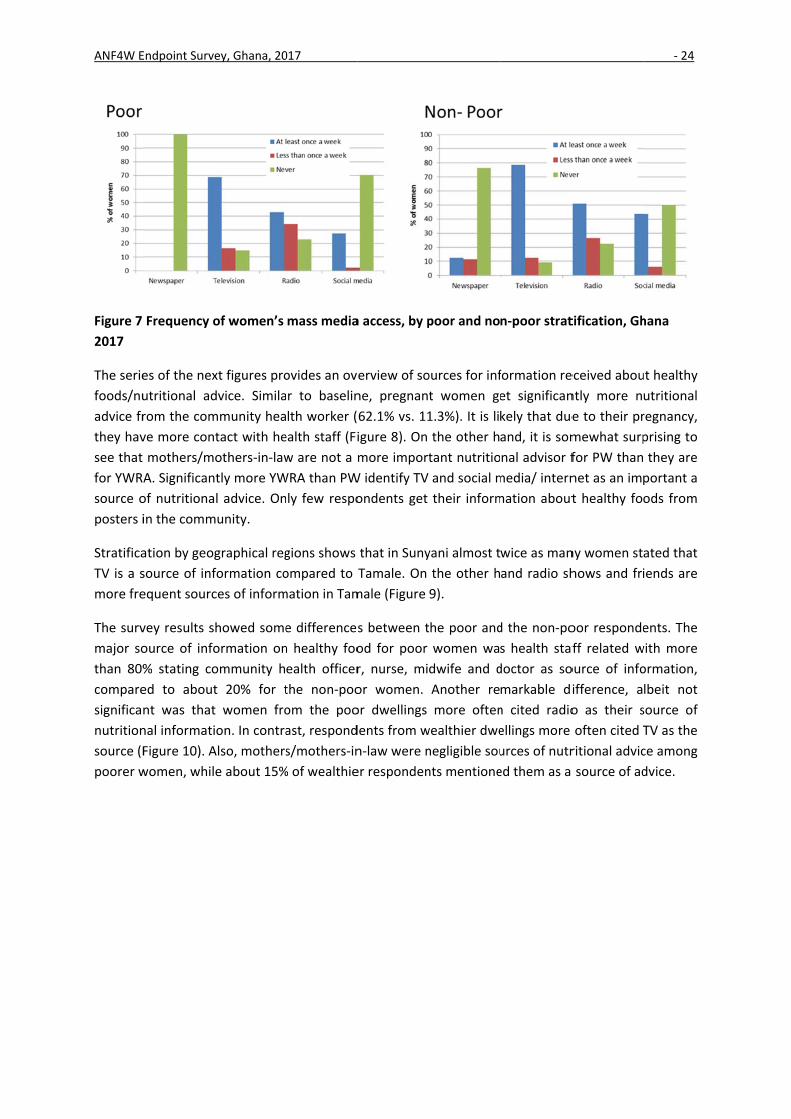
Figure 7
2017
The serie
foods/nu
advice fr
they hav
see that
for YWR
source o
posters i
Stratifica
TV is a s
more fre
The surv
major so
than 80%
compare
significa
nutrition
source (F
poorer w
Endpoint Surv
Frequency o
es of the nex
utritional ad
rom the com
ve more con
mothers/m
A. Significan
of nutritiona
in the comm
ation by geog
source of inf
equent sourc
vey results s
ource of info
% stating co
ed to about
nt was that
nal informati
Figure 10). A
women, whil
ey, Ghana, 20
of women’s
xt figures pro
dvice. Simila
mmunity hea
tact with he
others‐in‐law
tly more YW
l advice. On
munity.
graphical reg
formation co
ces of inform
howed some
ormation on
ommunity h
t 20% for t
t women fro
ion. In contra
Also, mothers
e about 15%
017
mass media
ovides an ov
r to baselin
lth worker (
ealth staff (Fi
w are not a m
WRA than PW
ly few respo
gions shows
ompared to
mation in Tam
e differences
n healthy foo
ealth officer
the non‐poo
om the poo
ast, respond
s/mothers‐in
% of wealthie
a access, by p
erview of so
ne, pregnant
62.1% vs. 11
igure 8). On
more import
W identify TV
ondents get
that in Suny
Tamale. On
male (Figure
s between t
od for poor
r, nurse, mi
or women.
or dwellings
dents from w
n‐law were n
er responden
poor and no
ources for inf
t women ge
1.3%). It is li
the other h
tant nutritio
and social m
their inform
yani almost t
the other h
9).
he poor and
women wa
dwife and d
Another re
more often
wealthier dwe
negligible sou
nts mentione
n‐poor strat
formation re
et significan
kely that due
and, it is som
nal advisor f
media/ intern
mation about
wice as man
and radio sh
d the non‐po
s health staf
doctor as so
markable di
n cited radio
ellings more
urces of nutr
ed them as a
tification, Gh
eceived abou
ntly more n
e to their pr
mewhat surp
for PW than
net as an im
t healthy fo
ny women st
hows and fri
oor responde
ff related w
ource of info
ifference, a
o as their s
often cited T
ritional advic
source of ad
‐ 24
hana
ut healthy
utritional
regnancy,
prising to
they are
portant a
ods from
ated that
iends are
ents. The
with more
ormation,
lbeit not
source of
TV as the
ce among
dvice.
ANF4W E
Figure 8
women
Figure 9
Ghana 2
Endpoint Surv
Source of in
of reproduc
Source of in
2017.
ey, Ghana, 20
nformation f
tive age (YW
nformation f
017
for choosing
WRA), Ghana
for choosing
healthy foo
a 2017
healthy foo
od, by pregna
od, by Sunya
ant women (
ni and Tama
(PW) and yo
ale municipa
‐ 25
oung
alities,
ANF4W E
Figure 10
Ghana 2
3.2 O
As show
*Only the
suppleme
Figure 1
results s
by telev
Obaasim
campaig
almost 6
(n= 43) o
59% pre
were rel
municipa
bought
Obaasim
Obaasim
almost a
mainly b
by pregn
Obaasim
living in
wealthie
with the
Endpoint Surv
0 Source of
2017.
baasima se
wn in
e 5 most cited
entary tables
11 almost 70
showed that
vision. In Ta
ma seal state
gns. Although
60% of those
of the surve
efer those pr
ated to the
ality showed
Obaasima p
ma products
ma products
all women (
because of th
nancy status
ma, many of
poor hous
er household
e Obaasima s
ey, Ghana, 20
information
eal recognit
d response op
0% of respon
the most su
male, but n
ed that they
h awareness
e who have
yed women
roducts over
health benef
d significant
products did
in Sunyani. I
over other
n=21) who
he good pro
s showed th
them at the
seholds had
ds (74.9%) a
seal (see sup
017
for choosin
tion
ptions shown
ndents (n= 3
uccessful ma
not in Sunya
y had seen
was high, o
seen or hea
had ever bo
r products w
fits or good
t differences
d not differ,
nterestingly,
products, w
had ever bo
duct quality
hat significan
health clinic
ever heard
nd none of
plementary t
g healthy fo
for better vis
322) had eve
rketing tools
ani, about 8
the Obaasim
nly a few of
rd of the se
ought produ
without the s
quality of th
s. Although
, considerab
, only 39% o
with the ma
ought (n=23
and health
ntly more p
c/ from the
d of Obaasi
the women
tables 5 and
ood, by poor
sibility, all cite
er heard of
s have been
8% of respo
ma seal on
the women
al did not kn
cts carrying
seal. Most o
he products c
the propor
bly more wo
of the consum
in reason be
) the produc
benefits of O
regnant wo
health office
ma (30.4%)
with risk of
7) .
and non‐po
ed responses
or seen the
billboards a
ndents who
T‐shirts duri
knew the m
now the mea
the Obaasim
f the reason
carrying the
rtion of wom
omen had e
mers in Suny
eing preferr
cts preferred
Obaasima pr
men had ev
er. Also, sign
compared
f poverty ev
oor stratificat
are presente
e Obaasima
and posters,
o were awar
ing some pr
meaning of O
aning. Less t
ma seal and
ns for the pr
seal. Stratifi
men who h
ever heard
yani stated p
red taste. In
d those ove
roducts. Stra
ver seen or
nificantly les
to women
ver bought a
‐ 26
tion,
d in
seal. The
followed
re of the
romotion
Obaasima,
than 15%
of those,
reference
cation by
ave ever
of/ seen
preferring
n Tamale,
er others,
atification
heard of
s women
living in
a product
A
*
F
ANF4W Endpoint Su
Only the 5 most cit
igure 11 Obaasim
urvey, Ghana, 2017
ted response optio
ma seal recognitio
ons shown for bette
on, all women, Gh
er visibility, all cited
hana 2017
d responses are pre
_
esented in supplemmentary tables
_______
____‐ 27
A
*
F
ANF4W Endpoint Su
Only the 5 most cit
igure 12 Obaasim
urvey, Ghana, 2017
ted response optio
ma seal recognitio
ons shown for bette
on in Sunyani mun
er visibility, all cited
nicipality, Ghana
d responses are pre
2017.
_
esented in supplemmentary tables
___________‐ 28
A
*
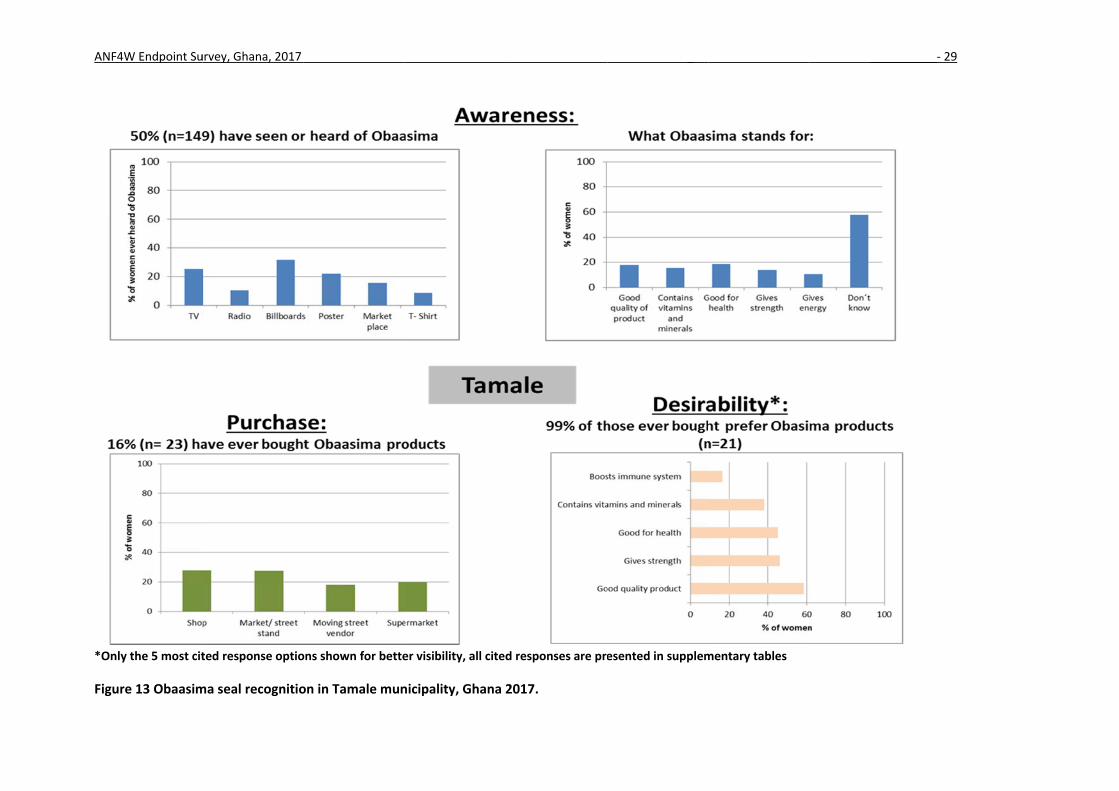
F
ANF4W Endpoint Su
Only the 5 most cit
igure 13 Obaasim
urvey, Ghana, 2017
ted response optio
ma seal recognitio
ons shown for bette
on in Tamale mun
er visibility, all cited
nicipality, Ghana 2
d responses are pre
2017.
_
esented in supplemmentary tables
___________‐ 29
ANF4W E
3.3 In
Although
status, s
(Figure 1
‘Digestiv
most of
respond
Currentl
the usua
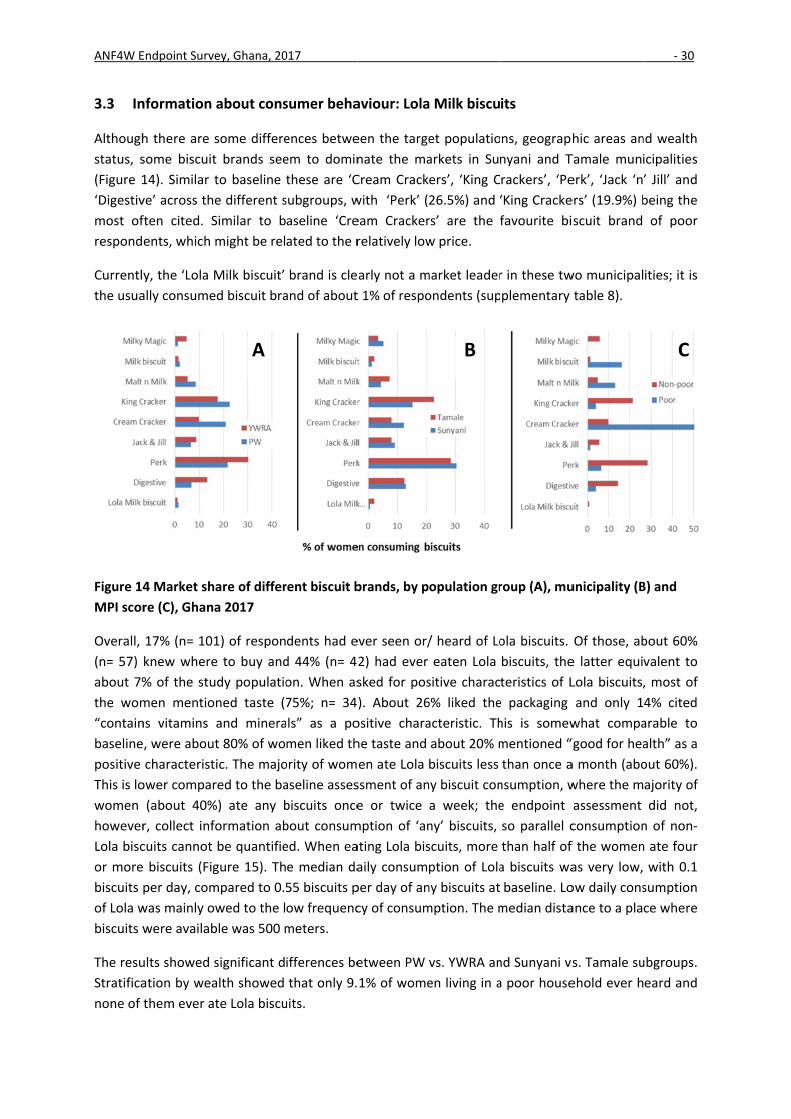
Figure 14
MPI scor
Overall,
(n= 57)
about 7%
the wom
“contain
baseline
positive
This is lo
women
however
Lola bisc
or more
biscuits
of Lola w
biscuits w
The resu
Stratifica
none of
Endpoint Surv
nformation
h there are
some biscuit
14). Similar t
ve’ across th
ften cited. S
ents, which
y, the ‘Lola M
ally consume
4 Market sh
re (C), Ghana
17% (n= 101
knew where
% of the stu
men mentio
ns vitamins
, were abou
characterist
ower compar
(about 40%
r, collect inf
cuits cannot
e biscuits (Fig
per day, com
was mainly o
were availab
ults showed s
ation by wea
them ever a
ey, Ghana, 20
about cons
some differe
t brands see
to baseline
e different s
Similar to b
might be rel
Milk biscuit’
ed biscuit bra
are of differ
a 2017
1) of respon
e to buy and
udy populatio
ned taste (7
and minera
t 80% of wo
tic. The majo
red to the ba
%) ate any b
formation ab
be quantifie
gure 15). Th
mpared to 0.
wed to the l
ble was 500 m
significant d
alth showed
te Lola biscu
A
017
sumer beha
ences betwe
em to domin
these are ‘C
subgroups, w
aseline ‘Cre
ated to the r
brand is cle
and of about
rent biscuit b
dents had e
d 44% (n= 4
on. When as
75%; n= 34
als” as a po
men liked th
ority of wom
aseline asses
biscuits once
bout consum
ed. When ea
e median da
55 biscuits p
ow frequenc
meters.
ifferences be
that only 9.
uits.
aviour: Lola
een the targe
nate the ma
Cream Crack
with ‘Perk’ (
eam Cracker
relatively low
arly not a m
t 1% of respo
brands, by p
ever seen or/
2) had ever
sked for pos
). About 26
ositive chara
he taste and
en ate Lola
ssment of an
e or twice
mption of ‘an
ating Lola bis
aily consum
per day of an
cy of consum
etween PW
1% of wome
a Milk biscu
et populatio
arkets in Su
ers’, ‘King C
26.5%) and
rs’ are the
w price.
market leader
ondents (sup
opulation gr
/ heard of Lo
eaten Lola
sitive charac
6% liked the
acteristic. Th
about 20% m
biscuits less
ny biscuit con
a week; the
ny’ biscuits,
scuits, more
ption of Lola
ny biscuits at
mption. The m
vs. YWRA an
en living in a
B
its
ns, geograp
nyani and T
rackers’, ‘Pe
‘King Cracke
favourite bi
r in these tw
plementary
roup (A), mu
ola biscuits.
biscuits, the
teristics of L
e packaging
his is somew
mentioned “
than once a
nsumption, w
e endpoint
so parallel c
than half of
a biscuits wa
baseline. Lo
median dista
nd Sunyani vs
a poor house
hic areas an
Tamale muni
erk’, ‘Jack ‘n
ers’ (19.9%) b
iscuit brand
wo municipal
table 8).
unicipality (B
Of those, ab
e latter equi
Lola biscuits,
and only 1
what compa
“good for hea
a month (abo
where the m
assessment
consumption
f the women
as very low,
ow daily cons
ance to a pla
s. Tamale su
ehold ever h
‐ 30
nd wealth
icipalities
’ Jill’ and
being the
of poor
ities; it is
B) and
bout 60%
valent to
, most of
4% cited
arable to
alth” as a
out 60%).
ajority of
did not,
n of non‐
n ate four
with 0.1
sumption
ce where
ubgroups.
eard and
C
ANF4W E
Due to t
done for
Lola bisc
PW had
biscuits
access, b
Sunyani.
compare
month
consump
once a m
(63.4%).
Figure 1
Endpoint Surv
the small nu
r all variable
cuits and kne
only one b
per serving
but significa
. In Sunyani
ed to Tamale
(83.5%), mo
ption was si
month, but t
5 Frequency
ey, Ghana, 20
mber of res
es. Subgroup
ew where to
iscuit. This w
. Stratificatio
antly more w
biscuits hav
e. The vast m
ost of them
gnificantly h
the amount
y and amoun
017
pondents co
p analyses sh
buy them co
was differen
on by distri
women livin
e been cons
majority of t
m 4 or mor
higher with
consumed w
nt of Lola bis
onsuming Lo
howed that
ompared to
nt for YWRA
ct showed n
g in Tamale
umed less fr
he women l
re per serv
only 23.6%
was lower, m
scuit consum
ola biscuits s
significantly
PW. When e
, more than
no significan
e saw Lola b
requently, bu
iving in Suny
ving (70.4%)
of women c
most of them
mption, all wo
ubgroup ana
y more YWR
eating Lola b
n half of the
nt difference
biscuits on p
ut in higher q
yani ate bisc
. In Tamale
consuming t
m having on
omen, Ghan
alyses have
RA had ever
iscuits almo
em had four
es in aware
posters com
quantities pe
cuits less tha
e, the frequ
the biscuits
ne biscuit pe
na 2017
‐ 31
not been
heard of
st 70% of
or more
ness and
pared to
er serving
an once a
uency of
less than
er serving
A
*
F
ANF4W Endpoint Su
Only up to the 5 m
igure 16 Key outc
urvey, Ghana, 2017
most cited response
comes for Lola bis
e options shown for
scuits, all women
r better visibility, a
n, Ghana 2017
all cited responses a
are presented in suupplementary table
es
‐ 32
ANF4W E
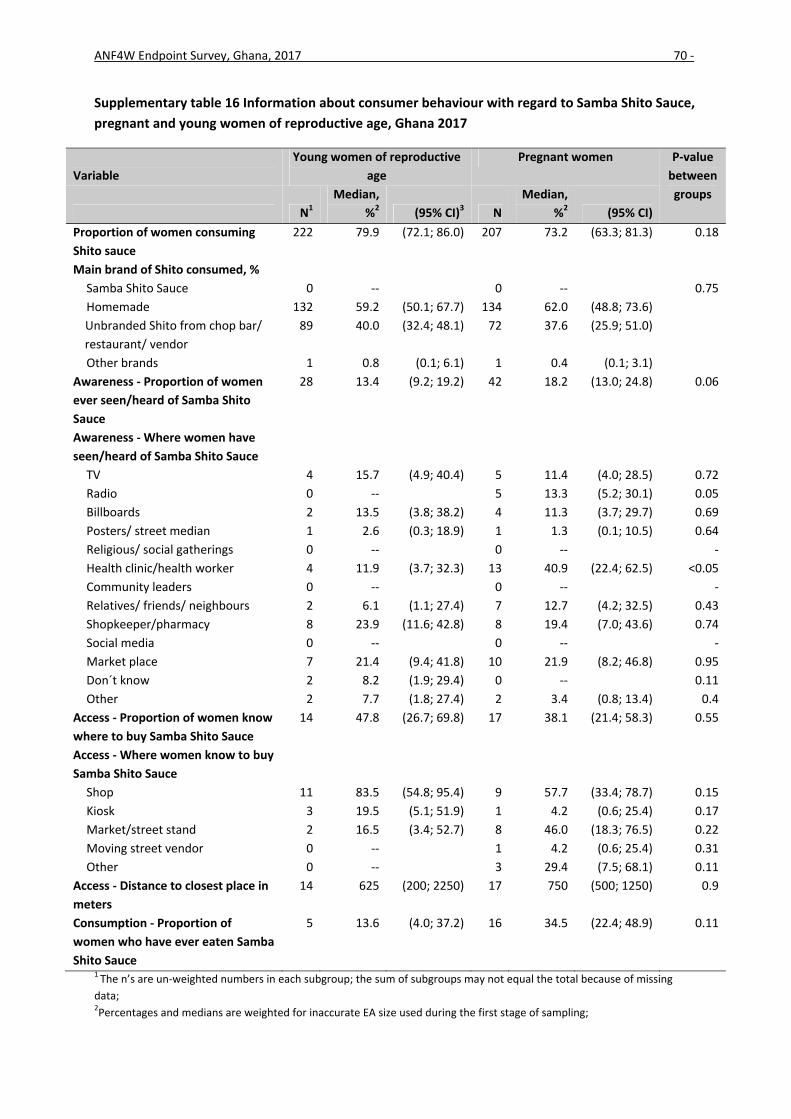
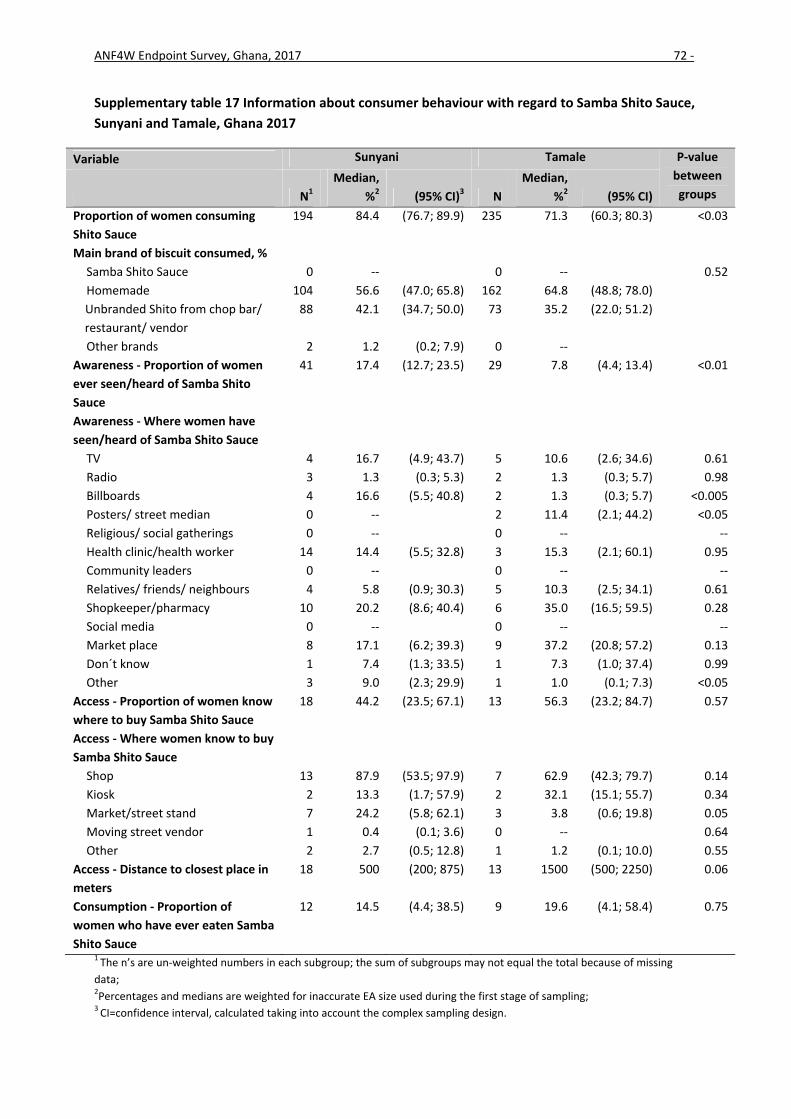
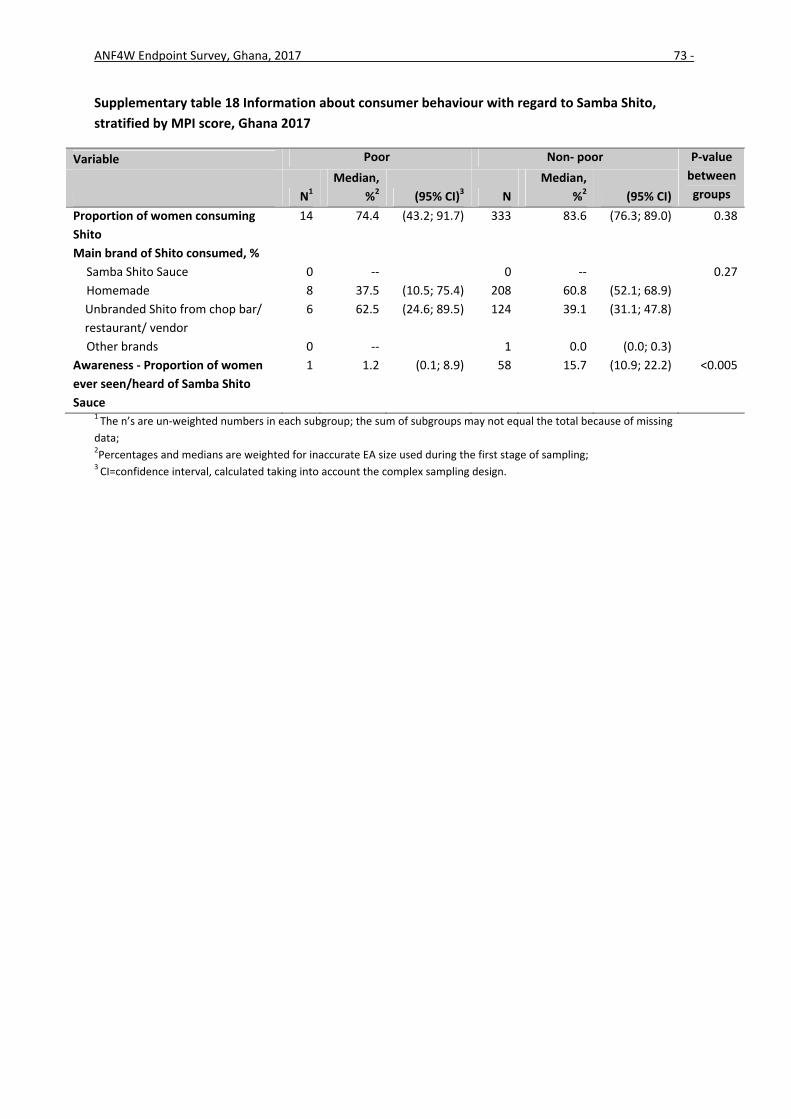
3.4 In
Almost 8
consumi
remainin
vendor.
Shito sa
“other”
respond
those, a
equivale
most of
surveyed
Most of
sachet p
equivale
assessed
househo
heard of
differenc
in the he
eat Shito
sub‐ gro
Figure 1
Endpoint Surv
nformation
80% of respo
ing Shito sau
ng 40% of
Similar to t
uce from a
Shito brand
ents had eve
about half kn
ent to 6% (n
the women
d population
the women
per serving (
ent to 0.3g p
d at baseline
old had ever
f and ever co
ces have bee
ealth clinic co
o sauce at al
up analyses
7 Frequency
ey, Ghana, 20
about cons
ondents rep
uce about 6
respondents
this, at base
shop/ resta
ds, none of
er heard of S
new where
= 31) and 2
who had ev
n ever purcha
n consuming
(see Figure 1
per day and
e (10g). Sub
r eaten Sam
onsumed Sam
en found bet
ompared to
ll and fewer
are presente
y and amoun
017
sumer beha
orted consu
60% stated t
s consumed
eline almost
urant. Less
f which wa
Samba Shito
to buy it an
2% (n= 21) o
ver consume
ased the pro
Samba Shit
17), which re
considerable
bgroup analy
ba Shito Sau
mba Shito, w
tween PW an
YWRA. Strat
were aware
ed in the ann
nt of Samba
aviour: Sam
ming Shito s
that the mai
mainly unb
all women
than 1% of
s Samba Sh
Sauce, main
nd one‐ qua
of the total s
ed Samba Sh
oduct.
to ate it less
esulted in a
e lower than
yses showed
uce. Due to
we did not co
nd YWRA, ex
tification by
e of Samba S
nex (supplem
Shito Sauce
mba Shito sa
sauce. As sh
in ‘brand’ th
branded Shi
consumed e
women rep
hito Sauce.
ly from relat
arter had ev
study popula
hito, received
s than once
median dai
n the media
d that none
the small n
onduct subgr
xcept that m
district show
Shito Sauce c
mentary table
consumptio
auce
own in Figu
hey consume
ito from a
either home
orted predo
Overall, 13
tives/ friends
ver eaten Sa
ation, respe
d it for free a
a month (>7
ily consumpt
n daily Shito
of the wom
umber of w
roup analyse
ore PW hear
wed that few
compared to
es 16‐18).
on, all wome
re 18, of the
e is homem
shop/ resta
emade or un
ominantly co
3.8% (n= 70
s or in the m
amba Shito,
ectively. Inte
and below 1
70%) and ha
tion of 0.02
o Sauce cons
men living i
women who
es for all varia
rd about Sam
wer women i
o Sunyani. Co
en, Ghana 20
‐ 33
e women
ade. The
aurant or
nbranded
onsuming
0) of the
market. Of
which is
restingly,
1% of the
alf or one
2 sachets,
sumption
n a poor
had ever
ables. No
mba Shito
n Tamale
onducted
017
A
*
F
ANF4W Endpoint Su
Only up to the 5 m
igure 18 Key outc
urvey, Ghana, 2017
most cited response
comes for Samba
e options shown for
Shito Sauce, Gha
r better visibility, a
ana 2017
all cited responses a
are presented in suupplementary table
es
‐ 34
ANF4W Endpoint Survey, Ghana, 2017 ‐ 35
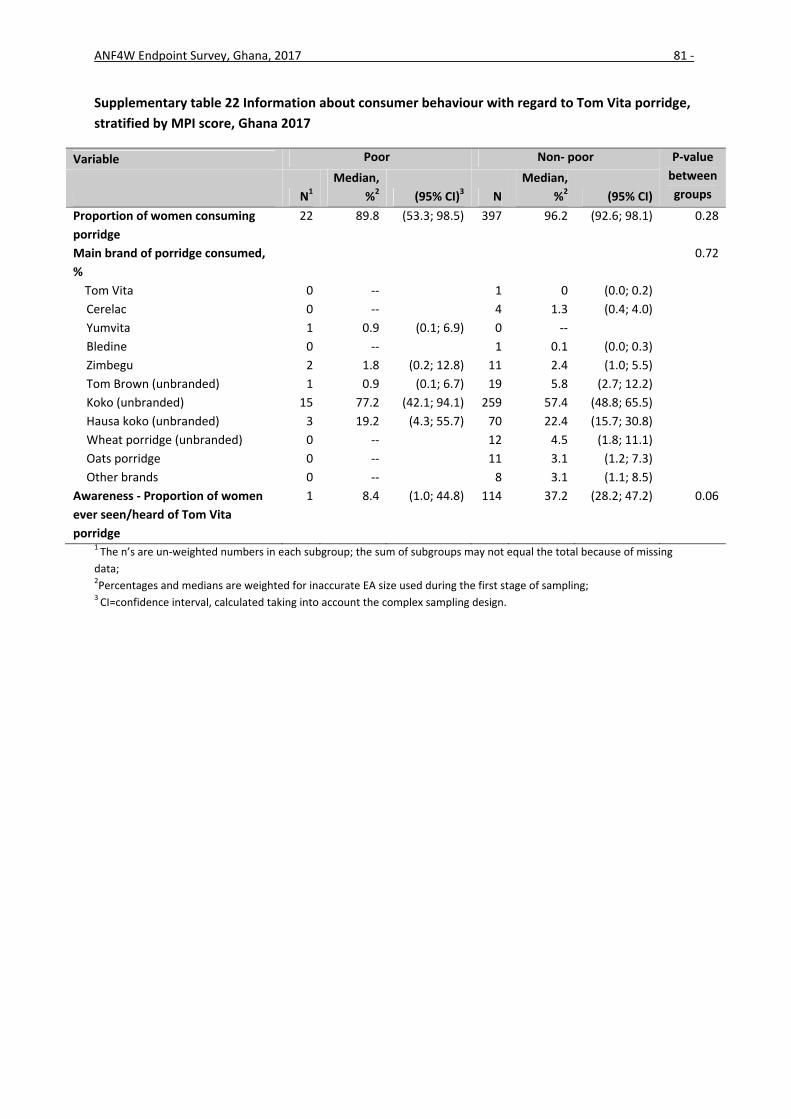
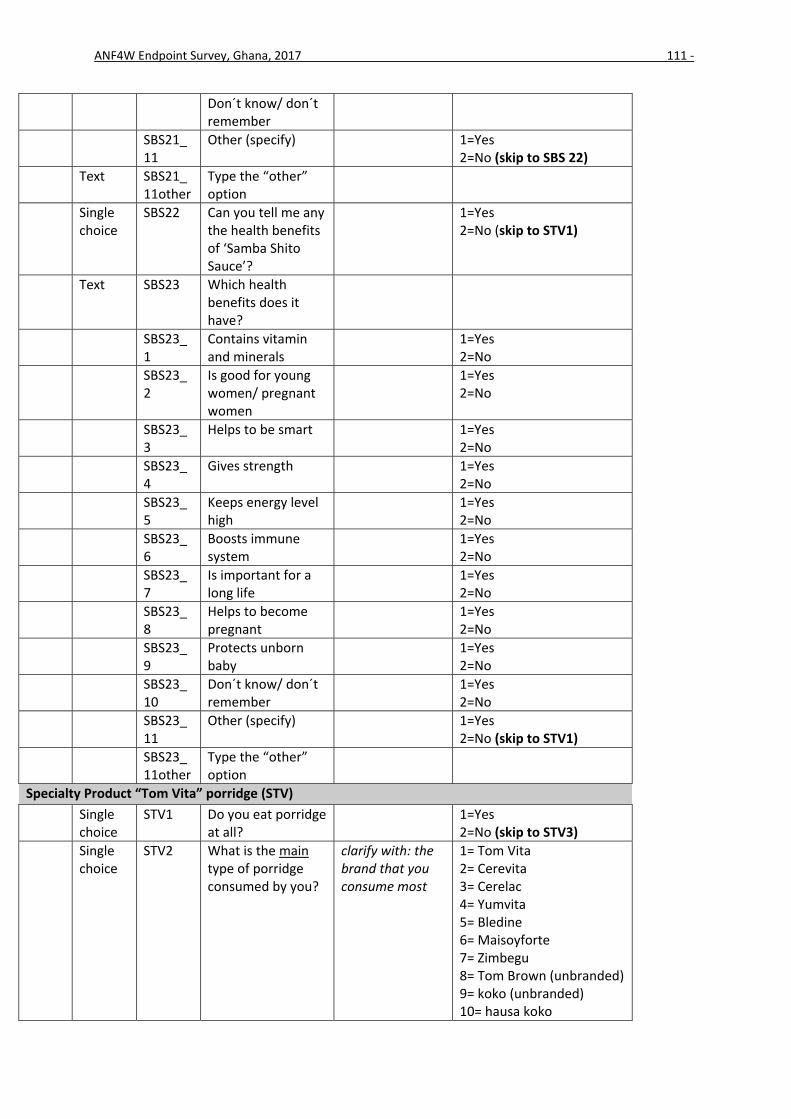
3.5 Information about consumer behaviour: Tom Vita porridge
Overall, 96% of the respondents eat porridge. As shown in Figure 19, only few women stated that
instant porridge was the main porridge they consumed. The most frequently mentioned instant
porridge was Zimbegu (Tom Brown). Only 1 woman mentioned TomVita as her predominantly
consumed porridge. The most frequently mentioned porridge was Koko (unbranded), which was
most popular in Tamale and among women living in poor households. Oats and wheat porridge was
reported to be consumed as the main porridge almost exclusively in Sunyani and by the non‐ poor
respondents (see Figure 19).
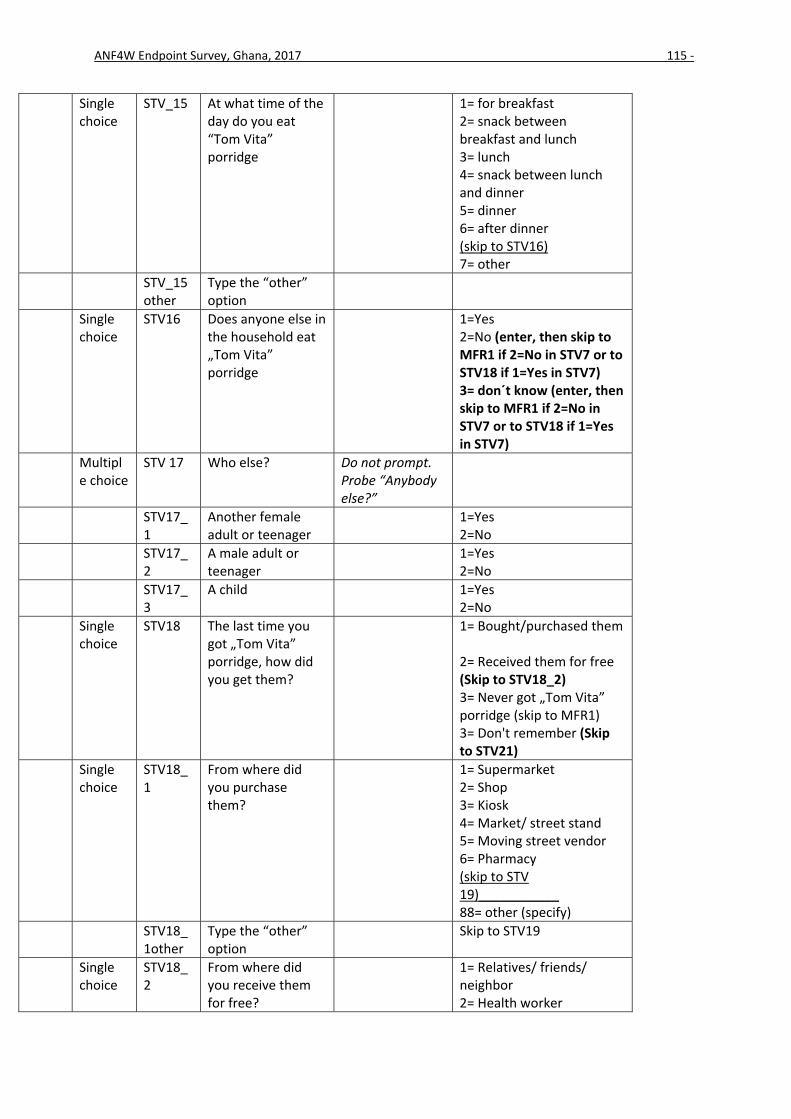
Overall, about 33% (n= 133) of the respondents had ever heard of TomVita porridge, mainly on TV
from the shopkeeper or in the market. Of those, about 50% (n= 53) knew where to buy TomVita and
less than one‐ fifth (about 4% of all respondents; n= 24) had ever eaten TomVita. Unlike Samba Shito
sauce, almost all women who had ever eaten TomVita also bought the product; only about 10%
received it for free.
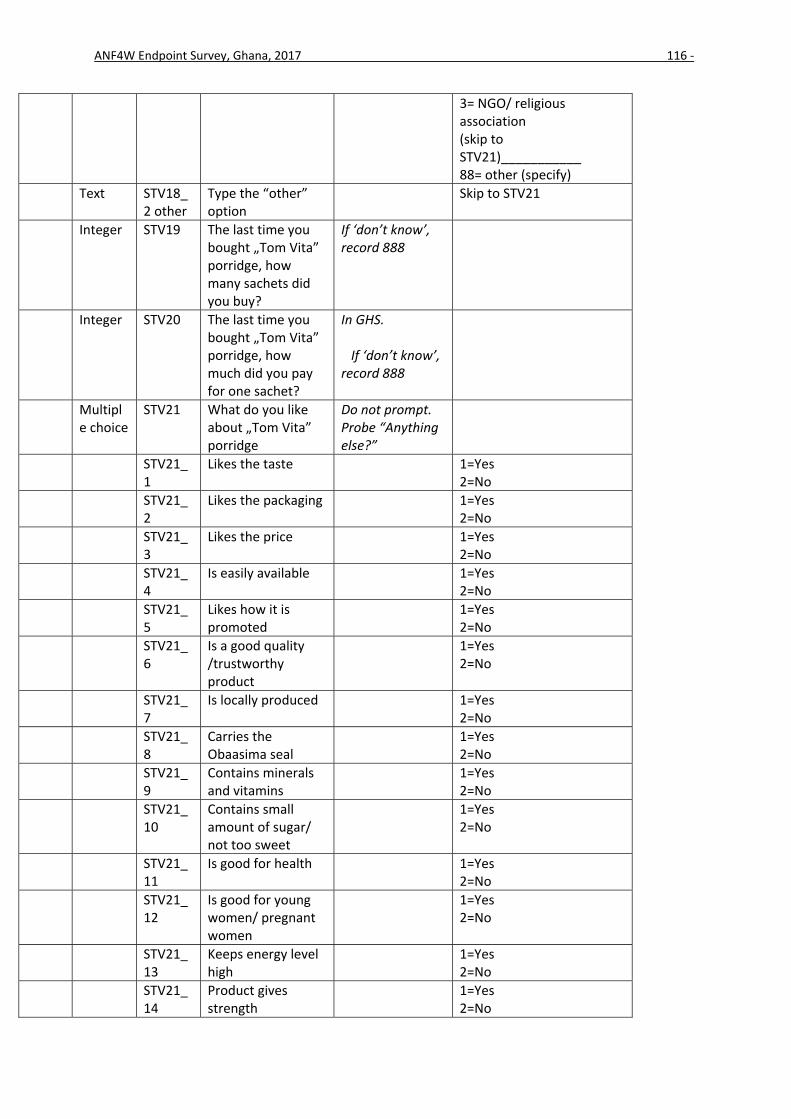
Most of the surveyed women ate TomVita less than once a month (>50%) and one sachet per serving
(38.5%, see Figure 20), which resulted in a median daily consumption of 0.01 sachets. This small
quantity is not surprising as median daily instant porridge in general was already low at baseline
(0.06 sachets). Due to the small number of women who had ever consumed TomVita, we did not
conduct sub‐ group analyses for all variables. Similar to the other products, stratification by
pregnancy status showed that significantly more PW heard about TomVita at the health clinic
compared to YWRA, which is most likely due to the antenatal care visits. Interestingly, awareness was
much higher in Sunyani than in Tamale with more than 40% of the surveyed women having ever
seen/ heard of TomVita compared to only 17% in Tamale. Similar to the other products, none of the
women living in poor households had ever consumed TomVita. Sub‐ group analyses can be found in
interpretations and recommendations below are based almost entirely on the results from the
endpoint survey.
Findings from the endpoint assessment showed that almost 70% of the surveyed women had seen or
heard of the Obaasima seal, which is encouraging, especially when considering the relatively short
exposure of only 6 months. However, more than half of the women who had ever seen or heard of
the seal did not know its meaning and only about 40% associated Obaasima with some sort of health
benefit, indicating that the campaign, if prolonged, should be modified in order to increase the
proportion of women perceiving products with the seal as “nutritious”.Putting our results into
context by comparing them to another product launch (young child complementary feeding
supplement) in Ghana [16], which used similar distribution channels and which was accompanied by
a behavior change communication campaign and other marketing activities confirms that awareness
and consumption of our products were relatively low even for 6 months exposure period. Two
months after market entry about 64% of respondents were aware and about 24% of respondents
had ever bought the IYCF supplement, a much higher proportion than for any of our products after 6
months. However, it has to be noted that the type of product cannot be directly compared and
subsequently, results may be expected to differ. Before looking into the results for each of the
products in more detail, it has to be stressed again that the low sales figures led to a considerable
loss of precision. Reasons for the rather challenging market entry and rather modest success of the
products in terms of purchase and consumption could be manifold. We would hypothesize that the
modest success could at least be partially ascribed to the short duration of the marketing campaign,
as product awareness was ranged from 17%‐33%. Adding to this, the already relatively low
awareness did not translate into actual product purchase, resulting in very few women who had ever
bought or eaten the products. Reasons for this could either be a lack of demand or limited product
availability or a combination of both. The survey results indicate that the low demand might have
been due to the high product price as none of the women living in poor households – who are likely
more price sensitive and might not have been willing to pay for these products – had ever consumed
one of the products. Other reasons might be the market domination of already existing products (e.g.
biscuit market) or the fact that there is no convenience product market for Shito sauce and porridge
as people prefer homemade and unbranded Shito sauce or koko and hausa koko porridge. The latter
would not be surprising as baseline assessment showed that almost 100% of respondents mainly
consumed homemade Shito sauce and only about 25% of women consumed instant porridge at all. Furthermore, we visited retailers selling the products in Sunyani during the survey and found that
most of them had run out of stock. This was mainly the case for Lola biscuits which could not be
found in any of the shops. Further inquiries revealed that most of the retailers received a small
amount of products only once and did not know whom to contact in order to get resupplied. For all
products, respondents reported “product not easily available” as one of the answers when asked for
negative characteristics of the products. Weak supply and distribution at such an early stage might
have suffocated the demand for products before they had a chance to expand. In brief, while the
marketing campaign aimed to increase demand for nutritious food products, the campaign may have
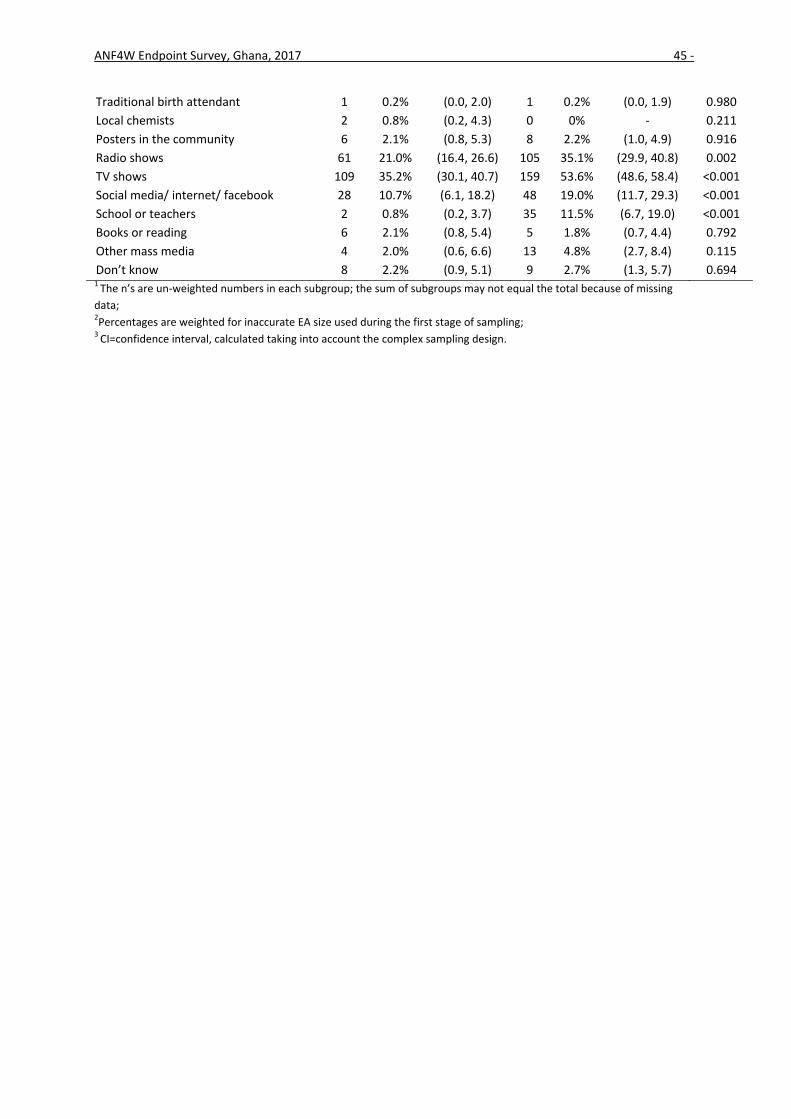
Other mass media 4 2.0% (0.6, 6.6) 13 4.8% (2.7, 8.4) 0.115
Don’t know 8 2.2% (0.9, 5.1) 9 2.7% (1.3, 5.7) 0.6941 The n’s are un‐weighted numbers in each subgroup; the sum of subgroups may not equal the total because of missing
data; 2Percentages are weighted for inaccurate EA size used during the first stage of sampling; 3 CI=confidence interval, calculated taking into account the complex sampling design.
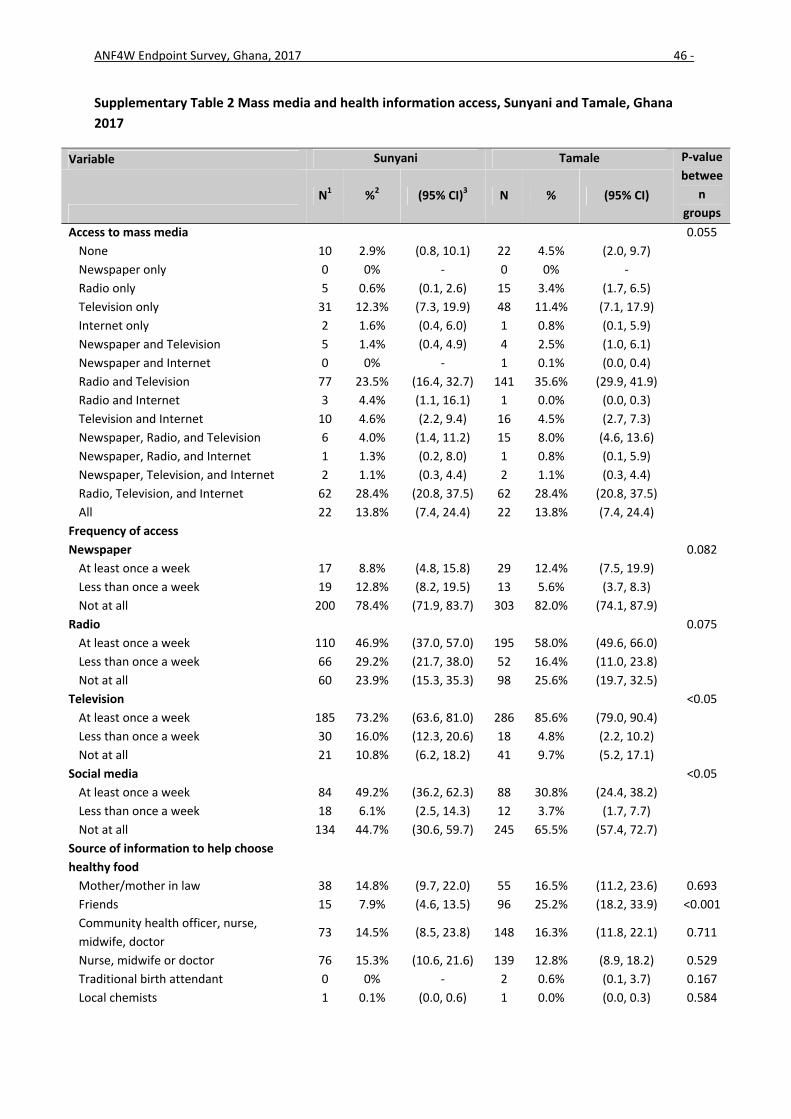
ANF4W Endpoint Survey, Ghana, 2017 46 ‐
Supplementary Table 2 Mass media and health information access, Sunyani and Tamale, Ghana
2017
Variable Sunyani Tamale P‐value
betwee
n
groups
N1 %2 (95% CI)3 N % (95% CI)
Access to mass media 0.055
None 10 2.9% (0.8, 10.1) 22 4.5% (2.0, 9.7)
Newspaper only 0 0% ‐ 0 0% ‐
Radio only 5 0.6% (0.1, 2.6) 15 3.4% (1.7, 6.5)
Television only 31 12.3% (7.3, 19.9) 48 11.4% (7.1, 17.9)
Internet only 2 1.6% (0.4, 6.0) 1 0.8% (0.1, 5.9)
Newspaper and Television 5 1.4% (0.4, 4.9) 4 2.5% (1.0, 6.1)
Newspaper and Internet 0 0% ‐ 1 0.1% (0.0, 0.4)
Radio and Television 77 23.5% (16.4, 32.7) 141 35.6% (29.9, 41.9)
Radio and Internet 3 4.4% (1.1, 16.1) 1 0.0% (0.0, 0.3)
Television and Internet 10 4.6% (2.2, 9.4) 16 4.5% (2.7, 7.3)
Newspaper, Radio, and Television 6 4.0% (1.4, 11.2) 15 8.0% (4.6, 13.6)
Newspaper, Radio, and Internet 1 1.3% (0.2, 8.0) 1 0.8% (0.1, 5.9)
Newspaper, Television, and Internet 2 1.1% (0.3, 4.4) 2 1.1% (0.3, 4.4)
Radio, Television, and Internet 62 28.4% (20.8, 37.5) 62 28.4% (20.8, 37.5)
All 22 13.8% (7.4, 24.4) 22 13.8% (7.4, 24.4)
Frequency of access
Newspaper 0.082
At least once a week 17 8.8% (4.8, 15.8) 29 12.4% (7.5, 19.9)
Less than once a week 19 12.8% (8.2, 19.5) 13 5.6% (3.7, 8.3)
Not at all 200 78.4% (71.9, 83.7) 303 82.0% (74.1, 87.9)
Radio 0.075
At least once a week 110 46.9% (37.0, 57.0) 195 58.0% (49.6, 66.0)
Less than once a week 66 29.2% (21.7, 38.0) 52 16.4% (11.0, 23.8)
Not at all 60 23.9% (15.3, 35.3) 98 25.6% (19.7, 32.5)
Television <0.05
At least once a week 185 73.2% (63.6, 81.0) 286 85.6% (79.0, 90.4)
Less than once a week 30 16.0% (12.3, 20.6) 18 4.8% (2.2, 10.2)
Not at all 21 10.8% (6.2, 18.2) 41 9.7% (5.2, 17.1)
Social media <0.05
At least once a week 84 49.2% (36.2, 62.3) 88 30.8% (24.4, 38.2)
Less than once a week 18 6.1% (2.5, 14.3) 12 3.7% (1.7, 7.7)
Not at all 134 44.7% (30.6, 59.7) 245 65.5% (57.4, 72.7)
Source of information to help choose
healthy food
Mother/mother in law 38 14.8% (9.7, 22.0) 55 16.5% (11.2, 23.6) 0.693
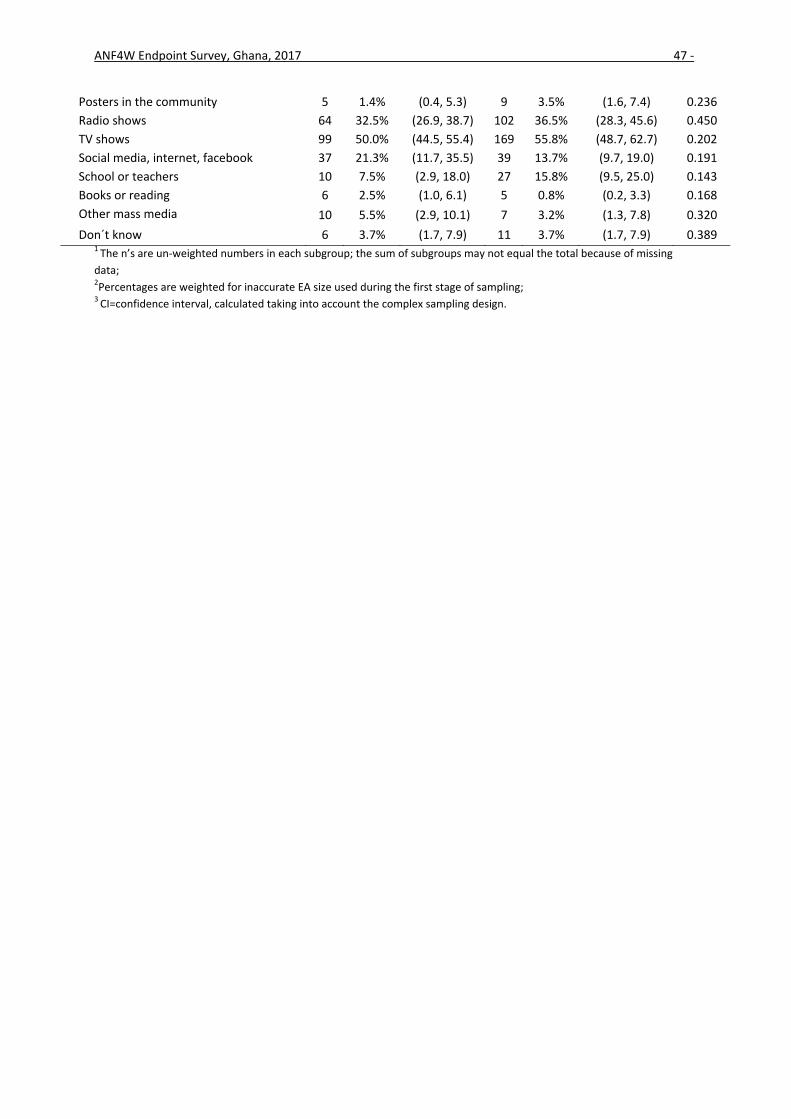
Other mass media 10 5.5% (2.9, 10.1) 7 3.2% (1.3, 7.8) 0.320
Don´t know 6 3.7% (1.7, 7.9) 11 3.7% (1.7, 7.9) 0.3891 The n’s are un‐weighted numbers in each subgroup; the sum of subgroups may not equal the total because of missing
data; 2Percentages are weighted for inaccurate EA size used during the first stage of sampling; 3 CI=confidence interval, calculated taking into account the complex sampling design.
ANF4W Endpoint Survey, Ghana, 2017 48 ‐
Supplementary table 3 Mass media and health information access, stratified by MPI score, Ghana
2017
Variable Poor Non‐ poor
P‐value
betwee
n
groups
N1 %2 (95% CI)3 N % (95% CI)
Access to mass media 0.827
None 5 12.6% (2.4, 45.3) 23 2.6% (1.1, 6.2)
Newspaper only 3 2.4% (0.5, 10.5) 0 0% ‐
Radio only 3 10.4% (1.8, 42.3) 12 1.4% (0.6, 3.4)
Television only 0 0% ‐ 55 10.3% (6.9, 15.2)
Internet only 0 0% ‐ 2 1.2% (0.3, 4.9)
Newspaper and Television 0 0% ‐ 8 1.9% (0.8, 4.5)
Newspaper and Internet 0 0% ‐ 1 0.0% (0.0, 0.2)
Radio and Television 9 45.0% (16.6, 77.0) 154 27.7% (21.1, 35.6)
Radio and Internet 0 0% ‐ 3 2.4% (0.7, 8.2)
Television and Internet 0 0% ‐ 23 4.9% (2.6, 9.0)
Newspaper, Radio, and Television 0 0% ‐ 17 6.2% (3.5, 10.7)
Newspaper, Radio, and Internet 0 0% ‐ 2 1.6% (0.4, 6.3)
Newspaper, Television, and Internet 0 0% ‐ 5 1.3% (0.4, 3.9)
Radio, Television, and Internet 4 29.7% (8.1, 67.0) 90 25.8% (19.9, 32.9)
All 0 0% ‐ 30 12.5% (6.4, 23.0)
Frequency of access
Newspaper 0.311
At least once a week 0 0% ‐ 38 12.4% (8.3, 18.1)
Less than once a week 0 0% ‐ 25 11.2% (6.9, 17.6)
Not at all 24 100.0% (100, 100) 362 76.5% (69.6, 82.2)
Radio 0.853
At least once a week 12 43.0% (16.0, 74.9) 214 51.0% (41.8, 60.2)
Less than once a week 4 34.1% (9.5, 71.7) 94 26.6% (20.2, 34.1)
Not at all 8 22.9% (6.7, 55.4) 117 22.4% (15.9, 30.6)
Television 0.707
At least once a week 14 68.6% (35.8, 89.5) 346 78.5% (70.5, 84.7)
Less than once a week 2 16.5% (3.5, 51.5) 36 12.3% (8.0, 18.4)
Not at all 8 14.9% (3.5, 45.7) 43 9.2% (6.3, 13.2)
Social media 0.377
At least once a week 3 27.3% (6.6, 66.6) 130 43.5% (34.2, 53.2)
Less than once a week 1 2.4% (0.3, 15.9) 26 6.3% (2.9, 13.2)
Not at all 20 70.3% (33.0, 91.9) 269 50.2% (39.3, 61.1)
Source of information to help choose
healthy food
Mother/mother in law 4 5.2% (1.7, 15.0) 71 15.5% (11.2, 21.0) <0.05
Don´t know 0 0% ‐ 15 2.4% (1.0, 5.4) 0.6811 The n’s are un‐weighted numbers in each subgroup; the sum of subgroups may not equal the total because of missing
data; 2Percentages are weighted for inaccurate EA size used during the first stage of sampling; 3 CI=confidence interval, calculated taking into account the complex sampling design.
ANF4W Endpoint Survey, Ghana, 2017 50 ‐
Supplementary table 4 Obaasima seal recognition, all women, Ghana 2017
Variable All women
N1 Median, %2 (95% CI)3
Proportion of women ever seen/heard of Obaasima seal 322 68.9 (57.8; 78.2)
Where women have seen/heard of Obaasima seal
TV 72 19.5 (14.4; 25.9)
Radio 37 11.0 (6.3; 18.6)
Billboards 143 49.6 (41.2; 58.0)
Posters/ street median 61 25.0 (18.1; 33.3)
Religious/ social gatherings 1 0.1 (0.0; 0.5)
Health clinic/health worker 39 3.6 (1.7; 7.4)
Community leaders 1 0.3 (0.0; 2.4)
Relatives/ friends/ neighbours 11 2.6 (1.0; 6.3)
Shopkeeper/pharmacy 9 2.9 (1.2; 7.0)
Social media 3 0.8 (0.1; 4.6)
Market place 52 16.6 (10.8; 24.6)
Movie event/ roving cinema 7 0.5 (0.2; 1.8)
Don´t know 8 3.6 (1.4; 9.0)
Other 10 4.5 (2.3; 8.6)
What does the Obaasima seal mean
Is good quality/trustworthy product 39 10.4 (6.8; 15.7)
Contains vitamin and minerals 37 11.8 (7.9; 17.2)
Is good for health 61 17.8 (10.9; 27.8)
Is good for young women/ pregnant women 28 4.8 (2.4; 9.5)
Gives strength 35 8.7 (5.6; 13.3)
Keeps energy level high 19 5.9 (3.0; 11.2)
Boosts immune system 14 6.0 (3.3; 10.5)
Is important for a long life 10 2.8 (0.9; 8.4)
Helps to become pregnant 9 2.2 (0.7; 6.8)
Protects unborn baby 10 2.0 (0.6; 6.7)
Helps to be smart 7 1.9 (0.5; 6.7)
Don´t know/ don´t remember 178 58.6 (51.6; 65.2)
Other 5 1.3 (0.4; 4.2)
Proportion of women ever bought products with the
Obaasima seal
43 13.7 (9.6; 19.1)
Proportion of women preferring products with the
Obaasima seal
32 58.5 (28.2; 83.5)
Reasons for preferring products with Obaasima seal
Is good quality/trustworthy product 15 34.4 (15.9; 59.2)
Contains vitamin and minerals 11 21.9 (7.9; 47.7)
Is good for health 14 27.0 (9.5; 56.5)
Is good for young women/ pregnant women 4 1.7 (0.4; 6.3)
Gives strength 11 32.4 (15.0; 56.5)
Keeps energy level high 4 5.1 (1.0; 23.2)
Boosts immune system 2 9.1 (2.2; 30.7)
Is important for a long life 1 5.8 (0.7; 34.6)
Helps to become pregnant 0 ‐‐
Protects unborn baby 0 ‐‐
Don´t know/ don´t remember 2 7.4 (2.1; 23.1)
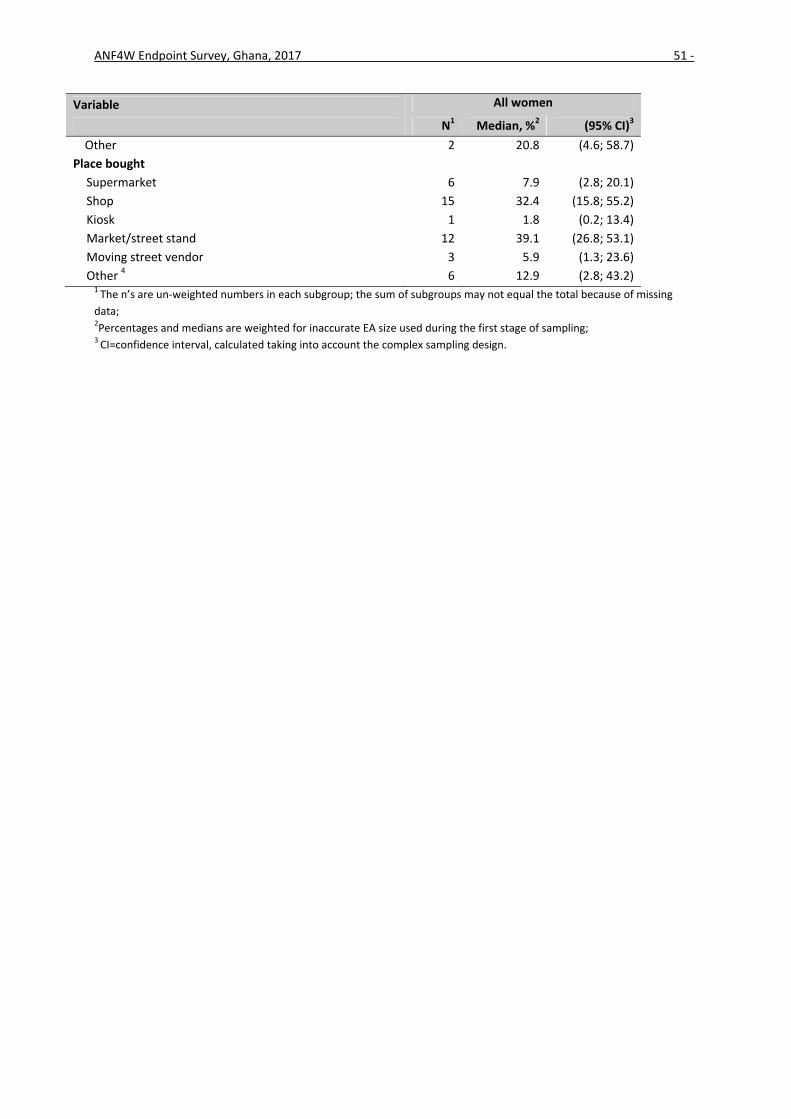
ANF4W Endpoint Survey, Ghana, 2017 51 ‐
Variable All women
N1 Median, %2 (95% CI)3
Other 2 20.8 (4.6; 58.7)
Place bought
Supermarket 6 7.9 (2.8; 20.1)
Shop 15 32.4 (15.8; 55.2)
Kiosk 1 1.8 (0.2; 13.4)
Market/street stand 12 39.1 (26.8; 53.1)
Moving street vendor 3 5.9 (1.3; 23.6)
Other 4 6 12.9 (2.8; 43.2) 1 The n’s are un‐weighted numbers in each subgroup; the sum of subgroups may not equal the total because of missing
data; 2Percentages and medians are weighted for inaccurate EA size used during the first stage of sampling; 3 CI=confidence interval, calculated taking into account the complex sampling design.
ANF4W Endpoint Survey, Ghana, 2017 52 ‐
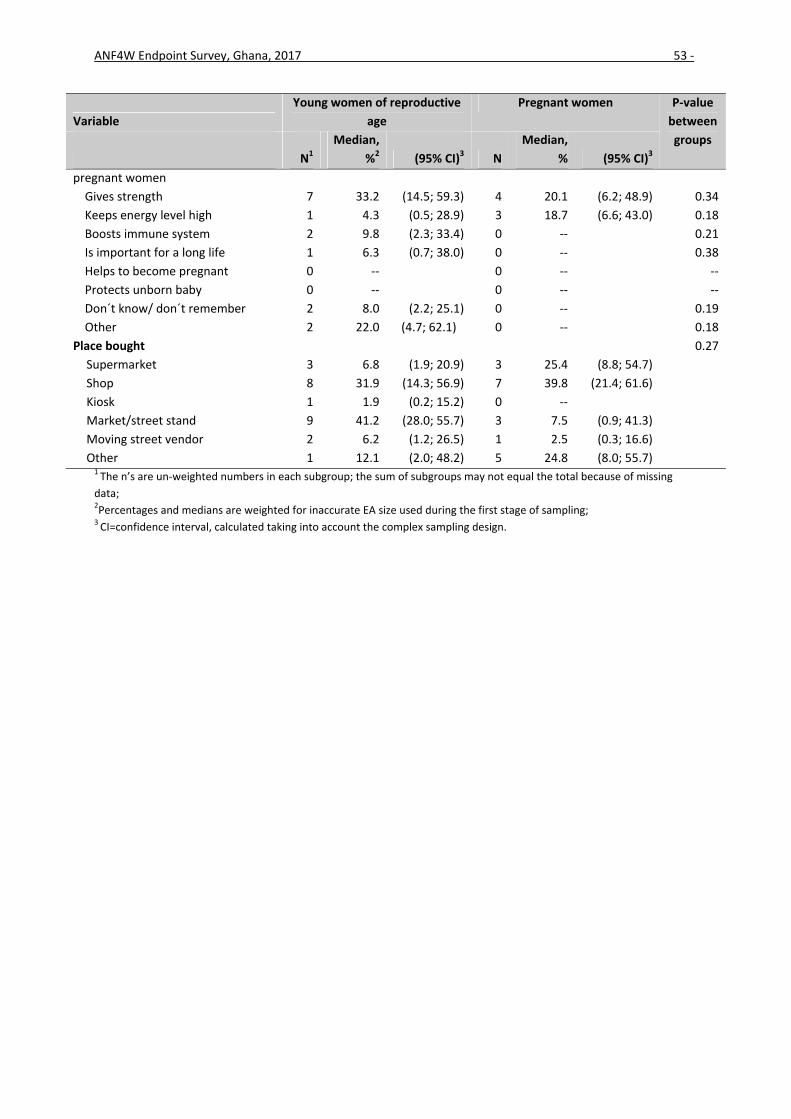
Supplementary table 5 Obaasima seal recognition, pregnant and young non‐ pregnant women,
Other 1 12.1 (2.0; 48.2) 5 24.8 (8.0; 55.7) 1 The n’s are un‐weighted numbers in each subgroup; the sum of subgroups may not equal the total because of missing
data; 2Percentages and medians are weighted for inaccurate EA size used during the first stage of sampling; 3 CI=confidence interval, calculated taking into account the complex sampling design.
ANF4W Endpoint Survey, Ghana, 2017 54 ‐
Supplementary table 6 Obaasima seal recognition, Sunyani and Tamale, Ghana 2017
Market/street stand 5 44.7 (29.5; 60.9) 7 27.6 (12.0; 51.5)
Moving street vendor 0 ‐‐ 3 18.2 (3.6; 57.1)
Pharmacy 0 ‐‐ 0 ‐‐
Other 4 18.5 2 1.3 (0.3; 5.5)
1 The n’s are un‐weighted numbers in each subgroup; the sum of subgroups may not equal the total because of missing
data; 2Percentages and medians are weighted for inaccurate EA size used during the first stage of sampling; 3 CI=confidence interval, calculated taking into account the complex sampling design.
ANF4W Endpoint Survey, Ghana, 2017 56 ‐
Supplementary table 7 Obaasima seal recognition, stratified by MPI score, Ghana 2017
1 The n’s are un‐weighted numbers in each subgroup; the sum of subgroups may not equal the total because of missing
data; 2Percentages and medians are weighted for inaccurate EA size used during the first stage of sampling; 3 CI=confidence interval, calculated taking into account the complex sampling design.
ANF4W Endpoint Survey, Ghana, 2017 58 ‐
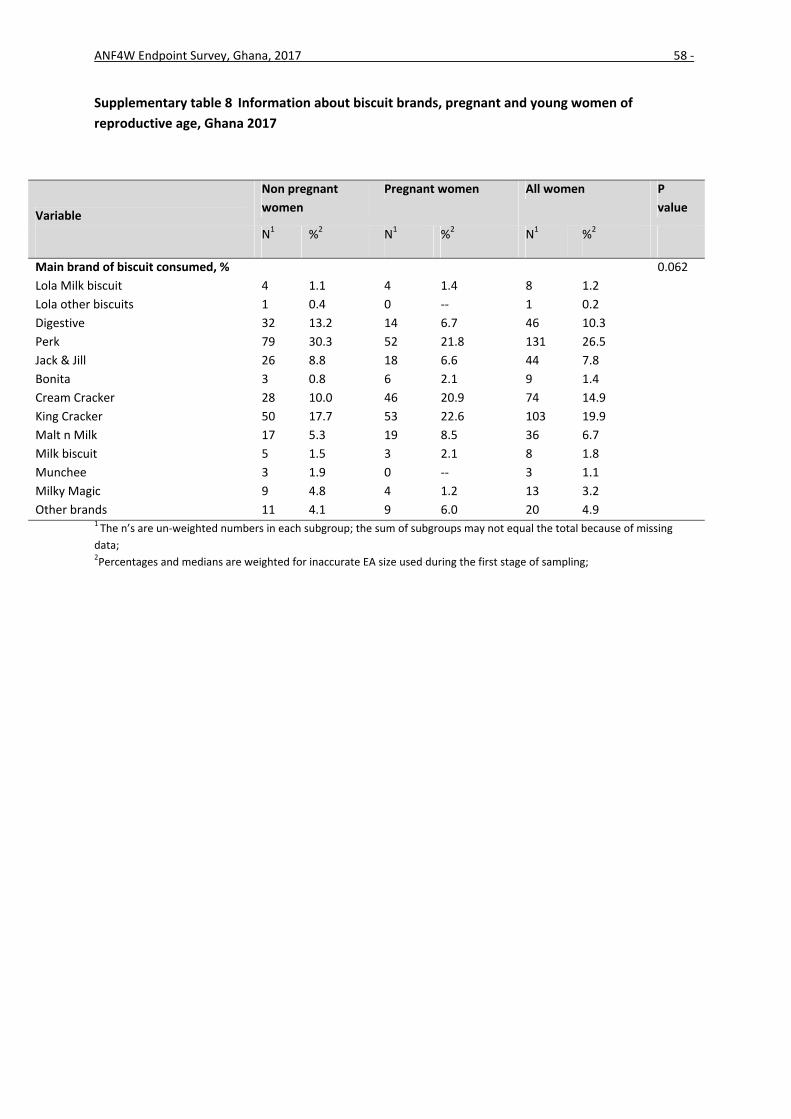
Supplementary table 8 Information about biscuit brands, pregnant and young women of
reproductive age, Ghana 2017
Variable
Non pregnant
women
Pregnant women All women P
value
N1 %2 N1 %2 N1 %2
Main brand of biscuit consumed, % 0.062
Lola Milk biscuit 4 1.1 4 1.4 8 1.2
Lola other biscuits 1 0.4 0 ‐‐ 1 0.2
Digestive 32 13.2 14 6.7 46 10.3
Perk 79 30.3 52 21.8 131 26.5
Jack & Jill 26 8.8 18 6.6 44 7.8
Bonita 3 0.8 6 2.1 9 1.4
Cream Cracker 28 10.0 46 20.9 74 14.9
King Cracker 50 17.7 53 22.6 103 19.9
Malt n Milk 17 5.3 19 8.5 36 6.7
Milk biscuit 5 1.5 3 2.1 8 1.8
Munchee 3 1.9 0 ‐‐ 3 1.1
Milky Magic 9 4.8 4 1.2 13 3.2
Other brands 11 4.1 9 6.0 20 4.9 1 The n’s are un‐weighted numbers in each subgroup; the sum of subgroups may not equal the total because of missing
data; 2Percentages and medians are weighted for inaccurate EA size used during the first stage of sampling;
ANF4W Endpoint Survey, Ghana, 2017 59 ‐
Supplementary table 9 Information about biscuit brands, Sunyani and Tamale, Ghana 2017
Variable
Sunyani Tamale
N1 %2 N1 %2
Main brand of biscuit consumed, %
Lola Milk biscuit 2 0.6 6 2.1
Lola other biscuits 1 0.6 0 ‐‐
Digestive 19 13.0 27 12.4
Perk 57 30.5 74 28.5
Jack & Jill 18 9.1 26 8.0
Bonita 0 ‐‐ 9 2.4
Cream Cracker 34 12.3 40 8.1
King Cracker 37 15.3 66 22.6
Malt n Milk 10 4.4 26 7.3
Milk biscuit 3 1.2 5 2.1
Munchee 2 2.4 1 0.7
Milky Magic 5 5.3 8 3.4
Other brands 15 5.2 5 2.5 1 The n’s are un‐weighted numbers in each subgroup; the sum of subgroups may not equal the total because of missing
data; 2Percentages and medians are weighted for inaccurate EA size used during the first stage of sampling;
ANF4W Endpoint Survey, Ghana, 2017 60 ‐
Supplementary table 10 Information about biscuit brands, stratified by MPI score, Ghana 2017
Variable
Poor Non‐ poor
N1 %2 N1 %2
Main brand of biscuit consumed, %
Lola Milk biscuit 0 ‐‐ 6 0.8
Lola other biscuits 0 ‐‐ 1 0.5
Digestive 1 4.1 37 14.3
Perk 3 6.6 88 28.4
Jack & Jill 1 1.3 23 5.6
Bonita 1 2.0 6 0.5
Cream Cracker 3 52.6 57 9.8
King Cracker 1 4.1 90 21.5
Malt n Milk 3 13.1 22 4.9
Milk biscuit 1 16.1 6 1.4
Munchee 0 ‐‐ 3 2.5
Milky Magic 0 ‐‐ 11 5.9
Other brands 0 ‐‐ 15 3.9 1 The n’s are un‐weighted numbers in each subgroup; the sum of subgroups may not equal the total because of missing
data; 2Percentages and medians are weighted for inaccurate EA size used during the first stage of sampling;
ANF4W Endpoint Survey, Ghana, 2017 61 ‐
Supplementary table 11 Information about consumer behaviour with regard to Lola biscuits, all
women, Ghana 2017
Variable All women
N1 Median, %2 (95% CI)3
Proportion of women consuming biscuits 496 91.6 (86.5; 94.9)
Awareness ‐ Proportion of women ever seen/heard of Lola Milk
biscuits
101 17.0 (12.9; 22.2)
Awareness ‐ Where women have seen/heard of Lola Milk biscuits
TV 14 14.6 (5.9; 32.0)
Radio 3 3.1 (0.5; 16.2)
Billboards 7 6.0 (1.9; 17.1)
Posters/ street median 5 4.6 (1.5; 13.0)
Religious/ social gatherings
Health clinic/health worker 15 6.8 (2.5; 17.0)
Community leaders
Relatives/ friends/ neighbours 9 11.0 (5.1; 22.0)
Shopkeeper/pharmacy 33 31.7 (18.7; 48.3)
Social media 3 0.6 (0.2; 2.1)
Market place 28 34.0 (19.3; 52.6)
Don´t know 2 1.6 (0.3; 8.2)
Other 4 6.4 (2.2; 17.3)
Access ‐ Proportion of women know where to buy Lola Milk
biscuits
57 63.2 (40.1; 81.6)
Access ‐ Where women know to buy Lola Milk biscuits
Shop 41 64.5 (43.3; 81.3)
Kiosk 13 15.2 (5.7; 34.8)
Market/street stand 16 42.1 (24.8; 61.6)
Moving street vendor 3 6.3 (1.5; 22.7)
Other 1 0.2 (0.0; 1.2)
Access ‐ Distance to closest place in meters 55 500 (300; 1000)
Consumption ‐ Proportion of women who have ever eaten Lola
Milk biscuits (of those aware)
42 44.0 (26.5; 63.1)
Consumption ‐ Last time Lola biscuits consumed in weeks, median 42 3.0 (2.0; 4.3)
Consumption ‐ Frequency of Lola biscuit consumption
Several times a day 3 2.9 (0.5; 15.6)
Once a day 2 7.3 (1.8; 25.5)
Every other day 1 4.1 (0.5; 26.5)
Once or twice a week 4 2.7 (0.6; 11.3)
Less than once a week 5 13.0 (4.6; 31.4)
Every second week 3 4.8 (0.8; 24.0)
Once a month 4 7.9 (2.4; 22.8)
Less than once a month 20 57.4 (32.5; 79.1)
Consumption ‐ Quantity consumed
Half a biscuit 1 0.4 (0.1; 3.1)
One biscuit 21 30.1 (14.7; 51.7)
Two biscuits 3 16.4 (2.9; 56.1)
Three biscuits 1 0.2 (0.0; 1.6)
Four or more biscuits 16 52.9 (29.0; 75.5)
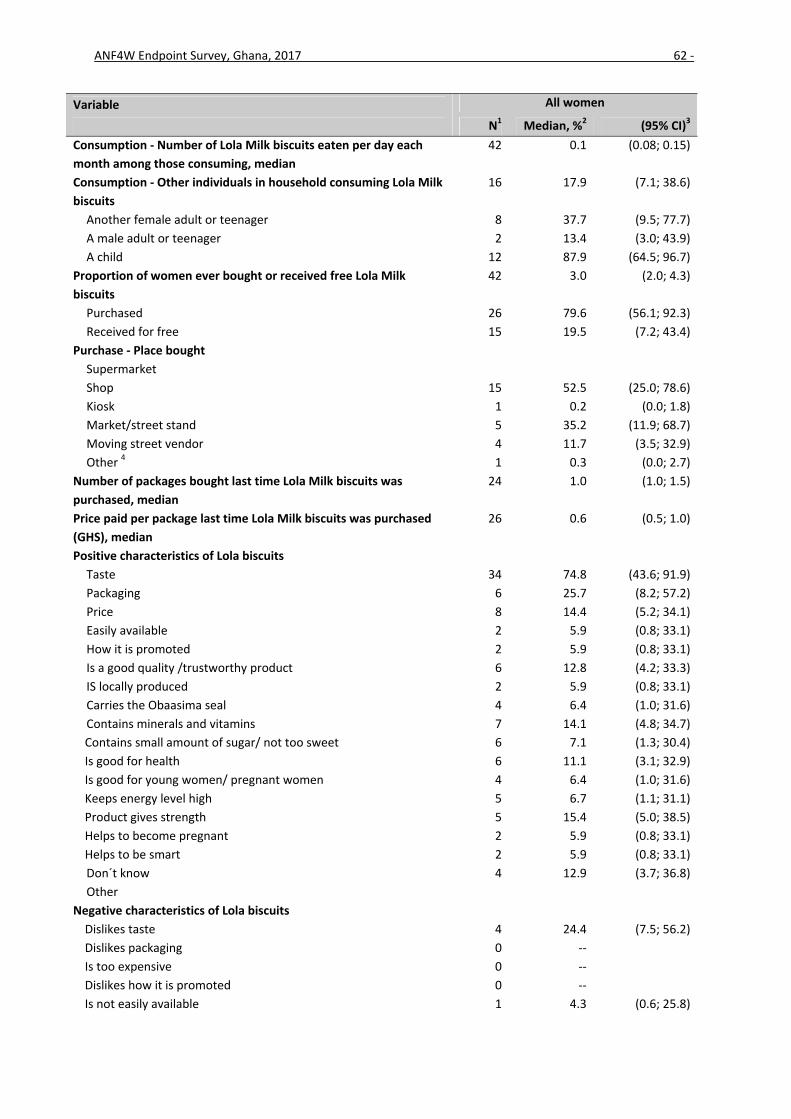
ANF4W Endpoint Survey, Ghana, 2017 62 ‐
Variable All women
N1 Median, %2 (95% CI)3
Consumption ‐ Number of Lola Milk biscuits eaten per day each
month among those consuming, median
42 0.1 (0.08; 0.15)
Consumption ‐ Other individuals in household consuming Lola Milk
biscuits
16 17.9 (7.1; 38.6)
Another female adult or teenager 8 37.7 (9.5; 77.7)
A male adult or teenager 2 13.4 (3.0; 43.9)
A child 12 87.9 (64.5; 96.7)
Proportion of women ever bought or received free Lola Milk
biscuits
42 3.0 (2.0; 4.3)
Purchased 26 79.6 (56.1; 92.3)
Received for free 15 19.5 (7.2; 43.4)
Purchase ‐ Place bought
Supermarket
Shop 15 52.5 (25.0; 78.6)
Kiosk 1 0.2 (0.0; 1.8)
Market/street stand 5 35.2 (11.9; 68.7)
Moving street vendor 4 11.7 (3.5; 32.9)
Other 4 1 0.3 (0.0; 2.7)
Number of packages bought last time Lola Milk biscuits was
purchased, median
24 1.0 (1.0; 1.5)
Price paid per package last time Lola Milk biscuits was purchased
(GHS), median
26 0.6 (0.5; 1.0)
Positive characteristics of Lola biscuits
Taste 34 74.8 (43.6; 91.9)
Packaging 6 25.7 (8.2; 57.2)
Price 8 14.4 (5.2; 34.1)
Easily available 2 5.9 (0.8; 33.1)
How it is promoted 2 5.9 (0.8; 33.1)
Is a good quality /trustworthy product 6 12.8 (4.2; 33.3)
IS locally produced 2 5.9 (0.8; 33.1)
Carries the Obaasima seal 4 6.4 (1.0; 31.6)
Contains minerals and vitamins 7 14.1 (4.8; 34.7)
Contains small amount of sugar/ not too sweet 6 7.1 (1.3; 30.4)
Is good for health 6 11.1 (3.1; 32.9)
Is good for young women/ pregnant women 4 6.4 (1.0; 31.6)
Keeps energy level high 5 6.7 (1.1; 31.1)
Product gives strength 5 15.4 (5.0; 38.5)
Helps to become pregnant 2 5.9 (0.8; 33.1)
Helps to be smart 2 5.9 (0.8; 33.1)
Don´t know 4 12.9 (3.7; 36.8)
Other
Negative characteristics of Lola biscuits
Dislikes taste 4 24.4 (7.5; 56.2)
Dislikes packaging 0 ‐‐
Is too expensive 0 ‐‐
Dislikes how it is promoted 0 ‐‐
Is not easily available 1 4.3 (0.6; 25.8)
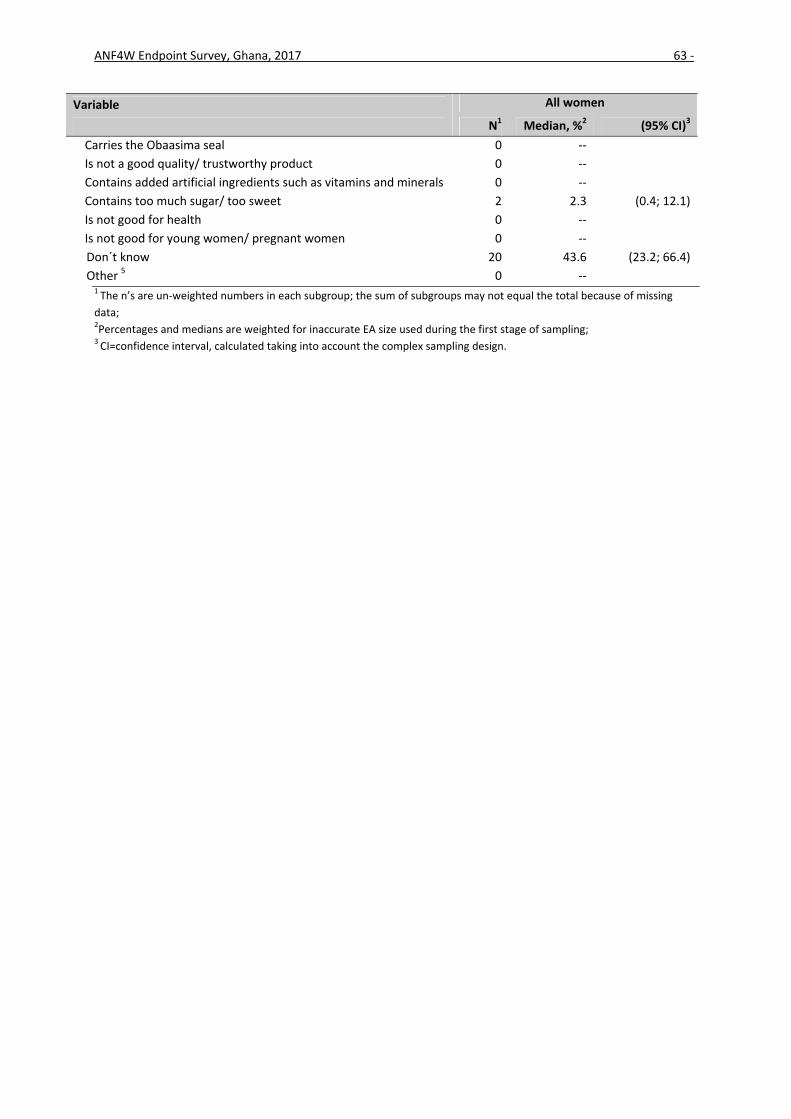
ANF4W Endpoint Survey, Ghana, 2017 63 ‐
Variable All women
N1 Median, %2 (95% CI)3
Carries the Obaasima seal 0 ‐‐
Is not a good quality/ trustworthy product 0 ‐‐
Contains added artificial ingredients such as vitamins and minerals 0 ‐‐
Contains too much sugar/ too sweet 2 2.3 (0.4; 12.1)
Is not good for health 0 ‐‐
Is not good for young women/ pregnant women 0 ‐‐
Don´t know 20 43.6 (23.2; 66.4)
Other 5 0 ‐‐ 1 The n’s are un‐weighted numbers in each subgroup; the sum of subgroups may not equal the total because of missing
data; 2Percentages and medians are weighted for inaccurate EA size used during the first stage of sampling; 3 CI=confidence interval, calculated taking into account the complex sampling design.
ANF4W Endpoint Survey, Ghana, 2017 64 ‐
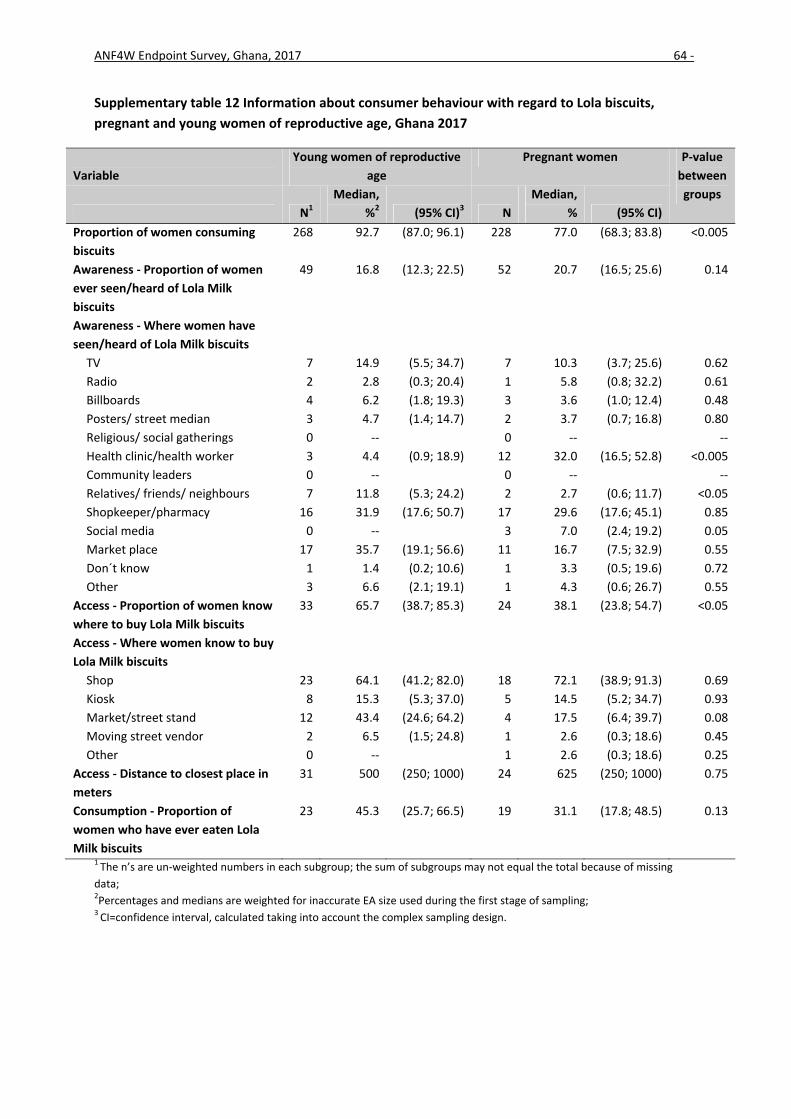
Supplementary table 12 Information about consumer behaviour with regard to Lola biscuits,
pregnant and young women of reproductive age, Ghana 2017
1 The n’s are un‐weighted numbers in each subgroup; the sum of subgroups may not equal the total because of missing
data; 2Percentages and medians are weighted for inaccurate EA size used during the first stage of sampling; 3 CI=confidence interval, calculated taking into account the complex sampling design.
ANF4W Endpoint Survey, Ghana, 2017 65 ‐
Supplementary table 13 Information about consumer behaviour with regard to Lola biscuits,
1 The n’s are un‐weighted numbers in each subgroup; the sum of subgroups may not equal the total because of missing
data; 2Percentages and medians are weighted for inaccurate EA size used during the first stage of sampling; 3 CI=confidence interval, calculated taking into account the complex sampling design.
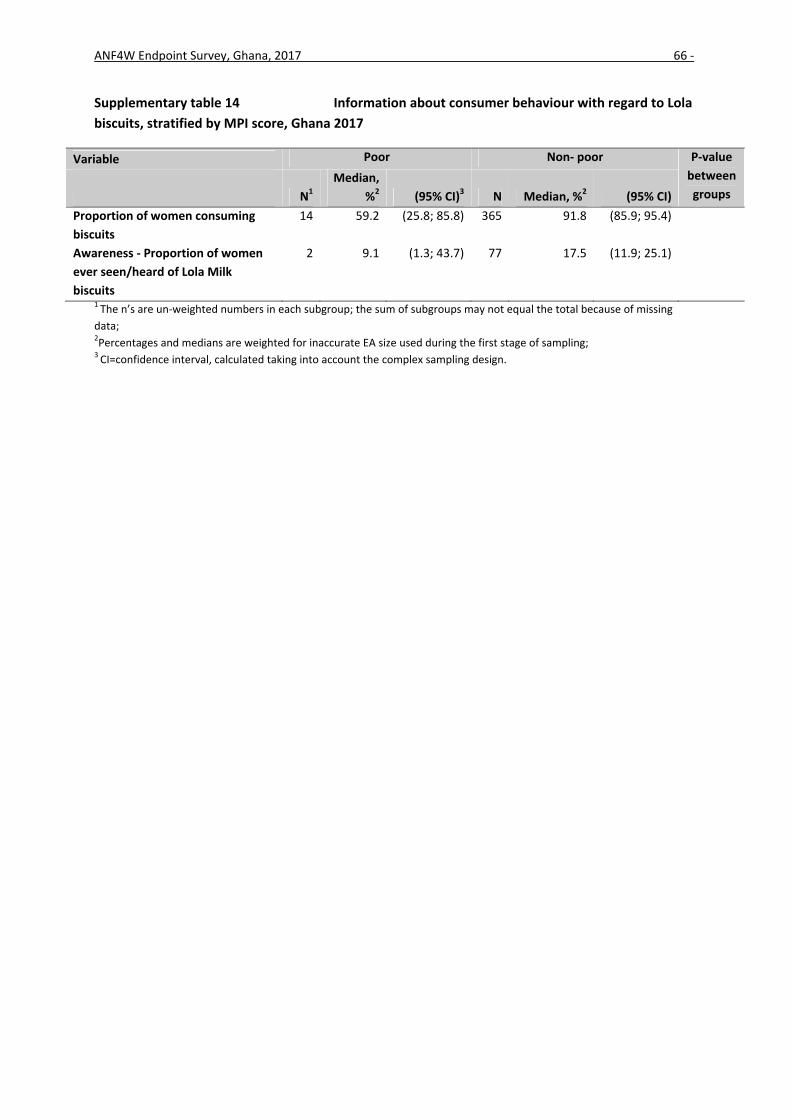
ANF4W Endpoint Survey, Ghana, 2017 66 ‐
Supplementary table 14 Information about consumer behaviour with regard to Lola
biscuits, stratified by MPI score, Ghana 2017
Variable Poor Non‐ poor P‐value
between
groups N1
Median,
%2 (95% CI)3 N Median, %2 (95% CI)
Proportion of women consuming
biscuits
14 59.2 (25.8; 85.8) 365 91.8 (85.9; 95.4)
Awareness ‐ Proportion of women
ever seen/heard of Lola Milk
biscuits
2 9.1 (1.3; 43.7) 77 17.5 (11.9; 25.1)
1 The n’s are un‐weighted numbers in each subgroup; the sum of subgroups may not equal the total because of missing
data; 2Percentages and medians are weighted for inaccurate EA size used during the first stage of sampling; 3 CI=confidence interval, calculated taking into account the complex sampling design.
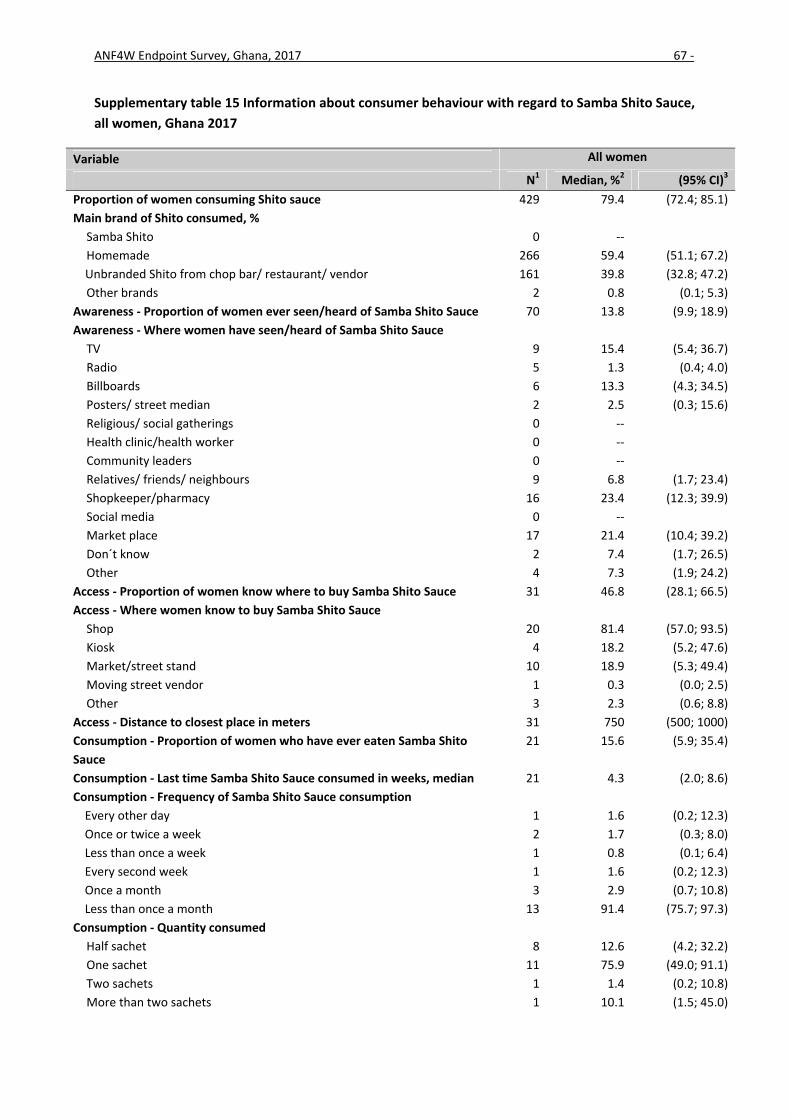
ANF4W Endpoint Survey, Ghana, 2017 67 ‐
Supplementary table 15 Information about consumer behaviour with regard to Samba Shito Sauce,
all women, Ghana 2017
Variable All women
N1 Median, %2 (95% CI)3
Proportion of women consuming Shito sauce 429 79.4 (72.4; 85.1)
Main brand of Shito consumed, %
Samba Shito 0 ‐‐
Homemade 266 59.4 (51.1; 67.2)
Unbranded Shito from chop bar/ restaurant/ vendor 161 39.8 (32.8; 47.2)
Other brands 2 0.8 (0.1; 5.3)
Awareness ‐ Proportion of women ever seen/heard of Samba Shito Sauce 70 13.8 (9.9; 18.9)
Awareness ‐ Where women have seen/heard of Samba Shito Sauce
TV 9 15.4 (5.4; 36.7)
Radio 5 1.3 (0.4; 4.0)
Billboards 6 13.3 (4.3; 34.5)
Posters/ street median 2 2.5 (0.3; 15.6)
Religious/ social gatherings 0 ‐‐
Health clinic/health worker 0 ‐‐
Community leaders 0 ‐‐
Relatives/ friends/ neighbours 9 6.8 (1.7; 23.4)
Shopkeeper/pharmacy 16 23.4 (12.3; 39.9)
Social media 0 ‐‐
Market place 17 21.4 (10.4; 39.2)
Don´t know 2 7.4 (1.7; 26.5)
Other 4 7.3 (1.9; 24.2)
Access ‐ Proportion of women know where to buy Samba Shito Sauce 31 46.8 (28.1; 66.5)
Access ‐ Where women know to buy Samba Shito Sauce
Shop 20 81.4 (57.0; 93.5)
Kiosk 4 18.2 (5.2; 47.6)
Market/street stand 10 18.9 (5.3; 49.4)
Moving street vendor 1 0.3 (0.0; 2.5)
Other 3 2.3 (0.6; 8.8)
Access ‐ Distance to closest place in meters 31 750 (500; 1000)
Consumption ‐ Proportion of women who have ever eaten Samba Shito
Sauce
21 15.6 (5.9; 35.4)
Consumption ‐ Last time Samba Shito Sauce consumed in weeks, median 21 4.3 (2.0; 8.6)
Consumption ‐ Frequency of Samba Shito Sauce consumption
Every other day 1 1.6 (0.2; 12.3)
Once or twice a week 2 1.7 (0.3; 8.0)
Less than once a week 1 0.8 (0.1; 6.4)
Every second week 1 1.6 (0.2; 12.3)
Once a month 3 2.9 (0.7; 10.8)
Less than once a month 13 91.4 (75.7; 97.3)
Consumption ‐ Quantity consumed
Half sachet 8 12.6 (4.2; 32.2)
One sachet 11 75.9 (49.0; 91.1)
Two sachets 1 1.4 (0.2; 10.8)
More than two sachets 1 10.1 (1.5; 45.0)
ANF4W Endpoint Survey, Ghana, 2017 68 ‐
Variable All women
N1 Median, %2 (95% CI)3
Consumption ‐ Number of Samba Shito Sauce eaten per day each month
among those consuming, median
21 0.02 (0.02; 0.04)
Consumption ‐ Other individuals in household consuming Samba Shito
Sauce
10 10.6 (3.2; 30.0)
Another female adult or teenager 5 65.6 (16.7; 94.8)
A male adult or teenager 7 73.8 (22.5; 96.5)
A child 6 45.5 (8.4; 88.3)
Proportion of women ever bought or received free Samba Shito Sauce 21 15.6 (5.9; 35.4)
Purchased 6 37.2 (9.9; 76.0)
Received for free 14 59.9 (22.3; 88.6)
Purchase ‐ Place bought
Supermarket 1 43.0 (5.1; 91.4)
Shop 3 52.2 (7.6; 93.6)
Market/street stand 1 2.1 (0.2; 19.1)
Other 1 2.6 (0.3; 21.7)
Number of packages bought last time Samba Shito Sauce was purchased,
median
5 5 (1.0; 20.0)
Price paid per package last time Samba Shito Sauce was purchased (GHS),
median
6 0.75 (0.5; 0.09)
Positive characteristics of Samba Shito Sauce
Taste 19 73.9 (24.7; 96.1)
Packaging 4 19.2 (3.2; 62.7)
Price 2 17.4 (2.5; 63.3)
Easily available 0 ‐‐
How it is promoted 0 ‐‐
Is a good quality /trustworthy product 2 1.8 (0.4; 8.0)
IS locally produced 0 ‐‐
Carries the Obaasima seal 0 ‐‐
Contains minerals and vitamins 1 1.0 (0.1; 7.6)
Is good for health 1 0.8 (0.1; 6.4)
Is good for young women/ pregnant women 2 1.8 (0.4; 8.0)
Keeps energy level high 2 2.4 (0.5; 10.7)
Product gives strength 2 2.4 (0.5; 10.7)
Helps to become pregnant 1 1.0 (0.1; 7.6)
Helps to be smart 0 ‐‐
Don´t know 1 1.0 (0.1; 7.6)
Other 2 26.7 (4.2; 75.2)
Negative characteristics of Samba Shito Sauce
Dislikes taste 0 ‐‐
Dislikes packaging 0 ‐‐
Is too expensive 0 ‐‐
Dislikes how it is promoted 0 ‐‐
Is not easily available 3 12.4 (2.6; 43.0)
Carries the Obaasima seal 0 ‐‐
Is not a good quality/ trustworthy product 0 ‐‐
Contains added artificial ingredients such as vitamins and minerals 0 ‐‐
Is not good for health 0 ‐‐
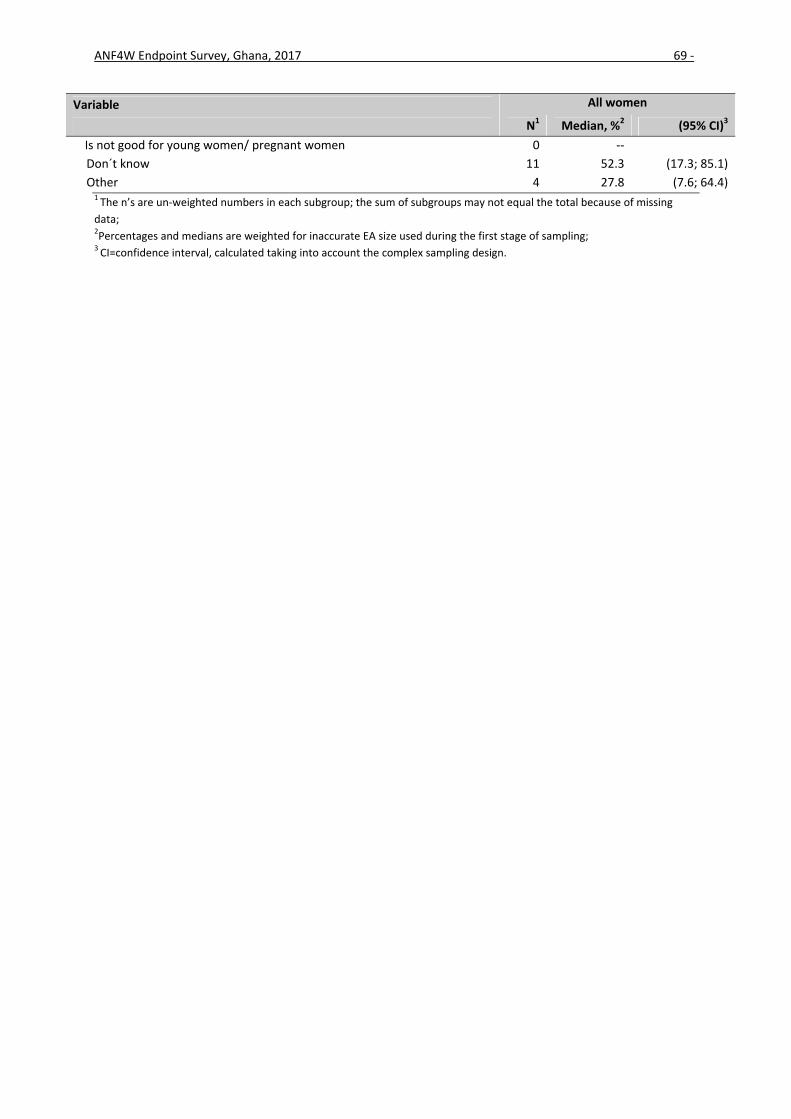
ANF4W Endpoint Survey, Ghana, 2017 69 ‐
Variable All women
N1 Median, %2 (95% CI)3
Is not good for young women/ pregnant women 0 ‐‐
Don´t know 11 52.3 (17.3; 85.1)
Other 4 27.8 (7.6; 64.4)1 The n’s are un‐weighted numbers in each subgroup; the sum of subgroups may not equal the total because of missing
data; 2Percentages and medians are weighted for inaccurate EA size used during the first stage of sampling; 3 CI=confidence interval, calculated taking into account the complex sampling design.
ANF4W Endpoint Survey, Ghana, 2017 70 ‐
Supplementary table 16 Information about consumer behaviour with regard to Samba Shito Sauce,
pregnant and young women of reproductive age, Ghana 2017
1 The n’s are un‐weighted numbers in each subgroup; the sum of subgroups may not equal the total because of missing
data; 2Percentages and medians are weighted for inaccurate EA size used during the first stage of sampling; 3 CI=confidence interval, calculated taking into account the complex sampling design.
ANF4W Endpoint Survey, Ghana, 2017 73 ‐
Supplementary table 18 Information about consumer behaviour with regard to Samba Shito,
1 The n’s are un‐weighted numbers in each subgroup; the sum of subgroups may not equal the total because of missing
data; 2Percentages and medians are weighted for inaccurate EA size used during the first stage of sampling; 3 CI=confidence interval, calculated taking into account the complex sampling design.
ANF4W Endpoint Survey, Ghana, 2017 74 ‐
Supplementary table 19 Information about consumer behaviour with regard to Tom Vita
porridge, all women, Ghana 2017
Variable All women
N1 Median, %2 (95% CI)3
Proportion of women consuming porridge 546 96.0 (92.8; 97.8)
Main brand of porridge consumed, %
Tom Vita 1 0.0 (0.0; 0.1)
Cerelac 5 1.2 (0.4; 3.1)
Yumvita 1 0.0 (0.0; 0.2)
Bledine 2 0.0 (0.0; 0.2)
Zimbegu 17 2.8 (1.5; 5.2)
Tom Brown (unbranded) 24 5.9 (3.3; 10.3)
Koko (unbranded) 364 58.2 (48.9; 66.9)
Hausa koko (unbranded) 97 22.3 (15.6; 30.8)
Wheat porridge (unbranded) 14 4.3 (2.1; 8.5)
Oats porridge 11 2.2 (0.9; 5.4)
Other brands 10 3.1 (1.4; 6.8)
Awareness ‐ Proportion of women ever seen/heard of Tom Vita
porridge
133 32.7 (24.7; 41.8)
Awareness ‐ Where women have seen/heard of Tom Vita
Access ‐ Proportion of women know where to buy Tom Vita
porridge
53 47.1 (26.9; 68.4)
Access ‐ Where women know to buy Tom Vita porridge
Shop 36 77.7 (51.3; 92.0)
Kiosk 7 9.2 (2.5; 29.0)
Market/street stand 17 24.3 (8.8; 51.6)
Moving street vendor 3 2.8 (0.5; 12.9)
Other 3 1.0 (0.2; 4.1)
Access ‐ Distance to closest place in meters 53 500 (250; 750)
Consumption ‐ Proportion of women who have ever eaten Tom
Vita porridge
24 12.4 (6.1; 23.3)
Consumption ‐ Last time Tom Vita consumed in weeks, median 24 4.3 (2.0; 4.3)
Consumption ‐ Frequency of Tom Vita consumption
Several times a day 1 0.5 (0.1; 4.5)
ANF4W Endpoint Survey, Ghana, 2017 75 ‐
Variable All women
N1 Median, %2 (95% CI)3
Once a day 1 4.5 (0.5; 29.0)
Once or twice a week 3 5.4 (0.8; 29.0)
Less than once a week 3 22.7 (7.0; 53.4)
Every second week 2 8.8 (1.2; 44.0)
Once a month 1 8.5 (1.0; 47.3)
Less than once a month 13 49.5 (33.6; 65.5)
Consumption ‐ Quantity consumed
Quarter of a sachet 5 33.1 (17.3; 53.9)
Half sachet 6 18.7 (5.3; 48.7)
Two thirds of a sachet 1 0.9 (0.1; 7.1)
One sachet 11 46.4 (28.3; 65.5)
More than one sachet 1 0.9 (0.1; 7.1)
Consumption ‐ Number of Tom Vita porridge eaten per day each
month among those consuming, median
24 0.02 (0.01; 0.08)
Time of the day Tom Vita is consumed
Breakfast 15 66.3 (44.4; 82.9)
Snack between breakfast and lunch 4 27.0 (10.4; 53.9)
Lunch 0 ‐‐
Snack between lunch and dinner 1 1.2 (0.1; 9.8)
Dinner 0 ‐‐
After dinner 4 5.5 (1.0; 25.8)
Other 0 ‐‐
Consumption ‐ Other individuals in household consuming Tom
Vita porridge
21 14.7 (7.9; 25.9)
Another female adult or teenager 7 19.5 (4.7; 54.4)
A male adult or teenager 4 27.8 (10.5; 55.7)
A child 17 82.5 (46.5; 96.2)
Proportion of women ever bought or received free Tom Vita
porridge
24 12.4 (6.1; 23.3)
Purchased 16 88.1 (67.3; 96.3)
Received for free 7 10.4 (2.9; 30.7)
Purchase ‐ Place bought
Supermarket 1 1.4 (0.2; 11.4)
Shop 5 60.9 (21.4; 90.0)
Kiosk 1 0.6 (0.1; 4.9)
Market/street stand 5 24.7 (5.8; 63.3)
Moving street vendor 3 11.7 (2.2; 44.3)
Other 4 1 0.8 (0.1; 6.7)
Number of packages bought last time Tom Vita porridge was
purchased, median
16 1.0 (1.0; 2.0)
Price paid per package last time Tom Vita porridge was
purchased (GHS), median
15 1.5 (1.5; 1.5)
Positive characteristics of Tom Vita
Taste 15 63.2 (44.1; 78.9)
Packaging 4 11.7 (2.7; 38.9)
Price 3 7.1 (1.5; 28.4)
Easily available 2 24.6 (8.7; 53.0)
ANF4W Endpoint Survey, Ghana, 2017 76 ‐
Variable All women
N1 Median, %2 (95% CI)3
How it is promoted 1 4.6 (0.5; 29.4)
Is a good quality /trustworthy product 3 9.6 (1.9; 37.3)
IS locally produced 0 ‐‐
Carries the Obaasima seal 1 0.4 (0.0; 3.7)
Contains minerals and vitamins 2 10.2 (1.6; 44.1)
Contains small amount of sugar/ not too sweet 1 6.2 (0.7; 39.0)
Is good for health 0 ‐‐
Is good for young women/ pregnant women 0 ‐‐
Keeps energy level high 0 ‐‐
Product gives strength 1 8.1 (0.9; 45.9)
Helps to become pregnant 0 ‐‐
Helps to be smart 0 ‐‐
Don´t know 4 4.7 (1.1; 18.5)
Other 0 ‐‐
Negative characteristics of Tom Vita
Dislikes taste 2 2.6 (0.4; 14.5)
Dislikes packaging 0 ‐‐
Is too expensive 0 ‐‐
Dislikes how it is promoted 0 ‐‐
Is not easily available 1 4.6 (0.5; 29.4)
Carries the Obaasima seal 0 ‐‐
Is not a good quality/ trustworthy product 1 1.2 (0.1; 10.0)
Contains added artificial ingredients such as vitamins and
minerals
0 ‐‐
Contains too much sugar/ too sweet 0 ‐‐
Is not good for health 0 ‐‐
Is not good for young women/ pregnant women 0 ‐‐
Don´t know 11 47.0 (30.7; 63.9)
Other 5 4 31.4 (13.9; 56.4)1 The n’s are un‐weighted numbers in each subgroup; the sum of subgroups may not equal the total because of missing
data; 2Percentages and medians are weighted for inaccurate EA size used during the first stage of sampling; 3 CI=confidence interval, calculated taking into account the complex sampling design.
ANF4W Endpoint Survey, Ghana, 2017 77 ‐
Supplementary table 20 Information about consumer behaviour with regard to Tom Vita porridge,
pregnant and young women of reproductive age, Ghana 2017
Variable
Young women of reproductive
age
Pregnant women P‐value
between
groups
N1
Median,
%2 (95% CI)3 N
Median,
%2 (95% CI)
Proportion of women consuming
porridge
283 96.3 (92.7; 98.2) 263 92.0 (85.8; 95.7) 0.09
Main brand of porridge consumed,
%
Tom Vita 0 ‐‐ 1 0.1 (0.0; 0.9) 0.12
Cerelac 4 1.2 (0.4; 3.5) 1 0.3 (0.0; 2.2)
Yumvita 0 ‐‐ 1 0.3 (0.0; 2.3)
Bledine 0 ‐‐ 2 0.5 (0.1; 2.4)
Zimbegu 11 2.9 (1.5; 5.6) 6 1.7 (0.6; 4.5)
Tom Brown (unbranded) 12 5.9 (3.1; 10.9) 12 5.5 (3.4; 8.8)
Koko (unbranded) 180 57.5 (47.4; 67.0) 184 66.8 (57.0; 75.3)
1 The n’s are un‐weighted numbers in each subgroup; the sum of subgroups may not equal the total because of missing
data; 2Percentages and medians are weighted for inaccurate EA size used during the first stage of sampling; 3 CI=confidence interval, calculated taking into account the complex sampling design.
ANF4W Endpoint Survey, Ghana, 2017 79 ‐
Supplementary table 21 Information about consumer behaviour with regard to Tom Vita porridge,
Sunyani and Tamale, Ghana 2017
Variable Sunyani Tamale P‐value
between
groups N1
Median,
%2 (95% CI)3 N
Median,
%2 (95% CI)
Proportion of women consuming
porridge
224 96.2 (91.6; 98.4) 322 95.6 (90.1; 98.1) 0.80
Main brand of porridge consumed,
%
Tom Vita 0 ‐‐ 1 0.0 (0.0; 0.4) <0.0001
Cerelac 1 0.5 (0.1; 3.9) 4 2.2 (0.8; 6.3)
Yumvita 0 ‐‐ 1 0.1 (0.0; 0.4)
Bledine 0 ‐‐ 2 0.1 (0.0; 0.5)
Zimbegu 1 0.7 (0.1; 5.2) 16 6.2 (3.9; 9.8)
Tom Brown (unbranded) 14 8.2 (4.5; 14.3) 10 2.2 (0.9; 5.4)
Koko (unbranded) 120 47.3 (37.2; 57.7) 244 75.9 (66.9; 83.1)
Moving street vendor 0 ‐‐ 3 14.9 (3.2; 48.3) <0.05
Other 3 1.2 (0.2; 5.5) 0 ‐‐ 0.67
Access ‐ Distance to closest place in 32 500 (250; 500) 21 750 (250; 1750) 0.07
ANF4W Endpoint Survey, Ghana, 2017 80 ‐
Variable Sunyani Tamale P‐value
between
groups N1
Median,
%2 (95% CI)3 N
Median,
%2 (95% CI)
meters
Consumption ‐ Proportion of
women who have ever eaten Tom
Vita porridge
13 9.3 (3.0; 25.1) 11 24.7 (15.7; 36.6) 0.07
1 The n’s are un‐weighted numbers in each subgroup; the sum of subgroups may not equal the total because of missing
data; 2Percentages and medians are weighted for inaccurate EA size used during the first stage of sampling; 3 CI=confidence interval, calculated taking into account the complex sampling design.
ANF4W Endpoint Survey, Ghana, 2017 81 ‐
Supplementary table 22 Information about consumer behaviour with regard to Tom Vita porridge,
stratified by MPI score, Ghana 2017
Variable Poor Non‐ poor P‐value
between
groups N1
Median,
%2 (95% CI)3 N
Median,
%2 (95% CI)
Proportion of women consuming
porridge
22 89.8 (53.3; 98.5) 397 96.2 (92.6; 98.1) 0.28
Main brand of porridge consumed,
%
0.72
Tom Vita 0 ‐‐ 1 0 (0.0; 0.2)
Cerelac 0 ‐‐ 4 1.3 (0.4; 4.0)
Yumvita 1 0.9 (0.1; 6.9) 0 ‐‐
Bledine 0 ‐‐ 1 0.1 (0.0; 0.3)
Zimbegu 2 1.8 (0.2; 12.8) 11 2.4 (1.0; 5.5)
Tom Brown (unbranded) 1 0.9 (0.1; 6.7) 19 5.8 (2.7; 12.2)
Koko (unbranded) 15 77.2 (42.1; 94.1) 259 57.4 (48.8; 65.5)
1 The n’s are un‐weighted numbers in each subgroup; the sum of subgroups may not equal the total because of missing
data; 2Percentages and medians are weighted for inaccurate EA size used during the first stage of sampling; 3 CI=confidence interval, calculated taking into account the complex sampling design.
ANF4W Endpoint Survey, Ghana, 2017 82 ‐
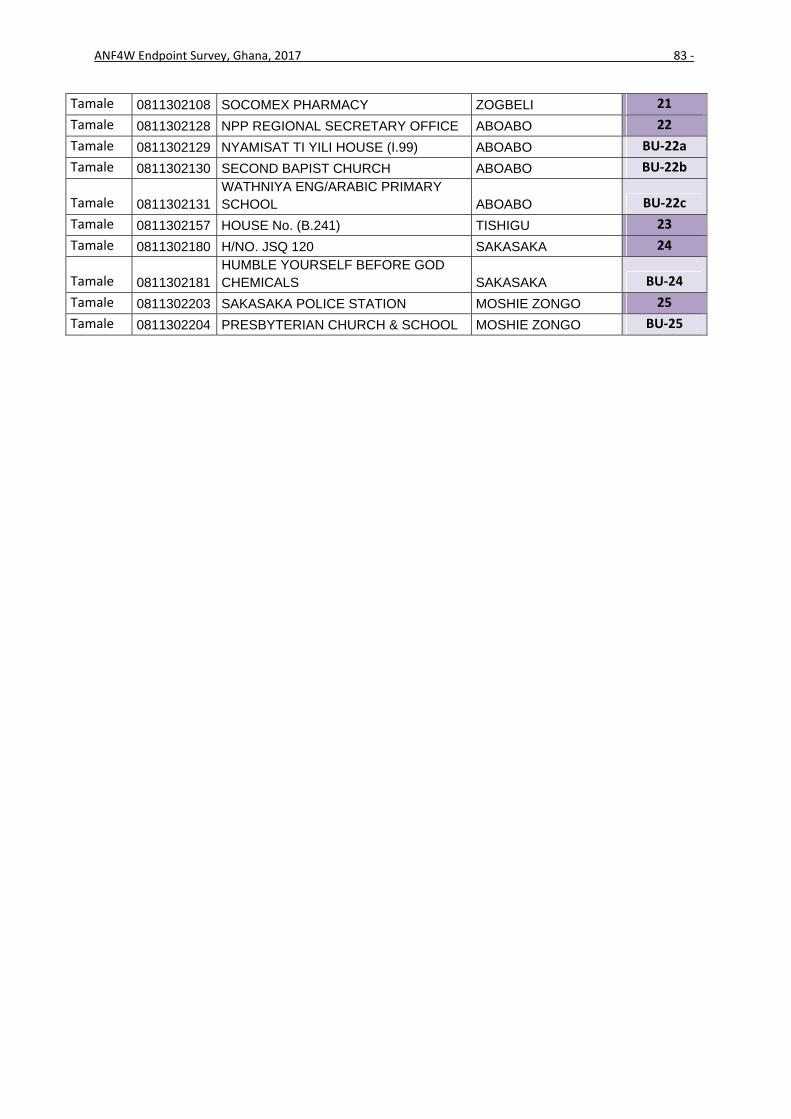
APPENDIX 2 – SAMPLING FRAME
District EACode EABase Name Locality Name
Selected or
Backup EA
Sunyani 0708200016 BENU NKWANTA BENU NKWANTA 1
Sunyani 0708200017 TWEREDUA TWEREDUA BU‐1
Sunyani 0708200032 AGAPE EVANGELIGAL CHURCH ABESIM 2
Sunyani 0708200033 ABESIM LORRY PARK ABESIM BU‐2
Sunyani 0708200042 ST. JAMES SEMINARY SECONDARY SCHOOL ABESIM 3
36= Roofing shingles 37= Asbestos/slate roofing sheets (skip to HHC8)_____________ 96 = Other (specify)
Text HHC6other
Type the “other” option
Single Choice
HHC8 What is the main material of the exterior walls of the dwelling?
Observe the material
11= No walls 12= Cane / palm / trunks 13= Dirt/ landcrete 21= Bamboo with mud 22= Stone with mud 23= Uncovered adobe 24= Plywood 25= Cardboard 26= Reused wood 31= Cement 32= Stone with lime / cement 33= Bricks 34= Cement blocks 35= Covered adobe 36= Wood planks / shingles (skip to HHC10)_____________ 96= Other (specify)
Text HHC8other
Type the “other” option
Single Choice
HHC10 Do you or anyone in this household own this dwelling?
1=Yes 2=No
Integer HHC11 In this household, how many rooms do you use for sleeping?
Enter number of rooms
Multiple Choice
HHC12 Does your household or anyone in the household have a…
Prompt for each item
HHC12_1
Radio 1=Yes 2=No
HHC12_2
Black/white television
1=Yes 2=No
HHC12_3
Color television 1=Yes 2=No
HHC12_4
Mobile telephone 1=Yes 2=No
HHC12_5
Land‐line telephone 1=Yes 2=No
ANF4W Endpoint Survey, Ghana, 2017 89 ‐
HHC12_6
Refrigerator 1=Yes 2=No
HHC12_7
Freezer 1=Yes 2=No
HHC12_8
Electric generator/Invertor
1=Yes 2=No
HHC12_9
Washing machine 1=Yes 2=No
HHC12_10
Computer/Tablet computer
1=Yes 2=No
HHC12_11
Photo camera (not on phone)
1=Yes 2=No
HHC12_12
Access to internet in any device
1=Yes 2=No
HHC12_13
A wall clock 1=Yes 2=No
HHC12_14
Video deck/ DVD/ VCD
1=Yes 2=No
HHC12_15
Sewing machine 1=Yes 2=No
HHC12_16
Bed 1=Yes 2=No
HHC12_17
Table 1=Yes 2=No
HHC12_18
Cabinet/cupboard 1=Yes 2=No
Wash, Sanitation and Hygiene (WSH)
Single Choice
WSH1 What is the main source of drinking water for the members of your household?
Only one answer 11= Piped water into dwelling 12= Yard/ plot 13= Public tap/ standpipe 21= Tube well or borehole 31= Protected Dug well 32= Unprotected dug well 41= Protected spring 42= Unprotected spring 51= Rainwater 61= Tanker truck 71= Cart with small tank 81= Surface water (river / dam / lake / pond / stream / canal / irrigation channel) 91= Bottled 92= sachet water 93= Don’t know (skip to WSH3)____________ 96= Other (specify)
Text WSH1other
Type the “other” option
ANF4W Endpoint Survey, Ghana, 2017 90 ‐
Single Choice
WSH3 Do you usually do anything to your drinking water to make it safer to drink?
1=Yes 2=No (skip to WSH5)
Multiple Choice
WSH4 What do you
usually do to make
the water safer to
drink?
Do not prompt.
Probe “Anything
else?”.
WSH4_1
Boil 1=Yes 2=No
WSH4_2
Add bleach/ chlorine tablet/ alum
1=Yes 2=No
WSH4_3
Use a water filter (ceramic/ sand/ composite/…
1=Yes 2=No
WSH4_4
Solar disinfection 1=Yes 2=No
WSH4_5
Strain through a cloth
1=Yes 2=No
WSH4_6
Let it stand and settle
1=Yes 2=No
WSH4_7
Camphor/ Naphthalene
1=Yes 2=No
WSH4_8
Purification Tablet 1=Yes 2=No
WSH4_9
Other (specify) 1=Yes 2=No (skip to WSH5)
Text WSH4_10
Type the “other” option
Single Choice
WSH5 What kind of toilet facility do members of your household usually use?
Do not prompt. If “flush”, probe: WHERE DOES IT FLUSH TO?
11= Flush or pour flush to piped sewer system 12= Flush or pour flush to septic tank 13= Flush or pour flush to pit latrine 14= Flush or pour flush to elsewhere 15= Flush, don`t know where 21= Ventilated improved pit latrine 22= Pit latrine with slab 23= Pit latrine without slab /open pit 41= Bucket toilet 51= Hanging toilet / hanging latrine 61= No facilities / bush /
ANF4W Endpoint Survey, Ghana, 2017 91 ‐
field (Skip to WSH8) 71= Don’t know (Skip to WSH7)____________ 88= Other (specify)
Text WSH5other
Type the “other” option
Single Choice
WSH7 Do you share this facility with other households?
1=Yes 2=No
Multiple choice
WSH8 Please tell me all of the occasions when it is important for you to wash hands.
Do not prompt.
Probe “Anything
else?”.
WSH8_1
Before eating 1=Yes 2=No
WSH8_2
Before feeding a child
1=Yes 2=No
WSH8_3
Before cooking or preparing food
1=Yes 2=No
WSH8_4
After defecation or urination
1=Yes 2=No
WSH8_5
After cleaning a child that has defecated,changing nappes, or washing diaper
1=Yes 2=No
WSH8_6
After contact with animal feces
1=Yes 2=No
WSH8_7
Don´t know 1=Yes 2=No
WSH8_8
Other (specify) 1=Yes 2=No (skip to PMM1)
Text WSH8_9
Type the “other” option
Pregnancy and MPI mortality (PMM)
Single choice
PMM1 Are you pregnant now?
May not be necessary to ask, if the respondent already told you that
1=Yes 2=No (skip to PMM3)
Integer PMM2 How many months pregnant are you?
Integer PMM3 How many times, in total, have you been pregnant?
Include current pregnancy, if pregnant
(if 0, skip to MEO1)
Single choice
PMM4 Have you taken iron tablets during your last pregnancy?
1=Yes 2=No
ANF4W Endpoint Survey, Ghana, 2017 92 ‐
Single choice
PMM5 During your last pregnancy, did you take drugs to keep you from getting malaria?
1=Yes 2=No
Integer PMM6 How many times, in total, have you given birth to a baby?
Include still births and live births
(if 0, skip to MEO1)
Months PMM7 When was your most recent birth?
Tell the mother : I will be asking about your recent births. I am interested in the three most recent births. I am interested in all children that were born alive.
Text PMM8 Where is that child now?
1= passed away 2= alive, no matter, where
Single choice
PMM9 Did you have a live baby before this most recent one?
1=Yes 2=No (skip to PMM 13)
Text PMM10 Where is the child now?
1= passed away 2= alive, no matter, where
Single choice
PMM11 Did you have a birth before that one?
1=Yes 2=No (skip to PMM 13)
Text PMM12 Where is the child now?
1= passed away 2= alive, no matter, where
Single choice
PMM13 Are you currently breastfeeding a child?
1=Yes 2=No
Marital status/education/occupation (MEO)
Single choice
MEO1 What is your marital status?
Introduce this and the following modules in that you explain the respondent that you are asking about her specifically now.
1= Married 2 = Widowed 3 = Single 4= Separated 5 = Divorced
Single choice
MEO2 What is the highest level of school you attended?
0= None 1=Primary 2=Middle 3=JSS/JHS 4=SSS/SHS 5=Higher 6= other
ANF4W Endpoint Survey, Ghana, 2017 93 ‐
MEO2other
Type the “other” option
Integer ME04 What is the highest (grade) you completed at that level?
If completed less than one year at that level, Record '00'.
Single choice
MEO5 What is your main occupation?
1=Agriculture – own farm 2=Agriculture – on someone else’s farm 3=Salaried employee 4=Petty trade 5=Self‐employed 6=Student 7=Unemployed (Skip to AMM1)____________ 8=Other
MEO5_other
Type the “other” option
Dietary Diversity (DD)
Multiple choice
DD1 Yesterday during the day or night, did you eat any of the following foods? Please also mention the foods that were part of a mixed dish.
Help the respondent define the 24h period Do not mark food group unless 15 grams or more eaten. Show woman spoon/cube to indicate quantity.
DD1_11 Red, orange yellow vegetables that have yellow or orange flesh (carrots, squash, orange fleshed sweetpotatoes)
1=Yes 2=No
DD1_12 Red, orange yellow fruits (mangoes, papaya, melon) and 100% fruit juices made from these fruits
1=Yes 2=No
DD1_13 Vitamin C rich vegetables (onion, pepper, tomato, okra, cauliflower)
1=Yes 2=No
DD1_14 Vitamin C rich fruits (Lemon, lime, grapefruit, orange, apricots, pineapple, banana) and 100% fruit juices made from these fruits
1=Yes 2=No
DD1_15 Any other fruits (coconut, apple) and 100% fruit juices
1=Yes 2=No
DD1_16 Any other vegetables (eggplant, avocado, zucchini, cucumber)
1=Yes 2=No
DD1_17 Edible oil 1=Yes 2=No
DD1_18 Sugar, honey 1=Yes 2=No
DD1_19 Condiments/spices 1=Yes 2=No
DD1_20 Miscellaneous (tea, soft drinks, juice)
1=Yes 2=No
DD1_21 Foods made with red palm oil, red palm nut, or red palm nut pulp sauce
1=Yes 2=No
DD1_22 Salty or fried snacks: Crisps and chips, fried dough or other fried snacks
1=Yes 2=No
DD1_23 Sugar‐sweetened beverages (soft
drinks/fizzy drinks, chocolate
drinks, malt drinks, yoghurt drinks,
sweet tea or coffee with sugar,
sweetened fruit juices and “juice
drinks”)
1=Yes
2=No
DD1_24 Sweets: Sugary foods, such as 1=Yes
ANF4W Endpoint Survey, Ghana, 2017 95 ‐
chocolates, candies, cookies/sweet biscuits, cakes, sweet pastries or ice cream
2=No
Access to mass media (AMM)
Single choice
AMM1 Do you read a newspaper or magazine at least once a week, less than once a week or not at all?
1= At least one a week 2= Less than once a week 3= Not at all
Single choice
AMM2 Do you listen to the radio at least once a week, less than once a week or not at all?
1= At least one a week 2= Less than once a week 3= Not at all
Single choice
AMM3 Do you watch television at least once a week, less than once a week or not at all?
1= At least one a week 2= Less than once a week 3= Not at all
Single choice
AMM4 Do you access internet/social media/facebook at least once a week, less than once a week or not at all?
1= At least once a week 2= Less than once a week 3= Not at all
Multiple choice
AMM5 Where do you get information from to help you choose healthy food for your baby and yourself?
Do not prompt. Probe “Anything else?”.
AMM5_1
Mother/mother in law
1=Yes 2=No
AMM5_2
Friends 1=Yes 2=No
AMM5_3
Community health officer
1=Yes 2=No
AMM5_4
Nurse, midwife or doctor
1=Yes 2=No
AMM5_5
Traditional birth attendant
1=Yes 2=No
AMM5_6
Local chemists 1=Yes 2=No
AMM5_7
Posters in the community
1=Yes 2=No
AMM5_8
Radio shows 1=Yes 2=No
ANF4W Endpoint Survey, Ghana, 2017 96 ‐
AMM5_9
TV shows 1=Yes 2=No
AMM5_10
Don´t know 1=Yes 2=No
AMM5_11
Social media/ internet/facebook
1=Yes 2=No
AMM5_12
Other mass media 1=Yes 2=No (skip to OSR1)
AMM5_12other
Type the “other” option
Obaasima seal recognition (OSR)
Single choice OSR1 Have you ever seen/ heard of the “Obaasima” seal/logo
Show the seal 1=Yes 2=No (skip to SLB1)
Multiple choice
OSR2 Where did you see/ hear of the “Obaasima” seal/logo
Do not prompt. Probe “Anything else?”.
OSR2_1 TV 1=Yes 2=No
OSR2_2 Radio 1=Yes 2=No
OSR2_3 Billboards 1=Yes 2=No
OSR2_4 Posters/ Street Median
1=Yes 2=No
OSR2_5 Church meeting 1=Yes 2=No
OSR2_6 Health clinic/ health worker
1=Yes 2=No
OSR2_7 Community leaders 1=Yes 2=No
OSR2_8 Relative/ friends/ neighbor
1=Yes 2=No
OSR2_9 Shopkeeper/ pharmacy
1=Yes 2=No
OSR2_10
Social media 1=Yes 2=No
OSR2_11
Market place/ market
1=Yes 2=No
OSR2_12
Movie event/roving cinema
1=Yes 2=No
OSR2_13
Don´t know/ don´t remember
1=Yes 2=No
OSR2_14
Other 1=Yes 2=No (skip to OSR3)
Text OSR2_14other
Type the “other” option
ANF4W Endpoint Survey, Ghana, 2017 97 ‐
Multiple choice
OSR3 What does the Obaasima seal/logo on a product mean?
Do not prompt. Probe “Anything else?”.
OSR3_1 Is good quality/trustworthy product
1=Yes 2=No
OSR3_2 Contains vitamin and minerals
1=Yes 2=No
OSR3_3 Is good for health 1=Yes 2=No
OSR3_4 Is good for young women/ pregnant women
1=Yes 2=No
OSR3_5 Gives strength 1=Yes 2=No
OSR3_6 Keeps energy level high
1=Yes 2=No
OSR3_7 Boosts immune system
1=Yes 2=No
OSR3_8 Is important for a long life
1=Yes 2=No
OSR3_9 Helps to become pregnant
1=Yes 2=No
OSR3_10
Protects unborn baby
1=Yes 2=No
OSR3_11
Helps to be smart 1=Yes 2=No
OSR3_12
Don´t know/ don´t remember
1=Yes 2=No
OSR3_13
Other (specify) 1=Yes 2=No (skip to OSR4)
Text OSR3_13other
Type the “other” option
Single choice OSR4 Have you ever bought products with the “Obaasima” seal/logo
1=Yes 2=No (skip to SLB1)
Single choice OSR5 Do you prefer products with “Obaasima” seal/logo over products without logo
1=Yes 2=No (skip to OSR 7)
OSR6 Why do you prefer Obaasima products?
OSR6_1 Is good quality/trustworthy product
1=Yes 2=No
ANF4W Endpoint Survey, Ghana, 2017 98 ‐
OSR6_2 Contains vitamin and minerals
1=Yes 2=No
OSR6_3 Is good for health 1=Yes 2=No
OSR6_4 Is good for young women/ pregnant women
1=Yes 2=No
OSR6_5 Gives strength 1=Yes 2=No
OSR6_6 Keeps energy level high
1=Yes 2=No
OSR6_7 Boosts immune system
1=Yes 2=No
OSR6_8 Is important for a long life
1=Yes 2=No
OSR6_9 Helps to become pregnant
1=Yes 2=No
OSR6_10
Protects unborn baby
1=Yes 2=No
OSR6_11
Don´t know/ don´t remember
1=Yes 2=No
OSR6_12
Other (specify) 1=Yes 2=No (skip to OSR4)
Single choice
OSR7 Last time you bought products with “Obaasima” seal/logo from where did you purchase them?
1= Supermarket 2= Shop 3= Kiosk 4= Market/ street stand 5= Moving street vendor 6= Pharmacy (skip to SAB 18)___________ 88= other (specify)
Specialty Product “ Lola milk biscuits” (SLB)
Single choice SLB1 Do you ever eat biscuits?
1=Yes 2=No (skip to SLB3)
Single choice SLB2 What is the name of biscuit you usually eat?
clarify with: the name of biscuit that you consume most
1= Lola milk biscuit 2= Lola other biscuits 3= Digestive 4= Perk 5= Jack ‘n’ Jill 6= Bonita 7= Cream Cracker 8= King Cracker 9= Malt & Milk 10= Milk biscuit 11= Munchee 12= Milky Magic (Skip to SLB3)_____________ 11= Other brand
ANF4W Endpoint Survey, Ghana, 2017 99 ‐
Text SLB2other
What is the name of the other brand?
Single choice SLB3 Have you ever seen or / heard of “Lola milk biscuits”
Show the package of Lola biscuits
1=Yes 2=No (skip to SBS1)
Multiple choice
SLB4 Where did you see/ hear of “Lola milk biscuits”
Do not prompt. Probe “Anything else?”.
SLB4_1 TV 1=Yes 2=No
SLB4_2 Radio 1=Yes 2=No
SLB4_3 Billboards 1=Yes 2=No
SLB4_4 Posters/ Street Median
1=Yes 2=No
SLB4_5 Church meeting 1=Yes 2=No
SLB4_6 Health clinic/ health worker
1=Yes 2=No
SLB4_7 Community leaders 1=Yes 2=No
SLB4_8 Relative/ friends/ neighbor
1=Yes 2=No
SLB4_9 Shopkeeper/ pharmacy
1=Yes 2=No
SLB4_10
Social media/facebook
1=Yes 2=No
SLB4_11
Market place/ market
1=Yes 2=No
SLB4_12
Don´t know/ don´t remember
1=Yes 2=No
SLB4_13
Other 1=Yes 2=No (skip to SLB5)
Text SLB4_13other
Type the “other” option
Single choice SLB5 Do you know where to buy “Lola milk biscuits”?
1=Yes 2=No (skip to SLB7)
Multiple choice
SLB5 Where can you buy the products?
Do not prompt. Probe “Anything else?”
SLB5_1 Shop 1=Yes 2=No
SLB5_2 Kiosk 1=Yes 2=No
SLB5_3 Market/street stand
1=Yes 2=No
SLB5_4 Moving street vendor
1=Yes 2=No
ANF4W Endpoint Survey, Ghana, 2017 100 ‐
SLB5_5 Other (specify) 1=Yes 2=No (skip to SLB6)
SLB5_6other
Type the “other” option
Single choice SLB6 How far is the closest place you can buy the product?
1= Time 2= Distance (skip to SLB6_2) 8= Don´t know (skip to SLB7)
Number SLB6_1 Time in minutes Enter time in minutes
(record, then skip to SLB7)
Number SLB6_2 Distance in meters Enter distance in meters
Single choice SLB7 Have you ever eaten “Lola milk biscuits”?
1=Yes (skip to SLB 9) 2=No
Multiple choice
SLB8 Why have you never eaten “Lola milk biscuits” before?
Do not prompt. Probe “Anything else?”
SLB8_1 Dislikes taste 1=Yes 2=No
SLB8_2 Dislikes packaging 1=Yes 2=No
SLB8_3 Is too expensive 1=Yes 2=No
SLB8_4 Is not easily available
1=Yes 2=No
SLB8_5 Dislikes how it is promoted
1=Yes 2=No
SLB8_6 Is not a good quality/ trustworthy product
1=Yes 2=No
SLB8_7 Don’t eat biscuits 1=Yes 2=No
SLB8_8 Do not see a need for the Lola milk biscuits
1=Yes 2=No
SLB8_9 Heard of bad experience of someone else
1=Yes 2=No
SLB8_1
0
Advised not to use it
1=Yes 2=No
SLB8_1
1
Has not seen other women use it
1=Yes 2=No
SLB8_1
2
Other family members discourage using it
1=Yes 2=No
ANF4W Endpoint Survey, Ghana, 2017 101 ‐
SLB8_1
3
Contains added artificial ingredients such as vitamins and minerals
1=Yes 2=No
SLB8_1
4
Too much sugar/ too sweet
1=Yes 2=No
SLB8_1
5
Is not good for health
1=Yes 2=No
SLB8_1
6
Is not good for young women/ pregnant women
1=Yes 2=No
SLB8_1
7
Don’t know / Don’t remember
1=Yes 2=No
SLB8_1
8
Other 1=Yes 2=No (skip to SLB15)
Text SLB8_1
8other
Type the “other” option
(enter, then skip to SLB15)
Single choice SLB9 How often do you usually eat “Lola milk biscuits”?
1= several times a day 2= once a day 3= Every other day 4= once or twice a week 5= less than once a week 6= every second week 7=once a month 8= less than once a month
Single choice SLB10 Each time you eat “Lola milk biscuits”, how much do you usually eat?
1= half a biscuit 2= one biscuit 3= two biscuits 4= three biscuits 5= four or more biscuits
Single choice SLB11 How long ago did you last eat “Lola milk biscuits”
1=today (skip to SLB15) 2=day(s) ago 3=week(s) ago (skip to SLB13) 4=month(s) ago (skip to SLB14)
Integer SLB12 Number of days (skip to SLB15)
Integer SLB 13 Number of weeks If greater than 8 weeks, record time as months
(skip to SLB15)
Integer SLB 14 Number of months
Single choice SLB15 Does anyone else in the household eat “Lola milk biscuits”
1=Yes 2=No (enter, then skip to SBS1 if 2=No in SLB7 or to
ANF4W Endpoint Survey, Ghana, 2017 102 ‐
SLB17 if 1=Yes in SLB7) 3= don´t know (enter, then skip to SBS1 if 2=No in SLB7 or to SLB17 if 1=Yes in SLB7)
Multiple choice
SLB 16 Who else? Do not prompt. Probe “Anybody else?”
SLB16_1
Another female adult or teenager
1=Yes 2=No
SLB16_2
A male adult or teenager
1=Yes 2=No
SLB16_3
A child 1=Yes 2=No
Single choice SLB17 The last time you got “Lola milk biscuits”, how did you get them?
1= Bought/purchased them 2= Received them for free (Skip to SLB17_2) 3= Never got “Lola milk biscuits” (skip to SBS1) 4= Don't remember (Skip to SLB20)
Single choice
SLB17_1
From where did you purchase them?
1= Supermarket 2= Shop 3= Kiosk 4= Market/ street stand 5= Moving street vendor (skip to SLB 18)___________ 88= other (specify)
SLB17_1other
Type the “other” option
Skip to SLB18
Single choice
SLB17_2
From where did you receive them for free?
1= Relatives/ friends/ neighbor 2= Health worker 3= NGO/ religious association (skip to SLB20)___________ 88= other (specify)
Text SLB17_2 other
Type the “other” option
Skip to SLB20
Integer SLB18 The last time you bought “Lola milk biscuits”, how
If ‘don’t know’, record 888
ANF4W Endpoint Survey, Ghana, 2017 103 ‐
many packages did you buy?
Integer SLB19 The last time you bought “Lola milk biscuits”, how much did you pay for the unit purchased?
In GHS. If ‘don’t know’, record 888
Multiple choice
SLB20 What do you like about “Lola milk biscuits”
Do not prompt. Probe “Anything else?”
SLB20_1
Likes the taste 1=Yes 2=No
SLB20_2
Likes the packaging 1=Yes 2=No
SLB20_3
Likes the price 1=Yes 2=No
SLB20_4
Is easily available 1=Yes 2=No
SLB20_5
Likes how it is promoted
1=Yes 2=No
SLB20_6
Is a good quality /trustworthy product
1=Yes 2=No
SLB20_7
Is locally produced 1=Yes 2=No
SLB20_8
Carries the Obaasima seal
1=Yes 2=No
SLB20_9
Contains minerals and vitamins
1=Yes 2=No
SLB20_10
Contains small amount of sugar/ not too sweet
1=Yes 2=No
SLB20_11
Is good for health 1=Yes 2=No
SLB20_12
Is good for young women/ pregnant women
1=Yes 2=No
SLB20_13
Keeps energy level high
1=Yes 2=No
SLB20_14
Product gives strength
1=Yes 2=No
SLB20_15
Helps to become pregnant
1=Yes 2=No
SLB20_16
Helps to be smart 1=Yes 2=No
SLB20_17
Don´t know/ don´t remember
1=Yes 2=No
SLB20_18
Other (specify) 1=Yes 2=No (skip to SLB 22)
ANF4W Endpoint Survey, Ghana, 2017 104 ‐
Text SLB20_18other
Type the “other” option
Multiple choice
SLB21 What do you not like about “Lola milk biscuits”
Do not prompt. Probe “Anything else?”
SLB21_1
Dislikes taste 1=Yes 2=No
SLB21_2
Dislikes packaging 1=Yes 2=No
SLB21_3
Is too expensive 1=Yes 2=No
SLB21_4
Dislikes how it is promoted
1=Yes 2=No
SLB21_5
Is not easily available
1=Yes 2=No
SLB21_6
Carries the Obaasima seal
1=Yes 2=No
SLB21_7
Is not a good quality/ trustworthy product
1=Yes 2=No
SLB21_8
Contains added artificial ingredients such as vitamins and minerals
1=Yes 2=No
SLB21_9
Contains too much sugar/ too sweet
SLB21_10
Is not good for health
1=Yes 2=No
SLB21_11
Is not good for young women/ pregnant women
1=Yes 2=No
SLB21_12
Don´t know/ don´t remember
1=Yes 2=No
SLB2_13
Other (specify) 1=Yes 2=No (skip to SLB 23)
Text SLB21_13other
Type the “other” option
Single choice SLB22 Can you tell me any health benefits of ‘Lola milk biscuits’?
1=Yes 2=No (skip to SLB24)
Text SLB23 Which health benefits does it have?
SLB23_1
Contains vitamin and minerals
1=Yes 2=No
SLB23_2
Is good for young women/ pregnant women
1=Yes 2=No
SLB23_3
Contains small amount of sugar
1=Yes 2=No
ANF4W Endpoint Survey, Ghana, 2017 105 ‐
SLB23_4
Helps to be smart 1=Yes 2=No
SLB23_5
Gives strength 1=Yes 2=No
SLB23_6
Keeps energy level high
1=Yes 2=No
SLB23_7
Boosts immune system
1=Yes 2=No
SLB23_8
Is important for a long life
1=Yes 2=No
SLB23_9
Helps to become pregnant
1=Yes 2=No
SLB23_10
Protects unborn baby
1=Yes 2=No
SLB23_11
Don´t know/ don´t remember
1=Yes 2=No
SLB23_12
Other (specify) 1=Yes 2=No (skip to SBS1))
SLB23_12other
Type the “other” option
Specialty Product “SAMBA SHITO sauce” (SBS)
Single choice
SBS1 Do you eat Shito Sauce at all?
1=Yes 2=No (skip to SBS3)
Single choice
SBS2 What is the main brand of Shito Sauce consumed by you?
clarify with: the brand that you consume most
1= Samba Shito 2= Homemade 3= unbranded Shito from chop bar/ restaurant/ vendor (Skip to SBS3)_____________ 11= Other brand
Text SBS2other
What is the name of the other brand?
Single choice
SBS3 Have you ever seen/ heard of “Samba Shito Sauce”
Show the package of Samba Shito Sauce
1=Yes 2=No (skip to STV1)
Multiple choice
SBS4 Where did you see/ hear of “Samba Shito Sauce”
Do not prompt. Probe “Anything else?”.
SBS4_1 TV 1=Yes 2=No
SBS4_2 Radio 1=Yes 2=No
SBS4_3 Billboards 1=Yes 2=No
SBS4_4 Posters/ Street Median
SBS4_5 Church meeting 1=Yes 2=No
ANF4W Endpoint Survey, Ghana, 2017 106 ‐
SBS4_6 Health clinic/ health worker
1=Yes 2=No
SBS4_7 Community leaders 1=Yes 2=No
SBS4_8 Relative/ friends/ neighbor
1=Yes 2=No
SBS4_9 Shopkeeper/ pharmacy
1=Yes 2=No
SBS2_10
Social media/facebook
1=Yes 2=No
SBS4_11
Market place/ market
1=Yes 2=No
SBS4_12
Don´t know/ don´t remember
1=Yes 2=No
SBS4_13
Other 1=Yes 2=No (skip to SBS5)
Text SBS4_13other
Type the “other” option
Single choice
SBS5 Do you know where to buy “Samba Shito Sauce”?
1=Yes 2=No (skip to SBS7)
Multiple choice
SBS5 Where can you buy the product?
Do not prompt. Probe “Anything else?”
SBS5_1 Shop 1=Yes 2=No
SBS5_2 Kiosk 1=Yes 2=No
SBS5_3 Market/street stand
1=Yes 2=No
SBS5_4 Moving street vendor
1=Yes 2=No
SBS5_6 Other (specify) 1=Yes 2=No (skip to SBS6)
SBS5_6other
Type the “other” option
Single choice
SBS6 How far is the closest place you can buy the product?
1= Time 2= Distance (skip to SBS6_2) 8= Don´t know (skip to SBS7)
Number SBS6_1 Time in minutes Enter time in minutes
(record, then skip to SBS7)
Number SBS6_2 Distance in meters Enter distance in meter
Single choice
SBS7 Have you ever eaten “Samba Shito Sauce”?
1=Yes (skip to SBS 9) 2=No
Multiple choice
SBS8 Why have you never eaten “Samba Shito
Do not prompt. Probe “Anything else?”
ANF4W Endpoint Survey, Ghana, 2017 107 ‐
Sauce” before?
SBS8_1 Dislikes taste 1=Yes 2=No
SBS8_2 Dislikes packaging 1=Yes 2=No
SBS8_3 Is too expensive 1=Yes 2=No
SBS8_4 Is not easily available
1=Yes 2=No
SBS8_5 Dislikes how it is promoted
1=Yes 2=No
SBS8_6 Is not a good quality/ trustworthy product
1=Yes 2=No
SBS8_7 Don’t eat Shito Sauce
1=Yes 2=No
SBS8_8 Do not see a need for Samba Shito Sauce
1=Yes 2=No
SBS8_9 Heard of bad experience of someone else
1=Yes 2=No
SBS8_1
1
Has not seen other women use it
1=Yes 2=No
SBS8_1
2
Other family members discourage using it
1=Yes 2=No
SBS8_1
3
Contains added artificial ingredients such as vitamins and minerals
1=Yes 2=No
SBS8_1
4
Is not good for health
1=Yes 2=No
SBS8_1
5
Is not good for young women/ pregnant women
1=Yes 2=No
SBS8_1
6
Don’t know / Don’t remember
1=Yes 2=No
SBS8_1
7
Other 1=Yes 2=No (skip to SBS14)
Text SBS8_1
7other
Type the “other” option
(enter, then skip to SBS14)
Single choice
SBS9 How often do you usually eat “Samba
1= several times a day 2= once a day
ANF4W Endpoint Survey, Ghana, 2017 108 ‐
Shito Sauce”? 3= Every other day 4= once or twice a week 5= less than once a week 6= every second week 7=once a month 8= less than once a month
Single choice
SBS10 Each time you eat “Samba Shito Sauce”, how much do you usually eat?
1= half a sachet 2= one sachet 3= one and a half sachet 4= two sachets 5= more than two sachets
Single choice
SBS11 How long ago did you last eat “Samba Shito Sauce”
1=today (skip to SBS15) 2=day(s) ago 3=week(s) ago (skip to SBS13) 4=month(s) ago (skip to SBS14)
Integer SBS12 Number of days (skip to SBS15)
Integer SBS 13 Number of weeks If greater than 8 weeks, record time as months
(skip to SBS15)
Integer SBS 14 Number of months
Single choice
SBS15 Does anyone else in the household eat “Samba Shito Sauce”
1=Yes 2=No (enter, then skip to STV1 if 2=No in SBS7 or to SBS17 if 1=Yes in SBS7) 3= don´t know (enter, then skip to STV1 if 2=No in SBS7 or to SBS17 if 1=Yes in SBS7)
Multiple choice
SBS 16 Who else? Do not prompt. Probe “Anybody else?”
SBS16_1
Another female adult or teenager
1=Yes 2=No
SBS16_2
A male adult or teenager
1=Yes 2=No
SBS16_3
A child 1=Yes 2=No
Single choice
SBS17 The last time you got “Samba Shito Sauce”, how did you get them?
1= Bought/purchased them2= Received them for free (Skip to SBS17_2) 3= Never got “Samba Shito Sauce” (skip to SBS1) 3= Don't remember (Skip to SBS20)
ANF4W Endpoint Survey, Ghana, 2017 109 ‐
Single choice
SBS17_1
From where did you purchase them?
1= Supermarket 2= Shop 3= Kiosk 4= Market/ street stand 5= Moving street vendor (skip to SBS 18)___________ 88= other (specify)
SBS17_1other
Type the “other” option
Skip to SBS18
Single choice
SBS17_2
From where did you receive them for free?
1= Relatives/ friends/ neighbor 2= Health worker 3= NGO/ religious association (skip to SBS20)___________ 88= other (specify)
Text SBS17_2 other
Type the “other” option
Skip to SBS20
Integer SBS18 The last time you bought “Samba Shito Sauce”, how many sachets did you buy ?
If ‘don’t know’, record 888
Integer SBS19 The last time you bought “Samba Shito Sauce”, how much did you pay for the sachet purchased?
In GHS. If ‘don’t know’, record 888
Multiple choice
SBS20 What do you like about “Samba Shito Sauce”
Do not prompt. Probe “Anything else?”
SBS20_1
Likes the taste 1=Yes 2=No
SBS20_2
Likes the packaging 1=Yes 2=No
SBS20_3
Likes the price 1=Yes 2=No
SBS20_4
Is easily available 1=Yes 2=No
SBS20_5
Likes how it is promoted
1=Yes 2=No
SBS20_6
Is a good quality /trustworthy product
1=Yes 2=No
SBS20_7
Is locally produced 1=Yes 2=No
ANF4W Endpoint Survey, Ghana, 2017 110 ‐
SBS20_8
Carries the Obaasima seal
1=Yes 2=No
SBS20_9
Contains minerals and vitamins
1=Yes 2=No
SBS20_10
Is good for health
SBS20_11
Is good for young women/ pregnant women
1=Yes 2=No
SBS20_12
Keeps energy level high
1=Yes 2=No
SBS20_13
Product gives strength
1=Yes 2=No
SBS20_14
Helps to become pregnant
1=Yes 2=No
SBS20_15
Helps to be smart 1=Yes 2=No
SBS20_16
Don´t know/ don´t remember
1=Yes 2=No
SBS20_17
Other (specify) 1=Yes 2=No (skip to SBS 21)
Text SBS20_17other
Type the “other” option
Multiple choice
SBS21 What do you not like about “Samba Shito Sauce”
Do not prompt. Probe “Anything else?”
SBS21_1
Dislikes taste 1=Yes 2=No
SBS21_2
Dislikes packaging 1=Yes 2=No
SBS21_3
Is too expensive 1=Yes 2=No
SBS21_4
Dislikes how it is promoted
1=Yes 2=No
SBS21_5
Is not easily available
1=Yes 2=No
SBS21_6
Carries the Obaasima seal
1=Yes 2=No
SBS21_7
Is not a good quality/ trustworthy product
1=Yes 2=No
SBS21_8
Contains added artificial ingredients such as vitamins and minerals
1=Yes 2=No
SBS21_9
Is not good for health
1=Yes 2=No
SBS21_10
Is not good for young women/ pregnant women
1=Yes 2=No
ANF4W Endpoint Survey, Ghana, 2017 111 ‐
Don´t know/ don´t remember
SBS21_11
Other (specify) 1=Yes 2=No (skip to SBS 22)
Text SBS21_11other
Type the “other” option
Single choice
SBS22 Can you tell me any the health benefits of ‘Samba Shito Sauce’?
1=Yes 2=No (skip to STV1)
Text SBS23 Which health benefits does it have?
SBS23_1
Contains vitamin and minerals
1=Yes 2=No
SBS23_2
Is good for young women/ pregnant women
1=Yes 2=No
SBS23_3
Helps to be smart 1=Yes 2=No
SBS23_4
Gives strength 1=Yes 2=No
SBS23_5
Keeps energy level high
1=Yes 2=No
SBS23_6
Boosts immune system
1=Yes 2=No
SBS23_7
Is important for a long life
1=Yes 2=No
SBS23_8
Helps to become pregnant
1=Yes 2=No
SBS23_9
Protects unborn baby
1=Yes 2=No
SBS23_10
Don´t know/ don´t remember
1=Yes 2=No
SBS23_11
Other (specify) 1=Yes 2=No (skip to STV1)
SBS23_11other
Type the “other” option
Specialty Product “Tom Vita” porridge (STV)
Single choice
STV1 Do you eat porridge at all?
1=Yes 2=No (skip to STV3)
Single choice
STV2 What is the main type of porridge consumed by you?
clarify with: the brand that you consume most
1= Tom Vita 2= Cerevita 3= Cerelac 4= Yumvita 5= Bledine 6= Maisoyforte 7= Zimbegu 8= Tom Brown (unbranded) 9= koko (unbranded) 10= hausa koko
ANF4W Endpoint Survey, Ghana, 2017 112 ‐
(unbranded) 11= wheat porridge (unbranded) 12= oats porridge (unbranded) (Skip to STV3)_____________ 13= Other brand/type
Text STV2other
What is the name of the other brand?
Single choice
STV3 Have you ever seen/ heard of „Tom Vita” porridge
Show the package of Tom Vita
1=Yes 2=No (skip to MFR1)
Multiple choice
STV4 Where did you see/ hear of „Tom Vita” porridge
Do not prompt. Probe “Anything else?”.
STV4_1 TV 1=Yes 2=No
STV4_2 Radio 1=Yes 2=No
STV_3 Billboards 1=Yes 2=No
STV4_4 Posters/ Street Median
1=Yes 2=No
STV4_5 Church meeting 1=Yes 2=No
STV4_6 Health clinic/ health worker
1=Yes 2=No
STV4_7 Community leaders 1=Yes 2=No
STV4_8 Relative/ friends/ neighbor
1=Yes 2=No
STV4_9 Shopkeeper/ pharmacy
1=Yes 2=No
STV2_10
Social media/facebook
1=Yes 2=No
STV4_11
Market place/ market
1=Yes 2=No
STV4_12
Don´t know/ don´t remember
1=Yes 2=No
STV4_13
Other 1=Yes 2=No (skip to STV5)
Text STV4_13other
Type the “other” option
Single choice
STV5 Do you know where to buy „Tom Vita” porridge?
1=Yes 2=No (skip to STV7)
Multiple choice
STV5 Where can you buy the product?
Do not prompt. Probe “Anything else?”
ANF4W Endpoint Survey, Ghana, 2017 113 ‐
STV5_1 Shop 1=Yes 2=No
STV5_2 Kiosk 1=Yes 2=No
STV5_3 Market/street stand
1=Yes 2=No
STV5_4 Moving street vendor
1=Yes 2=No
STV5_5 Pharmacy 1=Yes 2=No
STV5_6 Other (specify) 1=Yes 2=No (skip to STV6)
STV5_6other
Type the “other” option
Single choice
STV6 How far is the closest place you can buy the product?
1= Time 2= Distance (skip to STV6_2) 8= Don´t know (skip to STV7)
Number STV6_1 Time in minutes Enter time in minutes
(record, then skip to STV7)
Number STV6_2 Distance in meters Enter distance in meter
Single choice
STV7 Have you ever eaten „Tom Vita” porridge?
1=Yes (skip to STV 9) 2=No
Multiple choice
STV8 Why have you never eaten „Tom Vita” porridge before?
Do not prompt. Probe “Anything else?”
STV8_1 Dislikes taste 1=Yes 2=No
STV8_2 Dislikes packaging 1=Yes 2=No
STV8_3 Is too expensive 1=Yes 2=No
STV8_4 Is not easily available
1=Yes 2=No
STV8_5 Dislikes how it is promoted
1=Yes 2=No
STV8_6 Is not a good quality/ trustworthy product
1=Yes 2=No
STV8_7 Don’t eat porridge 1=Yes 2=No
STV8_8 Too much sugar/ too sweet
1=Yes 2=No
STV8_9 Do not see a need for „Tom Vita” porridge
1=Yes 2=No
ANF4W Endpoint Survey, Ghana, 2017 114 ‐
STV8_10
Heard of bad experience of someone else
1=Yes 2=No
STV8_11
Advised not to use it
1=Yes 2=No
STV8_12
Has not seen other women use it
1=Yes 2=No
STV8_13
Other family members discourage using it
1=Yes 2=No
STV8_14
Contains added artificial ingredients such as vitamins and minerals
1=Yes 2=No
STV8_15
Is not good for health
1=Yes 2=No
STV8_16
Is not good for young women/ pregnant women
1=Yes 2=No
STV8_17
Don’t know / Don’t remember
1=Yes 2=No
STV8_18
Other 1=Yes 2=No (skip to STV16)
Text STV8_18other
Type the “other” option
(enter, then skip to STV14)
Single choice
STV9 How often do you usually eat „Tom Vita” porridge?
1= several times a day 2= once a day 3= Every other day 4= once or twice a week 5= less than once a week 6= every second week 7=once a month 8= less than once a month
Single choice
STV10 Each time you eat „Tom Vita” porridge, how much do you usually eat?
1= quarter of a sachet 2= half sachet 3= two thirds of a sachet 4= one sachet 5= more than one sachet
Single choice
STV11 How long ago did you last eat „Tom Vita” porridge
1=today (skip to STV15) 2=day(s) ago 3=week(s) ago (skip to STV13) 4=month(s) ago (skip to STV14)
Integer STV12 Number of days (skip to STV15)
Integer STV 13 Number of weeks If greater than 8 weeks, record time as months
(skip to STV15)
Integer STV 14 Number of months
ANF4W Endpoint Survey, Ghana, 2017 115 ‐
Single choice
STV_15 At what time of the day do you eat “Tom Vita” porridge
1= for breakfast 2= snack between breakfast and lunch 3= lunch 4= snack between lunch and dinner 5= dinner 6= after dinner (skip to STV16) 7= other
STV_15other
Type the “other” option
Single choice
STV16 Does anyone else in the household eat „Tom Vita” porridge
1=Yes 2=No (enter, then skip to MFR1 if 2=No in STV7 or to STV18 if 1=Yes in STV7) 3= don´t know (enter, then skip to MFR1 if 2=No in STV7 or to STV18 if 1=Yes in STV7)
Multiple choice
STV 17 Who else? Do not prompt. Probe “Anybody else?”
STV17_1
Another female adult or teenager
1=Yes 2=No
STV17_2
A male adult or teenager
1=Yes 2=No
STV17_3
A child 1=Yes 2=No
Single choice
STV18 The last time you got „Tom Vita” porridge, how did you get them?
1= Bought/purchased them 2= Received them for free (Skip to STV18_2) 3= Never got „Tom Vita” porridge (skip to MFR1) 3= Don't remember (Skip to STV21)
Single choice
STV18_1
From where did you purchase them?
1= Supermarket 2= Shop 3= Kiosk 4= Market/ street stand 5= Moving street vendor 6= Pharmacy (skip to STV 19)___________ 88= other (specify)
STV18_1other
Type the “other” option
Skip to STV19
Single choice
STV18_2
From where did you receive them for free?
1= Relatives/ friends/ neighbor 2= Health worker
ANF4W Endpoint Survey, Ghana, 2017 116 ‐
3= NGO/ religious association (skip to STV21)___________ 88= other (specify)
Text STV18_2 other
Type the “other” option
Skip to STV21
Integer STV19 The last time you bought „Tom Vita” porridge, how many sachets did you buy?
If ‘don’t know’, record 888
Integer STV20 The last time you bought „Tom Vita” porridge, how much did you pay for one sachet?
In GHS. If ‘don’t know’, record 888
Multiple choice
STV21 What do you like about „Tom Vita” porridge
Do not prompt. Probe “Anything else?”
STV21_1
Likes the taste 1=Yes 2=No
STV21_2
Likes the packaging 1=Yes 2=No
STV21_3
Likes the price 1=Yes 2=No
STV21_4
Is easily available 1=Yes 2=No
STV21_5
Likes how it is promoted
1=Yes 2=No
STV21_6
Is a good quality /trustworthy product
1=Yes 2=No
STV21_7
Is locally produced 1=Yes 2=No
STV21_8
Carries the Obaasima seal
1=Yes 2=No
STV21_9
Contains minerals and vitamins
1=Yes 2=No
STV21_10
Contains small amount of sugar/ not too sweet
1=Yes 2=No
STV21_11
Is good for health 1=Yes 2=No
STV21_12
Is good for young women/ pregnant women
1=Yes 2=No
STV21_13
Keeps energy level high
1=Yes 2=No
STV21_14
Product gives strength
1=Yes 2=No
ANF4W Endpoint Survey, Ghana, 2017 117 ‐
STV21_15
Helps to become pregnant
1=Yes 2=No
STV21_16
Helps to be smart 1=Yes 2=No
STV21_17
Don´t know/ don´t remember
1=Yes 2=No
STV21_18
Other (specify) 1=Yes 2=No (skip to STV 22)
Text STV21_18other
Type the “other” option
Multiple choice
STV22 What do you not like about „Tom Vita” porridge
Do not prompt. Probe “Anything else?”
STV22_1
Dislikes taste 1=Yes 2=No
STV22_2
Dislikes packaging 1=Yes 2=No
STV22_3
Is too expensive 1=Yes 2=No
STV22_4
Dislikes how it is promoted
1=Yes 2=No
STV22_5
Is not easily available
1=Yes 2=No
STV22_6
Carries the Obaasima seal
1=Yes 2=No
STV22_7
Is not a good quality/ trustworthy product
1=Yes 2=No
STV22_8
Contains added artificial ingredients such as vitamins and minerals
1=Yes 2=No
STV22_9
Contains too much sugar/ too sweet
1=Yes 2=No
STV22_10
Is not good for health
1=Yes 2=No
STV22_11
Is not good for young women/ pregnant women
1=Yes 2=No
STV22_12
Don´t know/ don´t remember
1=Yes 2=No
STV22_13
Other (specify) 1=Yes 2=No (skip to STV 23)
Text STV22_13other
Type the “other” option
Single choice
STV23 Can you tell me any the health benefits of “Tom Vita” porridge”?
1=Yes 2=No (skip to STV25)
ANF4W Endpoint Survey, Ghana, 2017 118 ‐
Text STV24 Which health benefits does it have?
STV24_1
Contains vitamin and minerals
1=Yes 2=No
STV24_2
Is good for young women/ pregnant women
1=Yes 2=No
STV24_3
Contains small amount of sugar
1=Yes 2=No
STV24_4
Helps to be smart 1=Yes 2=No
STV24_5
Gives strength 1=Yes 2=No
STV24_6
Keeps energy level high
1=Yes 2=No
STV24_7
Boosts immune system
1=Yes 2=No
STV24_8
Is important for a long life
1=Yes 2=No
STV24_9
Helps to become pregnant
1=Yes 2=No
STV24_10
Protects unborn baby
1=Yes 2=No
STV24_11
Don´t know/ don´t remember
1=Yes 2=No
STV24_12
Other (specify) 1=Yes 2=No (skip to MFR 1)
STV24_12other
Type the “other” option
MUAC and final result (MFR)
Integer MFR1 MUAC Take the MUAC of the woman on her left arm Record MUAC in millimeter; if arm too large, record 777
Single Choice
MFR2 Questionnaire successfully completed
1=Yes (end of questionnaire) 2=No
Single Choice
MFR3 Reasons for not completing the questionnaire
1= woman not at home (in this case questionnaire must remain active, so that it might be filled in at second visit) 2= woman refused interview 3= other (in this case questionnaire must remain
ANF4W Endpoint Survey, Ghana, 2017 119 ‐
active, so that it might be filled in at second visit)
Text MFR4 Type the “other” option
Geopoint
MFR5 Record your location:
You need to be outside to record the location. If the accuracy is less or equal to 12 meter, you can save the location. Do not forget to SWITCH ON YOUR GPS and switch off afterwards.