54
IFPRI Discussion Paper 01912 March 2020 Affordability of Nutritious Diets in Rural India Kalyani Raghunathan Derek Headey Anna Herforth Poverty, Health, and Nutrition Division

IFPRI Discussion Paper 01912
March 2020
Affordability of Nutritious Diets in Rural India
Kalyani Raghunathan
Derek Headey
Anna Herforth
Poverty, Health, and Nutrition Division

INTERNATIONAL FOOD POLICY RESEARCH INSTITUTE The International Food Policy Research Institute (IFPRI), a CGIAR Research Center established in 1975, provides research-based policy solutions to sustainably reduce poverty and end hunger and malnutrition. IFPRI’s strategic research aims to foster a climate-resilient and sustainable food supply; promote healthy diets and nutrition for all; build inclusive and efficient markets, trade systems, and food industries; transform agricultural and rural economies; and strengthen institutions and governance. Gender is integrated in all the Institute’s work. Partnerships, communications, capacity strengthening, and data and knowledge management are essential components to translate IFPRI’s research from action to impact. The Institute’s regional and country programs play a critical role in responding to demand for food policy research and in delivering holistic support for country-led development. IFPRI collaborates with partners around the world.
AUTHORS Kalyani Raghunathan ([email protected]) is a Research Fellow in the Poverty, Health, and Nutrition Division of the International Food Policy Research Institute (IFPRI), New Delhi, India.
Derek Headey ([email protected]) is a Senior Research Fellow in the Poverty, Health, and Nutrition Division of IFPRI, Yangon, Myanmar.
Anna Herforth ([email protected]) is an independent consultant.
Notices
1 IFPRI Discussion Papers contain preliminary material and research results and are circulated in order to stimulate discussion and critical comment. They have not been subject to a formal external review via IFPRI’s Publications Review Committee. Any opinions stated herein are those of the author(s) and are not necessarily representative of or endorsed by IFPRI.
2 The boundaries and names shown and the designations used on the map(s) herein do not imply official endorsement or acceptance by the International Food Policy Research Institute (IFPRI) or its partners and contributors.
3 Copyright remains with the authors. The authors are free to proceed, without further IFPRI permission, to publish this paper, or any revised version of it, in outlets such as journals, books, and other publications.

i
TABLES
Table 1. Recommended serving sizes and number of servings per day in India's Food-based
Dietary Guidelines 9 Table 2. Descriptive statistics for the National Sample Survey (NSS) Rural Consumer Price (RPC)
2001-2011 dataset by food group 12 Table 3. The five most common food items in CoRD (nationally) based on total district-year
observations 14 Table 4: Trends in cost per serving, wages, CoRD, and CoRD/wage ratios for rural India 16 Table 5: Estimating poverty headcounts and poverty gaps for the rural Indian population in 2011
when CoRD is used in alternative poverty lines 23 Table A.1: Densities for liquid food items 37 Table A.2: Most common items appearing in CoRD, by state 38 Table A.3: CoRD as a % of unskilled wages by state, 2001 and 2011 41 Table A.4: CoRD and unskilled labor wages for men and women, 2011 42 Table A.5: Unskilled labor wages for men and women as a percentage of state-wise MGNREGA
minimum wages, 2005 and 2011 43 Table A.6: CoRD as a percentage of the Mahatma Gandhi National Rural Employment Guarantee
Act (MGNREGA) minimum wages for men and women, by state, 2005 & 2011 44
ii
FIGURES
Figure 1. Real food prices per edible serving by food group for rural India in 2001 and 2011 (in 2011 rupees) 13
Figure 2: Food group-wise contribution to CoRD based on expected servings, 2001-2011 17
Figure 3: Percent change in CoRD as a fraction of wages from 2001 to 2011, across states 19
Figure 4: Percent change in CoRD as a fraction of minimum wages from 2005 to 2011, across states 21
Figure 5: Proportional seasonal changes in fruit prices, vegetable prices, male CoRD, male wages and male CoRD/wage ratios relative to January 25
Figure A.1: Trends in real wages for men and women engaged in unskilled labour (2011 INR) 45
Figure A.2: Trends over time in CoRD relative to unskilled labor wages, men and women 45
Figure A.3: Seasonality in log of food prices by food group, over months of the year 46
Figure A.4: Nominal wholesale prices per kilogram for 2004-2018 46

iii
ABSTRACT
Malnutrition is endemic in India. In 2015-16 some 38% of preschool children were stunted and 21% were wasted, while more than half of Indian mothers and children were anemic. There are many posited explanations for the high rates of malnutrition in India, but surprisingly few discuss the role of Indian diets, particularly the affordability of nutritious diets given low wages and the significant structural problems facing India’s agricultural sector. This study was undertaken to address knowledge gaps around the affordability of nutritious diets in rural India. To do so we used nationally representative rural price and wage data to estimate the least cost means of satisfying India-specific dietary recommendations, referred to as the Cost of a Recommended Diet (CoRD), and assess the affordability of this diet relative to male and female wages for unskilled laborers. Although we find that dietary costs increased substantially over 2001-2011 for both men and women, rural wage rates increased more rapidly, implying that nutritious diets became substantially more affordable over time. However, in absolute terms nutritious diets in 2011 were still expensive relative to unskilled wages, constituting approximately 50-60% of male and about 70-80% of female daily wages, and were often even higher relative to minimum wages earned from the Mahatma Gandhi National Rural Employment Guarantee Act (MGNREGA). Since many poor households have significant numbers of dependents and substantial non-food expenditure requirements, it follows that nutritious diets are often highly unaffordable for the rural poor; we estimate that 45-64% of the rural poor cannot afford a nutritious diet that meets India’s national food-based dietary guidelines. Our results point to the need to more closely monitor food prices through a nutritional lens, and to shift India’s existing food policies away from their heavy bias towards cereals. Achieving nutritional security in India requires a much more holistic focus on improving the affordability of the full range of nutritious food groups and ensuring that economic growth results in sustained income growth for the poor. Keywords: India, cost of diet, nutrition, rural, affordability

iv
ACKNOWLEDGMENTS
We acknowledge the generous support of the Bill & Melinda Gates Foundation through the research project “Changing Access to Nutritious Diets in Africa and South Asia (CANDASA)”, OPP1182628. We would like to thank seminar participants at the Tufts-IFPRI policy seminar and the ANH Academy week for useful feedback on this paper. All remaining errors are our own.

v
ACRONYMS
CoNA Cost of Nutrient Adequacy
CoRD Cost of a recommended diet
CotD Cost of the Diet
CPI Consumer Price Index
FBDG Food-based Dietary Guideline
INR Indian Rupee
MGNREGA Mahatma Gandhi National Rural Employment Guarantee Act
NIN National Institute of Nutrition
NSS National Sample Survey
PDS Public Distribution System
USDA United States Department of Agriculture

1
1. INTRODUCTION
India performs exceptionally poorly on a wide range of undernutrition indicators, exhibiting high rates of
stunting (38%), wasting (21%) and anemia (58%) among preschoolers, and underweight (23%) and anemia
(53%) among adult women (IIPS, 2015). High prevalence rates combined with a large population mean
that India is the single largest contributor to maternal and child undernutrition world-wide. In recognition
of these problems, the current Indian government has invested considerable resources in a national nutrition
strategy, including the 2019 launch of the multi-ministry flagship initiative called the Poshan Abhiyaan
(which roughly translates to ‘nutrition mission’), the official stated goal of which is a malnutrition-free
India by 2022. However, Poshan Abhiyaan and other nutrition initiatives face a particularly daunting
challenge in rural areas where both poverty and undernutrition rates are especially high.
A complex set of factors affect nutritional status (UNICEF, 1990). These range from ‘basic’ causes (such
as resource availability, political climate) to ‘underlying’ causes (inadequate access to food, care and health
services, and an unhealthy environment), to ‘immediate’ causes (inadequate dietary intake and morbidity
or disease). Despite the relative prominence of diets at a conceptual level, the role of affordability of diets
in explaining poor nutritional outcomes has received far less attention than is warranted. Diet data are
scarce, making it difficult to even characterize the problem, but existing data reveal that fewer than 10
percent of breastfed Indian children between the ages of 6 and 23 months receive a minimum adequate diet,
with the number even lower in rural areas where households are still predominantly dependent on
agriculture (IIPS, 2015). While some research has explored the importance of child feeding practices in
reducing morbidity and improving nutrition outcomes (Dewey, 2016; Menon, Headey, Avula, & Nguyen,
2018; Paintal & Aguayo, 2016), few have focused on the broader importance of diet quality, especially for
women’s nutrition, and even fewer have discussed the cost of nutritious diets. Instead, explanations have
tended to focus more on ‘underlying’ and ‘basic’ causes such as poor sanitation and hygiene, household
income or socioeconomic status, household shocks or disaster events, and low levels of women’s education

2
and empowerment, among others (Aguayo, Nair, Badgaiyan, & Krishna, 2016; Bhagowalia, Kadiyala, &
Headey, 2012; Cavatorta, Shankar, & Flores-Martinez, 2015; Chambers & Medeazza, 2013; Coffey,
Deaton, Drèze, Spears, & Tarozzi, 2013; Corsi, Mejía-Guevara, & Subramanian, 2016; Datar, Liu,
Linnemayr, & Stecher, 2014; Fenske, Burns, Hothorn, & Rehfuess, 2013; Headey, Hoddinott, & Park,
2016; Joe, Rajaram, & Subramanian, 2016; Vir, 2016).
Multiple studies have documented the close link between agricultural production and household
consumption and food security in South Asia, typically focusing on farm-level associations (Bhagowalia et
al., 2012; Chandrasekhar, Aguayo, Krishna, & Nair, 2017; Haselow, Stormer, & Pries, 2016; Malapit,
Kadiyala, Quisumbing, Cunningham, & Tyagi, 2015; Shively & Sununtnasuk, 2015; Sibhatu, Krishna, &
Qaim, 2015). However, while some of these studies consider the role of market access, hardly any explicitly
consider the affordability of nutritious foods or nutritious diets in the markets that poor rural people use.
Indeed, studies of food expenditure patterns in rural areas of developing countries, such as Ethiopia, show
that while the poor depend heavily on their own production for the consumption of staple foods, the bulk
of their consumption of non-staple foods tends to be sourced in markets (Sibhatu & Qaim, 2017).
Dependence on markets for food acquisition is likely to be even more important in India, where landlessness
is very common, farm sizes are small and population density is high, such that many people likely live in
close proximity to food markets. Using data from the 66th (2009-10) and 68th (2011-12) rounds of National
Sample Surveys (NSS), Narayanan (2019) estimates that the district-wise average share of food sourced
from the market ranges from 68 to 74 percent, suggesting heavy reliance on markets to supplement own
production.
While physical access to markets may be relatively good in most of rural India, agricultural production
systems and markets in India are thought to perform poorly from a nutritional perspective. A history of
famine and basic caloric deficiencies prompted post-independence leaders to focus most of their resources
on cereals, catalyzing a Green Revolution that transformed the country into a major producer of rice and

3
wheat. Progress in other sectors was uneven, however. Dairy production and marketing improved in the
1970s (the so-called White Revolution) and the poultry sector saw rapid growth in the 1990s through
intensification and economies of scale. However, many other sectors have fared poorly. The production of
pulses – an important source of protein in India, especially among vegetarian populations – declined
dramatically because of the expansion of dry season irrigation for wheat and rice (Gowda, Srinivasan, Gaur,
& Saxena, 2013; Srivastava, Sivaramane, & Mathur, 2010). And while fruit and vegetable production has
increased in recent decades on the back of growing demand driven by higher incomes and urbanization,
inadequate investment in horticulture, poor storage and transportation infrastructure, and the persistence of
government-imposed regulations on food trade have resulted in very inefficient supply chains. A wide range
of policies – including input subsidies, public food distribution and price controls – continue to bias
agricultural activities towards rice and wheat, with significant implications for environmental sustainability
as well as nutrition (Pingali, Mittra, & Rahman, 2017). While policy strategies from the 2000s onwards
have increasingly tried to address food and nutrition insecurity through reforms to food and nutrition
assistance programs and social protection schemes - such as the Midday Meals Scheme that provides free
school meals to children in government and government-aided schools and the Mahatma Gandhi National
Rural Employment Guarantee Act (MGNREGA) that guarantees 100 days of employment per year to every
rural household (Raghunathan, Chakrabarti, Menon, & Alderman, 2017) - there remains widespread
concern among nutrition experts that India’s food system is not delivering adequate access to affordable
and nutritious foods.
In light of these concerns, the objective of this paper is to assess affordability of nutritious diets for the rural
poor in India. We define a nutritious diet as one meeting India’s food-based dietary guidelines (FBDGs),
as developed by India’s National Institute of Nutrition. National food-based dietary guidelines are
developed by countries to define culturally appropriate diet patterns that meet nutritional needs and protect
health. Tracking the affordability of a nutritious diet over India’s diverse regions requires long-term, high-
frequency and spatially disaggregated and representative price and income data; data which few countries

4
collect. In India we were fortunate to obtain a panel of prices for 101 food items and wages for a variety of
unskilled labor activities collected over almost all of India’s districts on a monthly basis over 2001-2011.1
This time period constituted a period of rapid economic growth, significant food inflation, and several major
policy developments in the rural economy such as the roll out of MGNREGA from 2005 onwards. We use
the price data to cost out the cheapest means of achieving the recommended diet, to examine which foods
this diet frequently selects, and describe how the cost and components of this diet change over time, by
gender, and by season. We then compare the cost of this diet to wages of male and female unskilled laborers,
which can be viewed as reservation wages/income for the poor, especially in a country where millions of
landless laborers and marginal farmers earn most of their income from selling their labor (Deaton & Drèze,
2002).2 We also use state-level data on prescribed MGNREGA wages to assess the affordability of
nutritious diets for MGNREGA participants. Finally, we examine how the affordability of the
recommended diet has varied over time and explore heterogeneity in costs and affordability across India’s
diverse states.
To the best of our knowledge, no previous published research in India has assessed the cost of a nutritious
diet relative to wages or incomes with such spatially and temporally rich data. The estimation of least cost
nutrient adequate diets has a long history going back to Stigler (1945) and continues to be applied as one
approach to assessing the cost of a nutritious diet (Chastre, Duffield, Kindness, LeJeune, & Taylor, 2009;
Deptford et al., 2017),3 although nutrient-based approaches have important conceptual and technical
shortcomings (discussed below). Our approach uses the method applied in very recent studies costing
recommended diets in South Asia (Dizon, Herforth, & Wang, 2019) and Myanmar (Mahrt, Mather,
1 Updated data have not been publicly released. 2 We do not have information on the proportion of unskilled laborers who are also landless. However, the 18 activities/occupations included in the dataset are unskilled laborer, carpenter, mason, ploughing, blacksmith, sowing, weeding, harvesting, tractor driver, transplanting, cobbler, herdsman, threshing, winnowing, well digging, sweeper, picking (for various crops) and cane crushing. Given this list, it is perhaps not unreasonable to assume that an individual classified as an unskilled laborer did not work in agriculture in that given time period. 3 The Cost of the Diet approach has been used by the World Food Programme to conduct ‘Fill the Nutrient Gap’ assessments in several countries, involving various government and non-government stakeholders, although this process has not occurred in India (WFP, 2017).
5
Herforth, & Headey, 2019), although these studies largely use single time points. In this paper the
assessment of dietary costs relative to both private labor market wages and MGNREGA wages offers scope
to assess secular changes in affordability as well as seasonal fluctuations or other shocks. Moreover, by
examining food markets through a nutritional lens, this approach constitutes a powerful tool for developing
more nutrition-sensitive food policies that reduce the market prices of comparatively expensive food groups
or that use income transfers to improve affordability of nutritious diets as a whole. Given the extensive and
multidimensional nature of undernutrition in India, more effective policies to improve access to sufficient,
safe and nutritious diets are urgently needed.

6
2. DATA AND METHODS
2.1 Data
Information on food prices and wages is taken from the Rural Price/Wage Data (Unit Level) – Schedule
3.01 dataset, collected by the National Sample Survey Organization (NSSO) of the Ministry of Statistics
and Program Implementation of the Government of India. This dataset collates market-level data at the
district level. Price data is collected at a monthly frequency for 24 states, 380 districts and 101 food items
over the period October 2001 to June 2011.4 In total these data encompass 1,772,228 item-month-district
observations. However, the panel is not balanced: not all food items are reported in every district
(presumably because not all markets in a district sell the full range of 101 products), not all districts appear
in each time period, and there are India-wide gaps in data reporting for October 2007 to June 2009.5 Hence
in total, we have 32,373 distinct district-food item combinations, and 32,743 distinct district-month
combinations. Most food items are reported in standard units of grams, kilograms, or liters.
The wage data covers the same time period and geography as the price data. It reports normal daily hours
of work and cash and in-kind wages for men, women and children across 18 distinct occupations/activities
of varying skill levels.6 However, since we were interested in using wages as a proxy for the reservation
wages of the poor, we use unskilled labor as our benchmark and retain adult (male and female) cash wage
information only for this occupation. In total, we have 5,621 distinct district-occupation combinations, and
32,070 distinct district-month combinations.
4 India has a total of 28 states and 9 Union territories, however, the 24 states covered in our dataset account for over 99% of India’s population according to the 2011 Census. 5 Data are missing for the period October 2007-June 2009, a period of very steep food price increases because of the global food crisis. Our paper therefore cannot speak to the effect of the 2007-08 global food crisis on the cost of a nutritious diet, although prices also rose quickly during 2010-11 near the end of our sample. 6 Please refer to footnote 2 for the full list of occupations included in this dataset.
7
2.2 Methods
2.2.1 Cost of recommended diet
The cost of a nutritious diet can be calculated in various ways depending on how the diet is defined. For
decades, there have been attempts to find the lowest cost of meeting nutrient needs through linear
programming (Chastre et al., 2009; Deptford et al., 2017; George & Shively, 2017; Håkansson, 2015;
Masters et al., 2018; O’Brien-Place & Tomek, 1983; Stigler, 1945). While these methods are useful in
highlighting the most nutrient-dense foods per unit of currency and which nutrients add to the cost of the
diet, the focus on nutrients has several weaknesses. First, it can result in relatively unrealistic or unpalatable
least-cost diets. Second, nutrient density alone does not satisfactorily describe the health properties of foods
and diet patterns in protecting health, given the importance of non-nutrient bioactive components of food
including fiber, antioxidant and other phytochemicals, and the food matrix. Third, consumers make dietary
choices over food groups rather than nutrients (which are largely unobservable or unknown to a typical
consumer).
The approach followed in this paper uses India’s FBDG, taken from the National Institute of Nutrition’s
2011 Dietary Guidelines for Indians: A Manual, to define a nutritionally adequate, recommended diet.
FBDGs are a definition of diets that meet nutritional needs and satisfy cultural food preferences for a
country, produced and adopted by national governments (Herforth et al., 2019). As such, they constitute
national policy, and are often the basis for designing nutrition policy and programs. Therefore, the minimum
cost of meeting a national FBDG is a highly policy-relevant metric that can lead to insights around which
parts of a nutritious diet are most or least affordable over time.
We use a price-based index to measure the Cost of Recommended Diet, or CoRD. This index is a measure
of how much it would cost to meet country-specific FBDG (Dizon et al., 2019). The India-specific FBDG
provides information on the classification of foods into food groups, the recommended serving size and the

8
minimum and maximum number of servings per food group. Somewhat unusually, it also provides gender-
and activity-specific serving size recommendations, allowing us to calculate the CoRD separately for men
and women engaged in sedentary, moderate or strenuous activities. For the purpose of index construction,
we assume that unskilled labor is a moderate activity.
India’s FBDG lists six food groups in total: starchy staples, proteins (pulses, fish, meat, eggs), dairy, fruit,
vegetables, and fats and oils (including nuts and seeds). It does, however, require that one of the vegetables
consumed be a dark green leafy vegetable, so for ease of understanding we depict that as a separate food
group in this paper. The recommended serving sizes and number of servings for each of these groups is
provided in Table 1; we see from this table that men and women differ in recommended servings of staples,
proteins and oils and fats.
The steps followed in the construction of CoRD are as follows:
1. Each of the foods in the price data is classified into one of the food group categories.
2. In the case of multiple types of the same food, only the lowest cost duplicate item is retained. For
example, in the case of India, wheat (coarse) and wheat (med.) are both classified simply as wheat,
and the more expensive of the two is dropped.
3. All item units are standardized to kilograms. For those items that were in non-standard units (e.g.
“a dozen eggs”), estimates of the standard weight of these items were employed.7
4. All item prices are converted into price per edible serving, using a price conversion factor that was
estimated as follows:
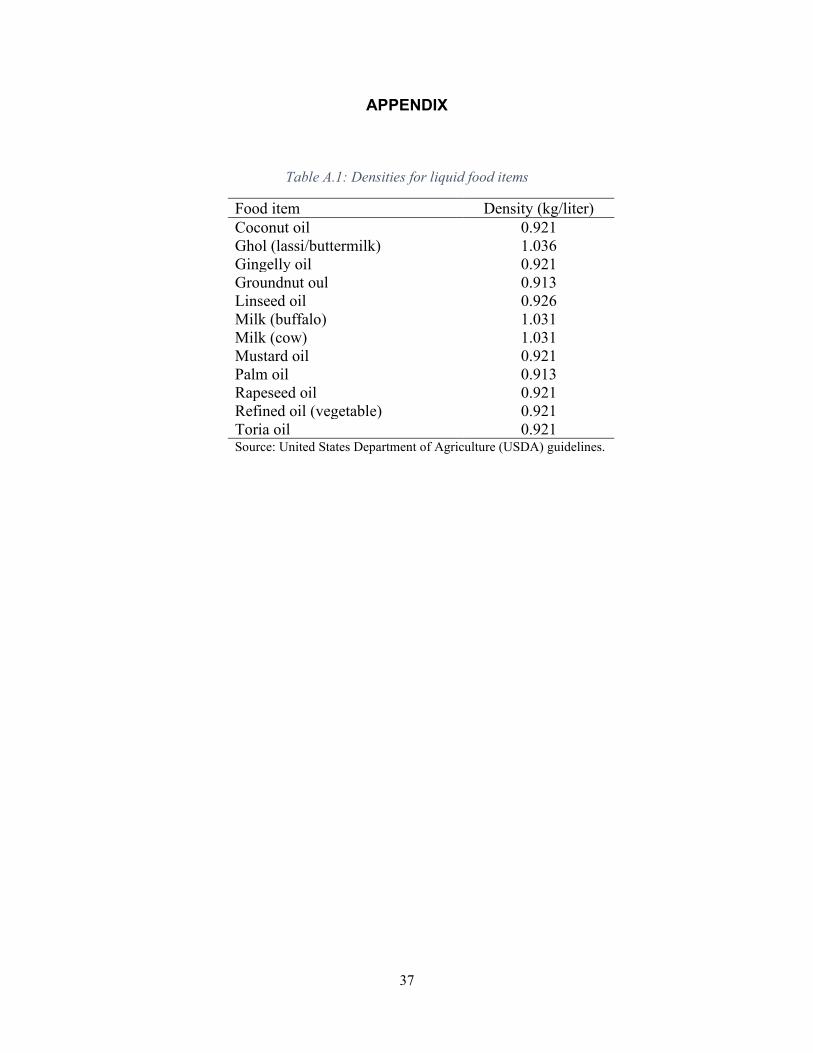
7 There are a few items that are recorded in non-standard units, e.g. a pair (of bananas), each (eggs, oranges), or one (bread). For items such as bananas, eggs and oranges, we make an educated guess as to their approximate weight. For example, each banana is assumed to weigh 120g, a hen egg 44g, a duck’s egg 66g and an orange 131g. For bread, a comparison of the price with current prices in urban Delhi markets suggested that the unit was a 500g loaf. In the case of liquids, we used densities from United States Department of Agriculture (USDA). These densities are given in the Appendix Table A.1.

9
𝑝𝑝𝑝𝑝𝑝𝑝𝑝𝑝𝑝𝑝 𝑝𝑝𝑐𝑐𝑐𝑐𝑐𝑐𝑝𝑝𝑝𝑝𝑐𝑐𝑝𝑝𝑐𝑐𝑐𝑐 𝑓𝑓𝑓𝑓𝑝𝑝𝑓𝑓𝑐𝑐𝑝𝑝 =𝑐𝑐𝑝𝑝𝑝𝑝𝑐𝑐𝑝𝑝𝑐𝑐𝑠𝑠 𝑐𝑐𝑝𝑝𝑠𝑠𝑝𝑝 (𝑝𝑝𝑐𝑐 𝑠𝑠)
𝑢𝑢𝑐𝑐𝑝𝑝𝑓𝑓 𝑐𝑐𝑓𝑓 𝑓𝑓𝑐𝑐𝑐𝑐𝑓𝑓 𝑝𝑝𝑓𝑓𝑝𝑝𝑖𝑖 (𝑝𝑝𝑐𝑐 𝑠𝑠)/𝑝𝑝𝑓𝑓𝑝𝑝𝑒𝑒𝑒𝑒𝑝𝑝 𝑝𝑝𝑐𝑐𝑝𝑝𝑓𝑓𝑝𝑝𝑐𝑐𝑐𝑐
5. For all food groups except dark green leafy vegetables, the two cheapest items in the food group
are selected; for dark green leafy vegetables, the cheapest item is chosen.
6. The recommended number of servings for each group and gender is multiplied by the average price
per serving for each food group to generate the cost of that food group.
7. Finally, the cost of all food groups is summed to generate CoRD.
Table 1. Recommended serving sizes and number of servings per day in India's Food-based Dietary Guidelines
Serving size Number of servings (moderate activity level)
Men Women
Starchy staples 30g 15 11
Proteins (pulses, meat, fish, eggs) 30g 3 2.5
Dairy 100g 3 3
Fruit 100g 1 1
Vegetables 100g 2 2
Dark green leafy vegetables 100g 1 1
Oils and fats 5g 6 5
Source: Dietary Guidelines for Indians: A Manual (2011).
Following these steps, we calculate the CoRD separately by gender for each district-month combination
that appears in our data. Very high and very low prices are assumed to be anomalies, so we winsorize our
data accordingly.
2.2.2 Affordability of diets
We are interested in the relative cost of the recommended diet and need to develop a measure of its
affordability. To do this, we calculate a gender-district-time-specific CoRD relative to wages, by dividing
the CoRD by the cash wages for men and women in that time period and geography. The CoRD relative to

10
wages is expressed as a percentage of the wages. Similar to the price data, we winsorize very high and very
low wage data, likely to be erroneous entries.
Secondly, we estimate the share of the population that cannot afford CoRD (a poverty headcount measure)
and the average gap between the incomes of the CoRD-poor and a CoRD-based poverty line (a poverty gap
measure) at the national level. To do this, we use the World Bank’s POVCAL tool which allows researchers
to set alternative poverty lines8; fortunately for India this tool disaggregates poverty estimates for rural and
urban in India in mid-2011 towards the end of our sample. The cost of a recommended diet will be lower
for children due to their lower caloric needs; therefore, adult CoRD estimates over-estimate dietary costs
for children. POVCAL does not account for differences in intrahousehold food or non-food expenditure
requirements, so we make conservatively low assumptions about non-food expenditure requirements to
balance the overestimate of children’s CoRD. A lower benchmark uses the simple but unrealistic
assumption that households spend all their income on food. A second benchmark uses the (somewhat
arbitrary) assumption that avoiding $1.90/day poverty requires a household to spend at least one-third of
its income on non-food expenditures.
2.2.3 Seasonality of cost and affordability of diets
We conduct tests for seasonal differences in food group prices, overall dietary costs, wages and CoRD/wage
ratios. Specifically, we compute the log of the price/wage ratio for a given month and regress this against
11 monthly dummy variables (with January as the omitted base category), along with a flexible cubic time
trend and district fixed effects. The coefficients on the monthly dummy variables approximately measure
the percentage difference in price/wage ratios between January and all other months of the year.
8 See http://iresearch.worldbank.org/PovcalNet/povOnDemand.aspx.

11
3. COST AND AFFORDABILITY OF NUTRITIOUS DIETS IN RURAL INDIA
In this section we first report basic descriptive statistics on the nature of the food price data and dietary
costs by food group, before examining the composition of the least cost diet, trends in the cost of the
recommended diet, seasonality in food prices and the affordability of the recommended diet relative to
unskilled wages and minimum MGNREGA wages.
3.1 Prices and dietary costs by food group
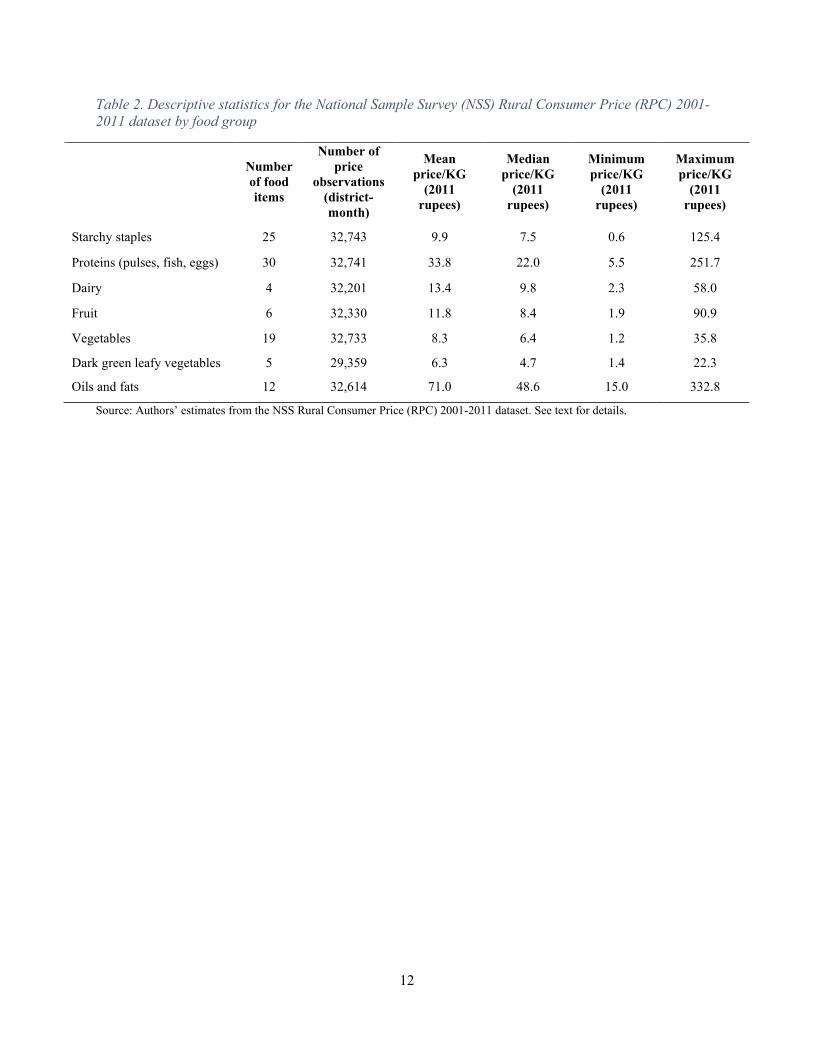
Table 2 reports summary statistics for the price data by the seven food groups that make up the
recommended diet. The first column reports the number of specific food items in each group. Most are well
populated although there are relatively few types of dairy products, fruits and dark green leafy vegetables.
Importantly, there are a wide range of starchy staples, reflecting regional diversity in key staples in India,
and a wide range of proteins, including a variety of pulses, which are a key component of the Indian diet.
Although the least cost recommended diet metric only draws the cheapest two items from each food group,
the prices per kilogram in Table 2 emphasize the extent to which prices vary both within and across food
groups, and the scope for consumers to shift towards costlier foods as incomes and food budgets increase.
Figure 1 shows the average price per serving by food group (converted from price/kg) as well the maxima
and minima, with the latter being important in terms of the least cost items. Dairy and fruit are the most
expensive food groups per serving, both looking at average and least-cost prices, while oils and fats and
starchy staples are the cheapest. It is clear from the figure that both the average and the dispersion of price
per serving have increased substantially between 2001 and 2011.
12
Table 2. Descriptive statistics for the National Sample Survey (NSS) Rural Consumer Price (RPC) 2001-2011 dataset by food group
Number of food items
Number of price
observations (district-month)
Mean price/KG
(2011 rupees)
Median price/KG
(2011 rupees)
Minimum price/KG
(2011 rupees)
Maximum price/KG
(2011 rupees)
Starchy staples 25 32,743 9.9 7.5 0.6 125.4
Proteins (pulses, fish, eggs) 30 32,741 33.8 22.0 5.5 251.7
Dairy 4 32,201 13.4 9.8 2.3 58.0
Fruit 6 32,330 11.8 8.4 1.9 90.9
Vegetables 19 32,733 8.3 6.4 1.2 35.8
Dark green leafy vegetables 5 29,359 6.3 4.7 1.4 22.3
Oils and fats 12 32,614 71.0 48.6 15.0 332.8
Source: Authors’ estimates from the NSS Rural Consumer Price (RPC) 2001-2011 dataset. See text for details.

13
Figure 1. Real food prices per edible serving by food group for rural India in 2001 and 2011 (in 2011 rupees)
Source: Authors’ estimates from the NSS Rural Consumer Price (RPC) 2001-2011 dataset. See text for details.
Panel A: 2001 Panel B: 2011

14
In Table 3 we report the five most common cheapest food items selected in each food group for CoRD over
the full range of observations. Among staples, rice and wheat are often selected, but so too are coarse grains
common in some parts of India, such as bajra (pearl millet). Because of their lower cost, pulses are much
more commonly selected key sources of protein than meat, fish or eggs, which offer high-quality protein
and various micronutrients, but which are generally much more expensive in kilogram or per calorie terms.
In fact, flesh foods and eggs are only selected in 0.02 percent of the cases.9 Cow and buffalo milk are the
two most common dairy items, while tropical fruits dominate the fruit category. Radish and onion are the
two most common non-leafy vegetables and palak (spinach) is the most commonly selected dark green
leafy vegetable. The oils and fats category is populated by a range of oils, including the increasingly popular
(and cheap) palm oil. Since availability can vary considerably across geography, Table A.2 presents the
most common items in each food group in each state.
Table 3. The five most common food items in CoRD (nationally) based on total district-year observations
Food group Most common items appearing in CoRD
Starchy staples Maize, Bajra, Rice (coarse), Wheat (coarse), Bread
Proteins (pulses, fish, eggs) Peas, Gram, Pea dal, Khesari dal, Gram dal
Dairy Milk (cow), Milk (buffalo), Curd, Ghol (lassi)
Fruit Banana, Guava, Papaya, Pineapple, Orange
Vegetables Radish, Onion, Gourd, Pumpkin, Tomato
Dark green leafy vegetables Palak, Bhaji sag leaves, Amaranth (chaulai), Mustard leaves, Gogukura
Oils and fats Mustard oil, Refined oil, Groundnut oil, Palm oil, Gingelly oil
Source: Authors’ estimates from the NSS Rural Consumer Price (RPC) 2001-2011 dataset. See text for details.
3.2 Trends and variation in prices, dietary costs, wages and dietary affordability
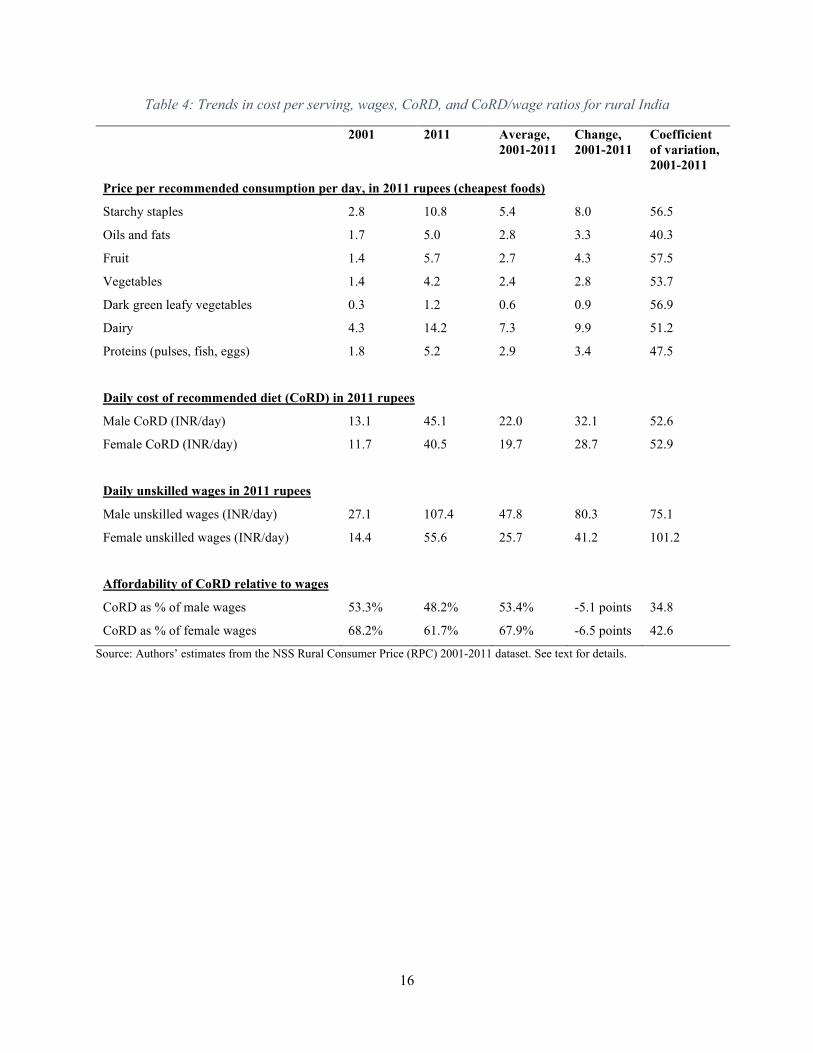
Table 4 reports trends in cost per serving for each food group, total dietary costs and male and female
unskilled wages over 2001-2011 (all in real terms), as well as the average costs over this period and the
coefficient of variation to capture volatility in dietary costs and affordability. Strikingly, real food costs
increased dramatically over 2001-2011, albeit with variation across groups. Figure 2 shows the food group-
wise contribution to average CoRD over time.10 Dairy is the largest contributor to average CoRD, followed
9 We should note here that the units for poultry were not provided, and we were unable to make an informed guess at to the approximate weight based on the average prices reported. As a result, poultry had to be dropped from our analysis. We do not believe that this substantially affects the composition of the least cost recommended diet, given that eggs are cheaper than poultry and still only appear in the least cost diet in 0.01 percent of the cases. 10 Average CoRD is the CoRD calculated using the expected number of servings, i.e. a simple average of the male and female

15
by starchy staples and fruit. Dark green leafy vegetables, other non-leafy vegetables and oils and fats
contribute the least. There was a sharp increase in CoRD after 2007, coinciding with a period of global food
price inflation.
Consistent with rising real food costs, the overall least cost recommended diet increased by 32.1 rupees for
men and 28.7 rupees for women over 2001. Over the same period of time India experienced significant
economic growth, and wages outpaced real changes in dietary costs, although the change in wages for men
was around twice as much as the change for women. Hence, CoRD/wage ratios for men and women both
improved somewhat over time (Table 4).
recommended servings per food group.
16
Table 4: Trends in cost per serving, wages, CoRD, and CoRD/wage ratios for rural India
2001 2011 Average, 2001-2011
Change, 2001-2011
Coefficient of variation, 2001-2011
Price per recommended consumption per day, in 2011 rupees (cheapest foods)
Starchy staples 2.8 10.8 5.4 8.0 56.5
Oils and fats 1.7 5.0 2.8 3.3 40.3
Fruit 1.4 5.7 2.7 4.3 57.5
Vegetables 1.4 4.2 2.4 2.8 53.7
Dark green leafy vegetables 0.3 1.2 0.6 0.9 56.9
Dairy 4.3 14.2 7.3 9.9 51.2
Proteins (pulses, fish, eggs) 1.8 5.2 2.9 3.4 47.5
Daily cost of recommended diet (CoRD) in 2011 rupees
Male CoRD (INR/day) 13.1 45.1 22.0 32.1 52.6
Female CoRD (INR/day) 11.7 40.5 19.7 28.7 52.9
Daily unskilled wages in 2011 rupees
Male unskilled wages (INR/day) 27.1 107.4 47.8 80.3 75.1
Female unskilled wages (INR/day) 14.4 55.6 25.7 41.2 101.2
Affordability of CoRD relative to wages
CoRD as % of male wages 53.3% 48.2% 53.4% -5.1 points 34.8
CoRD as % of female wages 68.2% 61.7% 67.9% -6.5 points 42.6
Source: Authors’ estimates from the NSS Rural Consumer Price (RPC) 2001-2011 dataset. See text for details.

17
Figure 2: Food group-wise contribution to CoRD based on expected servings, 2001-2011
Figure A.1 tracks the trends in real wages over time, for both men and women. Real wages have increased
steeply over the time period of our data, but the rate of increase has been greater for men, especially after
2008. Since national-level numbers hide a lot of variation in a country as large and diverse as India, we also
investigate trends in the rate of growth of state-level averages of CoRD/unskilled wage ratios for men and
women over 2001-2011, the first and last years in our data (Figures 3 and A.2, Table A.3).
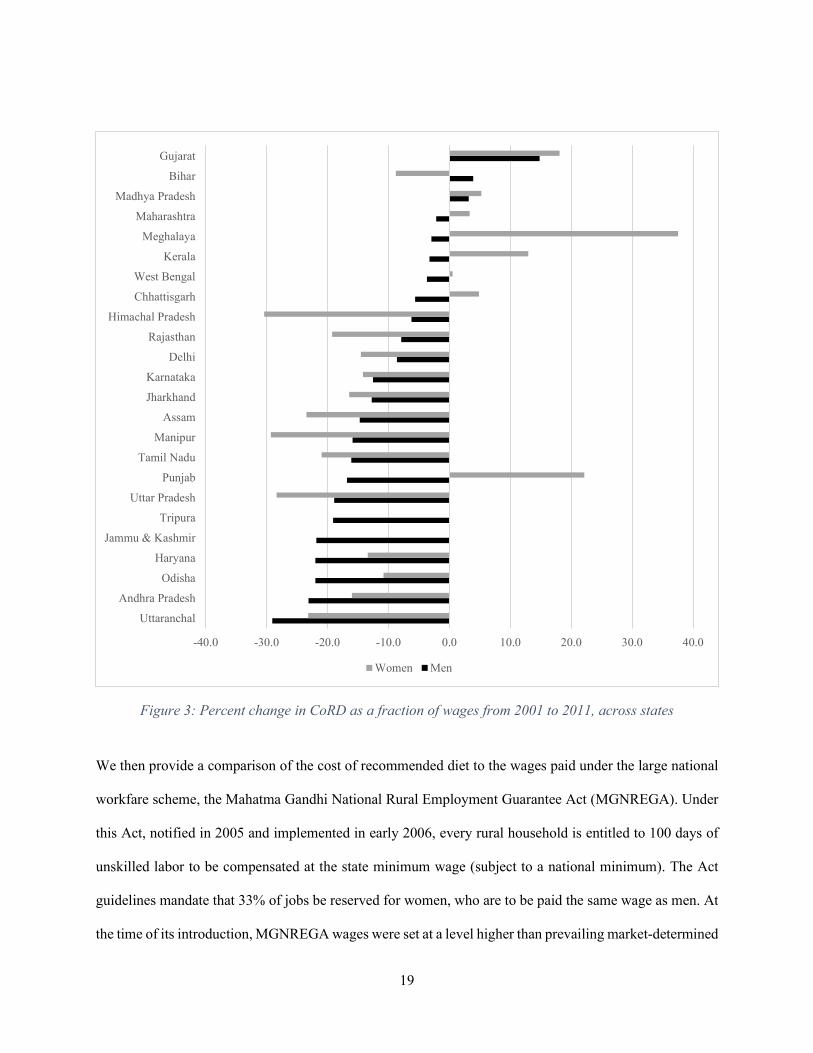
In most states male CoRD/wage ratios declined over time, suggesting that nutritious recommended diets
became substantially more affordable for men, such that by 2011 CoRD/wage ratios were typically less
than 60 percent.11 For women, the patterns are often very different; indeed there is no significant correlation
between male and female CoRD/wage ratio across states in either 2011 or 2001, or between changes in
11 The largest improvements were in Uttaranchal, Andhra Pradesh and Odisha, where these ratios declined by over 20 percent.
13.5 13.9 15.1 15.8 16.719.1
22.5
37.141.1
46.2
0
5
10
15
20
25
30
35
40
45
50
2001 2002 2003 2004 2005 2006 2007 2008 2009 2010 2011
Rea
l cos
t in
INR
(bas
e Ju
ne 2
011)
Year
Starchy staples Proteins
Dairy Fruit
Vegetables DGLV
Oils & fats Average CoRD based on expected servings

18
these ratios over time for men and women. In most states, CoRD/wage ratios declined over time for
unskilled female workers, but there were some notable exceptions where CoRD became much less
affordable: Punjab (22.1% increase), Gujarat (18.1% increase) and Kerala (13.0% increase). These states
saw minimal growth in real wages for women. Gujarat has surprisingly high CoRD/wage ratios, even by
2011, in spite of relatively rapid economic growth.12
Strikingly, there are large variations in both initial CoRD/wage ratios and in changes over time (Table A.3).
For example, in Kerala – a wealthy state but also one with strong labor unions and high rates of overseas
emigration and remittances – CoRD accounts for just 22.0 percent of male wages in 2011. CoRD was also
relatively low compared to male wages in Haryana, Tamil Nadu, Jammu & Kashmir, and Punjab, where
agricultural productivity is relatively high and structural transformation relatively advanced. At the other
extreme, CoRD accounted for close to 100% of female wages in several states, even in 2011. For men,
CoRD was least affordable in Chhattisgarh, costing 80.1% of male wages in 2001 and 75.6% in 2011. Table
A.4 summarizes CoRD and unskilled labor wages in 2011 for both men and women. Figure A.2 presents
the overall trend in CoRD as a percentage of wages for men and women over this time period; from this it
is clear that affordability of the recommended diet has increased, especially after 2008.
12 It is fairly well known that Gujarat’s economic performance has not translated into high rural or urban skilled or unskilled wages, see for example the India Wage Report 2018 published by the International Labor Organization (https://www.ilo.org/wcmsp5/groups/public/---asia/---ro-bangkok/---sro-new_delhi/documents/publication/wcms_638305.pdf).
19
Figure 3: Percent change in CoRD as a fraction of wages from 2001 to 2011, across states
We then provide a comparison of the cost of recommended diet to the wages paid under the large national
workfare scheme, the Mahatma Gandhi National Rural Employment Guarantee Act (MGNREGA). Under
this Act, notified in 2005 and implemented in early 2006, every rural household is entitled to 100 days of
unskilled labor to be compensated at the state minimum wage (subject to a national minimum). The Act
guidelines mandate that 33% of jobs be reserved for women, who are to be paid the same wage as men. At
the time of its introduction, MGNREGA wages were set at a level higher than prevailing market-determined
-40.0 -30.0 -20.0 -10.0 0.0 10.0 20.0 30.0 40.0
Uttaranchal
Andhra Pradesh
Odisha
Haryana
Jammu & Kashmir
Tripura
Uttar Pradesh
Punjab
Tamil Nadu
Manipur
Assam
Jharkhand
Karnataka
Delhi
Rajasthan
Himachal Pradesh
Chhattisgarh
West Bengal
Kerala
Meghalaya
Maharashtra
Madhya Pradesh
Bihar
Gujarat
Women Men

20
agricultural and other rural unskilled labor wages, thereby exerting upward pressure on the daily wages of
casual laborers (Azam, 2011; Imbert & Papp, 2016; Khera, 2011; Zimmermann, 2018, Imbert & Papp,
2015). However, since the entitlement is limited to only a 100 days per household per year, this upward
pressure did not necessarily result in an alignment of labor wages with the minimum wages paid under the
Act. At the time of the notification of the Act, prevailing unskilled labor wages in 2005 were lower than
the MGNREGA wage for both men and women in all states, with the sole exception of male wages in
Jammu and Kashmir. Six years later, in 2011, only eight states reported prevailing unskilled labor wages
for men greater than the minimum wage. No state reported unskilled labor wages for women greater than
the minimum wage in 2005 or 2011. The difference between the unskilled labor wages and the state-specific
minimum wage was often considerable: for men, unskilled labor wages were 28.6-121.2% of MGNREGA
minimum wages in 2005 and 51.4-169.9% in 2011; for women the gap was even larger, at 7.1-41.1% in
2005 and 13.6-89.0% in 2011 (Table A.5).
Table A.6 reports CoRD as a percent of state-wise minimum wages, which are also the wages paid to
workers in the MGNREGA. Unlike the market wages for unskilled workers used above, MGNREGA
minimum wages increased more uniformly across states, and the uniform minimum wage for men and
women means that patterns of CoRD/wage ratios for men and women look similar (since CoRD is similar
for men and women). In 2005, CoRD/NREGA wage ratios were relatively low, generally less than 30%,
and with a national average of 24.9% for men and 22.4% for women (Table 7). However, the minimum
wages for MGNREGA workers did not increase at the same rate as CoRD, meaning that CoRD/NREGA
wage ratios increased by around 50% by 2011, producing a national average of 34.8% for men and 39.7%
for women. The largest increases were observed in Andhra Pradesh, Kerala, Tamil Nadu and the Punjab.
Insofar as the rural poor are likely to use MGNREGA more in the lean season (Clément Imbert & Papp,
2016; Johnson, 2009), it is possible that MGNREGA has become less effective over time at dampening
seasonal shocks.

21
Figure 4: Percent change in CoRD as a fraction of minimum wages from 2005 to 2011, across states
3.3 Estimating the share of the rural population that cannot afford the recommended diet
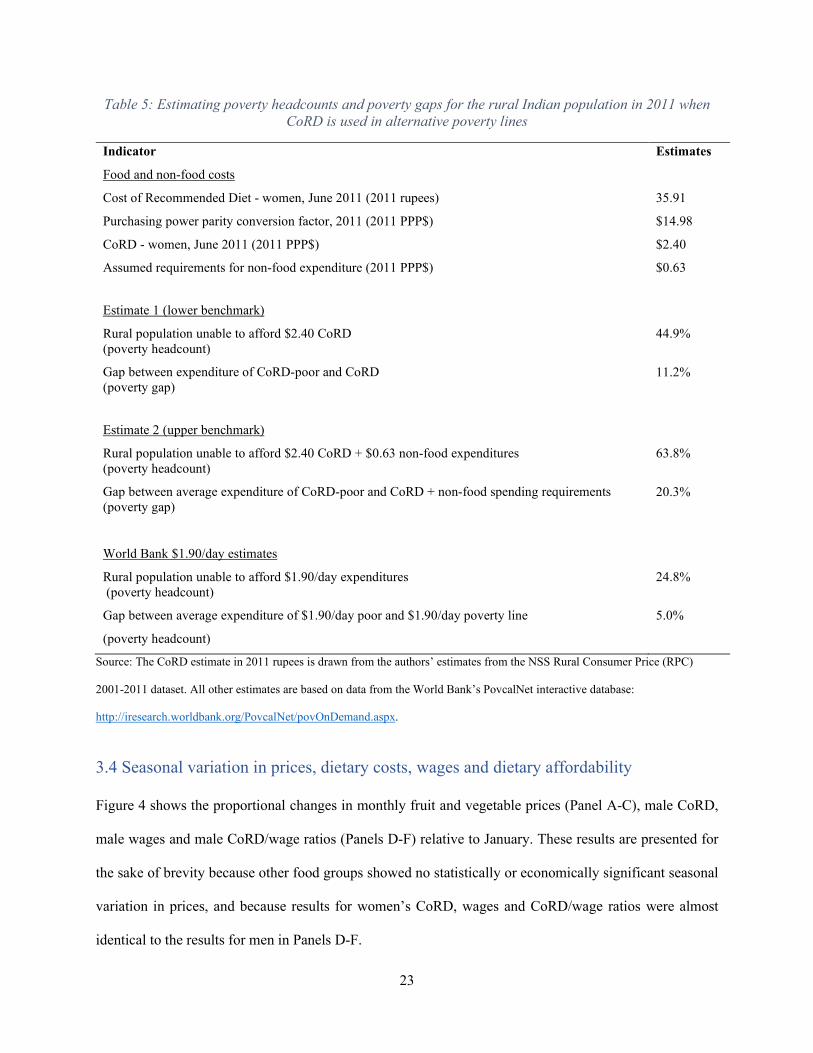
Table 8 shows the poverty headcounts and poverty gaps for the rural Indian population if CoRD were used
as an alternative poverty line. CoRD for an adult woman amounted to 35.91 rupees per day in June 2011
(in nominal terms). Using the 2011 purchasing power parity conversion factor this amounts to $2.40 per
day in international dollars, which is 50 cents above the World Bank’s $1.90/day poverty line. Adding a 63
cent/day non-food spending requirement would raise this nutritionally based alternative poverty line from
$2.40 to $3.03/day.
The share of the rural Indian population in 2011 unable to afford CoRD even with 100% of income spent
on food would be 44.9%, or 387.5 million people. On average, the incomes of that population would be
-20 0 20 40 60 80 100 120 140
Jammu & KashmirTripuraGujarat
MaharashtraHimachal Pradesh
OdishaUttar PradeshWest Bengal
AssamMadhya Pradesh
BiharHaryana
UttaranchalManipur
KarnatakaChhattisgarh
RajasthanJharkhand
MeghalayaPunjab
Tamil NaduAndhra Pradesh
Kerala
Women Men

22
11.2% below CoRD. Under the arguably more realistic $3.03 poverty line, 63.8% of the rural population
in 2011 could not afford CoRD plus $0.60/day non-food expenditures (551 million), and that population’s
average income would fall 20.3% below this alternative poverty line. Importantly, these estimates of the
share of the rural Indian population that cannot afford the nutritionally recommended diet are much higher
than the World Bank $1.90/day estimates of poverty (24.8% of the population identified as poor). These
numbers are somewhat speculative, but they do reveal the scale of the dietary affordability problem in rural
India: nutritious diets are too expensive, and incomes far too low.
23
Table 5: Estimating poverty headcounts and poverty gaps for the rural Indian population in 2011 when CoRD is used in alternative poverty lines
Indicator Estimates
Food and non-food costs
Cost of Recommended Diet - women, June 2011 (2011 rupees) 35.91
Purchasing power parity conversion factor, 2011 (2011 PPP$) $14.98
CoRD - women, June 2011 (2011 PPP$) $2.40
Assumed requirements for non-food expenditure (2011 PPP$) $0.63
Estimate 1 (lower benchmark)
Rural population unable to afford $2.40 CoRD (poverty headcount)
44.9%
Gap between expenditure of CoRD-poor and CoRD (poverty gap)
11.2%
Estimate 2 (upper benchmark)
Rural population unable to afford $2.40 CoRD + $0.63 non-food expenditures (poverty headcount)
63.8%
Gap between average expenditure of CoRD-poor and CoRD + non-food spending requirements (poverty gap)
20.3%
World Bank $1.90/day estimates
Rural population unable to afford $1.90/day expenditures (poverty headcount)
24.8%
Gap between average expenditure of $1.90/day poor and $1.90/day poverty line
(poverty headcount)
5.0%
Source: The CoRD estimate in 2011 rupees is drawn from the authors’ estimates from the NSS Rural Consumer Price (RPC)
2001-2011 dataset. All other estimates are based on data from the World Bank’s PovcalNet interactive database:
http://iresearch.worldbank.org/PovcalNet/povOnDemand.aspx.
3.4 Seasonal variation in prices, dietary costs, wages and dietary affordability
Figure 4 shows the proportional changes in monthly fruit and vegetable prices (Panel A-C), male CoRD,
male wages and male CoRD/wage ratios (Panels D-F) relative to January. These results are presented for
the sake of brevity because other food groups showed no statistically or economically significant seasonal
variation in prices, and because results for women’s CoRD, wages and CoRD/wage ratios were almost
identical to the results for men in Panels D-F.
24
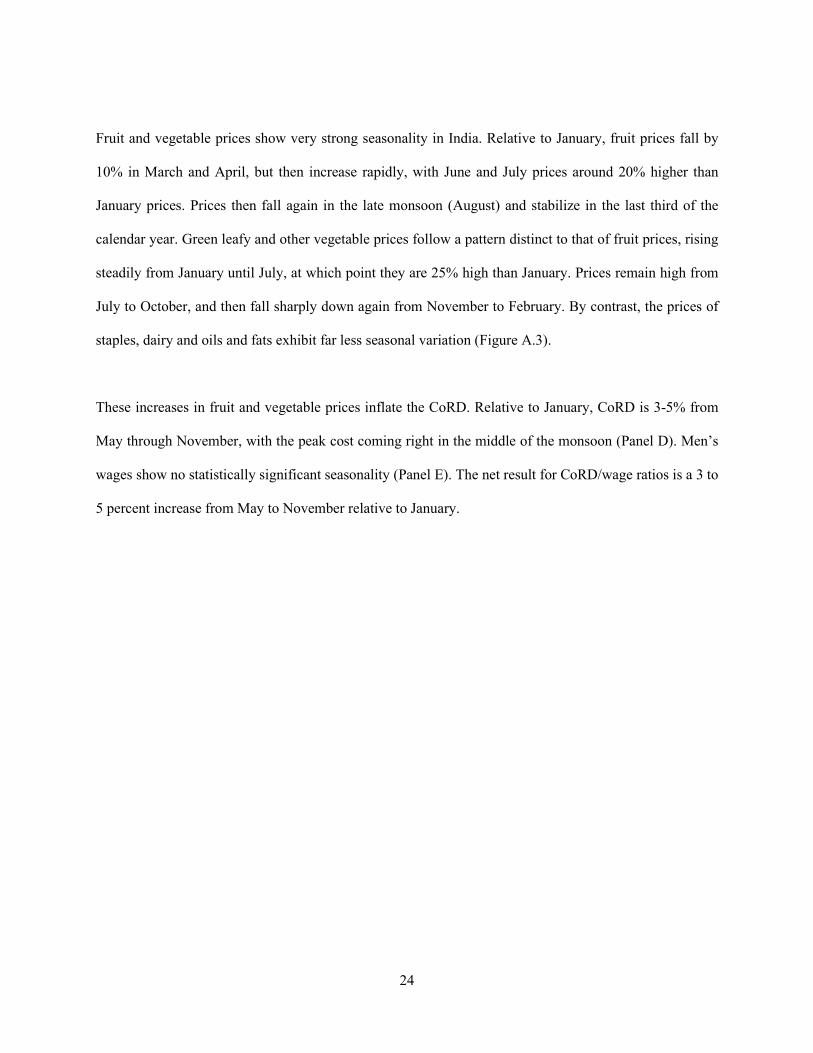
Fruit and vegetable prices show very strong seasonality in India. Relative to January, fruit prices fall by
10% in March and April, but then increase rapidly, with June and July prices around 20% higher than
January prices. Prices then fall again in the late monsoon (August) and stabilize in the last third of the
calendar year. Green leafy and other vegetable prices follow a pattern distinct to that of fruit prices, rising
steadily from January until July, at which point they are 25% high than January. Prices remain high from
July to October, and then fall sharply down again from November to February. By contrast, the prices of
staples, dairy and oils and fats exhibit far less seasonal variation (Figure A.3).
These increases in fruit and vegetable prices inflate the CoRD. Relative to January, CoRD is 3-5% from
May through November, with the peak cost coming right in the middle of the monsoon (Panel D). Men’s
wages show no statistically significant seasonality (Panel E). The net result for CoRD/wage ratios is a 3 to
5 percent increase from May to November relative to January.

25
Figure 5: Proportional seasonal changes in fruit prices, vegetable prices, male CoRD, male wages and male CoRD/wage ratios relative to
January
Notes: Authors’ estimates from the NSS Rural Consumer Price (RPC) 2001-2011 dataset. See text for details. The figure reports results from multivariate regressions of the log of the differences between the dependent variable’s value for a given month relative to the corresponding value for January. Dependent variables are in nominal terms, and refer to fruit/vegetable prices, CoRD, wages and CoRD/wage ratios against monthly dummy variables, controlling for linear time trends. Results for CoRD for women, wages for women and CoRD/wage ratios for women are qualitatively and quantitatively very similar. Results for other food groups show no strong indications of seasonal variation in prices and were therefore omitted for the sake of brevity.

26
4. DISCUSSION
For most of India’s post-independence history policymakers have been deeply concerned with achieving
basic food security through focusing agricultural investments, price controls and social safety nets on staple
foods. Access to nutritious food has not been a focus of food security policy. Nutrition has variously been
marginalized, regarded as a health problem rather than a fundamental economic problem, or viewed as a
narrow calorie deficiency problem to be addressed by improving the affordability of rice and wheat. Only
recently have high level policy initiatives started to envisage strong multisectoral efforts to improve intake
of a broader range of nutritious foods to address multiple dimensions of undernutrition and prevent obesity
and diet-related non-communicable diseases. However, this invigorated focus on nutrition has entailed
remarkably little research on the basic question of how affordable nutritious diets are for India’s poor. In
this study we estimated the cheapest means of achieving nationally recommended diets in rural areas and
assessed affordability relative to wages for unskilled workers over time and across states.
What did we find, and what do our results imply for policy reforms and future research?
Costing nutritious diets and their affordability
A first finding of considerable practical importance is that the approach of calculating least-cost diets based
on quantitative food-based dietary guidelines, following the application by Dizon, Herforth and Wang
(2019), results in a realistic selection of food groups that align closely to consumption patterns of Indian
consumers in a qualitative sense (although an average Indian would under-consume a wide range of
nutritious foods). In contrast, nutrient-adequate least-cost diets – following Stigler (1945)– can sometimes
result in diets that represent a significant departure from existing food preferences. India’s national FBDG
constitute a policy document, and the minimum cost to access officially recommended diets is therefore an
important piece of information for designing policy-coherent actions to improve the ability of the rural poor
to consume the recommended diet.

27
Hence an important policy recommendation is that Indian governments could use this least-cost
recommended diet metric to monitor dietary costs and affordability on a timelier and more regular basis,
and to consider CoRD as an alternative nutrition-sensitive poverty line, similar to the nutrient adequacy
poverty line approach proposed by Allen (2017). Currently, governments only measure food costs through
consumer price indices (CPIs) that weight foods by expenditure shares; however, these expenditure shares
in no way reflect the nutritional importance of different foods, and indeed, in poor countries such as India
CPIs are heavily weighted towards nutrient-sparse starchy staples, meaning that trends in the food CPI can
be misleading from a nutritional standpoint. Furthermore, a practical advantage of CoRD – certainly in
comparison to costing nutrient-adequate diets – is its technical simplicity, involving only the identification
of the cheapest serving(s) in each food group.13
This type of analysis could also be undertaken by non-government organizations and private researchers,
although the accessibility of food price data in India is poor, and different price data are collected by
different government bodies and released haphazardly or not at all. The National Sample Survey (NSS)
dataset accessed for this study was collected by the Ministry of Statistics and Programme Implementation
but has not been updated beyond 2011, pertains only to prices from rural centers and was quite challenging
to access and use. Urban price data are collected separately by the Labour Bureau, Ministry of Labour and
Employment, and do not appear to be easily accessible. Quite extensive wholesale price data are collected
by the Office of the Economic Adviser in the Department for Promotion of Industry and Internal Trade, but
only reported at the national level. There is therefore considerable scope to improve the accessibility of
government food price statistics in India, and to use these data sources to analyze food systems more
rigorously.
13 In principle, CoRD can even be calculated in an excel spreadsheet.

28
Addressing the rising cost of nutritious diets
We find that nutritious diets are highly unaffordable. We estimated that between 45-64% of the rural
population of India in 2011 could not afford the recommended diet. Although male and female wages have
improved, particularly from about 2007 onwards, recommended diets account 50-60% of male and 70-80%
of female daily wages. It is important to keep in mind that this cost does not allow for individual tastes and
preferences, and merely chooses the cheapest items in each food group. It also does not take into
consideration family size, which, to the extent that the rural poor tend to have larger family sizes,
exacerbates the high cost of recommended diets. However, there are also two caveats that deserve mention,
as they could both lead to an overestimation of the cost of the recommended diet. First, the CoRD measure
we employ captures the retail cost of purchasing food from the market, and hence, by design, does not
account for food received through government schemes such as India’s Public Distribution System (PDS),
a highly subsidized government-provided monthly food ration consisting mainly of rice and wheat. Second,
with the data we have we are unable to account for consumption out of own production. We do not anticipate
this to be a large concern since we have restricted our comparison of CoRD to the wages of unskilled
laborers, a class of workers not engaged in agricultural activities. These laborers are likely to rely heavily
on the market for their food; if anything, they might supplement this with small quantities of fruits and
vegetables grown in kitchen gardens on their homestead.
As acknowledged previously, one major limitation of our analysis is the lack of recent information on prices
and wages. Even the last round of the NSSO’s Employment-Unemployment survey with information on
wages dates to 2011-12, and in absence of more recent data, we can only provide conjectures on what might
have happened in the decade since. Data released by the Center for Monitoring the Indian Economy reveals
sharply rising unemployment in recent years, with unemployment rates in October 2019 at a three-year high
of 8.48 percent. At the same time, nominal prices have continued to rise across almost all food groups.
Figure A.4 plots the trend in wholesale market (mandi) prices for all food groups (except dairy, for which

29
prices are not available).14 The red dashed line indicates the end of the rural price and wage data used for
the main analysis in this paper; it is evident that the rising trend observed pre-2012 continues after as well.
While wholesale prices are not to be conflated with retail prices, this provides some indication of the
increasing cost of market-based foods. These two facts combined suggest that the problem of
unaffordability of nutritious diets is likely to have persisted even after 2011.
Diversifying agriculture toward nutrient-dense foods
We show that the most expensive food groups in this recommended diet are fruit and dairy, and that dietary
costs for these two groups rose fastest, although other foods saw real price increases also. The rising cost
of these nutrient-dense food groups is perhaps not surprising. Both dairy and fruits have high income
elasticities in India (Kumar, Kumar, Parappurathu, & Raju, 2011), such that India’s relatively rapid income
growth over 2001-2011 will have significantly raised demand for these products. However, if rising demand
is not met by improvements in domestic production and trade then prices may increase commensurately
since these highly perishable products cannot cost-effectively be imported from overseas, especially to rural
India.
A key goal for nutrition-sensitive agriculture in India must be to raise production, productivity and
marketing of more nutritious foods. Previous research has emphasized the need to diversify Indian
agriculture largely for the sake of addressing rural poverty, since India’s millions of smallholders need to
increase revenue per hectare by switching to higher value agricultural products (Birthal, Joshi, & Roy,
2013; Joshi, Gulati, Birthal, & Tewari, 2004; Rao, Birthal, & Joshi, 2006). There are many barriers to
diversification of Indian agriculture, including limited public investment in research, development and
extension, poor infrastructure (roads/transport, cold storage), and institutional failures that limit
smallholders’ access to aggregators and traders, which can be especially problematic for highly perishable
14 This data was downloaded for every Thursday from January 2004 to December 2018 from agmarknet.gov.in, which reports daily wholesale prices for a range of food and non-food items from 510 districts across 26 states.

30
products (Pingali, 2015). While these constraints limit the scope for diversification to improve rural
incomes, our analysis suggests there is a strong nutritional rationale for using agricultural diversification to
curb price inflation for nutrient-dense foods. Furthermore, diversification can increase access to nutrient-
dense foods for the rural poor not well connected to markets, where home production or wild gathering of
foods may be essential.
Improving rural incomes, especially women’s incomes
Despite the rising cost of nutritious diets over 2001-2011, wage growth for unskilled rural workers typically
outpaced rising dietary costs for both men and women. Several states bucked this positive trend, however,
and more generally there was substantial spatial variation in food affordability trends in rural India over
this decade. This result emphasizes the scope for pro-poor economic growth to improve diets,
concomitantly with food policy reform to reduce real prices of nutritious foods. It also emphasizes gender
inequities in income and in nutritional poverty and highlights the importance of increases in women’s
income. We likely underestimate the problem of unaffordability at the household level, because women are
often the nutritional gatekeepers for the entire household, including men, and therefore female access to
(men’s and women’s) income is likely to affect whether nutritious diets are obtained for the whole
household (Doss, 2006; Duflo & Udry, 2004; Hoddinott & Haddad, 1995; Quisumbing, Brown, Feldstein,
Haddad, & Peña, 1996).
Since poverty reduction through economic growth is a gradual process, however, it is also essential to
provide income support for the poor. The fact that nutritious diets cost more than international and national
poverty lines for India suggests that existing safety net schemes may be inadequate from a nutritional
perspective.15 Our research, for example, finds that minimum MGNREGA wages cover only one-third of
the individual cost of a nutritious diet for a man or woman. This is grossly insufficient given high
15 This result was also found for the United States, which assessed the Supplemental Nutrition Assistance Program (SNAP) benefit against the cost of the federal Dietary Guidelines for Americans (Mulik & Haynes-Maslow, 2017).

31
dependency ratios in rural India as well as significant non-food expenditure requirements. Future research
should therefore attempt to understand how India’s various safety net schemes influence diets, but should
also assess, ex ante, what level or modality of transfer would suffice to meaningfully improve diets.
Marketing and promotion strategies for healthy dietary diversification
Finally, although improving affordability is a necessary step for improving diets, it is hardly sufficient.
Income elasticities for some nutritious foods are high, suggesting that the poor will increase consumption
of these foods as incomes rise (Kumar et al., 2011). For other nutritious foods, such as vegetables and
pulses, income elasticities are substantially lower, which raises the prospect that income/wage growth will
not increase consumption of these foods to desired levels. Moreover, income elasticities for unhealthy
processed foods are also high, implying economic growth will dramatically raise consumption of these
foods. The historical experience of other developing countries suggests that the unhealthy “Westernization”
of diets can, if unchecked, proceed rapidly and irreversibly.
A major challenge for nutrition strategies in India is therefore to limit the advertising of and access to
unhealthy processed foods, while simultaneously promoting healthy traditional foods and diets. Currently,
many nutrition programs target mothers of young children to improve infant and young child feeding
practices (understandably), but more effort and innovation is needed to improve consumer knowledge and
awareness more generally, such as through media campaigns, school-based interventions and public-private
partnerships to improve marketing and advertising for nutritious foods. Furthermore, chemical
contamination of vegetables and fruits with pesticide residues or artificial cosmetic enhancement is a
growing consumer concern in India (Bailey et al., 2018). For consumer demand to increase for these foods,
public trust in food safety is essential, necessitating enforcement of basic food quality standards (Umali‐
Deininger & Sur, 2007).

32
Given the persistence of undernutrition in India as well as its rapidly rising rates of obesity and related non-
communicable diseases, there is an urgent need to reduce prices of nutrient-dense foods on the supply side,
and encourage their consumption on the demand side, such that future income growth achieves nutritional
dividends. In the meantime, there is also an urgent need to address the widespread unaffordability of the
nutritious diets recommended in India’s food-based dietary guidelines through social safety net programs,
so that the rural poor are able to consume sufficient, safe, nutritious foods to meet dietary needs.

33
REFERENCES
Aguayo, V. M., Nair, R., Badgaiyan, N., & Krishna, V. (2016). Determinants of stunting and poor linear growth in children under 2 years of age in India: an in-depth analysis of Maharashtra’s comprehensive nutrition survey. Maternal and Child Nutrition, 12((Suppl. 1)), 121–140. https://doi.org/10.1111/mcn.12259
Allen, R. C. (2017). Absolute poverty: When necessity replaces desire. American Economic Review, 107, 3690–3721.
Azam, M. (2011). The Impact of Indian Job Guarantee Scheme on Labor Market Outcomes : Evidence from a Natural Experiment (No. 6548). Retrieved from https://www.dropbox.com/s/1nk6v4wzduweq50/JMP.pdf?dl=0
Bailey, C., Garg, V., Kapoor, D., Wasser, H., Prabhakaran, D., & Jaacks, L. M. (2018). Food choice drivers in the context of the nutrition transition in Delhi, India. Journal of Nutrition Education and Behavior, 50(7), 675–686.
Bhagowalia, P., Kadiyala, S., & Headey, D. (2012). Agriculture, income and nutrition linkages in India: Insights from a nationally representative survey. Retrieved from https://researchonline.lshtm.ac.uk/id/eprint/1440436
Birthal, P. S., Joshi, P. K., & Roy, D. (2013). Diversification in Indian Agriculture toward High ‐ Value Crops: The Role of Small Farmers. Canadian Journal of Agricultural Economics, 61(September 2018), 61–91. https://doi.org/10.1111/j.1744-7976.2012.01258.x
Cavatorta, E., Shankar, B., & Flores-Martinez, A. (2015). Explaining Cross-State Disparities in Child Nutrition in Rural India. World Development, 76, 216–237. https://doi.org/10.1016/j.worlddev.2015.07.006
Chambers, R., & Medeazza, G. von. (2013). Sanitation and Stunting in India: Undernutrition’s Blind Spot. Economic and Political Weekly, 48(25), 15–18.
Chandrasekhar, S., Aguayo, V. M., Krishna, V., & Nair, R. (2017). Household food insecurity and children ’ s dietary diversity and nutrition in India . Evidence from the comprehensive nutrition survey in Maharashtra. Maternal and Child Nutrition, 13(January), 1–8. https://doi.org/10.1111/mcn.12447
Chastre, C., Duffield, A., Kindness, H., LeJeune, S., & Taylor, A. (2009). The Minimum Cost of a Healthy Diet: Findings from piloting a new methodology in four study locations. Save the Children report. Retrieved from https://motherchildnutrition.org/malnutrition/pdf/mcn-stc-minimum-cost-of-a-healthy-diet.pdf.
Coffey, D., Deaton, A., Drèze, J., Spears, D., & Tarozzi, A. (2013). Stunting among Children Facts and Implications. Economic and Political Weekly, 48(34), 68–70.
Corsi, D. J., Mejía-Guevara, I., & Subramanian, S. V. (2016). Risk factors for child chronic undernutrition in India: Estimating relative importance, population attributable risk and fractions. Social Science & Medicine, 157, 165–185. https://doi.org/10.1016/j.socscimed.2015.11.014
Datar, A., Liu, J., Linnemayr, S., & Stecher, C. (2014). The Impact of Natural Disasters on Child Health and Investments in Rural India. Social Science and Medicine, 76(1), 83–91. https://doi.org/10.1016/j.socscimed.2012.10.008
Deaton, A., & Drèze, J. (2002). Poverty and Inequality in India: A Re-Examination. Economic and Political Weekly, 37(36), 3729–3748.

34
Deptford, A., Allieri, T., Childs, R., Damu, C., Ferguson, E., Hilton, J., … Hall, A. (2017). Cost of the Diet : a method and software to calculate the lowest cost of meeting recommended intakes of energy and nutrients from local foods. BMC Nutrition, 3(26), 1–17. https://doi.org/10.1186/s40795-017-0136-4
Dewey, K. G. (2016). Reducing stunting by improving maternal , infant and young child nutrition in regions such as South Asia: evidence, challenges and opportunities. Maternal & Child Nutrition, 12((Suppl. 1)), 27–38. https://doi.org/10.1111/mcn.12282
Dizon, F., Herforth, A., & Wang, Z. (2019). The cost of a nutritious diet in Afghanistan, Bangladesh, Pakistan, and Sri Lanka. Global Food Security, 21(March), 38–51. https://doi.org/10.1016/j.gfs.2019.07.003
Doss, C. (2006). The effects of intrahousehold property ownership on expenditure patterns in Ghana. Journal of African Economies, 15(149–180). https://doi.org/10.1093/jae/eji025
Duflo, E., & Udry, C. (2004). Intrahousehold Resource Allocation in Côte D’Ivoire: Social Norms, Separate Accounts and Consumption Choices. In NBER Working Paper Series (Vol. 1542). https://doi.org/10.1017/CBO9781107415324.004
FAO (1996) Declaration on world food security. World Food Summit, FAO, Rome. Fenske, N., Burns, J., Hothorn, T., & Rehfuess, E. A. (2013). Understanding Child Stunting in India: A
Comprehensive Analysis of Socio-Economic , Nutritional and Environmental Determinants Using Additive Quantile Regression. PLoS ONE, 8(11). https://doi.org/10.1371/journal.pone.0078692
George, O., & Shively, G. (2017). Charting the cost of nutritionally-adequate diets in Uganda, 2000-2011. African Journal of Food, Agriculture, Nutrition and Development, 17(1), 11571–11591. https://doi.org/10.18697/ajfand.77.16340
Gowda, C. L. L., Srinivasan, S., Gaur, P. M., & Saxena, K. B. (2013). Enhancing the Productivity and Production of Pulses in India. In P. K. Shetty, S. Ayyappan, & M. S. Swaminathan (Eds.), Climate Change and Sustainable Food Security (Bangalore:, pp. 145–159).
Håkansson, A. (2015). Has it become increasingly expensive to follow a nutritious diet? Insights from a new price index for nutritious diets in Sweden 1980–2012. Food and Nutrition Research, 59(1). https://doi.org/10.3402/fnr.v59.26932
Haselow, N. J., Stormer, A., & Pries, A. (2016). Evidence-based evolution of an integrated nutrition-focused agriculture approach to address the underlying determinants of stunting. Maternal & Child Nutrition, 12((Suppl. 1)), 155–168. https://doi.org/10.1111/mcn.12260
Headey, D., Hoddinott, J., & Park, S. (2016). Drivers of nutritional change in four South Asian countries: a dynamic observational analysis. Maternal & Child Nutrition, 12((Suppl. 1)), 210–218. https://doi.org/10.1111/mcn.12274
Herforth, A., Arimond, M., Álvarez-sánchez, C., Coates, J., Christianson, K., & Muehlhoff, E. (2019). A Global Review of Food-Based Dietary Guidelines. Advances in Nutrition, 10(4), 590–605.
Hoddinott, J., & Haddad, L. (1995). Does Female Income Share Infuence Household Expenditures? Evidence from Côte D’Ivoire. Oxford Bulletin of Economics and Statistics, 57(1), 77–96.
IIPS. (2015). National Family Health Survey-4: India Fact Sheet.
Imbert, Clément, & Papp, J. (2016). Migration, Rural Public Works and Urban Labor Markets: Evidence from India (No. 1116). Retrieved from https://www.dropbox.com/s/1nk6v4wzduweq50/JMP.pdf?dl=0.
35
Imbert, Clèment, & Papp, J. (2015). Labor Market Effects of Social Programs: Evidence from India’s Employment Guarantee. American Economic Journal: Applied Economics, 7(2), 233–263.
India Wage Report published by the International Labor Organization 2018
(https://www.ilo.org/wcmsp5/groups/public/---asia/---ro-bangkok/---sro-new_delhi/documents/publication/wcms_638305.pdf).
Joe, W., Rajaram, R., & Subramanian, S. V. (2016). Understanding the null-to-small association between increased macroeconomic growth and reducing child undernutrition in India: role of development expenditures and poverty alleviation. 12((Suppl. 1)), 196–209. https://doi.org/10.1111/mcn.12256
Johnson, D. (2009). Can Workfare Serve as a Substitute for Weather Insurance? The Case of NREGA in Andhra Pradesh. Centre for Micro Finance Working Paper, (32).
Joshi, P. K., Gulati, A., Birthal, P. S., & Tewari, L. (2004). Agricultural diversification in South Asia: Patterns, determinants and policy implications. Economic and Political Weekly, 39(24), 2457–2468.
Khera, R. (Ed.). (2011). The Battle for Employment Guarantee. Oxford: Oxford University Press.
Kumar, P., Kumar, A., Parappurathu, S., & Raju, S. S. (2011). Estimation of Demand Elasticity for Food Commodities in India. Agricultural Economics Research Review, 24, 1–14.
Mahrt, K., Mather, D., Herforth, A., & Headey, D. (2019). Household Dietary Patterns and the Cost of a Nutritious Diet in Myanmar (No. 135).
Malapit, H. J. L., Kadiyala, S., Quisumbing, A. R., Cunningham, K., & Tyagi, P. (2015). Women’s Empowerment Mitigates the Negative Effects of Low Production Diversity on Maternal and Child Nutrition in Nepal. Journal of Development Studies, 51(8), 1097–1123. https://doi.org/10.1080/00220388.2015.1018904
Masters, W. A., Bai, Y., Herforth, A., Sarpong, D. B., Mishili, F., Kinabo, J., & Coates, J. C. (2018). Measuring the affordability of nutritious diets in Africa: Price Indexes for Diet Diversity and the Cost of Nutrient Adequacy. American Journal of Agricultural Economics, 100(5), 1285–1301. https://doi.org/10.1093/ajae/aay059
Menon, P., Headey, D., Avula, R., & Nguyen, P. H. (2018). Understanding the geographical burden of stunting in India : A regression-decomposition analysis of district-level data from 2015-16. Maternal & Child Nutrition, 1–10. https://doi.org/10.1111/mcn.12620
Mulik, K., & Haynes-Maslow, L. (2017). The Affordability of MyPlate : An Analysis of SNAP Benefits and the Actual Cost of Eating According to the Dietary Guidelines. Journal of Nutrition Education and Behavior, 49(8), 623-631.e1. https://doi.org/10.1016/j.jneb.2017.06.005
Narayanan, S. (2019). Food security from free collection of foods. Retrieved from https://papers.ssrn.com/sol3/papers.cfm?abstract_id=3489102
National Institute of Nutrition (2011). Dietary Guidelines for Indians: A Manual. Available at: http://ninindia.org/DietaryGuidelinesforNINwebsite.pdf.
O’Brien-Place, P. M., & Tomek, W. G. (1983). Inflation in Food Prices as Measured by Least-cost diets. American Journal of Agricultural Economics, 65(4), 781–784.
Paintal, K., & Aguayo, V. M. (2016). Feeding practices for infants and young children during and after common illness. Evidence from South Asia. Maternal & Child Nutrition, 12((Suppl.1 )), 39–71. https://doi.org/10.1111/mcn.12222
Pingali, P. (2015). Agricultural policy and nutrition outcomes – getting beyond the preoccupation with staple grains. Food Security, 7, 583–591. https://doi.org/10.1007/s12571-015-0461-x

36
Pingali, P., Mittra, B., & Rahman, A. (2017). The bumpy road from food to nutrition security – Slow evolution of India ’ s food policy. Global Food Security, 15(December 2016), 77–84. https://doi.org/10.1016/j.gfs.2017.05.002
Quisumbing, A. R., Brown, L. R., Feldstein, H. S., Haddad, L., & Peña, C. (1996). Women: The key to food security. Food and Nutrition Bulletin, 17(1), 1–2.
Raghunathan, K., Chakrabarti, S., Menon, P., & Alderman, H. (2017). Deploying the Power of Social Protection to Improve Nutrition: What will it take? Economic and Political Weekly, 52(46), 90–98.
Rao, P., Birthal, P. S., & Joshi, P. K. (2006). Diversification towards high-value agriculture: Role of urbanization and infrastructure. Economic and Political Weekly, 41(26), 2747–2753.
Shively, G., & Sununtnasuk, C. (2015). Agricultural Diversity and Child Stunting in Nepal. Journal of Development Studies, 51(8), 1078–1096. https://doi.org/10.1080/00220388.2015.1018900
Sibhatu, K. T., Krishna, V. V., & Qaim, M. (2015). Production diversity and dietary diversity in smallholder farm households. Proceedings of the National Academy of Sciences, 112(34), 10657–10662. https://doi.org/10.1073/pnas.1510982112
Sibhatu, K. T., & Qaim, M. (2017). Rural food security, subsistence agriculture, and seasonality. PLOS ONE, 12(10), 1–15.
Srivastava, S. K., Sivaramane, N., & Mathur, V. C. (2010). Diagnosis of Pulses Performance of India. Agricultural Economics Research Review, 23(June), 137–148.
Stigler, G. J. (1945). The Cost of Subsistence. Journal of Farm Economics, 27(2), 303–314.
Umali‐Deininger, D., & Sur, M. (2007). Food safety in a globalizing world: opportunities and challenges for India. Agricultural Economics, 37, 135–147.
UNICEF. (1990). Strategy for Improved Nutrition of Children and Women in Developing Countries. New York.
Vir, S. C. (2016). Improving women’s nutrition imperative for rapid reduction of childhood stunting in South Asia: coupling of nutrition specific interventions with nutrition sensitive measures essential. Maternal & Child Nutrition, 12((Suppl. 1)), 72–90. https://doi.org/10.1111/mcn.12255
WFP. (2017). Fill the Nutrient Gap Tool. Project report. Retrieved from https://www.wfp.org/publications/2017-fill-nutrient-gap.
Zimmermann, L. (2018). Why Guarantee Employment ? Evidence from a Large Indian Public-Works Program. Retrieved from https://drive.google.com/file/d/12JYprWjRRIkGW59h0zRdJiiCbSX8kEBl/view
37
APPENDIX
Table A.1: Densities for liquid food items
Food item Density (kg/liter) Coconut oil 0.921 Ghol (lassi/buttermilk) 1.036 Gingelly oil 0.921 Groundnut oul 0.913 Linseed oil 0.926 Milk (buffalo) 1.031 Milk (cow) 1.031 Mustard oil 0.921 Palm oil 0.913 Rapeseed oil 0.921 Refined oil (vegetable) 0.921 Toria oil 0.921 Source: United States Department of Agriculture (USDA) guidelines.
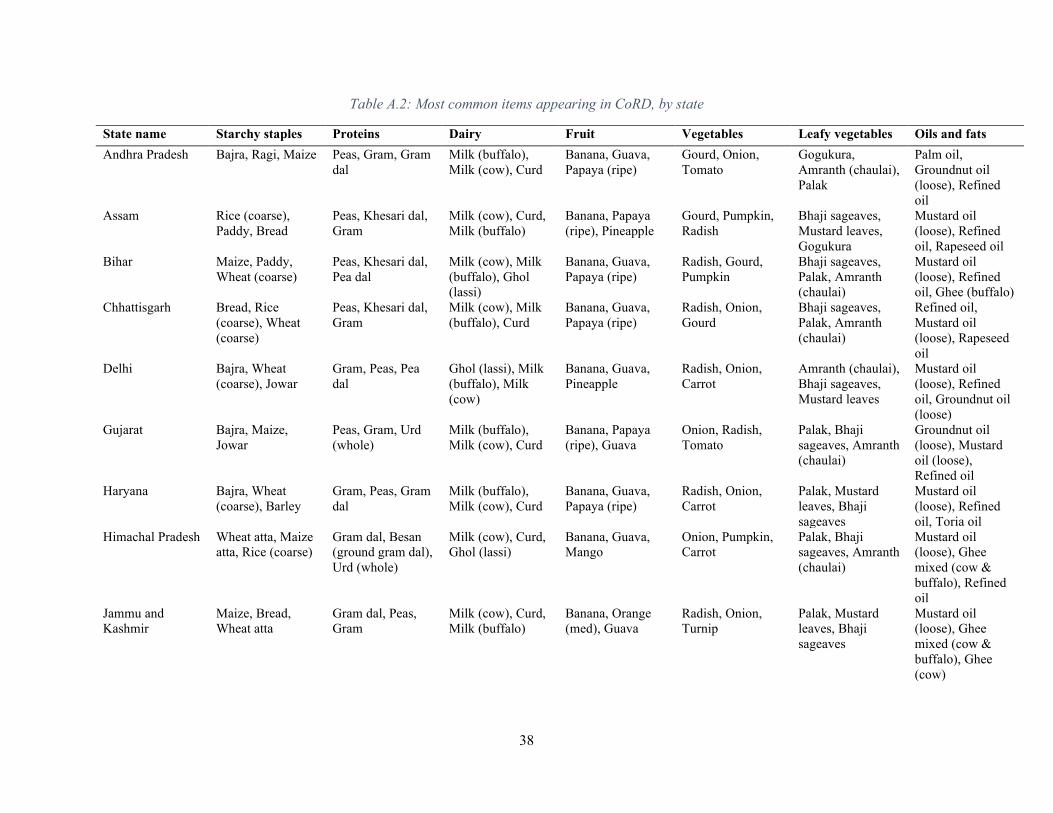
38
Table A.2: Most common items appearing in CoRD, by state
State name Starchy staples Proteins Dairy Fruit Vegetables Leafy vegetables Oils and fats Andhra Pradesh Bajra, Ragi, Maize Peas, Gram, Gram
dal Milk (buffalo), Milk (cow), Curd
Banana, Guava, Papaya (ripe)
Gourd, Onion, Tomato
Gogukura, Amranth (chaulai), Palak
Palm oil, Groundnut oil (loose), Refined oil
Assam Rice (coarse), Paddy, Bread
Peas, Khesari dal, Gram
Milk (cow), Curd, Milk (buffalo)
Banana, Papaya (ripe), Pineapple
Gourd, Pumpkin, Radish
Bhaji sageaves, Mustard leaves, Gogukura
Mustard oil (loose), Refined oil, Rapeseed oil
Bihar Maize, Paddy, Wheat (coarse)
Peas, Khesari dal, Pea dal
Milk (cow), Milk (buffalo), Ghol (lassi)
Banana, Guava, Papaya (ripe)
Radish, Gourd, Pumpkin
Bhaji sageaves, Palak, Amranth (chaulai)
Mustard oil (loose), Refined oil, Ghee (buffalo)
Chhattisgarh Bread, Rice (coarse), Wheat (coarse)
Peas, Khesari dal, Gram
Milk (cow), Milk (buffalo), Curd
Banana, Guava, Papaya (ripe)
Radish, Onion, Gourd
Bhaji sageaves, Palak, Amranth (chaulai)
Refined oil, Mustard oil (loose), Rapeseed oil
Delhi Bajra, Wheat (coarse), Jowar
Gram, Peas, Pea dal
Ghol (lassi), Milk (buffalo), Milk (cow)
Banana, Guava, Pineapple
Radish, Onion, Carrot
Amranth (chaulai), Bhaji sageaves, Mustard leaves
Mustard oil (loose), Refined oil, Groundnut oil (loose)
Gujarat Bajra, Maize, Jowar
Peas, Gram, Urd (whole)
Milk (buffalo), Milk (cow), Curd
Banana, Papaya (ripe), Guava
Onion, Radish, Tomato
Palak, Bhaji sageaves, Amranth (chaulai)
Groundnut oil (loose), Mustard oil (loose), Refined oil
Haryana Bajra, Wheat (coarse), Barley
Gram, Peas, Gram dal
Milk (buffalo), Milk (cow), Curd
Banana, Guava, Papaya (ripe)
Radish, Onion, Carrot
Palak, Mustard leaves, Bhaji sageaves
Mustard oil (loose), Refined oil, Toria oil
Himachal Pradesh Wheat atta, Maize atta, Rice (coarse)
Gram dal, Besan (ground gram dal), Urd (whole)
Milk (cow), Curd, Ghol (lassi)
Banana, Guava, Mango
Onion, Pumpkin, Carrot
Palak, Bhaji sageaves, Amranth (chaulai)
Mustard oil (loose), Ghee mixed (cow & buffalo), Refined oil
Jammu and Kashmir
Maize, Bread, Wheat atta
Gram dal, Peas, Gram
Milk (cow), Curd, Milk (buffalo)
Banana, Orange (med), Guava
Radish, Onion, Turnip
Palak, Mustard leaves, Bhaji sageaves
Mustard oil (loose), Ghee mixed (cow & buffalo), Ghee (cow)

39
Jharkhand Paddy, Maize, Wheat (coarse)
Peas, Khesari dal, Gram
Milk (cow), Milk (buffalo), Curd
Banana, Guava, Papaya (ripe)
Radish, Gourd, Pumpkin
Palak, Bhaji sageaves, Amranth (chaulai)
Mustard oil (loose), Refined oil, Rapeseed oil
Karnataka Ragi, Rice (coarse), Jowar
Gram, Peas, Besan (ground gram dal)
Milk (cow), Milk (buffalo), Curd
Banana, Guava, Pineapple
Radish, Tomato, Onion
Palak, Bhaji sageaves, Mustard leaves
Groundnut oil (loose), Refined oil, Palm oil
Kerala Tapioca, Rice (coarse), Ragi
Peas, Gram, Pea dal
Milk (cow), Curd, Milk (buffalo)
Banana, Guava, Pineapple
Onion fresh, Gourd, Pumpkin
Palak, Amranth (chaulai), Bhaji sageaves
Palm oil, Coconut oil, Gingelly oil (loose)
Madhya Pradesh Wheat (coarse), Maize, Jowar
Gram, Peas, Soyabean
Milk (buffalo), Milk (cow), Curd
Banana, Papaya (ripe), Guava
Onion, Radish, Tomato
Palak, Bhaji sageaves, Amranth (chaulai)
Mustard oil (loose), Refined oil, Groundnut oil (loose)
Maharashtra Jowar, Bajra, Bread
Peas, Gram, Khesari dal
Milk (buffalo), Milk (cow), Curd
Banana, Guava, Papaya (ripe)
Onion, Radish, Tomato
Palak, Bhaji sageaves, Amranth (chaulai)
Refined oil, Groundnut oil (loose), Palm oil
Manipur Maize, Rice (coarse), Bread
Peas, Pea dal, Gram
Milk (cow), Curd, Milk (buffalo)
Pineapple, Banana, Guava
Pumpkin, Cabbage, Gourd
Mustard leaves, Palak, Bhaji sageaves
Palm oil, Refined oil, Mustard oil (loose)
Meghalaya Rice (coarse), Bread, Wheat atta
Peas, Gram, Khesari dal
Milk (cow), Curd, Milk (buffalo)
Banana, Pineapple, Papaya (ripe)
Radish, Arum, Cabbage
Bhaji sageaves, Mustard leaves, Palak
Mustard oil (loose), Refined oil, Ghee (cow)
Odisha Bread, Paddy, Rice (coarse)
Peas, Urd (whole), Pea dal
Milk (cow), Milk (buffalo), Ghol (lassi)
Banana, Guava, Papaya (ripe)
Gourd, Radish, Pumpkin
Bhaji sageaves, Palak, Amranth (chaulai)
Palm oil, Refined oil, Mustard oil (loose)
Punjab Wheat (med.), Wheat atta, Wheat (coarse)
Peas, Gram, Gram dal
Milk (buffalo), Milk (cow), Ghol (lassi)
Banana, Guava, Pineapple
Radish, Onion, Turnip
Palak, Mustard leaves, Bhaji sageaves
Mustard oil (loose), Toria oil, Refined oil
Rajasthan Bajra, Barley, Maize
Gram, Gram dal, Soyabean
Milk (buffalo), Milk (cow), Curd
Banana, Papaya (ripe), Guava
Onion, Radish, Tomato
Palak, Amranth (chaulai), Bhaji sageaves
Mustard oil (loose), Refined oil, Groundnut oil (loose)
Tamil Nadu Bajra, Ragi, Jowar Peas, Pea dal, Gram
Milk (cow), Milk (buffalo), Curd
Banana, Guava, Papaya (ripe)
Gourd, Pumpkin, Radish
Palak, Bhaji sageaves, Amranth (chaulai)
Groundnut oil (loose), Gingelly oil (loose), Palm oil
Tripura Rice (coarse), Rice (med.), Wheat atta
Peas, Gram, Pea dal
Milk (cow), Curd, Ghol (lassi)
Banana, Orange (med), Pineapple
Pumpkin, Radish, Cabbage
Bhaji sageaves, Mustard leaves, Palak
Mustard oil (loose), Refined oil, Rapeseed oil

40
Uttar Pradesh Wheat (coarse), Bajra, Maize
Peas, Pea dal, Gram
Milk (buffalo), Milk (cow), Curd
Banana, Guava, Papaya (ripe)
Radish, Gourd, Pumpkin
Palak, Amranth (chaulai), Mustard leaves
Mustard oil (loose), Refined oil, Ghee (buffalo)
Uttarakhand Rice (coarse), Wheat atta, Bajra
Peas, Soyabean, Pea dal
Milk (buffalo), Curd, Milk (cow)
Banana, Guava, Orange (med)
Radish, Cabbage, Pumpkin
Palak, Mustard leaves, Bhaji sageaves
Refined oil, Mustard oil (loose), Palm oil
West Bengal Paddy, Bread, Rice (coarse)
Peas, Khesari dal, Pea dal
Milk (cow), Milk (buffalo), Curd
Banana, Guava, Papaya (ripe)
Gourd, Radish, Pumpkin
Bhaji sageaves, Palak, Mustard leaves
Mustard oil (loose), Palm oil, Refined oil
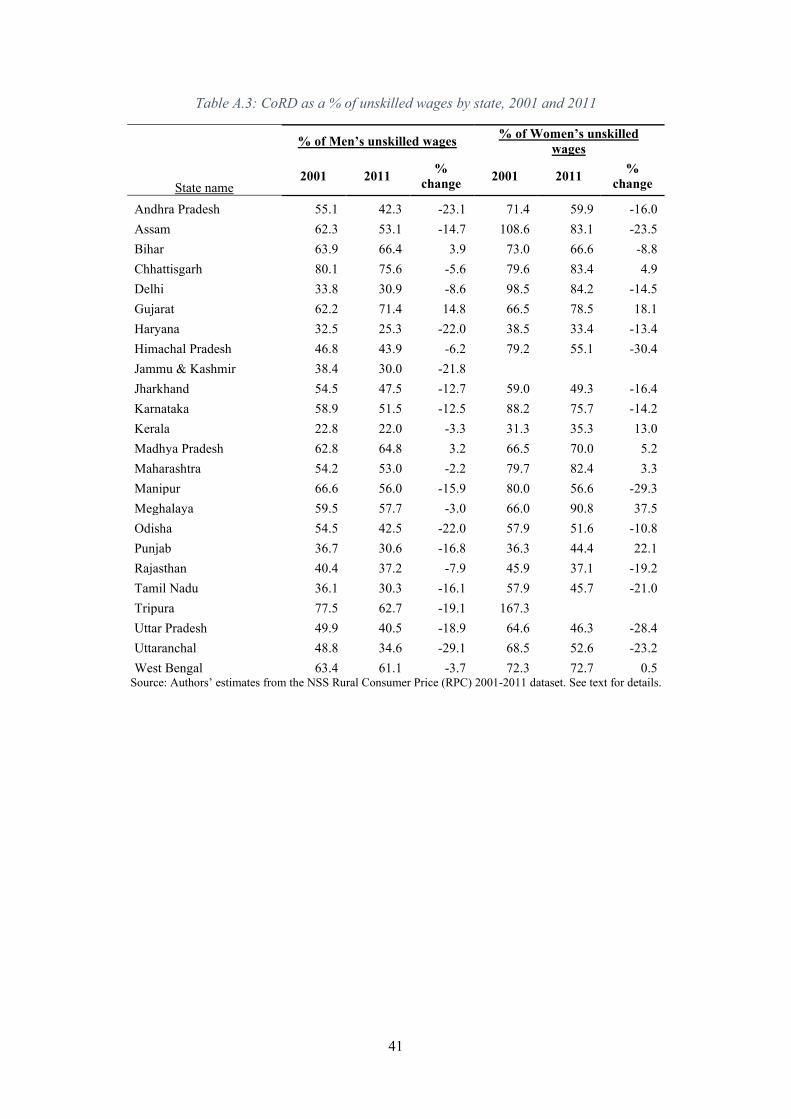
41
Table A.3: CoRD as a % of unskilled wages by state, 2001 and 2011
% of Men’s unskilled wages % of Women’s unskilled
wages
State name 2001 2011 %
change 2001 2011 % change
Andhra Pradesh 55.1 42.3 -23.1 71.4 59.9 -16.0 Assam 62.3 53.1 -14.7 108.6 83.1 -23.5 Bihar 63.9 66.4 3.9 73.0 66.6 -8.8 Chhattisgarh 80.1 75.6 -5.6 79.6 83.4 4.9 Delhi 33.8 30.9 -8.6 98.5 84.2 -14.5 Gujarat 62.2 71.4 14.8 66.5 78.5 18.1 Haryana 32.5 25.3 -22.0 38.5 33.4 -13.4 Himachal Pradesh 46.8 43.9 -6.2 79.2 55.1 -30.4 Jammu & Kashmir 38.4 30.0 -21.8 Jharkhand 54.5 47.5 -12.7 59.0 49.3 -16.4 Karnataka 58.9 51.5 -12.5 88.2 75.7 -14.2 Kerala 22.8 22.0 -3.3 31.3 35.3 13.0 Madhya Pradesh 62.8 64.8 3.2 66.5 70.0 5.2 Maharashtra 54.2 53.0 -2.2 79.7 82.4 3.3 Manipur 66.6 56.0 -15.9 80.0 56.6 -29.3 Meghalaya 59.5 57.7 -3.0 66.0 90.8 37.5 Odisha 54.5 42.5 -22.0 57.9 51.6 -10.8 Punjab 36.7 30.6 -16.8 36.3 44.4 22.1 Rajasthan 40.4 37.2 -7.9 45.9 37.1 -19.2 Tamil Nadu 36.1 30.3 -16.1 57.9 45.7 -21.0 Tripura 77.5 62.7 -19.1 167.3 Uttar Pradesh 49.9 40.5 -18.9 64.6 46.3 -28.4 Uttaranchal 48.8 34.6 -29.1 68.5 52.6 -23.2 West Bengal 63.4 61.1 -3.7 72.3 72.7 0.5
Source: Authors’ estimates from the NSS Rural Consumer Price (RPC) 2001-2011 dataset. See text for details.

42
Table A.4: CoRD and unskilled labor wages for men and women, 2011
Men Women
State name
CoRD (in June 2011
prices)
Unskilled labor wages (in June 2011
prices)
CoRD (in June 2011
prices)
Unskilled labor wages (in June 2011
prices) Andhra Pradesh 45.70 111.34 40.95 73.61 Assam 53.75 101.99 48.10 19.08 Bihar 42.01 63.25 37.68 38.95 Chhattisgarh 46.41 62.80 41.57 50.95 Gujarat 47.26 70.46 42.40 42.42 Haryana 45.46 182.39 41.20 143.49 Himachal Pradesh 61.79 143.02 55.13 50.59 Jammu & Kashmir 51.61 174.86 46.39 0.00 Jharkhand 44.10 95.14 39.76 84.15 Karnataka 41.68 84.91 36.67 34.53 Kerala 48.28 254.80 42.60 60.85 Madhya Pradesh 43.53 71.55 39.40 59.63 Maharashtra 42.88 84.68 38.57 45.43 Manipur 49.51 85.60 44.36 77.52 Meghalaya 55.71 99.89 49.74 42.27 Odisha 39.42 95.28 35.05 78.37 Punjab 47.09 158.79 42.23 20.88 Rajasthan 45.49 128.56 41.44 105.96 Tamil Nadu 43.54 157.52 38.52 76.70 Tripura 63.17 100.92 57.09 0.00 Uttar Pradesh 40.89 102.19 36.86 50.46 Uttaranchal 51.24 147.34 45.86 28.07 West Bengal 43.29 73.11 39.21 48.03
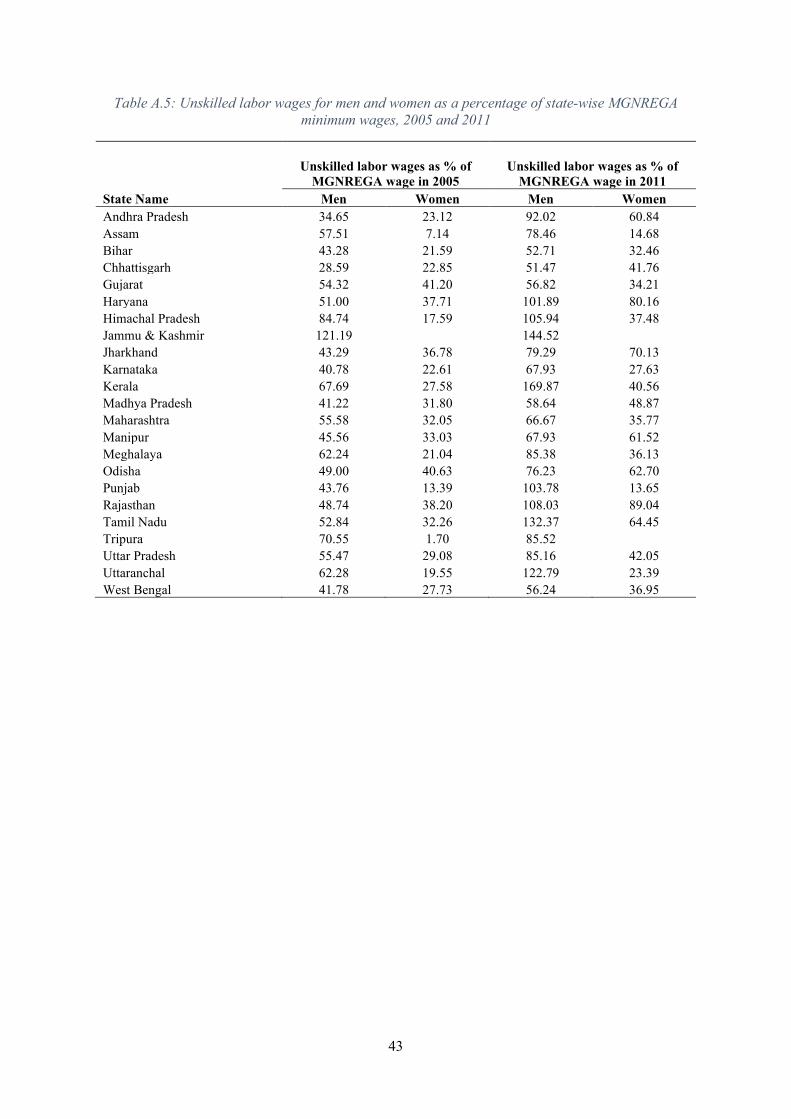
43
Table A.5: Unskilled labor wages for men and women as a percentage of state-wise MGNREGA minimum wages, 2005 and 2011
Unskilled labor wages as % of
MGNREGA wage in 2005 Unskilled labor wages as % of
MGNREGA wage in 2011 State Name Men Women Men Women Andhra Pradesh 34.65 23.12 92.02 60.84 Assam 57.51 7.14 78.46 14.68 Bihar 43.28 21.59 52.71 32.46 Chhattisgarh 28.59 22.85 51.47 41.76 Gujarat 54.32 41.20 56.82 34.21 Haryana 51.00 37.71 101.89 80.16 Himachal Pradesh 84.74 17.59 105.94 37.48 Jammu & Kashmir 121.19 144.52 Jharkhand 43.29 36.78 79.29 70.13 Karnataka 40.78 22.61 67.93 27.63 Kerala 67.69 27.58 169.87 40.56 Madhya Pradesh 41.22 31.80 58.64 48.87 Maharashtra 55.58 32.05 66.67 35.77 Manipur 45.56 33.03 67.93 61.52 Meghalaya 62.24 21.04 85.38 36.13 Odisha 49.00 40.63 76.23 62.70 Punjab 43.76 13.39 103.78 13.65 Rajasthan 48.74 38.20 108.03 89.04 Tamil Nadu 52.84 32.26 132.37 64.45 Tripura 70.55 1.70 85.52 Uttar Pradesh 55.47 29.08 85.16 42.05 Uttaranchal 62.28 19.55 122.79 23.39 West Bengal 41.78 27.73 56.24 36.95

44
Table A.6: CoRD as a percentage of the Mahatma Gandhi National Rural Employment Guarantee Act (MGNREGA) minimum wages for men and women, by state, 2005 & 2011
State name
Men’s CoRD/NREGA wage ratios Women’s CoRD/NREGA wage ratios
2005 2011 % change 2005 2011 % change
All rural India 24.9 34.8 39.5 22.4 31.3 39.7
Andhra Pradesh 18.4 37.8 105.6 16.3 33.8 107.7
Assam 30.6 41.3 35.1 27.5 37.0 34.7
Bihar 23.8 35.0 47.2 21.4 31.4 46.8
Chhattisgarh 25.1 38.0 51.6 22.5 34.1 51.3
Gujarat 35.4 38.1 7.7 31.9 34.2 7.3
Haryana 17.2 25.4 47.8 15.6 23.0 48.0
Himachal Pradesh 37.7 45.8 21.6 33.8 40.8 20.7
Jammu & Kashmir 47.5 42.7 -10.2 42.7 38.3 -10.3
Jharkhand 20.8 36.8 76.4 18.8 33.1 76.0
Karnataka 22.0 33.3 51.4 19.5 29.3 50.7
Kerala 14.4 32.2 123.8 12.7 28.4 123.0
Madhya Pradesh 25.7 35.7 39.1 23.2 32.3 39.4
Maharashtra 31.2 33.8 8.4 28.0 30.4 8.3
Manipur 26.1 39.3 50.6 23.3 35.2 50.8
Meghalaya 26.6 47.6 79.0 23.6 42.5 80.3
Odisha 25.8 31.5 22.0 23.2 28.0 21.0
Punjab 16.6 30.8 85.5 14.9 27.6 85.5
Rajasthan 21.9 38.2 74.3 19.8 34.8 75.8
Tamil Nadu 18.8 36.6 94.7 16.7 32.4 93.8
Tripura 49.8 53.5 7.5 45.2 48.4 7.0
Uttar Pradesh 26.7 34.1 27.4 24.0 30.7 28.0
Uttaranchal 28.8 42.7 48.0 26.1 38.2 46.5
West Bengal 25.2 33.3 32.0 22.9 30.2 31.8
Source: Authors’ estimates from the NSS Rural Consumer Price (RPC) 2001-2011 dataset. MGNREGA wages in 2005-06 and 2011 were obtained from Ministry of Rural Development, Government of India (https://nrega.nic.in/nerega_statewise.pdf ). See text for details. Notes: The MGNREGA was notified in 2005, so the two years presented here are state-wise minimum wages at the time of notification of the Act and in the last year in our data. Missing blocks come from states where wages for female unskilled laborers were not reported.

45
Figure A.1: Trends in real wages for men and women engaged in unskilled labour (2011 INR)
Figure A.2: Trends over time in CoRD relative to unskilled labor wages, men and women

46
Figure A.3: Seasonality in log of food prices by food group, over months of the year
Figure A.4: Nominal wholesale prices per kilogram for 2004-2018
-0.15
-0.1
-0.05
0
0.05
0.1
0.15
0.2
0.25
0.3
Staples Proteins Dairy FruitVegetables Leafy-veg Oils&Fats

ALL IFPRI DISCUSSION PAPERS
All discussion papers are available here
They can be downloaded free of charge INTERNATIONAL FOOD POLICY RESEARCH INSTITUTE www.ifpri.org IFPRI HEADQUARTERS 1201 Eye Street, NW Washington, DC 20005 USA Tel.: +1-202-862-5600 Fax: +1-202-862-5606 Email: [email protected]


