Laboratory of Applied Mechanics and Acoustics, Department of Sound and Musical, Instruments Technology, Technological Educational Institute of Ionianslands, Lixouri, 28200 Cephallonia, GreeceKing Saud University, Saudi Arabia and Laboratory of Archaeometry, Department of Mediterranean Studies, University of the Aegean, 85100 Rhodes,reeceUniversity of Florence, Department of Chemistry “Ugo Schiff” and CSGI, via della Lastruccia 3, 50019 Sesto Fiorentino (FI), ItalyTASCON GmbH, Heisenbergstrasse 15, 48149 Muenster, GermanyKing Saud University, Department of History, Saudi Arabia
a r t i c l e i n f o
rticle history:eceived 24 September 2016ccepted 30 November 2016vailable online 3 January 2017
eywords:bsidianFM
a b s t r a c t
Obsidian surface roughness and rind structure both play a major influence on the Obsidian HydrationDating (OHD). AFM (Atomic Force Microscopy) investigation coupled with quadrupole SIMS hydrogendata profiles establish a validation criterion of quantitative evaluation of roughness for OHD dating pur-poses. More evidence of the importance of the surface morphology at the nanoscale is given for fiveobsidian tools of different origin. The latter relates to the dynamic ion influx diffusion kinetics betweensurface and surrounded sediment media, and the obsidian structure, thus, 2D and 3D surface mapping,as well as, cation profiling (H, C, Mg, Al, F, S, Cl, CN, O isotopes) were made by TOF-SIMS and quad-SIMS.
It was found that the C and Mg are considered as imposed criteria for accepting suitability of H+ profilesfor further processing by SIMS-Surface Saturation dating method. The effect of roughness to dating isdiscussed.
Obsidian is a natural glass that undergoes hydration because ofnvironmental humidity and forms a hydration rim in its interfaceayer (few microns below the surface). It is known that the hydra-ion of obsidian is a complicated, diffusion-limited phenomenon,hich is strongly affected mainly by environmental factors of tem-erature, water concentration on the glass surface, as well as,ristine water (glass structural water) [1–4].
In the last decade, novel approaches to the investigation of thebsidian surfaces by means of Scanning Electron Microscopy (SEM)nd Secondary Ion Mass Spectroscopy (SIMS) have revealed thenfluence of microlithic inclusions on the hydration process [5–7].
urthermore, preliminary results from investigation of the surfaceith Atomic Force Microscopy (AFM) have shown that the surface
oughness has a significant impact on SIMS measurement [6–9].
Roughness derives from various causes, the weathering (burial con-ditions), cleavage during carving of the tool, usage.
Here, new measurements of AFM along with quadrupole SIMSand ToF-SIMS mapping and cation profiling on obsidians had lead tofurther assessment and evaluation of the criterion for choosing andaccepting suitable obsidian surface areas for SIMS, and cation pro-files. Investigations on surface roughness and profile data scatterand dispersion prior to any H+ SIMS profile for SIMS-SS datingpurposes [5] has been instrumentally and statistically documented.
2. AFM on archaeological materials and obsidians
Since its discovery [10], thanks to its versatility, the AFM tech-nique has been widely used in many different fields, such as biologyand micro/nano-electronics. Although there are studies reportingits use in modern glasses (especially for the study of optical fibers),
there are very few reports describing its use in archeologicalglasses.
Considering the most relevant studies reporting the use ofAFM in ancient obsidians and manufactured glasses these are by:
chmitz et al. in 1995 [11]; Schreiner et al. in 1999 [12] showing theharacterization of the surface of mediaeval vitro (stained glass)xposed to natural environmental conditions; Carmona et al. in010 [13], comparing the surface micro-structures in ancient andodern glasses degraded by chemicals, Zacharias et al., 2010 [14]
n the authenticity of glazed pottery; Melcher et al. in 2010 [15]tudying the degradation of glass artifacts. AFM has been previouslysed in the investigation of obsidians by Liritzis et al. in 2008 [8,9]nd by Novak and Stevenson in 2012 [16]. These results pointed outhat the surface roughness can potentially influence the sputteringf ions, the diffusion profiles of cations into the glass and especiallyistorts the concentration of water (as H+) versus depth.
. SIMS on surfaces: the effect of roughness
The SIMS method is based on the sputtering of secondary ionsrom the surface of a material that is bombarded by a primaryon beam [17]. The type and the quantity of the sputtered sec-ndary ions from the surface provide useful information on thehemical composition of the surface under examination. By using
profilometer to measure the total depth of the crater formed byhe bombardment, information on the concentration distribution ofhe elements versus depth can be inferred. Several studies on mate-ials, mainly in the research field of micro-/nano-electronics (e.g.hin films of silicon or germanium), show that the measurement of
surface by SIMS is subjected to the influence of the roughness ofhe surface [18].
Irrespective to the material’s composition and the nature ofhe ion beam, the influence of the roughness on the experimen-al output (chemical composition versus depth profile) is twofold:he first one is connected to the intrinsic roughness of the mate-ial; the second one concerns the additional roughness induced byhe ion bombardment [16–20]. In fact, the two types of impact inrocessed surfaces of silica was found for primer ion beam of oxy-en (O) [19,21], and in the same surface but for primer ion beam ofesium (Cs) [20].
The impact of surface morphology on SIMS results has beenomprehensively discussed [18,22], assessing that natural cracks,inholes or swellings could lead to unreliable results. The surfaceoughness has an influence on the spread of secondary ions duringhe bombardment and, as a result, distorted data for the composi-ion of the surface are recorded as they reach the mass spectrom-ter. In addition, the roughness induced by the ion beam furthernfluences the distribution of the secondary ions. In a recent report,ovak and Stevenson [16] have investigated modern and archae-logical obsidian surfaces by means of SIMS and AFM, concludinghat the roughness measured by SIMS is larger than its real value. Its not yet clear at which depth this induced roughness starts to beenerated, while this information would be important to give a cor-ect interpretation of the hydrogen profiles. In 2008 the first resultsrom the AFM measurements were published [8,9] and they revealhat there seems a correlation between the spread of the profileoncentration values found by SIMS and the value of the roughnessbtained by AFM. This correlation could be related to the effect ofhe surface roughness on the dispersion of the secondary ions andhe collection of disturbed data from the mass spectrometer.
This paper aims at confirming and expanding the validity of thispproach, evaluating the importance of the structural characteri-ation at the micro- and nanoscale, by complimentary quad-SIMSnd ToF-SIMS mapping and cation profiling of rinds on obsidians ofifferent archaeological origin.
. Experimental details
All samples were investigated by means of a Park XE-100 AFM inontact mode (NSC36 probes, radius of curvature < 10 nm). To avoid
l Heritage 25 (2017) 101–112
microscopic cracks and inhomogeneities, the regions to be scannedby AFM were chosen with the aid of an optical microscope [8].
Secondary ion mass spectrometry (SIMS) analyses were con-ducted at the commercial laboratory of Evans Analytical Group,East Windsor, NJ, USA, and the profiles were collected using PHIModel 6300 and 6600 quadrupole-based secondary ion mass spec-trometers. A 5.0 KeV Cs+ primary ion beam with an impact angleof 60◦ with respect to surface normal was used and negative sec-ondary ions were detected. The measurements were performedusing a 300 × 300 micron ion beam raster, which results in verylittle visual disruption to the sample surface. Generally, the SIMSdepth scale accuracy for archaeological samples is within 5–10%.This translates into an estimated error of ± 0.05 �m. This value isnot equivalent to the ± 0.01–0.03 �m standard deviation usuallyassociated with SIMS because of the irregular surface topographypresent on naturally cleaved samples. For polished test samplescrater depths are measured using a Dektak 6 M stylus profilometerwhich is reproducible to within 1% on flat, well-controlled samples[8].
ToF-SIMS measurements were carried out within the scope ofan ION-TOF ToF-SIMS.5-200 demonstration in the laboratories ofTascon in Germany. The chosen analytical conditions were adaptedto the respective analytical needs. General information about ToF-SIMS instrumentation, modes of operation and typical applicationscan be found elsewhere [23].
A representative image displaying one of the AFM experimentsis reported for each sample, showing the positioning of the tip overthe surface. Table 1 reports the analyzed samples together withtheir place of origin. These together with some more measured byTOF-SIMS were chosen to investigate surface differences under dif-ferent environments (Aegean, Carpathian, Asia Minor, ContinentalGreece), some of them have had stereo microscopic images withdifferences in surface appearance, while others are compared tosamples from same stratigraphy and age of earlier made SIMS pro-files.
5. Measurements by AFM and SIMS
5.1. AFM
5.1.1. Sample RHO-4 (ULUCAK)Optical microscopy results show that the sample is not flat and
that it is not homogeneous in the micrometric scale. The samplefeatures cracks, voids and inhomogeneities typically in the range offew microns. The percentage of the area covered by such features islower than 10%. The vast majority of the surface consists of regionssimilar to the one shown in the micrograph in Table 1. In theseregions the surface mainly consists of sub-micrometric spheroidalstructures. The size and shape of these objects are quite homoge-neous. Typically, particle diameter is in the range between 20 nmand 100 nm, while the height is typically below 10 nm (Fig. 1).
5.1.2. Sample RHO-8 (ULUCAK)Optical microscopy investigation (see Table 1) reveals a micro-
scopic structure partly similar that of RHO-4, while AFM resultsdisplay significant differences. Rod-like crystallites are present ontop of spheroidal structures similar to those observed in RHO-4 (seeFig. 2). The dimensions of rod-like particles are typically around100 nm in cross-section and few hundreds of nm in length.
5.1.3. Sample RHO-363 (MORAVANY-3)
By naked eye this sample looks very different from the others; in
fact, the sample is not as black colored as the others, and is partlytranslucent. The surface is extremely flat, except for some linearscratches, clearly visible in the optical micrograph (see Table 1).
N. Laskaris et al. / Journal of Cultural Heritage 25 (2017) 101–112 103
Table 1Provenance and visual aspect of obsidian samples analyzed with AFM.
Sample no Provenance Macrophoto Micrograph
RHO-4 (ULUCAK) SmyrnaNeolithic settlementMinor Asia
RHO-8 (ULUCAK) SmyrnaNeolithic settlementMinor Asia
RHO-442 (YAL-2) Island of GyaliNeolithic settlementDodecanese, Greece
RHO-450 (YR-2) Island of Youra“Cyclops Cave” settlementLate palaeolithic layerAlonissos, Greece
Fig. 1. AFM image of the sample RHO-4 (ULUCAK). The height profiles along three lines are shown. The surface mainly consists of nanometric spheroidal structures.
104 N. Laskaris et al. / Journal of Cultural Heritage 25 (2017) 101–112
Fig. 2. AFM image of the sample RHO-8 (ULUCAK). The height profiles along three lines are shown. The surface consists of rod-like nanometric particles on top of spheroidalstructures.
NY-3). The height profiles along three lines are reported.
Ag
5
((roFiw
5
hssd
Ver
R
W
Table 2Roughness coefficient values Ra for obsidians of Table 1.
Sample Ra (nm)
RHO-4 14 ± 4RHO-8 35 ± 8
Fig. 3. AFM image of the sample RHO-363 (MORAVA
FM results reveal the presence in the flat regions of inhomo-eneities whose height is typically below 10 nm (see Fig. 3).
.1.4. Sample RHO-442 (YAL-2)Optical microscopy (see Table 1) shows that sample RHO-442
YAL) on the microscopic scale is very similar to sample RHO-4ULUCAK), featuring cracks and inhomogeneities, typically in theange of few microns. Again, the majority of the surface consistsf regions similar to the one where the AFM probe is placed inig. 4. At the nanoscale, AFM shows the presence of crystallites andnhomogeneities, irregular both in size and shape. Small particles
ith diameter of few tens of nanometers are also present.
.1.5. Sample RHO-450 (YR-2)At the microscopic scale, the surface of this sample is quite
omogeneous (see micrograph in Table 1). AFM investigationhows the presence at the nanoscale of globular structures whoseize is roughly 10 nm in height and few hundreds of nanometers iniameter (see Fig. 5).
Table 2 summarizes the values of roughness for each sample.alues were obtained by means of AFM as an average over 4 differ-nt regions, each one having an area of 25 �m2. The roughness iseported as the arithmetic average, Ra calculated as:
n∑∣ ∣
a = 1
ni=1
∣yi∣
here yi represents the height of a single AFM pixel.
MORAVANY-3 9 ± 3YAL-2 42 ± 22YR-2 23 ± 15
5.2. SIMS profiles and SIMS-SS dating
A novel dating approach using SIMS-SS to investigate secondaryion mass spectrometry-surface saturation layer has been proposed.The water diffusion into the obsidian follows a S-like curve thatobeys satisfactorily enough the 2nd Fick’s law of diffusion (Eq. (1))– a diffused region and an exponential region, both reflect twodifferent diffusion mechanisms [5] (Fig. 6), where c is the concentra-tion. A solution of this mathematical expression for certain bound-ary conditions provides the age equation of diffusion time (Eq. (2)).
Fick’s Second Law (for 1D diffusion):
∂c
∂t= D
∂2c
∂x2← from equation of continuity (1)
Analytical solutions can be found for specific initial and bound-ary conditions[ ]2
T =(Ci − Cs)2 1.128
1− 0.177kCiCs
4Dseff[
dCdx
∣∣x=0
]2(2)
N. Laskaris et al. / Journal of Cultural Heritage 25 (2017) 101–112 105
Fig. 4. AFM image of the sample RHO-442 (YAL-2). The height profiles along three lines are shown.
-2). Th
Wsbsc
omTdfiir(
(ccbsddSaa
Sif
Fig. 5. AFM image of the sample RHO-450 (YR
here, C the concentration of water for intrinsic (I) and surfaceaturation (S) layer respectively, k a parameter from Crank’s basicook (The Mathematics of diffusion 1975, Clarendon Press, Oxford)olutions for non-dimensional plots, and Dseff the effective diffusionoefficient [5].
It is based on the modeling of the water distribution into thebsidian surface. The Water distribution is measured with the SIMSethod and on the new concept of a Saturation Surface layer (SS).
his layer is created on the first 1–3 �m of the obsidian surfaceue to the different speed of the two diffusion Mechanisms. Therst mechanism transfers the ambient water from the environment
nto the exterior surface of obsidian, and the second mechanism isesponsible for the diffusion process into the interior of the artifactFig. 6A, B).
However, the determination of the SS layer, i.e. the little flatplateau) segment in the diffused region of the sigmoid curve, is arucial age parameter. This SS layer is formed with a highest con-entration as a progressive front during the diffusion time definedy Cs and xs. This is located by, (i) the sliding progressive regres-ions to determine a near-zero slope, and, (ii) through a repeatederivatives approach starting from the initial points to the wholeiffused region. This way an emerged pattern for safe location ofS appears. But the latter has shown cases where the location of SSnd/or the polynomial fitting of the profile are both problematic,nd uncertain ages are linked to the surface topography.
It has been shown [9] that the proper choice of the spot whereIMS analysis is performed represents a crucial step in the reliabil-ty of the proposed dating method. When this condition is properlyulfilled, the accuracy of the results should directly depend on the
e height profiles along three lines are shown.
roughness of the sample. An indication of the correlation betweenSIMS-diffused profile properties and surface roughness aids selec-tion of appropriate obsidian surfaces for dating. Fig. 6A is a sigmoidprofile of obsidian produced by SIMS indicating the diffused region.In the diffused region a linear regression fit (y = a + bx) defines thedispersion, which reflects the degree of roughness and sputtering(Fig. 6B). The dispersion is defined by the Standard Deviation ofResiduals (Rstd). Thus, Rstd is the standard deviation of residualsbetween data and linear fitting in diffused region, and Ra, is thearithmetic mean deviation calculated by the AFM. Fig. 7 shows thecorrelation between Rstd and Ra.
6. Discussion on roughness
In Fig. 7 for the sake of comparison, the newly investigatedsamples are reported together with those of three pairs of val-ues already published in previous works [8,9]. The results suggesta linear correlation between AFM roughness and SIMS standarddeviation (as highlighted by the pink rectangle in Fig. 8) except ofRHO-4 and YR-2, which appreciably deviate from the linear trend.At this stage we are not able to explain the behavior of these lasttwo samples. Most probably, it is due to experimental issues suchas the statistical representativeness of the areas investigated byAFM and SIMS or the topography of craters formed during SIMSmeasurements, work that is under way.
It has already been shown elsewhere [8,9] that a correlationexists between the roughness parameters extracted by means ofAFM and the Rstd factor obtained by SIMS. The dispersion of SIMSdata points is influenced by both the surface roughness of the
106 N. Laskaris et al. / Journal of Cultural Heritage 25 (2017) 101–112
Fig. 6. A. SIMS profile for hydrogen with a best fit applied. It consists of the diffusedregion (long) and exponential region (right). B. Blow up of diffused region of (A).Note the scatter around the best fit (red) and the segment with arrow the surfacesaturation (SS) layer.
Fig. 7. Rstd coefficient versus Ra for eight pairs of AFM-SIMS measurements. AFM analysisand for sample YR-3 has been made in the same raster area investigated by SIMS. In the
and SIMS on samples Sar-3 and Sar-4 (The Sar-2,3,4 all derive from the Sarakinos Cave, Upprovenance source from Melos island Aegean Sea).
Fig. 8. Change in age for % change of saturation concentration for four samplesderived from four different obsidian sources.
sample and the ripple roughness induced by the primary ion beam[19–21]. The latter has already been shown to negatively affect theaccuracy of SIMS analyses in [22], also for obsidians in [16], andhas been reconfirmed and accurately evaluated by AFM.
Ultimately, the effect of roughness in SIMS-SS dating and espe-cially regarding accuracy in the SS layer estimation is discussed.Figs. 6 and 8 show the effect of the dispersion of scattered datapoints in the determination of SS layer, on the age obtained forfour obsidian tools. A ± 10% error in Cs of SS layer gives a ∼25%
error in age. It is apparent that the suppression of roughness byselecting proper raster area for ion beam to get the H+ profile isvery crucial. In obsidian tools the hydration layers can reach thick-nesses up to 15–20 �m, while this layer does not exceed 1.5–2 �m
of the five samples of the present work (YR-2, YAL-2, RHO-4, RHO-8, MORAVANY-3)case of Sar-2, Sar-3 and Sar-4 samples AFM measurement has been made on Sar-2per Paleolithic to Neolithic Settlement, Boeotia Prefecture, Greece; and have same
N. Laskaris et al. / Journal of Cultural Heritage 25 (2017) 101–112 107
ibooda
itcida
igtfba
7
iidSwol
Fig. 10. Sar-8. H, Si, C, F, Na, Mg, K, Al and Cl profiles by Quadrupole SIMS.
TS
Fig. 9. Sar-7. H, Si, C, F, Na, Mg, K, Al and Cl profiles by Quadrupole SIMS.
n recent samples. Consequently, old samples need long ion bom-ardment times to reach the depth corresponding to the beginningf the hydrogen concentration profile. This produces an increasef the secondary roughness formed inside the crater and a higherispersion of secondary ions, causing reduced accuracy in SIMSnalyses.
The initial surface roughness affects the dispersion of secondaryons during sputtering that causes disturbed profiles of concentra-ions. Moreover, the roughness produced by the beam in the formedrater affects both the dispersion of secondary ions and the follow-ng accuracy of depth in the crater via the profilometer. The latter isue to the inhomogeneous structure of obsidian with cracks, voidsnd minerals spread over the obsidian body.
This internal “roughness” has been further supported by profil-ng of more cations of carbon, aluminium, fluorine, manganese, andetting 2D and 3D mapping of obsidians, all of which supplementhe mentioned above findings, and provide an additional criterionor the suitability of H+ SIMS profiles for SIMS-SS dating. Data haveeen produced with a quadrupole SIMS and by TOF-SIMS providingn insight to the structural status within the rind of the surface.
. Depth profile with TOF-SIMS and Quad-SIMS
The impact on H+ hydration profiles and/or of the hydrationtself on the reported presence of carbon and nitrogen [23] in obsid-an surfaces has been further investigated. This hypothesis wasone by examining obsidian surfaces with Quad-SIMS and TOF-IMS. Depth profiles of relative concentrations of carbon (C), along
ith fluorine (F), aluminum (Al) and magnesium (Mg), as well as,
ther cations are measured on some obsidian tools from archaeo-ogical sites in Aegean, Mainland Greece and Carpathian (Table 3).
able 3amples, sites and SIMS measurements for cation profiles and mapping.
Sample code no Site SI
RHD-1024 Prophet Elias HillDesfina (Delphi), GreeceSurface find
TO
RHO-523 MoravanyEarly Neolithic Settlement, East Slovakia
QSar-8Sar-9RHO-892 Ikaria Island Mesolithic Settlement, Greece [26]
Fig. 11. As Fig. 10 (Sar-8) from different spot by Quadrupole SIMS.
Figs. 9–12 show the depth profiles of the afore mentionedelements for archaeological obsidians Sar-7, Sar-8, RHO-892 byquad-SIMS.
Carbon profiles relate that for Mg more than F and Al and bothfollow in general an exponential drop.
In all cases the disturbance of C Mg was in the top surface layers(1–2 �m) but in sample Sar-8 (Fig. 11) the disturbance is in depthof approx. 3.5 �m. Such a disturbance in this depth is clearly evi-dence for a carbonate mineral microlithic (dolomite) inclusion. Aleaching/enrichment is also observed in near surface for fluorine(Fig. 9a, b and Fig. 11), which may be due to the pH of immediate
soil environment.
C and Mg exhibit a parallel exponential drop with similar dis-turbance at 0.8 �m. The inflection of H+ curve coincides with the
MS Measurements
F-SIMS Surface composition (all)H profile up to 10 �m16O and 18O profileCations profile3D mapping analysis (YR-3 and RHO-523)
uadrupole SIMS Profile of C, Mg, F, Al
108 N. Laskaris et al. / Journal of Cultura
F
pff
mthitibcM
Fa
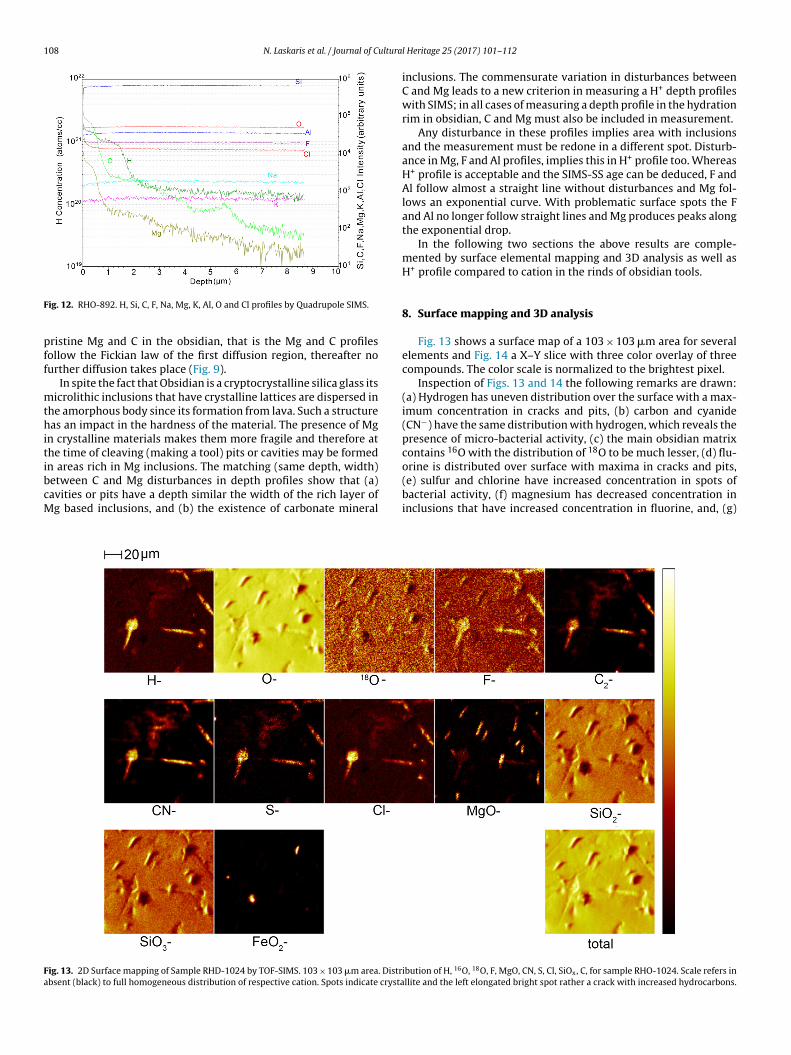
ig. 12. RHO-892. H, Si, C, F, Na, Mg, K, Al, O and Cl profiles by Quadrupole SIMS.
ristine Mg and C in the obsidian, that is the Mg and C profilesollow the Fickian law of the first diffusion region, thereafter nourther diffusion takes place (Fig. 9).
In spite the fact that Obsidian is a cryptocrystalline silica glass itsicrolithic inclusions that have crystalline lattices are dispersed in
he amorphous body since its formation from lava. Such a structureas an impact in the hardness of the material. The presence of Mg
n crystalline materials makes them more fragile and therefore athe time of cleaving (making a tool) pits or cavities may be formed
n areas rich in Mg inclusions. The matching (same depth, width)etween C and Mg disturbances in depth profiles show that (a)avities or pits have a depth similar the width of the rich layer ofg based inclusions, and (b) the existence of carbonate mineral
ig. 13. 2D Surface mapping of Sample RHD-1024 by TOF-SIMS. 103 × 103 �m area. Distrbsent (black) to full homogeneous distribution of respective cation. Spots indicate crysta
l Heritage 25 (2017) 101–112
inclusions. The commensurate variation in disturbances betweenC and Mg leads to a new criterion in measuring a H+ depth profileswith SIMS; in all cases of measuring a depth profile in the hydrationrim in obsidian, C and Mg must also be included in measurement.
Any disturbance in these profiles implies area with inclusionsand the measurement must be redone in a different spot. Disturb-ance in Mg, F and Al profiles, implies this in H+ profile too. WhereasH+ profile is acceptable and the SIMS-SS age can be deduced, F andAl follow almost a straight line without disturbances and Mg fol-lows an exponential curve. With problematic surface spots the Fand Al no longer follow straight lines and Mg produces peaks alongthe exponential drop.
In the following two sections the above results are comple-mented by surface elemental mapping and 3D analysis as well asH+ profile compared to cation in the rinds of obsidian tools.
8. Surface mapping and 3D analysis
Fig. 13 shows a surface map of a 103 × 103 �m area for severalelements and Fig. 14 a X–Y slice with three color overlay of threecompounds. The color scale is normalized to the brightest pixel.
Inspection of Figs. 13 and 14 the following remarks are drawn:(a) Hydrogen has uneven distribution over the surface with a max-imum concentration in cracks and pits, (b) carbon and cyanide(CN−) have the same distribution with hydrogen, which reveals thepresence of micro-bacterial activity, (c) the main obsidian matrixcontains 16O with the distribution of 18O to be much lesser, (d) flu-
orine is distributed over surface with maxima in cracks and pits,(e) sulfur and chlorine have increased concentration in spots ofbacterial activity, (f) magnesium has decreased concentration ininclusions that have increased concentration in fluorine, and, (g)
ibution of H, 16O, 18O, F, MgO, CN, S, Cl, SiOx, C, for sample RHO-1024. Scale refers inllite and the left elongated bright spot rather a crack with increased hydrocarbons.
N. Laskaris et al. / Journal of Cultura
F∼
tt
frXdtimgHoad
and SIMS and SIMS-TOF. The new data have been discussed per each
Fgr
ig. 14. Three color overlay for Fig. 13 for MgO, FeO2, SiO2, X–Y slice. Area100 × 100 �m.
he concentration of iron in spots with a shortage of silicon pointshe presence of Fe-inclusions.
Fig. 15 shows the 3D distribution of H, 16O, 18O, Cl, MgO, SiOx
or the same area as in Fig. 13. Inspection of Fig. 14 (second row)eveals that the formation of the hydration layer is uniform along
and Z axes. If the crater depth is about 4.2 �m, the hydrationepth is 1.8–2 �m. The depth scale was calculated based on sput-er rates determined on a suitable reference sample. Moreover, thencreased H+ concentration due to biological activity inside cracks
ay disturb the H+ hydration profile giving higher values of hydro-en concentration, resulting to a disturbed of highly scattered SIMS+ profile. From the comparison of the second and the sixth image
f Fig. 15 and Fig. 13 we conclude that 16O and Silica decrease inreas of Fe-rich; 18O seems to have a uniform distribution alongepth, though beyond diffused layer both 18O and 16O exhibit a
ig. 15. 3D cross-sections by TOF-SIMS. Sample RHD-1024. Detail of Fig. 13. First row: X–reen line, viewing direction from the bottom. Third row: Y–Z slices along green line, vieow for H the boundary between diffused rim (upper) and non-diffused part, as well as, a
l Heritage 25 (2017) 101–112 109
drop (Fig. 16b), areas rich in Mg are in deeper layers, while spotsrich in Cl are limited to surface (see Figs. 6 and 10). Relevant map-ping has been earlier used for characterization and provenance ofancient opaque glass [27].
9. Cation depth profiling
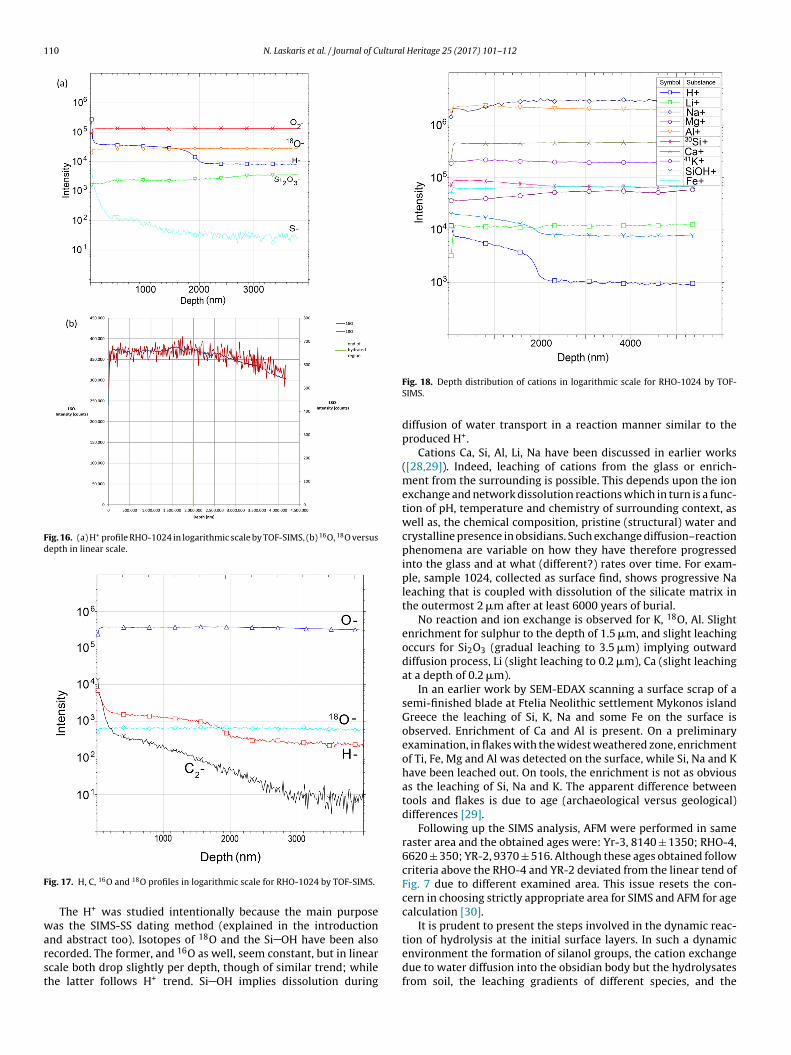
Figs. 16–18 demonstrate the depth profiles of H+ in relation toother cations, for sample RHD-1024.
The different complementary techniques used were listed inTable 3. A depth scale was established by measuring the total craterdepth of a suitable profile on RHD-1024 with a mechanical profilerand assuming linear sputter rates.
The depth of the point of inflection in the H+ profile was usedto establish depth scales for all other profiles acquired on RHO-1024. The accuracy of the depth scale is limited due to the strongsurface roughness of the obsidian. The impact of surface roughnesson SIMS measurements is in fact dealt with above; in addition, here,in Figs. 16–18 it is observed that the sigmoid shape of the hydrogen(hydration layer) is also found for the silicon hydroxyl (Si OH).This strengthens the diffusion–reaction model suggested by lateDoremus [4]. Also, it was found that none of the other element orcompounds has any significant change except sodium. The nearsurface leaching of Na is due to trace element exchange with theburial environment.
10. Discussion
The roughness of obsidian surface and the detailed cation pro-files and surface distribution in obsidians has been studied via AFM
section separately. Here we discuss other issues of cation profilesand the resulted interaction between obsidian surface and contextwith a due explanation related to leaching/enrichment.
Y distribution integrated over total sputtered depth. Second row: X–Z slices alongwing direction from the left. Total crater depth 4.2 �m. Note in the middle left XZ
vertical crack apparent in YZ.
110 N. Laskaris et al. / Journal of Cultural Heritage 25 (2017) 101–112
Fig. 16. (a) H+ profile RHO-1024 in logarithmic scale by TOF-SIMS, (b) 16O, 18O versusdepth in linear scale.
F
warst
ig. 17. H, C, 16O and 18O profiles in logarithmic scale for RHO-1024 by TOF-SIMS.
The H+ was studied intentionally because the main purposeas the SIMS-SS dating method (explained in the introduction
nd abstract too). Isotopes of 18O and the Si OH have been alsoecorded. The former, and 16O as well, seem constant, but in linearcale both drop slightly per depth, though of similar trend; whilehe latter follows H+ trend. Si OH implies dissolution during
Fig. 18. Depth distribution of cations in logarithmic scale for RHO-1024 by TOF-SIMS.
diffusion of water transport in a reaction manner similar to theproduced H+.
Cations Ca, Si, Al, Li, Na have been discussed in earlier works([28,29]). Indeed, leaching of cations from the glass or enrich-ment from the surrounding is possible. This depends upon the ionexchange and network dissolution reactions which in turn is a func-tion of pH, temperature and chemistry of surrounding context, aswell as, the chemical composition, pristine (structural) water andcrystalline presence in obsidians. Such exchange diffusion–reactionphenomena are variable on how they have therefore progressedinto the glass and at what (different?) rates over time. For exam-ple, sample 1024, collected as surface find, shows progressive Naleaching that is coupled with dissolution of the silicate matrix inthe outermost 2 �m after at least 6000 years of burial.
No reaction and ion exchange is observed for K, 18O, Al. Slightenrichment for sulphur to the depth of 1.5 �m, and slight leachingoccurs for Si2O3 (gradual leaching to 3.5 �m) implying outwarddiffusion process, Li (slight leaching to 0.2 �m), Ca (slight leachingat a depth of 0.2 �m).
In an earlier work by SEM-EDAX scanning a surface scrap of asemi-finished blade at Ftelia Neolithic settlement Mykonos islandGreece the leaching of Si, K, Na and some Fe on the surface isobserved. Enrichment of Ca and Al is present. On a preliminaryexamination, in flakes with the widest weathered zone, enrichmentof Ti, Fe, Mg and Al was detected on the surface, while Si, Na and Khave been leached out. On tools, the enrichment is not as obviousas the leaching of Si, Na and K. The apparent difference betweentools and flakes is due to age (archaeological versus geological)differences [29].
Following up the SIMS analysis, AFM were performed in sameraster area and the obtained ages were: Yr-3, 8140 ± 1350; RHO-4,6620 ± 350; YR-2, 9370 ± 516. Although these ages obtained followcriteria above the RHO-4 and YR-2 deviated from the linear tend ofFig. 7 due to different examined area. This issue resets the con-cern in choosing strictly appropriate area for SIMS and AFM for agecalculation [30].
It is prudent to present the steps involved in the dynamic reac-
tion of hydrolysis at the initial surface layers. In such a dynamicenvironment the formation of silanol groups, the cation exchangedue to water diffusion into the obsidian body but the hydrolysatesfrom soil, the leaching gradients of different species, and the
ultura
ico
bdoea(calpIbottpsgutiaatwsisacewta
l±nmaO[dihH
1
pdAwtaaratf
N. Laskaris et al. / Journal of C
sotopic 16O/18O gradual drop deeper that the diffused area, areonsidered to be due to the following four mechanisms during thebsidian exposed to water and soil solution during burial time [31].
First, the glass surface responds to the stress of a fracture byecoming reactive enough to “sorb” a variety of molecules; Second,issociated molecules from the fluid phase diffuse inside the freshbsidian through a mesoscopic network of fractures. H3O+ ionsxchange at a very high rate (the “initial rate”) (see, Fig. 6a), withvailable network modifiers that are water soluble, such as alkalisbut also alkaline-earths and divalent transition elements). This so-alled “inter-diffusion” effect is initially intense but quickly reaches
steady state with time except possibly in closed systems afterong exposures that forms the surface saturation layer (SS) a crucialarameter in SIMS-SS dating method [32] (see section 5.2 above).
n a closed system, the pH will locally increase at the interfaceecause of the formation of silanol groups (Si OH) and the leachingf “free” aqueous ions that were formerly network modifiers; thehird step is characterized by hydrolysis of the network-formers ofhe tetrahedral framework of the obsidian glass structure, in com-etition with the previous stage. The formation of these hydrousilica species corresponds to a quasi-congruent dissolution of thelass. Until the leached species concentrations reach aqueous sat-ration levels, the glass dissolution rate will decrease as much ashe silica concentration in the solution increases. When saturations reached (SS layer Fig. 6A and section 5.2), the fourth step beginsnd it involves surface precipitation of hydrolyzed elements thatre less soluble (e.g. Si(IV), Al(III), Fe(III), Ti(IV), REE’s, and others)hat are encountered in many soils resulting from intense tropicaleathering (laterites) of primary endogenous rocks. During this
tage, a gel phase is formed at the obsidian/water interface, whichs highly hydrous and thus highly sensitive to dehydration. Withinoils, the gel will be exposed to concentration and redox gradientsnd temporal perturbations (among others) [33]. Non steady stateonditions will strongly affect these processes, particularly cyclicpisodes (such as those produced by seasonal variations), whichill induce the formation of layers at the glass surface. This evolu-
ion suggests that these steps are not well separated in time: theyll occur continuously.
Concerning the 16O/18O variation (Fig. 16b) along the diffusedayer of 2 �m we observe a change around an average value within
10%, and a slight drop in deeper layers by 20% in 2 microns. It isot clear at this stage the causes of this, and we suggest the formeright reflect palaeotemperatures during the archaeological period
nd the average is the effective hydration temperature sought inHD dating to estimate diffusion coefficient from Arrhenius plots
34]; and the former a fractionation effect due to temperature gra-ient of magma cooling in surface. Another possible explanation
s an isobaric interference, that this signal at m/z = 18 is related toydration and it is probably coming from H17O+ isotope or from2
16O+ signal. More work will clarify this.
1. Conclusion
New results highlight a linear correlation between the dis-ersion of the concentration values in the hydration profilesetermined by SIMS and the surface roughness obtained throughFM. Roughness ranges from some 3 nm up to 100 nm, togetherith cation profiling monitoring, are both of crucial importance as
hey introduce a solid criterion for assessing the reliability of SIMSnalyses of obsidians, given that roughness represents a criticalspect when dating archaeological glasses. In this framework, the
oughness experimental data obtained by AFM are extremely valu-ble, as they are not affected by the same effect of SIMS profiles, andhey can therefore be used to have a prior validation of SIMS dataor dating. Concluding, the results presented in this paper further
[
[
l Heritage 25 (2017) 101–112 111
confirm the criterion we previously introduced relying on the AFManalysis of the surface of obsidians prior to SIMS investigation.
The obsidian surface 2D and 3D mapping and cation along therind with quad-SIMS and ToF-SIMS explains the increased scatterof SIMS H+ profiles for obsidian SIMS-SS dating. The mapping of thesurface with ToF-SIMS prior to depth profile can be used to locateareas free of cracks, pits, troughs, shoulders or inclusions ensuring adepth profile of high accuracy. Measuring of hydration profile alongwith other elements (fluorine, magnesium, carbon) provided usefulinformation for the reliability of the SIMS H+ profile measurement,as well as, clues regarding ion exchange reactions and the environ-mental context leading to leaching or enrichment that alter surficialdynamic layers in the scale of few micrometers, that is in the rim,and all are useful data for OHD. In fact depth profiles of relative con-centrations of carbon (C), along with fluorine (F), aluminum (Al) andmagnesium (Mg), as well as, other cations measured on obsidiantools from archaeological sites indicated either leaching or enrich-ment, a distorted profile of constant or similar trend to H+ profile.The commensurate variation in disturbances between C and Mgindicates that in measuring a H+ depth profile in the hydration rimin obsidian, C and Mg must also be included in measurement andcompared to H+. The 2D surface mapping by TOF-SIMS indicatedcrystallites and cracks with increased hydrocarbons.
It is of interest that the S-like trend of the hydrogen (hydrationlayer) is also found for the silicon hydroxyl (Si OH) which rein-forces the diffusion–reaction model. The near surface leaching ofNa is due to trace element exchange with the burial environment.
Acknowledgements
N.L. and I.L. thank the director of NCSR “Demokritos” and thestaff for helping N.L. with the AFM measurements, Dr. StevenNovak (University at Albany, USA) for quad-SIMS measurementsand useful comments, Dr. Markus Terhorst of the ION-TOF for thefinancial support of the ToF-SIMS measurements. M.B. and F.R.thank CSGI and MIUR-PRIN 2010 for financial support. M.B. thanksthe EU for the financial support (FP7-PEOPLE-2009-RG, Project:SUPRACRYST). Ioannis Liritzis and Fahad Mutlaq Al-Otaibi extendtheir appreciation to the Deanship of Scientific Research at KingSaud University for funding the work through the research groupproject No. RGP-VPP-194.
References
[1] T. Drury, G. Roberts, Diffusion of water in silica Glass, Plenum Press, New York,1962, pp. 249–255.
[2] W. Lanford, Glass hydration: a method of dating glass objects, Science 196(1977) 975–976.
[3] M. Nogami, M. Tomozawa, Diffusion of water in high silica glasses at low tem-perature, Phys. Chem. Glasses 25 (1984) 82–85.
[4] R. Doremus, Diffusion of water in rhyolite Glass: diffusion-reaction model, J.Noncrystalline Solids 261 (2000) 101–107.
[5] I. Liritzis, Obsidian hydration dating, in: W.J. Rink, J.W. Thompson (Eds.), Ency-clopedia of scientific dating methods, Springer-Verlag, Berlin-Heidelberg, 2014,pp. 1–23, http://dx.doi.org/10.1007/978-94-007-6326-5 39-1.
[6] I. Liritzis, N. Laskaris, The SIMS obsidian hydration dating method (Ch. 3), in:The dating and provenance of obsidian and ancient manufactured glasses, NewMexico Press, 2012, pp. 26–45.
[7] I. Liritzis, N. Laskaris, Fifty years of obsidian hydration dating in archaeology, J.Noncrystalline Solids 357 (2011) 2011–2023.
[8] I. Liritzis, M. Bonini, N. Laskaris, Obsidian hydration dating by SIMS-SS: surfacesuitability criteria from atomic force microscopy, Surf. Interface Anal. 40 (2008)458–463.
[9] I. Liritzis, N. Laskaris, M. Bonini, Nano- and micro- scale resolution in ancientobsidian artefact surfaces: the impact of AFM on the obsidian hydration datingby SIMS-SS, Physica Status Solidi C 5 (2008) 3704–3707.
10] G. Binnig, C.F. Quate, C. Gerber, Atomic Force Microscope, Phys. Rev. Lett. 6 (9)(1986) 930–933.
11] I. Schmitz, T. Prohaska, G. Friedbacher, M. Schreiner, M. Grasserbauer, Investi-gation of corrosion processes on cleavage edges of potash-lime-silica glassesby atomic force miscroscopy, Anal. Bioanal. Chem. 353 (5–8) (1995) 666–669.
[rates among minerals and aqueous solutions: I. Theoretical considerations, Am.
12 N. Laskaris et al. / Journal of C
12] M. Schreiner, G. Woisetschlager, L. Schmitz, M. Wadsak, Characterisation of sur-face layers formed under natural enviromental conditions on medieval stained277 glass and copper alloys using SEM, SIMS and atomicforce microscopy, J.Anal. Atomic Spectrosc. 14 (1999) 395–403.
13] N. Carmona, A. Kowal, J. Rincon, M. Villegas, AFM assessment of the surfacenano/microstructure on chemical damaged historical and model glasses, Mater.Chem. Phys. 119 (2010) 254–260.
14] N. Zacharias, G. Mastrotheodoros, M. Katsiotis, N. Laskaris, Glazedpottery sur-faces under the microscope: which criteria to decide about archaeological andmodern items, in: 38th International Symposium on Archaeometry, Tampa,Florida, 2010.
15] M. Melcher, R. Wiesinger, M. Schreiner, Degradation of glass artifacts: appli-cation of modern surface analytical techniques, Acc. Chem. Res. 43 (6) (2010)916–926.
16] S. Novak, C. Stevenson, Aspects of SIMS depth profiling for obsidian hydra-tion dating, the dating and provenance of obsidian and ancient manufacturedglasses (Ch. 1), New Mexico Press, 2012.
17] A. Benninghoven, F. Rudenauer, H. Werner, Secondary ion mass spectrome-try: basic concepts, instrumental aspects, applications and trends, New York, J.Willey and Sons, 1987.
18] D. McPhail, M. Dowsett, Dynamic SIMS, in: Surface analysis – the principaltechniques, 2nd ed., John Wiley and Sons Ltd, 2009.
19] F. Stevie, P. Kahora, D. Simons, P. Chi, Secondary ion yield changes in Si and gasas due to topography changes during O2 or Cs+ ion bombardment, J. VaccumSci. Technol. (1988) 76–80.
20] P.V.D. Heide, M. Lim, S. Pery, J. Bennett, A systematic study of thesurface rough-ening and sputter rate variations occurring during SIMS ultra shallow depthprofile analysis of Si with Cs+, Nucl. Instrum. Methods Phys. Res. B 201 (2003)413425.
21] B. Fares, C. Dubois, B. Gautier, J. Dupuy, F. Cayrel, G. Gaudin, Afmstudy ofthe SIMS beam induced roughness in monocrystalline silicon in presence of
initial surface or bulk defects of nanometric size, Appl. Surf. Sci. 252 (2006)6448–6451.
22] K. Wittmaack, Towards the ultimate limits of depth resolution in sputter pro-filing: beam induced chemical changes and the importance of sample quality,Surf. Interface Anal. 21 (1994) 323–335.
[
l Heritage 25 (2017) 101–112
23] S. Patel, R. hedges, J. Kilner, Surface analysis of archaeological obsidian by SIMS,J. Archaeol. Sci. 25 (1998) 1047–1054.
24] A. Sampson, The cave of the Cyclops. Mesolithic and Neolithic networks in thenorthern Aegean, Greece, Vol. II, INSTAP Academic Press, Philadelphia, Penn-sylvania, 2011.
25] A. Sampson, The Neolithic and the Bronze Age, The Sarakenos Cave of Akraeph-nion, Boeotia, Greece. Vol. I, University of the Aegean and Polish Academy ofArts and Sciences, Athens, 2008.
26] I. Liritzis, N. Laskaris, Obsidian hydration dating from hydrogen profileusing SIMS: applications to Ikarian specimens, Folia Quaternaria 80 (2012)45–54.
27] F.J.M. Rutten, D. Briggs, J. Henderson, M.J. Roe, The application of time-of-flightsecondary ion mass spectrometry (TOF-SIMS) to the characterization of opaqueancient glasses, Archaeometry 51 (6) (2009) 966–986.
28] S.D. McLoughlin, R.J. Hand, N.C. Hyatt, W.E. Lee, I. Notingher, D.S. McPhail, et al.,The long term corrosion of glasses: analytical results after 32 years of burial atBallidon, Glass Technol. Eur. J. Glass Sci. Technol. A 47 (3) (2005) 59–67.
29] I. Liritzis, M. Diakostamatiou, C.M. Stevenson, S.W. Novak, J. Abdelrehim, Thedating of hydrated obsidian surfaces by SIMS-SS, J. Radioanal. Nucl. Chem. 261(1) (2004) 51–60.
30] I. Liritzis, N. Laskaris, Advances in obsidian hydration dating by secondary ionmass spectrometry: world examples, Nucl. Instr. Methods Phys. Res. B 267(2009) 144–150.
31] F. Farges, M.-P. Etcheverry, A. Haddi, P. Trocellier, E. Curti, G.E. Brown, Durabilityof silicate glasses: an historical approach SLAC-PUB-12221, in: Contributed to13th International Conference on x-ray absorption fine structure (XAFS13), July9-14, 2006, Stanford, California, 2006.
32] I. Liritzis, SIMS-SS A new obsidian hydration dating method: analysis and the-oretical principles, Archaeometry 48 (3) (2006) 533–547.
33] P. Aagard, H.C. Helgeson, Thermodynamic and kinetic constraints on reaction
J. Sci. 282 (1982) 237–285.34] A.T. Rogers, Field data validation of an algorithm for computing obsidian
effective hydration temperature, J. Archaeol. Sci. 35 (2) (2008) 441–447,http://dx.doi.org/10.1016/j.jas.2007.04.009.