Page 1
AFRICA CENTER OF EXCELLENCE
FOR WATER MANAGEMENT
ADDIS ABABA UNIVERSITY
GROUNDWATER RECHARGE ESTIMATION AND AQUIFER
CHARACTERIZATION.
A CASE STUDY OF WALGA CATCHMENT UPPER GIBE BASIN,
CENTRAL ETHIOPIA
BY
TEKALIGN WAKJIRA
ADVISOR : TILAHUN AZAGEGN (PHD)
A THESIS SUBMITTED TO:
AFRICA CENTER OF EXCELLENCE FOR WATER MANAGEMENT,
ADDIS ABABA UNIVERSITY
IN PARTIAL FULFILLMENT OF THE REQUIREMENTS FOR THE DEGREE
OF MASTERS OF SCIENCE IN WATER MANAGEMENT (HYDROLOGY
AND WATER RESOURCES)
ADDIS ABABA, ETHIOPIA
Nov, 2020
Page 2
AFRICA CENTER OF EXCELLENCE FOR WATER MANAGEMENT
ADDIS ABABA UNIVERSITY
GROUNDWATER RECHARGE ESTIMATION AND AQUIFER
CHARACTERIZATION. A CASE STUDY OF WALGA CATCHMENT UPPER GIBE
BASIN, CENTRAL ETHIOPIA
BY
TEKALIGN WAKJIRA
GSR/5584/11
A thesis submitted to:
Africa Center of Excellence for Water Management, Addis Ababa University
in partial fulfillment of the requirements for the degree of masters of science in water
management (Hydrology and Water Resources)
Addis Ababa, Ethiopia
Nov, 2020
Page 3
Groundwater Recharge estimation and Aquifer Characterization of Walga Catchment, Upper Gibe basin, Central Ethiopia
Tekalign Wakjira Hydrology and Water Resources Page i
AFRICA CENTER OF EXCELLENCE FOR WATER MANAGEMENT
ADDIS ABABA UNIVERSITY
This is to certify that, thesis prepared by TEKALIGN WAKJIRA YADETA, entitled:
“Groundwater recharge estimation and aquifer characterization”. A case study of Walga
catchment, central Ethiopia, upper Gibe basin and submitted in partial fulfillment of the
requirements for the degree of Masters of Science in water management (Hydrology and Water
Resources) complies with the regulations of the University and meets the accepted standards with
respect to the originality and quality.
Signed by the Examining committee:
Examiner
Dessie Nedaw (PhD) Signature____________ Date ______________
____________________ Signature____________ Date ______________
Advisor
Tilahun Azagegn (PhD) Signature____________ Date ______________
Co-Advisor
____________________ Signature____________ Date ______________
Chairperson
____________________ Signature____________ Date ______________
Page 4
Groundwater Recharge estimation and Aquifer Characterization of Walga Catchment, Upper Gibe basin, Central Ethiopia
Tekalign Wakjira Hydrology and Water Resources Page ii
DECLARATION
I, the undersigned, declare that this thesis is my original work, has not been presented for a degree
in any other university and that all sources of material used in this thesis have been duly
acknowledged.
Name Signature Date
Tekalign Wakjira ____________ 23/11/2020
(Africa Center of Excellence
For Water Management)
Page 5
Groundwater Recharge estimation and Aquifer Characterization of Walga Catchment, Upper Gibe basin, Central Ethiopia
Tekalign Wakjira Hydrology and Water Resources Page ii
Abstract
Groundwater is mainly used for irrigation and water supply in Walga catchment as other parts of
the country. The main objective of this study is to quantify the amount of groundwater recharge
using WetSpass model and characterization of aquifers using Aquifer test in the upper Omo-Ghibe
basin of Walga catchment. Meteorological data like rainfall, wind speed, temperature, relative
humidity, sunshine hours were collected from meteorological stations located within the catchment
and nearby area. Potential evapotranspiration was calculated using Penman-Montieth based FAO
CROPWAT software. Slope and topography map were generated from Shuttle Radar Topographic
Mission elevation data while Land use land cover were prepared from Landsat OLI8 satellite
images downloaded from United States Geological Earth Explorer. Parameter table (dbf data) and
grid maps were prepared for WetSpass model input with the help of ArcMap 10.4. Using the model
the mean annual recharge of the catchment was found to be 7.5% of the precipitation whereas
surface runoff was 38.25% of the annual precipitation. The aquifer hydraulic properties were
estimated from the pumping test by fitting mathematical models (type curves) to response data
(water level changes) through computer software known as AQUIFER TEST. Yield or discharge
of bore holes values range from 0.15 l/sec. to 61 l/sec, whereas Transmissivity ranges from 3.5
x10-4 m2/day to 290 m2/day with an average of 50.94 m2/day. Hydraulic conductivity values ranges
from 0 to 16.04 m/se with mean values of 1.2 m/s. The sum of the yield from 72 boreholes is 430
l/s (119.4 m3/hr), this gives a total of 37152000 liters per day. 65.8% of Walga catchment coverage
is under Satisfactory ground water potential while 0.72% is classified under very good
groundwater potential. The mean descriptive statics value of groundwater quality of Walga
catchment is below WHO limit and also good for irrigation water quality. The study area is
characterized by lowest groundwater recharge relative to surface runoff and actual
evapotranspiration due to effect of impermeable soils, morphology of the land and land use land
cover of the area. The lowest transmissivity value is indicative of the poor permeability in the
pyroclastic lithologic formations and low discharge to wells. It also implies that it will take a
considerable time for the aquifers to replace water into wells removed during pumping.
Key Words: Walga catchment; WetSpass; Groundwater recharge, Aquifer characterization,
Page 6
Groundwater Recharge estimation and Aquifer Characterization of Walga Catchment, Upper Gibe basin, Central Ethiopia
Tekalign Wakjira Hydrology and Water Resources Page iii
Acknowledgement
My deepest gratitude tends to my advisor Tilahun Azagegn (PhD), for his unreserved advice,
support and guidance to the completion of this research.
I would like to thanks South West Shoa Zone Irrigation Development Authority for their kindness
of facilitating and sponsoring me in following my education. Although I express my warmest
gratitude to Mr Biniam Yosef (ECDSWC) for his generosity in acquiring me necessary data and
Ashebir Gebre (ECDSWC) and Tsegaye (WVE) helping me with fundamental idea during the
development of WetSpass model.
Staff of ACEWM, friends and other people who helped me a lot in one way or the other for the
completion of this research work are never forgotten.
I am grateful to Hard Rock Drilling and Engineering P.L.C, South West Shoa Zone Water
Resource Development and Energy office, National Meteorological agency, Ethiopian
Construction Design and Supervision Works Corporation and other private firms and individuals,
for their great contribution in providing me valuable data.
I have no words to express my feelings which I have for my family; especially my wife Kumeshi
Degefa for her prayer, encouragement and support which gave me strength to carry out the present
research study and my deepest love also goes to my sons Firisa and Wasingitan.
Page 7
Groundwater Recharge estimation and Aquifer Characterization of Walga Catchment, Upper Gibe basin, Central Ethiopia
Tekalign Wakjira Hydrology and Water Resources Page iv
TABLE OF CONTENTS
Figures........................................................................................................................................... vii
Tables ........................................................................................................................................... viii
List of Abreactions .......................................................................................................................... x
CHAPTER ONE
1. INTRODUCTION ................................................................................................................... 1
1.1. Background........................................................................................................................................ 1
1.2. Statement of the Problem .................................................................................................................. 2
1.3. Objectives .......................................................................................................................................... 3
1.3.1. General Objectives .................................................................................................... 3
1.3.2. Specific Objectives ................................................................................................... 3
1.4. Significance of the Study ................................................................................................................... 4
1.5. Scope and Limitation of the Study .................................................................................................... 4
1.6. Structure of the thesis ........................................................................................................................ 4
CHAPTER TWO
2. LITERATURE REVIEW ........................................................................................................ 6
2.1. Concepts of Groundwater Recharge .................................................................................................. 6
2.1.1. Groundwater Recharge estimation techniques.......................................................... 7
2.1.2. Factors that Affect Groundwater Recharge .............................................................. 7
2.2. WetSpass Modeling Method ............................................................................................................. 8
2.3. Aquifer Characterization ................................................................................................................. 10
2.3.1. Aquifer Hydrogeological Characterization Techniques ......................................... 12
2.4. GIS and RS Techniques and AHP analysis ..................................................................................... 12
2.5. Groundwater and Surface Water Quality ........................................................................................ 14
2.6. Estimation of Missing Data ............................................................................................................. 15
CHAPTER THREE
3. DESCRIPTION OF THE STUDY AREA ............................................................................ 17
3.1. Location ……………………………………………………………………………………………17
3.2. Physiography ................................................................................................................................... 18
3.3. Climate………………………………………………………………………………………….19
3.4. Geology and Hydrogeology............................................................................................................. 20
3.4.1. Regional Geology ................................................................................................... 20
Page 8
Groundwater Recharge estimation and Aquifer Characterization of Walga Catchment, Upper Gibe basin, Central Ethiopia
Tekalign Wakjira Hydrology and Water Resources Page v
3.4.2. Local Geology and Structure .................................................................................. 22
3.5. Hydrogeology of the Area ............................................................................................................... 22
3.6. Drainage system ............................................................................................................................... 24
CHAPTER FOUR
4. MATERIALS AND METHODS .......................................................................................... 26
4.1. Methodology and Techniques ......................................................................................................... 26
4.2. WetSpass Modeling ......................................................................................................................... 28
4.2.1. WetSpass Input Data ............................................................................................... 30
4.3. Aquifer characterization .................................................................................................................. 40
4.4. Groundwater potential evaluation ................................................................................................... 45
4.4.1. Preparation of thematic maps using GIS and RS .................................................... 46
4.4.2. Groundwater Potential Zone ................................................................................... 51
4.5. Groundwater quality/ Hydro-geochemistry ..................................................................................... 52
4.5.1. Laboratory result data Collection and Analysis ...................................................... 53
4.5.2. Phsico-chemical Analysis ....................................................................................... 54
4.5.3. Drinking water Quality Variations.......................................................................... 56
4.5.4. Irrigation water quality ........................................................................................... 59
CHAPTER FIVE
5. RESULTS AND DISCUSION .............................................................................................. 62
5.1. Hydro-meteorological data analysis ................................................................................................ 62
5.1.1. Rainfall .................................................................................................................... 62
5.1.2. Temperature ............................................................................................................ 63
5.1.3. Wind Speed ............................................................................................................. 64
5.1.4. Potential evapotranspiration.................................................................................... 64
5.1.5. Groundwater depth.................................................................................................. 64
5.2. Output of the WetSpass model ........................................................................................................ 66
5.2.1. Actual evapotranspiration ....................................................................................... 66
5.2.2. Surface runoff ......................................................................................................... 68
5.2.3. Groundwater recharge ............................................................................................. 69
5.3. Aquifer Characterization ................................................................................................................. 72
5.4. Groundwater potential evaluation ................................................................................................... 73
5.4.1. Criteria weights and map scores ............................................................................. 73
Page 9
Groundwater Recharge estimation and Aquifer Characterization of Walga Catchment, Upper Gibe basin, Central Ethiopia
Tekalign Wakjira Hydrology and Water Resources Page vi
5.4.2. Groundwater potential zoning map ......................................................................... 76
5.5. Groundwater Quality ....................................................................................................................... 76
5.5.1. Dinking water.......................................................................................................... 76
5.5.2. Irrigation water quality ........................................................................................... 78
Classification of groundwater ................................................................................................................. 79
CHAPTE SIX
6. CONCLUSION AND ECOMMENDATION ....................................................................... 80
6.1. Conclusion ....................................................................................................................................... 80
6.2. Recommendations ........................................................................................................................... 81
Bibliography ................................................................................................................................. 82
Page 10
Groundwater Recharge estimation and Aquifer Characterization of Walga Catchment, Upper Gibe basin, Central Ethiopia
Tekalign Wakjira Hydrology and Water Resources Page vii
FIGURES
Figure 1. Schematic WB of an hypothetical raster cell (after O.Betelaan and D.Smelt 2007) ..................... 9
Figure 2. Location map of the Study Area .................................................................................................. 17
Figure 3. a) Elevation .................................................................................................................................. 18
Figure 4. Spatial distribution of rainfall ...................................................................................................... 19
Figure 5-. Mean monthly Rainfall (1997-2018 ) ......................................................................................... 19
Figure 6. Geological formation of the study area (modified from ATA map, 2013) .................................. 21
Figure 7. Hydrogeological map of the area (Source ATA map) ................................................................. 23
Figure 8. Drainage System of Walga watershed. ........................................................................................ 24
Figure 9. Methodological Flow Chart ......................................................................................................... 27
Figure 10. a) Mean monthly precipitation b) Mean Annual precipitation ............. 31
Figure 11. Summer and Winter precipitation map of Walga watershed ..................................................... 32
Figure 12. a)Long term mean monthly temperature b)Annual mean temperature of each station ............ 32
Figure 13. Summer and Winter average Temperature of Walga catchment ............................................... 33
Figure 14. Summer and Winter average wind speed map of Walga catchment ......................................... 33
Figure 15. a) Annual PET b) Summer PET and c) Winter PET of walga catchment ................................ 34
Figure 16. Land Use Land Cover of Walga watershed ............................................................................... 36
Figure 17. Soil map of Walga catchment (Source: MoWEI) ...................................................................... 37
Figure 18. a) Groundwater depth and its contour map .............................................................................. 38
Figure 19. Slope and Elevation map of the study area ................................................................................ 39
Figure 20. Spatial distribution of groundwater discharge using IDW of study area ................................... 41
Figure 21. Spatial distribution of specific capacity using IDW ................................................................. 42
Figure 22. Spatial distribution of Transmissivity using in Walga............................................................... 43
Figure 23. Spatial distribution of Hydraulic Conductivity of Study area ................................................... 44
Figure 24. Reclassified annual precipitation of Walga catchment .............................................................. 47
Figure 25. Reclassified slope ...................................................................................................................... 48
Figure 26. Reclassified Drainage Density map ........................................................................................... 49
Figure 27. Groundwater potential zone ....................................................................................................... 51
Figure 28. Bio-statistical representations of phsio-chemical parameters .................................................... 54
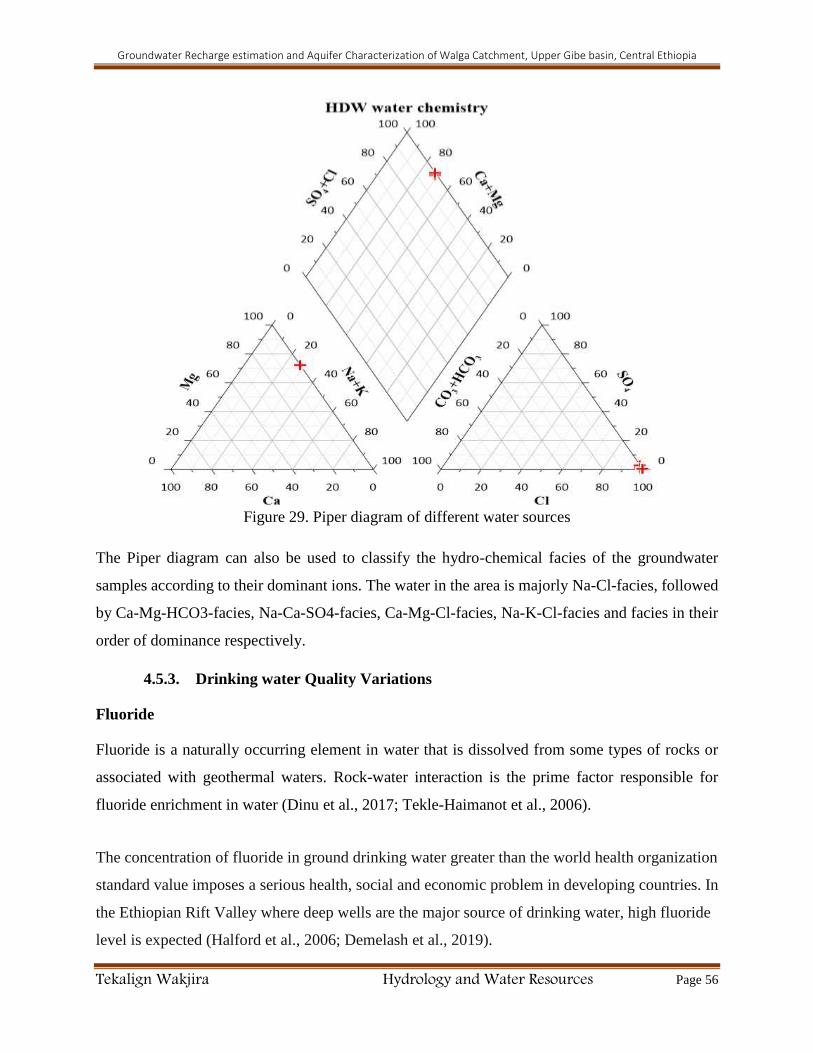
Figure 29. Piper diagram of different water sources ................................................................................... 56
Figure 30. Spatial distribution of Fluoride concentration ........................................................................... 57
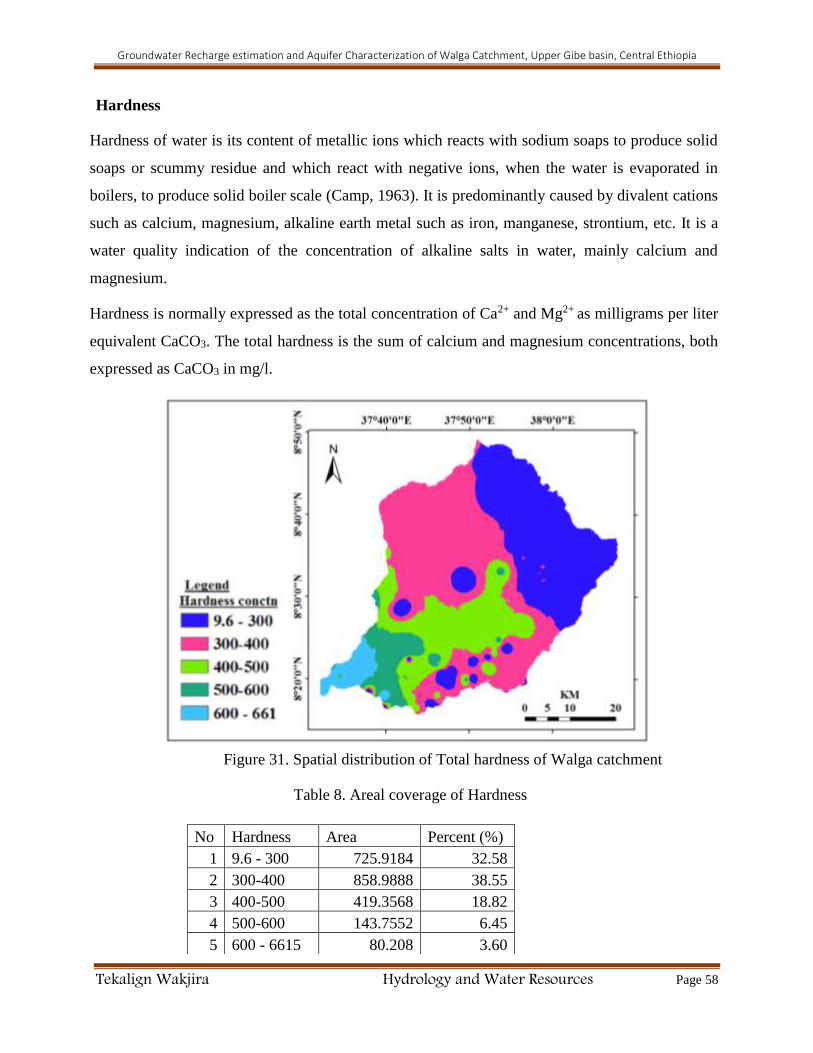
Figure 31. Spatial distribution of Total hardness of Walga catchment ....................................................... 58
Figure 32. Spatial distribution of SAR values of the stud area ................................................................... 59
Figure 33.Spatial distribution of EC ........................................................................................................... 60
Figure 34. Spatial distribution of sodium % ............................................................................................... 60
Figure 35. Spatial distribution of Alkalinity in mg/l of CaCO3 .................................................................. 61
Figure 36. Spatial distribution of TDS ........................................................................................................ 61
Figure 37. Annual average rainfall ............................................................................................................. 62
Figure 38. Monthly min, max and Average Temperature ........................................................................... 63
Figure 39. Depth to groundwater table ....................................................................................................... 65
Figure 40. Summer, Winter and Annual AET of Walga catchment ........................................................... 67
Figure 41. Summer, Winter and Annual Surface runoff ............................................................................. 68
Figure 42. Summer, Winter and Annual Walga recharge ........................................................................... 70
Figure 43. Principal Eigen value and CR .................................................................................................... 75
Page 11
Groundwater Recharge estimation and Aquifer Characterization of Walga Catchment, Upper Gibe basin, Central Ethiopia
Tekalign Wakjira Hydrology and Water Resources Page viii
TABLES
Table 1. Mean monthly Rainfall of Walga meteorological stations ............................................. 20
Table 3. Land use/Land cover of Walga catchment ..................................................................... 35
Table 4. Areal coverage of soil texture ......................................................................................... 37
Table 5. Input data of WetSpass model and description ............................................................... 39
Table 6. Scale of Relative importance .......................................................................................... 46
Table 7. Descriptive statics of water quality parameters with WHO standards ......................... 53
Table 8. Areal coverage of Fluoride ............................................................................................. 57
Table 9. Areal coverage of Hardness ............................................................................................ 58
Table 10. Areal distribution of EC ................................................................................................ 61
Table 11. Irrigation water quality evaluation based on EC and SAR ........................................... 61
Table 12.Summary of annual water balance components ............................................................ 71
Table 13. Summary of aquifer properties ..................................................................................... 72
Table 14. Relative weight and ranks of criteria ............................................................................ 74
Table 15. Paired comparison matrix ............................................................................................. 75
Table 16. Area coverage of groundwater potential zone .............................................................. 76
Page 12
Groundwater Recharge estimation and Aquifer Characterization of Walga Catchment, Upper Gibe basin, Central Ethiopia
Tekalign Wakjira Hydrology and Water Resources Page ix
List of Annexes
Annex 1: Mean monthly annual rainfall of Walga catchment ...................................................... 87
Annex 2: Chemical parameters of DBH, SBH, HDW and MBH ................................................. 88
Annex 3: Hydrogeological parameters ......................................................................................... 95
Annex 4.. Summer Land Use parameters ................................................................................... 100
Annex 5. Winter Land Use parameters ....................................................................................... 100
Annex 6. Annual and Seasonal Water balance components ....................................................... 100
Page 13
Groundwater Recharge estimation and Aquifer Characterization of Walga Catchment, Upper Gibe basin, Central Ethiopia
Tekalign Wakjira Hydrology and Water Resources Page x
List of Abreactions
A.S.L Above Sea Level
ATA Agricultural Transformation Agency
AHP Analytical Hierarchy Process
CMB Chloride Mass Balance
Dbf Database file
DEM Digital Elevation Model
ECDSWC Ethiopian Construction Design and Supervision Works Corporation
GPR Ground Penetrating Radar
GWR Groundwater Recharge
HDW Hand Dug Well
MCDA Multi criteria decision analysis
MWIE Ministry of Water Irrigation and Energy
OLI/TIRS Operational Land Imager and Thermal Infrared Sensor
SMBM Soil Moisture Balance Method
SNNP Southern Nation, Nationalities and Peoples Representative
SRTM Shuttle Radar Topographic Mission
SWSZWREO South west shoa zone water resource and energy office
WetSpass Water and Energy Transfer between Soil, Plants and Atmosphere under
quasi-Steady State
WTWSSE Woliso Town Water Supply and Sewerage Enterprise
Page 14
Groundwater Recharge estimation and Aquifer Characterization of Walga Catchment, Upper Gibe basin, Central Ethiopia
Tekalign Wakjira Hydrology and Water Resources Page 1
CHAPTER ONE
1. INTRODUCTION
1.1.Background
Much of the world’s population lives in places where demand for water exceeds supply, or poor
quality limits its use. Scarcity of water and inequities in access, use, and decision-making can
threaten life itself, diminish the quality of life, and impede integral human development. Water
scarcity and inequities are also risk factors for violent conflict. Water-related violence is already
common in many parts of the world and is generally expected to increase in the years ahead
(Hamerlynck, 2013).
Groundwater is a main source for industries, communities and agricultural consumptions in the
world and due to its freshness, chemical compounds, constant temperature, lower pollution
coefficient and higher reliability level, it is considered as a basic source of supplying reliable fresh
water in urban and rural areas (Zeinolabedini & Esmaeily, 2015).
The recharge boundary of a groundwater circulation system is a permeable boundary with a
specified hydraulic head, with water flowing into the system under natural conditions or ones
affected by its exploitation (Hoque & Burgess, 2012). The conceptual model of the groundwater
recharge process accounts for identifying the scale of the hydrological process, the inlets and
outlets of the water circulation system as well as its temporal and spatial limitations, such as an
area’s infiltration predisposition and the type or character of a hydrological active zone (Yair &
Kossovsky, 2002).
Quantification of the rate of natural ground water recharge (Eilers et el., 2017) is a basic pre-
requisite for efficient ground water resource management (Goulburn-Murray, 2010). It is
particularly important in regions with large demands for ground water supplies, where such
resources are the key to economic development. However, the rate of aquifer recharge is one of
the most difficult factors to measure in the evaluation of groundwater resources. The advent of
Geographic Information Systems (GIS), physical-based hydrologic modeling, enabled to address
some of the problems (Dereje & Nedaw, 2019).
Page 15
Groundwater Recharge estimation and Aquifer Characterization of Walga Catchment, Upper Gibe basin, Central Ethiopia
Tekalign Wakjira Hydrology and Water Resources Page 2
Walga catchment is the area of increasing competitive demand of water for agriculture and water
supply. Groundwater recharge study of the area has not been based on physically varying
methodology of estimating long tem average. WetSpass, a GIS based model, was built as a
physically based methodology for estimation of the long-term average, spatially varying, water
balance components: surface runoff, actual evapotranspiration and groundwater recharge
(Batelaan & De Smedt, 2007). By using long-term average standard hydro-metrological
parameters as input, the model simulates the temporal average and spatial differences of surface
runoff, actual evapotranspiration, and groundwater recharge of Walga catchment.
Pumping test was used to determine the performance and efficiency of a well and also to
characterize and parameterize the hydraulic properties of an aquifer in Walga catchment. The
Cooper Jacob’s Straight-line Equation was used to analyze the pumping test results of drawdown
with respect to time. The aquifer hydraulic properties was estimated from the pumping test by
fitting mathematical models (type curves) to response data (water level changes) through computer
software known as AQUIFER TEST (Ita et al., 2018).
Thus, estimation of groundwater recharge and Hydrogeological characterization of aquifer in
Walga watershed has its own role in solving the problems related to the management and planning
of water resources for sustainable development using WetSpass model.
1.2. Statement of the Problem
Groundwater is one of the major resource of water for various purposes in urban and rural areas
of Walga catchment as other parts of Ethiopia. It is the largest area where groundwater is abstracted
for Woliso, Wolkite, Wonchi, Goro, Gindo town and surrounding rural community. The demand
of groundwater for water supply, and agriculture is increasing from time to time in this study area.
Water resource management faces specific challenges in the area due to; intense competition
among upstream and downstream users, among different types of use, communities interest of
using water exceeding supply and absence of groundwater potential area identification. Walga
River is shared among eight woredas of Oromia Regional State (Ameyya Woliso, Wanchi, Goro ,
Ambo, Dawo, Tiku Inchini and Dendi) and partly two woreda of SNNP (Abeshege and Kebena).
Page 16
Groundwater Recharge estimation and Aquifer Characterization of Walga Catchment, Upper Gibe basin, Central Ethiopia
Tekalign Wakjira Hydrology and Water Resources Page 3
Due to over use of this River and its tributaries, scarcity of water and inequities in access, use, and
decision-making can threaten and diminish the quality of life, and impede integral human
development.
There increasing competitive demand of water resources for domestic, agricultural & other
purposes in the area is due to rapid population growth along with increasing living standard,
intensified irrigation agriculture & other developmental activities like Ecotourism. This indicate
the need for efficient utilization through further investigation of the water resources potential,
particularly the groundwater.
Hydrological models, WetSpass with the help of GIS and remote-sensing techniques was used in
Walga catchment to quantify amount of groundwater recharge based on qualitative and
quantitative hydrogeological parameters. Characterizing the aquifer type and properties,
identifying groundwater quality variations and mapping groundwater potential of the area has its
own role in solving the problems related to the management and planning of water resources for
sustainable development.
1.3. Objectives
1.3.1. General Objectives
The objective of this study was to estimate spatial distribution and long term average groundwater
recharge, characterization of the aquifer system, determining groundwater potential and
groundwater quality variations of Walga Watershed.
1.3.2. Specific Objectives
The primary objectives were achieved through the following sub-objectives;
To estimate groundwater recharge using physically based methodology
Characterizing aquifers using Hydrogeological parameters
To determine groundwater potential using weighted overlay analysis.
To determine Physio-chemical parameters and groundwater quality variations using
result of laboratory analysis.
Page 17
Groundwater Recharge estimation and Aquifer Characterization of Walga Catchment, Upper Gibe basin, Central Ethiopia
Tekalign Wakjira Hydrology and Water Resources Page 4
1.4. Significance of the Study
The findings of this study has identified the water budget of Walga catchment. The long term
spatially and temporally distributed groundwater recharge, actual evapotranspiration and surface
runoff of this catchment was estimated. The groundwater potential of Walga catchment, the
hydrogeological parameters of aquifers, hydro-geochemistry of water were the outputs of this
research. In general, the research is helpful for the planners and administrator to manage the
resource properly and for their future plans of using groundwater and surface water wisely. The
new data gathered will also enable the researchers interested to do on contaminant transport
modeling, steady and unsteady groundwater flow modeling and related topics in the area and
surrounding.
1.5. Scope and Limitation of the Study
The study has focused on Walga catchment Upper Omo-Gibe Basin, located in central Ethiopia
115km from Addis Abba having an area of 2228 km2 bounded with Beda kero, Dase Jabo,
Wonchi-Dendi and Roge mountains from the NE, N,NW and Guraghe mountain from the
Southern direction respectively. WetSpass, ArcGIS, Global mapper, Surfer, Aquifer test 9.0 and
Grapher 14 are software’s that was applied for the success of this research. The study also included
geology, hydrogeology, Hydro-geochemistry, meteorology and Hydrology. Missing data of
meteoroidal data, budget for water sample, soil sample laboratory analysis, absence of
groundwater monitoring data and spread of COVID-19 were the main problems in this research.
1.6.Structure of the thesis
The thesis is organized into six chapters. In the first chapter, the introduction part of the thesis that
includes research issues related to groundwater recharge and aquifer characterization, statement of
the problem and the objectives are presented.
In the second Chapter, the literature review related to the principle of groundwater modeling and
recharge estimation techniques, aquifer characterization techniques, groundwater potential
mapping, surface and groundwater chemistry and groundwater management are discussed.
Third chapter contains description of the study area. It also includes detail study area location,
climate, geology, hydrogeology and drainage system of the area.
Page 18
Groundwater Recharge estimation and Aquifer Characterization of Walga Catchment, Upper Gibe basin, Central Ethiopia
Tekalign Wakjira Hydrology and Water Resources Page 5
The fourth chapter is more about materials and methods. Hydro-meteorological data needed for
WetSpass modeling, hydrogeological data for aquifer characterization, GIS and RS raster map for
groundwater potential mapping and hydrochemical data for groundwater chemistry variation are
described.
Fifth chapter is result and discussion of WetSpass out puts, aquifer characteristics, groundwater
potential and groundwater quality variations.
Finally, the last chapter is conclusion and recommendation
Page 19
Groundwater Recharge estimation and Aquifer Characterization of Walga Catchment, Upper Gibe basin, Central Ethiopia
Tekalign Wakjira Hydrology and Water Resources Page 6
CHAPTER TWO
2. LITERATURE REVIEW
2.1. Concepts of Groundwater Recharge
Groundwater recharge is the amount of water that flows by gravity, through the soil beyond the
reach of the surface vegetation ultimately reaching the saturated zone, i.e. an aquifer, through the
processes of vertical percolation or seepage. This water is then discharged to a stream as base flow,
unless it feeds natural springs or is withdrawn by wells for human use. Unlike precipitation and
direct runoff, groundwater recharge is nearly impossible to measure directly. It is difficult because
groundwater recharge depends not only on precipitation but also on meteorological conditions, as
well as on soil type, land surface slope, soil-moisture status, vegetation cover and condition,
cultivation practices, and most of all, on evapotranspiration, which is a function of the previously
noted factors (Erickson & Stefan, 2008).
A lot of researchers has given different definition for groundwater recharge. It can be defined as
an addition of water to a groundwater reservoir (Dhar et al., 2014). The four main modes of
recharge distinguished are; downward flow of water through the unsaturated zone reaching the
water table, lateral and/or vertical inter-aquifer flow, induced recharge from nearby surface water
bodies resulting from groundwater abstraction and artificial recharge such as from borehole
injection or man-made infiltration ponds (Lorentz, & Hughes, 2003).
Naranjo et al., (2015), also defined; recharge is a complex natural phenomenon and one of the
most difficult hydrological variables to measure and/or estimate considering the unavoidable
simplifications to calculate it; wide temporal and spatial variability; paucity of observations; gaps
in data series; and lack of measurements of the hydraulic parameters needed to apply recharge
calculation codes and models.
Groundwater recharge can be either a natural or an artificial process. The natural recharge occurs
when it stems from the direct infiltration of rainfall or from the water percolation of adjacent water
bodies, and the artificial recharge when it is induced by human activity such as irrigation,
urbanization, construction of injection boreholes or river spreading. Depending on the route
followed by percolating water towards the water table, recharge can be classified as direct recharge
Page 20
Groundwater Recharge estimation and Aquifer Characterization of Walga Catchment, Upper Gibe basin, Central Ethiopia
Tekalign Wakjira Hydrology and Water Resources Page 7
when talking about diffuse infiltration of recharge water towards groundwater, or as indirect
recharge when along river and other main channels (Pollution & Recharge, 2015).
2.1.1. Groundwater Recharge estimation techniques
There are many techniques available for quantifying groundwater recharge as there are different
sources and processes of recharge. Each of the methods has its own limitations in terms of
applicability and reliability. The objective of the recharge study should be known prior to selection
of the appropriate method for quantifying groundwater recharge as this may dictate the required
space and time scales of the recharge estimates (Scanlon et al., 2002). According to them,
techniques for estimating recharge are subdivided into various types, on the basis of the three
hydrologic sources, or zones, from which the data are obtained, namely surface water, unsaturated
zone, and saturated zone.
Chloride Mass Balance, Stable Isotopes (Rushton, 1991), Soil Moisture Balance Method (SMBM),
Water table fluctuation method (Eilers et al., 2017) and WetSpass modeling method ((Batelaan &
De Smedt, 2001; Hasanuzzaman et al., 2017; Teklebirhan et al., 2012) are among techniques
widely utilized for recharge estimation.
2.1.2. Factors that Affect Groundwater Recharge
Rukundo & Doğan,( 2019) has identified, groundwater recharge is affected by many parameters
and complex processes which themselves are influenced by many factors. Precipitation is affected
by climatic factors such as wind and temperature, resulting in complex and dynamic distributions
while the intensity and spatial distribution of precipitation influences the amount of recharge.
According to them, large scale vegetation determines the amount of net rainfall, infiltration rate,
deep drainage and the available storage capacity of the groundwater system. Any change in
vegetation, say from forest to grassland can have a large effect on recharge. The nature of land
cover has a big influence on recharge and hence groundwater recharge modelling should not
assume that vegetation is a constant factor. For example, the removal of the indegenious vegetation
in large parts of south eastern australia more than 100 years ago caused a significant increase in
groundwater recharge.
Vegetation influences recharge through interception and transpiration. The amount of stored water
that can be removed by vegetation depends mainly on the rooting depth. Shallow rooted grasses
Page 21
Groundwater Recharge estimation and Aquifer Characterization of Walga Catchment, Upper Gibe basin, Central Ethiopia
Tekalign Wakjira Hydrology and Water Resources Page 8
will remove less water than deepen rooted shrubs and trees (Jyrkama, 2007). It is well known that
the degree of water saturation of the root zone determines the distribution of hydraulic conductivity
and as a result the percolation to the groundwater table. It also influences the water uptake by roots
and thus the actual evapotranspiration (Brendchet, 2004).
2.2. WetSpass Modeling Method
A number of studies have been conducted on groundwater recharge using WetSpass model in
Ethiopia. Meresa & Taye, ( 2018) has estimated long tem average annual and seasonal groundwater
recharge for Birki watershed in Northern Ethiopia and identified as there is high groundwater
recharge value and Evapotranspiration with low runoff in the watershed. Another study by
Teklebirhan et al., ( 2012) estimated the distributed groundwater recharge, surface runoff and
evapotranspiration amount of Ilala sub basin, Northern Ethiopia using WetSpass modeling method.
They have characterized the watershed by low groundwater recharge due to the presence of high
evapotranspiration rate associated with high temperature, dry wind, low rainfall and relative
humidity. Yenehun et al., (2017) have used WetSpa to study the spatial and temporal variation of
recharge in the Geba basin, Northern Ethiopia. They have identified, groundwater recharge
spatially varies and mainly controlled by the distribution of rainfall amount, followed by soil and
land-use, and to a certain extent, slope.
According to Tilahun & Merkel, (2009), the amount of recharge they have investigated using
WetSpass model is less than what was previously thought and informed the future groundwater
development and management in the area to take this into account. Recharge was estimated using
physically based distributed recharge model called WetSpass in Upper Bilate. The study revealed
that the groundwater recharge estimation using WetSpass model is reasonable and useful for
quantification of annual groundwater recharge with spatial and seasonal variation and also capable
in the identification of groundwater recharge zones in the area under study (Dereje & Nedaw,
2019).
One of the main challenges in groundwater recharge estimation is accurately estimating its
distributed values in a hydrologically and geographically variable catchment. According to Dereje
& Nedaw, (2019); Teklebirhan et al., (2012), the advent of Geographic Information Systems
(GIS), physical-based hydrologic modeling, enabled to address some of the problems. WetSpass
was built as a physically based methodology for estimation of the long-term average, spatially
Page 22
Groundwater Recharge estimation and Aquifer Characterization of Walga Catchment, Upper Gibe basin, Central Ethiopia
Tekalign Wakjira Hydrology and Water Resources Page 9
varying, water balance components: surface runoff, actual evapotranspiration and groundwater
recharge (Batelaan & De Smedt, 2007). It is an acronym for water and energy transfer between
soil, plants and atmosphere under quasi-steady state that was built upon the foundations of the time
dependent spatially distributed water balance model (Batelaan & De Smedt, 2001).
Regional groundwater models used for analyzing groundwater systems (infiltration–discharge
relations) are often quasi-steady state and therefore need long-term average recharge input. On the
other hand, the spatial variation in the recharge due to distributed land-use, soil type, slope, depth
to groundwater , meteorological conditions, etc. can be significant and should be accounted.
Hence, WetSpass was built as a physically based methodology for estimation of the long-term
average spatial patterns of surface runoff, actual evapotranspiration and groundwater recharge.
The model is especially suitable for studying long-term effects of land-use changes on the water
regime in a basin. The total water balance, per raster cell and season, can now be calculated using
the previously described water balance components for vegetated, bare-soil, open-water and
impervious parts of a raster cell.
𝐸𝑇𝑟𝑎𝑠𝑡𝑒𝑟 = 𝑎𝑣𝐸𝑇𝑉 + 𝑎𝑠𝐸𝑆 + 𝑎𝑜𝐸𝑂 + 𝑎𝑖𝐸𝑖
𝑆𝑟𝑎𝑠𝑡𝑒𝑟 = 𝑎𝑣 𝑆𝑣 + 𝑎𝑆𝑆𝑆 + 𝑎𝑜𝑆𝑂 + 𝑎𝑖𝑆𝑖
𝑅𝑟𝑎𝑠𝑡𝑒𝑟 = 𝑎𝑣 𝑅𝑣 + 𝑎𝑆𝑅𝑆 + 𝑎𝑜𝑅𝑂 + 𝑎𝑖𝑅𝑖
Where 𝐸𝑇𝑟𝑎𝑠𝑡𝑒𝑟, 𝑆𝑟𝑎𝑠𝑡𝑒𝑟 and 𝑅𝑟𝑎𝑠𝑡𝑒𝑟 are respectively, the total evapotranspiration, surface runoff
and recharge in a raster cell. 𝑎𝑣 , 𝑎𝑆 , 𝑎𝑜 and 𝑎𝑖 are respectively the vegetated, bare-soil, open-
water and impervious area fractions of a raster cell (Batelaan & De Smedt, 2001).
Figure 1. Schematic WB of an hypothetical raster cell (after O.Betelaan and D.Smelt 2007)
Page 23
Groundwater Recharge estimation and Aquifer Characterization of Walga Catchment, Upper Gibe basin, Central Ethiopia
Tekalign Wakjira Hydrology and Water Resources Page 10
2.3.Aquifer Characterization
Bodies of saturated rocks or geological formations through which volumes of water find their way
(permeability) into wells and springs is studied by (Yu et al., 2012). Shekhar (2017) has identified
aquifer: it is geological formation, which can store and transmit groundwater in sufficient quantity
so that the water can be economically utilized from the aquifer. Aquifer characterization is a
processes by which the three-dimensional structure, hydraulic and transport properties and
chemistry of groundwater are evaluated (Robert.G et al.,2016). It provides the foundation for
groundwater modeling, which is ubiquitously used to evaluate aquifers. Detailed aquifer
characterization is particularly important where solute transport as a concern, as aquifer
heterogeneity has a much greater impact on groundwater flow direction and rates than it does on
aquifer heads.
According to Yu et al., (2012), aquifer characterized in-terms of hydraulically important
parameters such as hydraulic conductivity (K), porosity (n), or any other applicable quantity. Such
parameters are frequently assumed for individual lithofacies since real data are often unavailable.
Aquifers are unconfined if they occur at the surface, this means they can receive recharge directly
from rainfall. If they are buried under sediments they receive recharge by slow leakage from
overlying aquifers. Rainfall percolates through the surface sediments until it reaches the water
table. It then flows under gravity through local, intermediate and regional flow systems within the
aquifers (Harold F. et al., 2015). Local flow systems have flow paths of less than 5 km. They
mostly occur in upper aquifers or the unconfined fractured rock of the lower aquifers or basement.
These aquifers respond quickly to changes in rainfall, extraction or land use. Groundwater in a
local system has a relatively short residence time before it discharges to local streams (Shekhar,
2017).
Aquifer properties that affect ground-water availability include aquifer thickness and the size,
number, and degree of interconnection of pore spaces within the aquifer material. These properties
affect the ability of an aquifer to store and transmit ground water. Porosity, the ratio of void space
to unit volume of rock or soil, is an index of how much ground water the aquifer can store.
Permeability, a property largely controlled by size and interconnection of pore spaces within the
material, affects the fluid-transmitting capacity of materials (Khadri & Moharir, 2016).
Page 24
Groundwater Recharge estimation and Aquifer Characterization of Walga Catchment, Upper Gibe basin, Central Ethiopia
Tekalign Wakjira Hydrology and Water Resources Page 11
The water-transmitting characteristics of an aquifer are expressed as hydraulic conductivity and
transmissivity. Hydraulic conductivity is a measure of the rate that water will move through an
aquifer; it is usually expressed in gallons per day through a cross section of one square foot under
a unit hydraulic gradient(Okon et al., 2018). Transmissivity is equal to the hydraulic conductivity
multiplied by the saturated thickness of the aquifer. The storage characteristic of an aquifer is
expressed as the storage coefficient (Tse & Amadi, 2010).
Single well test is more common than aquifer test with having observation well, since the
advantage of single well test is that the pumping test can be conducted on the production well with
the absence of observation well. A kind of single well test, which is step-drawdown test used to
determine the efficiency and specific capacity of the well, however in case of single well test it is
possible to estimate Transmissivity, but the other parameter which is Storativity is overestimated
(Dinu et.al , 2017).
Comprehensive hydrogeological field survey, compilation of relevant data from different sources
(Ayenew et al., 2008), pumping test, well lithological logs, and indirect information from hydro-
chemical data enable to classify/characterize the aquifers and their hydraulic characteristics
including groundwater recharge and discharge conditions (Tamilnadu, 2010).
Among groundwater hydrologists, the most familiar curve matching procedure for estimating
aquifer properties from pumping tests is due to Theis (1935). The Theis method allows one to
estimate the transmissivity and storativity of a non-leaky confined aquifer having infinite extent
by means of matching the Theis type curve to water-level changes (drawdowns) measured in wells
during a constant-rate pumping test.
Constant rate pumping tests are most often interpreted using the Theis [1935] method or Jacob's
semilogarithmic approximation (Meier et.al, 1998). Both of these techniques use the temporal
evolution of pumping-induced drawdown to obtain estimates of transmissivity and storativity
under the assumptions of homogeneity, a two-dimensional domain, and confined conditions.
Jacob's method is based on the fact that the Theis well function plots as a straight line on
semilogarithmic paper at large dimensionless times. The analytical solution underlying the Theis
and Jacob techniques is based on the assumption of aquifer homogeneity.
Page 25
Groundwater Recharge estimation and Aquifer Characterization of Walga Catchment, Upper Gibe basin, Central Ethiopia
Tekalign Wakjira Hydrology and Water Resources Page 12
2.3.1. Aquifer Hydrogeological Characterization Techniques
Development of proper groundwater management strategy requires characterization of aquifer
and ambient spatiotemporal monitoring of groundwater (Ewusi & Kuma, 2014). In the present
work, hydrological characterization of an aquifer has been performed. The characterization of
aquifers could be done using certain geophysical techniques like Electrical Resistivity,
Electromagnetic Induction, Ground Penetrating Radar (GPR),Seismic Techniques, Statistical
spatiotemporal modeling and Pumping test data. Aquifer Characterization is dependent on the
petro-physical properties (porosity, permeability, seismic velocities etc.) of the subsurface. Results
of this Aquifer Characterization could be observed and analyzed using varying geophysical
software (WinRESIST, RADpro etc.) and Aquifer test to better image the subsurface (Okan et al.,
2018; Yu et al., 2012; Dhar et al., 2014).
Okan et al., (2018) has identified as pumping tests are important and most effective tools that
provide information on the hydraulic characterization of a borehole and aquifer parameters,
Constant Rate Test also give information about the drawdown and aquifer properties resulting
from specific pumping rate.
2.4. GIS and RS Techniques and AHP analysis
The occurrence, origin, movement and chemical constituents of groundwater are dependent on
geology/lithology, geomorphology, drainage density, rain fall, geological structures/lineaments,
slope, land use/land cover and soil of groundwater regime (Gintamo 2015; Yeh, et al. 2016).
Since groundwater occurs out of our sight deep in the subsurface; there is no direct method to
facilitate observation of water below the surface. Its presence or absence can only be inferred
indirectly by studying the groundwater occurrence and distribution controlling parameters. Thus,
in order to ensure wise use of groundwater, a systematic evaluation of groundwater potential area
is required (Murthy etal., 2003). Groundwater potential zones are demarked with the help of,
among others, remote sensing and Geographic Information System (GIS) techniques (Jhariya et
al, 2016; Sener et al.2005; Waikar & Nilawar 2014).
Nowadays, both Geographical Information System (GIS) and Remote Sensing (RS) are regarded
as essential tools for groundwater studies especially for extended and complex systems (Nag,
2008).The information on the input parameters in the above can be acquired and integrated through
Page 26
Groundwater Recharge estimation and Aquifer Characterization of Walga Catchment, Upper Gibe basin, Central Ethiopia
Tekalign Wakjira Hydrology and Water Resources Page 13
remote sensing and Geographical Information System (GIS) techniques. The concept of integrated
remote sensing and GIS has proved to be an efficient tool in groundwater studies, in facilitating
better data analysis and their interpretations (Murthy et al., 2003).
The main advantages of using remote sensing and GIS techniques for groundwater exploration are
the reduction of cost and time needed, the fast extraction of information on the occurrence of
groundwater and the selection of promising areas for further groundwater exploration (Hammouri,
2012; Barakat, 2012), its ability to generate information in spatial and temporal domain, which is
very crucial for successful analysis, prediction and validation (Hammouri et al., 2012; Bashe,
2017).
Gintamo, (2015) has focused on the evaluation of groundwater potential zone in south Ethiopian
rift escarpment, the Bilate River catchment in SNNPR, based on integrated Geographical
information system (GIS) and remote sensing techniques. In his study, an attempt had been made
to delineate and classify possible groundwater potential zones in the Bilate River. The thematic
layers considered were lithology, geomorphology, drainage density, lineament density, rainfall,
soil, slope and land use/ land cover were prepared using the Landsat ETM+ imagery and ArcGIS
software. Remotely sensed data and geographic information systems were applied for groundwater
potential map of Weito watershed, the southernmost sub-basin of the rift valley lakes basin in
Ethiopia. Thematic maps were developed using Landsat 8 OLI/TIRS images, shuttle radar
topographic mission (SRTM) digital elevation model (DEM) and other data sources using overlay
analysis (Bashe, 2017).
According to Hussein et al. ( 2017) eight major biophysical and environmental factors like
geomorphology, lithology, slope, rainfall, land use land cover (LULC), soil, lineament density and
drainage density were considered to delineate the groundwater potential areas using geospatial and
MCDA tools in Northern Ethiopia, Wollo Zone, in Gerardo River Catchment district. The sources
of these data were satellite image, digital elevation model (DEM), existing thematic maps and
metrological station data.
Solomon & Quiel, (2006) has conducted Groundwater study using remote sensing and geographic
information systems (GIS) in the central highlands of Eritrea. They have identified as Lithology,
lineament, landform, slope, vegetation, groundwater recharge and discharge are common features
used for many groundwater resource assessments in hard rock areas. GIS techniques facilitate
Page 27
Groundwater Recharge estimation and Aquifer Characterization of Walga Catchment, Upper Gibe basin, Central Ethiopia
Tekalign Wakjira Hydrology and Water Resources Page 14
integration and analysis of large volumes of data, whereas field studies help to further validate
results. Integrating all these approaches offers a better understanding of features controlling
groundwater occurrence in hard rock aquifers. Yeh et al., (2016) have used a GIS approach to
integrate five contributing factors: lithology, land cover/land use, lineaments, drainage, and slope
Mapping groundwater recharge potential zone using a GIS approach in Hualian River, Taiwan.
They have also identified Many factors affect the occurrence and movement of groundwater in a
region, including topography, lithology, geological structures, depth of weathering, extent of
fractures, primary porosity, secondary porosity, slope, drainage patterns, landform, land use/land
cover, and climate.
2.5. Groundwater and Surface Water Quality
Results from the 2016 Ethiopia Socioeconomic Survey found that 66% of the Ethiopian population
uses drinking water from improved sources, with distribution varying by place of residence. In
rural areas, 59% of the population reported using an improved source, usually protected springs,
tube wells, and dug wells. Source type also differs by region; almost all households in Addis Ababa
and 72% in Tigray reported using improved sources (CSA et al., 2017).
Analysis of Physico-chemical Characteristics of Water Collected from Different Sampling Sites
of Lake Hawassa, Ethiopia suggested that both point and non-point pollution sources such as
human sewage, industrial waste from ceramics, textile, plastics and food processing industries,
urban storm water, agricultural runoff and land development were impacting the lake (Haile &
Mohammed, 2019).
Groundwater is a major source of water for drinking and irrigation in Ethiopia. Further, mapping
spatial variation of groundwater parameters are important for proper developing of new
groundwater schemes and management of groundwater resources. Kawo & Karuppannan, (2018)
were collected and analyzed groundwater samples to determine suitability of groundwater for
drinking and irrigation uses in Modjo river basin. They have used WQI and SAR to identify
drinking and irrigation water quality respectively and obtained majority of samples shows that
groundwater is suitable for drinking and irrigation.
The major water quality problems in main Ethiopian rift valley is associated with high fluoride
concentration in groundwater (Tekle-Haimanot et al., 2006). They have analyzed on 1438 water
Page 28
Groundwater Recharge estimation and Aquifer Characterization of Walga Catchment, Upper Gibe basin, Central Ethiopia
Tekalign Wakjira Hydrology and Water Resources Page 15
samples and obtained 24.2% had fluoride concentrations above the 1.5 mg/l recommended
optimum concentration by WHO.
The composition of surface and underground waters is dependent on natural factors (geological,
topographical, meteorological, hydrological and biological) in the drainage basin and varies with
seasonal differences in runoff volumes, weather conditions and water levels. Human intervention
such as the building of dams, draining of wetlands and diversion of flow has significant effects
on water quality (Meybeck et al.,1996; Ayenew, 2006).
The geochemistry of ground water may influence the utility of aquifer systems as sources of water.
The types and concentrations of dissolved constituents in the water of an aquifer system determine
whether the resource, without prior treatment, is suitable for drinking-water supplies, industrial
purposes, irrigation, livestock watering, or other uses(Canora etal., 2019).
Quality can vary greatly across an aquifer, through its profile and over time. This is caused by
physical and chemical processes occurring in aquifers that can affect salinity, temperature, pH
levels, heavy metals and organic substances such as: Dissolved rocks and minerals being
transported and re deposited as groundwater moves along the flow path; Evaporation from high
water tables causing minerals and salts to concentrate in groundwater; Changes in groundwater
levels resulting in saline water being drawn into an aquifer; Chemical reactions that change the
chemistry of groundwater or thermal sources such as volcanoes, hot rocks or the sun heating the
groundwater (Lapworth et al.,2017).
Groundwater quality varies greatly across an aquifer, through its profile and over time as a result
of physical and chemical processes that change the temperature, salts and minerals it conveys
(Baxter, 2016).
2.6. Estimation of Missing Data
One of the first steps in any hydrological and meteorological study is accessing reliable data.
However, precipitation data is frequently incomplete. The incompleteness of precipitation data
may be due to damaged measuring instruments, measurement errors and geographical paucity of
data (data gaps) or changes to instrumentation over time, a change in the measurement site, a
change in data collectors, the irregularity of measurement, or severe topical changes in the climate
of a zone (Sattari et al., 2016). He also explained that, the accurate planning and management of
Page 29
Groundwater Recharge estimation and Aquifer Characterization of Walga Catchment, Upper Gibe basin, Central Ethiopia
Tekalign Wakjira Hydrology and Water Resources Page 16
water resources depends on the presence of consistent and exact precipitation data in meteorology
stations.
Estimation of missing climatological data is an important task for meteorologists, hydrologists and
environment protection workers all over the world. It is particularly important in mountain and
forest regions where meteorological stations are scarce, and the observed climatological data are
strongly influenced by topography and the forest microclimate (Xia et al,1999, Aslan et al., 2013).
Xia et al, (1999) estimated the missing data of daily maximum temperature, minimum temperature,
mean air temperature, water vapor pressure, wind speed, and precipitation with six methods. They
determined that the multiple regression analysis method was most effective in estimating missing
data. According to them, the multiple regression analysis method was most effective in estimating
missing data. The multiple regression model employs step-wise regression to determine the
coefficients for all the significant neighbor stations (Edmond Moeletsi, Phumlani Shabalala, De
Nysschen, & Walker, 2016).
Rainfall data is important for hydrological modeling, agricultural and water budget estimation.
Therefore, for performing the effective rainfall analysis, it is essential to estimate the missing value
in rainfall series. For that purpose, different methods are used for estimating the missing rainfall
data for specific regions (Romman et al., 2019). From the literature review and his previous
experience, Aslan et al., (2013) has chosen six techniques: simple arithmetic averaging, inverse
distance method, normal ratio method , single best estimator, multiple regression analysis, the
traditional method of the UK meteorological office (constant ratio or constant difference and
closest station method.
Measuring and archiving of different weather elements like rainfall, temperature or humidity is an
important exercise. Long-term meteorological data can be used to influence decisions in different
sectors including agriculture, aviation, hydrology and engineering. Accurate and complete
climatological data is important for the successful design and operation of natural resource
management systems(Edmond et al., 2016).
Edmond et al.,( 2016), missing or faulty climate data have to be estimated in order to provide a
complete dataset, especially for modelling purposes. The accuracy of the estimations is dependent
on a number of factors including the closeness of the stations used and the location of the patching
stations in relation to barriers like mountains.
Page 30
Groundwater Recharge estimation and Aquifer Characterization of Walga Catchment, Upper Gibe basin, Central Ethiopia
Tekalign Wakjira Hydrology and Water Resources Page 17
CHAPTER THREE
3. DESCRIPTION OF THE STUDY AREA
3.1. Location
Walga watershed is located in the Central Ethiopia, Oromia Regional state in South West Shoa
zone about 115 km South Western part of Addis Ababa along Jimma main asphalt road in the
upper Omo-Gibe basin. This catchment covers about eight woredas of Oromia regional state and
two woredas of SNNPR.
The river catchment starts from the highlands of Wonchi-Dandi mountain, Beda kero, Roge and
Dase jabo and flows towards south western part to Omo Ghibe basin. Geographically, the area
extends 8.26000’ to 8.818000’ North and 37.5350 to 38.130 East having an area of 2228.12 km2
and a perimeter of 237. 54 km (figure 3).
Figure 2. Location map of the Study Area
Page 31
Groundwater Recharge estimation and Aquifer Characterization of Walga Catchment, Upper Gibe basin, Central Ethiopia
Tekalign Wakjira Hydrology and Water Resources Page 18
3.2.Physiography
Walga watershed is characterized by different type of topography with its elevation in the
catchment ranges from 1338m to 3300 m a.s.l. The upstream part of the watershed is characterized
by mountainous and highly separated terrain with steep slopes while the central and downstream
part is characterized by an undulating topography and gentle.
The physiographic set up of the study area is the result of volcano- tectonic, rifting, erosion and
deposition processes. The catchment is divided into three physiographic regions: highlands,
intermediate and flat lands. Soils in the area are: Clay, clay loam, sandy clay loam and sandy
loam.
Figure 3. a) Elevation
Page 32
Groundwater Recharge estimation and Aquifer Characterization of Walga Catchment, Upper Gibe basin, Central Ethiopia
Tekalign Wakjira Hydrology and Water Resources Page 19
3.3.Climate
The study area has unimodal (single peak) rainfall pattern with the main rainy season is June to
September. Annual rainfall of eight meteorological station (table 1) was analyzed and 344.1 mm
is maximum average monthly rainfall recorded at Haro meteorological station (figure 5) since
2018 and minimum and miximum average annual rainfall is 1014.48 mm and 1828mm at Ambo
and Ameyya respectively. The maximum and Minimum temperature of the catchment is 20.5 0c
and 18.8 0c respectively (figure 11). The average annual rainfall of the area is 1357.43mm/year.
Figure 4. Spatial distribution of rainfall
Figure 5-. Mean monthly Rainfall (1997-2018 )
0
500
1000
1500
2000
2500
3000
3500
1 2 3 4 5 6 7 8 9 10 11 12 13 14 15 16 17 18 19 20 21 22
Pre
cip
itai
on
Years
Ammayya
Ambo
Chittu
Darian
Dilella
Haro
Walkitte
Woliso
0.0
50.0
100.0
150.0
200.0
250.0
300.0
350.0
400.0
Jan Feb Mar Apr May Jun Jul Aug Sep Oct Nov Dec
Rai
nfa
ll (m
m)
Months
Stations
Ammayya
Ambo
Chittu
Darian
Dilella
Haro
Walkitte
Woliso
Page 33
Groundwater Recharge estimation and Aquifer Characterization of Walga Catchment, Upper Gibe basin, Central Ethiopia
Tekalign Wakjira Hydrology and Water Resources Page 20
Table 1. Mean monthly Rainfall of Walga meteorological stations (1997-2018)
3.4.Geology and Hydrogeology
3.4.1. Regional Geology
Walga catchment lies at the South Western margin of main Ethiopian rift. The rift floor and
escarpments are highly faulted due to volcanic eruption. All geological Eras and Periods are
manifested in the country through their relics as basement (metamorphic), sediments and
sedimentary rocks, and volcanic . The plateau and the rift part encompasses the major parts of the
country (Ethiopia) including the central land mass of the country where volcanism and volcanic
have played a remarkable role in the geological set-up of the area.
Pliocene volcanics:- Dendi-Wonchi Pyroclastic deposits, Wachacha trachyte and Nazret group
(middle), welded to partially welded pyroclastic deposits;
Miocene volcanics:- Entoto formation (lower), trachyte lava flows with pyroclastic deposits
intercalated with sediments and upper trachyte flows and pyroclastic, upper trachyte flows with
plagioclase phyric basalt, ignimbrite, pyroclastic falls and flows and agglomerate are majorly
found in the catchment.
Oligocene volcanic:- Jimma upper volcanic of rhyolite and trachyte flows with minor basalts
The pre rift volcanic was result of central or fissure type eruption. Similarly, the post rift volcanic
of Quaternary age was not the result of a single eruption but the results of a series eruption.
Station UTM X UTM Y
Z Jan Feb Mar Apr May Jun Jul Aug Sep Oct Nov Dec
Ammayya 362400 947000
2277 33.4 39.2 91.9 164.7 212.6 162.4 308.9 240.1 218.8 124.8 25.9 20.9
Ambo 371879.6 993784.3
2068 24.2 17.4 47.3 64.1 112.5 180.8 204.4 203.6 100.9 37.7 14.3 7.2
Chittu 380556.7 940168.3
2150 17.5 17.5 45.7 76.3 108.3 171.3 294.4 292.5 182.4 39.9 17.9 8.2
Darian 377536 961369.8
2604 31.4 24.9 76.1 102.3 152.1 213.9 285.7 284.2 139.1 44.4 20.8 9.9
Dilella 393893.9 955151.2
2429 16.0 28.7 55.0 80.7 107.0 183.2 239.9 259.7 153.3 51.0 19.2 15.7
Haro 374048.3 972252.7
3119 7.9 10.0 34.1 50.7 130.9 169.3 344.1 318.4 175.9 50.2 58.4 4.2
Walkitte 369000 917905
2000 26.7 22.0 58.6 69.6 133.3 164.3 225.4 170.8 125.4 56.4 17.7 10.5
Woliso 387542.4 945677.7
2058 15.9 16.2 69.2 114.6 137.3 182.9 258.8 254.0 146.8 41.0 20.1 7.3
Page 34
Groundwater Recharge estimation and Aquifer Characterization of Walga Catchment, Upper Gibe basin, Central Ethiopia
Tekalign Wakjira Hydrology and Water Resources Page 21
Volcanic mainly comprised by basalts in Woliso area is part of the Quaternary volcanic and
referred to as Woliso-Ambo basalts.
Figure 6. Geological formation of the study area (modified from ATA map, 2013)
Page 35
Groundwater Recharge estimation and Aquifer Characterization of Walga Catchment, Upper Gibe basin, Central Ethiopia
Tekalign Wakjira Hydrology and Water Resources Page 22
3.4.2. Local Geology and Structure
Walga Catchment is part of the South western margin of main Ethiopian rift that comprises mainly
Quaternary and partly Tertiary volcanic including basalt, scoria, trachyte and rhyolite. Though not
prominent, there are also other pyroclastic. The present landscape of the area is the manifestation
of the long-term geological and tectonic activities adhered to both regional and local dynamics and
superimposed by erosion and deposition. Woliso town is lying on a caldera floor surrounded on
east, southeast with ridges that also acts as water divide.
The geological structures, mainly faults, are oriented northeast- southwest and north-south (north-
west and southeast). Faults have played a leading role for groundwater movement and storage as
well as in displacing different rocks in the area. Sometimes an abruption of different lithology or
the presence of volcanic plagues such as in the center of the town is observed mainly due to
different geological structures.
3.5. Hydrogeology of the Area
The hydrogeological set-up of Walga catchment is controlled by both lithology and geological
structures, which is common in many cases, as manifested in the geomorphology of the area. The
weathered basalt (fractured, scoraceous, etc.) and pyroclastic along with faults have the leading
role in the occurrence, movement and geo-chemical properties of groundwater in the area.
Based on the feasibility study documents and the field visit as well as lithological logging of
existing wells, the major aquifer in Woliso area is fractured and scoraceous basalts; this forms
multilayer aquifer system (source: SWSZWREO). Some existing boreholes in the area are artesian
confirming the multilayer aquifer nature of the area. Pyroclastic, mainly pumice and tuff are also
another aquifer in the area, commonly intercepted at depth. This aquifer is perceived to be the
sources of high fluoride content of groundwater. A lot of bore holes were closed due to their high
fluoride content.
Page 36
Groundwater Recharge estimation and Aquifer Characterization of Walga Catchment, Upper Gibe basin, Central Ethiopia
Tekalign Wakjira Hydrology and Water Resources Page 23
Figure 7. Hydrogeological map of the area (Source ATA map)
Page 37
Groundwater Recharge estimation and Aquifer Characterization of Walga Catchment, Upper Gibe basin, Central Ethiopia
Tekalign Wakjira Hydrology and Water Resources Page 24
3.6. Drainage system
The area is located at a water divide of three basins namely; Abbay, Awash and Omo-Ghibe basins.
The drainage pattern of the area is controlled by the rift shoulder uplifted topography and the
predominant fracture systems and the central volcanoes. Most of the major rivers follow the NE–
SW lineament trend. The main water bodies that characterized the drainage system of the Walga
catchment are Lake, rivers and streams. Wenchi crater Lake is located at the upper northern flank
of the basin. Many perennial and intermittent rivers are found in Walga watershed
Figure 8. Drainage System of Walga watershed.
Page 38
Groundwater Recharge estimation and Aquifer Characterization of Walga Catchment, Upper Gibe basin, Central Ethiopia
Tekalign Wakjira Hydrology and Water Resources Page 25
Major perennial rivers crossing the watershed is Walga, while Ejersa, Rebu, deddebia, amegna,
kulit and others are small rivers that are joining Walga and draining to Omo Ghibe basin. They
are characterized by dendritic drainage pattern; however major rivers in the area are parallel to
each other indicating that they are structurally controlled. Walga and Rebu are gauged at the
location of 0345831m Easting and 0921338 m Northing and 0366029 m Easting and 0923114 m
Northing respectively.
Page 39
Groundwater Recharge estimation and Aquifer Characterization of Walga Catchment, Upper Gibe basin, Central Ethiopia
Tekalign Wakjira Hydrology and Water Resources Page 26
CHAPTER FOUR
4. MATERIALS AND METHODS
4.1. Methodology and Techniques
In order to achieve the objectives of the research project, the following methodology and
techniques containing different steps were employed. The first step is data containing
topographical data, hydrogeological data, geological data, hydro-chemical data, meteorological
data, soil data were collected and satellite images for land use land cover were downloaded and
processed. GIS and Remote sensing played great role in manipulating, storing and analyzing digital
data. These data were needed to be adjusted and prepared to raster grid cell.
The watershed delineation has been done by using Digital elevation model (DEM) which is
obtained from the SRTM. ArcMap 10.4 and its spatial extension was used for further processing
of the DEM and delineation of the basin. Land use land cover map of the study area was prepared
using ArcMap 10.4 from Landsat OLI8 satellite image taken on 27 Feb, 2020 and correlated with
field data collected using GPS. Raster map of meteorological data, groundwater level, LULC,
reclassified soil map, elevation map and slope map were prepared using ArcGIS.
Then, a physically based quasi-steady state time independent model, WetSpass, has been used to
estimate the long-term average spatially varying water balance components. The model uses this
raster data to calculate annual and seasonal recharge maps, actual evapotranspiration and surface
runoff for the study area (figure 9).
In order to estimate the value of a variable over a continuous spatial field, kriging interpolation
was used. The values for other points were estimated from known values and surface data was
created from point data using ArcGIS 10.4. Data collected from different bore holes and shallow
wells were used to calculate hydraulic properties using aquifer test 9 software and their hydraulic
properties were characterized.
Thirdly, hydro-geochemical data was analyzed using piper plot to identify water quality variation
of Walga catchment. Finally, groundwater potential of the study area was mapped using multi
criteria overlay analysis using raster data prepared for WetSpass input data.
Page 40
Groundwater Recharge estimation and Aquifer Characterization of Walga Catchment, Upper Gibe basin, Central Ethiopia
Tekalign Wakjira Hydrology and Water Resources Page 27
Figure 9. Methodological Flow Chart
Page 41
Groundwater Recharge estimation and Aquifer Characterization of Walga Catchment, Upper Gibe basin, Central Ethiopia
Tekalign Wakjira Hydrology and Water Resources Page 28
4.2. WetSpass Modeling
WetSpass was applied to estimate long-term seasonal/annual average recharge as a function of
land-cover, soil type, topography and hydro-meteorological factors (Batelaan & De Smedt, 2001)
in Walga catchment. As WetSpass modeling was developed for temperate regions by Batelaan and
DeSmedt (2001,2007) which has different climatic and land conditions compared to the tropics,
some input parameters modification was used to apply it in tropical region. In temperate region,
summer and winter have six month each while in Ethiopia summer contains four months and
winter covers eight months (Dereje & Nedaw, 2019; Teklebirhan et al., 2012,). In addition to this,
the seasons of rainfall period and land-use/land-cover are not the same. According to them, to
apply the WetSpass for Walga catchment, input of the meteorological grid map was done using
eight months of winter and four months of summer. Also, summer and winter land-use parameter
tables were modified for use (Annex 4 and 5).
By using long-term average standard hydro-metrological parameters as input, the model simulates
the temporal average and spatial differences of surface runoff, actual evapotranspiration, and
groundwater recharge. Since evapotranspiration from shallow groundwater can be significant,
especially in groundwater dependent wetlands, the position of the water table is taken into account,
through the use of a coupled groundwater model, in the estimation of recharge. WetSpass is
integrated in GIS ArcView as a raster model. Parameters such as land-use and related soil type,
are connected to the model using attribute tables of the land-use and soil raster maps (Tilahun &
Merkel, 2009).
The seasonal water balance for a vegetated fraction of a raster cell (Fig. 1) is
P= I + 𝑆𝑉 +𝑇𝑉 + 𝑅𝑉……………………………………………..……………….……….1
where P is the precipitation [L], I the interception [L], 𝑆𝑉 the surface runoff [L], 𝑇𝑉 the actual
transpiration [L] and 𝑅𝑉 the groundwater recharge [L] in the vegetated fraction of the raster cell.
The actual evapotranspiration, ETv [L], is the sum of 𝑇𝑉 and the evaporation from the bare soil, Es
[L]. The total actual evapotranspiration, ETtot [L], is the sum of I, Tv and the evaporation from the
bare soil, Es [L]. The surface runoff, Sv, is simulated in two stages. First, the potential surface
runoff, Sv–pot, is calculated as:
SV−pot = f1(V,ST,S,D)(P-I)…………………………………………..........................2
Page 42
Groundwater Recharge estimation and Aquifer Characterization of Walga Catchment, Upper Gibe basin, Central Ethiopia
Tekalign Wakjira Hydrology and Water Resources Page 29
Where 𝑓1 is a runoff factor from look up table whose value is dependent on vegetation type (V),
soil texture (ST), slope (S), and groundwater saturated areas (D), and is based on characteristic
values derived.
In the second stage, the potential surface runoff is adjusted for recharge areas by taking into
account the seasonal precipitation intensity distribution (Pi) in relation to the soil infiltration
capacity as:
S𝑉 = f2(Pi, Ic,D) SV−pot………………………………………….....................................3
Where f2 is a factor from a soil texture lookup table that partitions the precipitation for a
hydrological season, in an effective and non-effective part for contribution to the surface runoff.
It can be derived by estimating the fraction of seasonal precipitation with intensity higher than the
infiltration capacity of a particular soil type.
Monthly Reference evapotranspiration was estimated using penman-Monteith equation from FAO
CROPWAT 8.0.
For bare soil surface recharge was estimated using the equation:
P= 𝑆𝑆 + 𝐸𝑆 + 𝑅𝑆 ………………………………………………………………………...4
Where the index s refers to bare soil surfaces. The surface runoff 𝑆𝑆 was simulated in a similar
way to the vegetated area fraction in two stages—Eqs. (2) and (3).
The water recharge for open water area fraction of a cell is defined as:
P= 𝑆𝑜 + 𝐸𝑜 + 𝑅𝑜 ………………………………………………………………………..5
Where the index o refers to open water surfaces.
The water balance for impervious surfaces is given as:
P= 𝑆𝑖 + 𝐸𝑖 + 𝑅𝑖 …………………………………………………………………………6
where the index i refers to impervious surfaces.
The total water balance, per raster cell and hydrological season is stated as:
𝐸𝑇𝐶 = 𝑎𝑣𝐸𝑇𝑣 + 𝑎𝑠𝐸𝑠 + 𝑎𝑜𝐸𝑜 + 𝑎𝑖𝐸𝑖 ………………………………................................7a
𝑆𝐶 = 𝑎𝑣𝑆𝑣 + 𝑎𝑠𝑆𝑠 + 𝑎𝑂𝑆𝑂 + 𝑎𝑖𝑆𝑖 ……………………………………………................7b
𝑅𝐶 = 𝑎𝑣𝑅𝑣 + 𝑎𝑠𝑅𝑠 + 𝑎𝑖𝑅𝑖 ……………………………………………………….7c
where the index c refers to raster cell, with 𝐸𝑇𝐶, 𝑆𝐶 , 𝑅𝐶 [L] respectively, the total
evapotranspiration, surface runoff and recharge in a raster cell and 𝑎𝑣, 𝑎𝑠, 𝑎𝑜 𝑎𝑛𝑑 𝑎𝑖 respectively
the vegetated, bare soil, open water and impervious area fraction of a raster cell. In a vegetated or
Page 43
Groundwater Recharge estimation and Aquifer Characterization of Walga Catchment, Upper Gibe basin, Central Ethiopia
Tekalign Wakjira Hydrology and Water Resources Page 30
cropped area, there is evaporation from the soil in between the plants and transpiration from
vegetation, resulting in evapotranspiration (𝐸𝑇𝑉) in Eq. (7a). From the portion of the catchment on
which there is no vegetation (i.e. practically bare land), only evaporation from the bare soil
𝐸𝑠 occurs, in Eq. (7a).
In the equation (7c) above there is no recharge Ro, because it is assumed that the recharge, Ro,
derived from the precipitation on the open water fraction, is negligible compared to the possible
recharge from the surface water body itself. If the Penman open water evaporation, Eo, is smaller
than the precipitation, the remaining water will contribute to the surface runoff, So (Batelaan &
De Smedt, 2007).
4.2.1. WetSpass Input Data
The WetSpass model requires a set of basic input data, including meteorological data
(precipitation, air temperature, wind speed, and potential evapotranspiration), distributed
groundwater depth, soil types, topography (DEM and slope), and land use/land cover of the
investigated area. Such input data were prepared as grid maps using Geographical Information
Systems collected for the period of 1997 to 2018. The climate data for eight stations around the
Walga catchment was obtained from Ethiopian Meteorological Services Agency. Seven of the
stations (Ameyya, Chittu, Darian, Haro, Woliso, Wolkitte and Dilella) are located in the catchment
area while the other one (Ambo) is located outside of the catchment. Woliso and Ambo provides
complete data of more than thirty years while the others contains only precipitation data. Among
these stations Ameyya has only 12 years rainfall record with two years missing data.
The WetSpass model was applied for the study area using grid cells of 100 x 100 m with 677
columns and 639 rows. The model functions on two seasonal data sets. For this purpose the year
was divided into two seasons with summer (June to September) and winter (October to May) with
respective input data (land-use, precipitation, potential evapotranspiration, temperature, wind
speed, and groundwater depth). The major rainy season of Walga catchment is from June to
September.
Two types of inputs were required so as to run the WetSpass model: Parameter tables (dbf data)
such as inputs of land use, soil and runoff characteristics parameter tables are required. Then, this
table was added to map as attribute. The runoff characteristics parameter tables contain runoff
Page 44
Groundwater Recharge estimation and Aquifer Characterization of Walga Catchment, Upper Gibe basin, Central Ethiopia
Tekalign Wakjira Hydrology and Water Resources Page 31
coefficient, slope and soil type for each corresponding land use and grid map is also prepared using
ArcMap 10.4. ArcMap (version 10.4) together with its spatial analyst extensions was used in order
to prepare these input parameters. This raster grid maps were converted to asci format using
ArcMap conversion tools. The input map preparation is as follows:
Precipitation
Annual rainfall map of the study area was prepared using the historical rainfall data of long years
measured at the meteorology stations located in the catchment and surrounding study area (Annex
1). Incompleteness of precipitation data at all stations was filled using linear regression and GIS
with its spatial analyst tool (interpolation) used to analyze data of eight meteorological stations in
the Walga river catchment and nearby station. Kriging spatial interpolation was applied to know
the areal distribution of precipitation over the catchment.
Accordingly, the area receives an average annual rain fall of 1357.43mm per year. The summer
annual average rainfall is 794 mm while winter average rainfall is 541mm.
Figure 10. a) Mean monthly precipitation b) Mean Annual precipitation
0
200
400
600
800
1000
1200
1400
1600
1800
Pre
cip
itai
on
(m
m)
Station
b)
0
50
100
150
200
250
300
350
400
Jan Feb Mar Apr May Jun Jul Aug Sep Oct Nov Dec
Pre
cip
itat
ion
(mm
)
MonthsAmmayya Ambo Chittu Darian
Dilella Haro Walkitte Woliso
a)
Page 45
Groundwater Recharge estimation and Aquifer Characterization of Walga Catchment, Upper Gibe basin, Central Ethiopia
Tekalign Wakjira Hydrology and Water Resources Page 32
Figure 11. Summer and Winter precipitation map of Walga watershed
Temperature
Temperature data is available for only four weather stations. Ameyya has 15 years recorded data
while the others, Ambo, Woliso and Wolkite have more than 30 years recorded data. The summer
season average temperature is 17 0c while the winter is 19.980c. The annual minimum and
maximum average temperature is 17.40c and 20.40c respectively. Minimum monthly temperature
was recorded at Walkite station since December 2013 while maximum monthly temperature is
recorded at the same station since November 2015.
Figure 12. a)Long term mean monthly temperature b)Annual mean temperature of each station
17.5
18
18.5
19
19.5
20
20.5
21
Ameyya Ambo Woliso Walkitte
Tem
per
atu
re(a
v)
Stations
b)
0
5
10
15
20
25
Tem
per
atu
re (
0C
)
Months
Ameyya Ambo Woliso Walkitte
Page 46
Groundwater Recharge estimation and Aquifer Characterization of Walga Catchment, Upper Gibe basin, Central Ethiopia
Tekalign Wakjira Hydrology and Water Resources Page 33
Figure 13. Summer and Winter average Temperature of Walga catchment
Wind Speed
Wind speed data are available only for Ambo and Woliso station. These data were used uniformly
over the watershed. Average wind speed of summer and winter is 1.12 m/s and 5.37 m/s
respectively. The maximum, minimum, average and stdev of annual wind speed is 3.84m/s,
2.13m/s, 3.24m/s and 0.26 respectively.
Figure 14. Summer and Winter average wind speed map of Walga catchment
Page 47
Groundwater Recharge estimation and Aquifer Characterization of Walga Catchment, Upper Gibe basin, Central Ethiopia
Tekalign Wakjira Hydrology and Water Resources Page 34
Potential Evapotranspiration
Potential evapotranspiration (PET) is the maximum amount of water that can be removed from a
land surface through evapotranspiration (ET) as sum of both evaporation and transpiration given
abundant supply of soil moisture (Amatya et.al, 2014). In last few decades several different
methods varying from empirical to temperature-based to physically-based process models have
been developed, tested, and applied to estimate PET for various types of land covers from soil
surface to crop, water, and vegetation.
Potential evapotranspiration of Walga watershed was calculated using Penman-Montieth based
FAO CROPWAT software for two meteorological stations having recorded minimum and
maximum temperature, wind speed, sunshine hours and relative humidity. As other meteorological
data, PET Calculated monthly results were subdivided into two main seasons i.e. 4 months of
summer (rainy season) and 8 months of winter (Dray season). Finally, those PET values of each
season, were converted to spatially distributed grid maps by means of interpolation.
The grid maps of PET for both seasons were used with other input parameters in WetSpass model
to estimate the recharge as well as actual evapotranspiration (AET). The average potential
evapotranspiration of summer is 354 mm, where the winter is 982 mm, and the average annual
potential evapotranspiration is 1336. 5 mm with 1311.07 mm and 1386.6 mm as the minimum and
maximum annual PET respectively.
Figure 15. a) Annual PET b) Summer PET and c) Winter PET of walga catchment
Page 48
Groundwater Recharge estimation and Aquifer Characterization of Walga Catchment, Upper Gibe basin, Central Ethiopia
Tekalign Wakjira Hydrology and Water Resources Page 35
Land Use Land Cover
The important characteristics of the runoff process that affects infiltration, erosion, and
evapotranspiration is Land use. The main crops grown in the area are maize, wheat, teff, sorghum,
barley, been, pea and different types of vegetables. Land cover units having different areal
coverage are Vegetated area, grass and shrub lands, bare land, settlement, Agricultural area and
open water body of Lake Wonchi. Climatic elements such as precipitation, temperature, humidity,
sunshine, and wind are affected by geographic location and altitude. Seasonal classification over
the study area is thus mainly based on the average rainfall distribution pattern over the year.
Classification process and analysis of the different LULC classes were done using one Landsat
satellite images covering the Landsat 8 OLI/TIS acquired on 27 Feb, 2020. These images includes;
L8 OLI/TIRS (path 169, rows 54). The Landsat images were down-loaded from United States
Geological (USGS) Earth Explorer (https://earthexplorer.usgs.gov/). The selection of the Landsat
satellite images dates was influenced by the quality of the image especially for those with limited
or low cloud cover. Each Landsat was georeferenced to the WGS_1984 datum and Universal
Transverse Mercator Zone (UTM) 37 Northern coordinate system.
For this study, only supervised classification was performed. Using the Image Classification
toolbar and Training Sample Manager of ArcGIS 10.4, it was determined the training samples
were representative for the area and statistically separate. Then a maximum likelihood
classification was performed from the toolbar. The classified image was then cleaned to create the
final land-use map as shown below (figure 16).
Table 2. Land use/Land cover of Walga catchment
No Classes Area (km2)
Area
(%)
1 Agriculture 1587.36 71.24
2 Mixed forest 78.43 3.52
3 Settlement 62.55 2.81
4 Bare Soil 0.35 0.02
5 Grass & shrub
lands 495.73 22.25
6 Water body 3.75 0.17
Total 2228.17 100.00
Page 49
Groundwater Recharge estimation and Aquifer Characterization of Walga Catchment, Upper Gibe basin, Central Ethiopia
Tekalign Wakjira Hydrology and Water Resources Page 36
Figure 16. Land Use Land Cover of Walga watershed
Soil Map
The soil map of Walga catchment was extracted from the soil map of Ethiopia (scale 1:250,000)
obtained from ministry of Water Irrigation and Energy.
The major textural system of the clay used in WetSpass is based on soil texture developed by FAO
class based on the percentage of silt, clay and sand. Based on that the major soil classification of
walga catchment is clay (11.78%), clay loam (70.5%), sandy clay loam (13.73%) and sandy loam
(4%).
Page 50
Groundwater Recharge estimation and Aquifer Characterization of Walga Catchment, Upper Gibe basin, Central Ethiopia
Tekalign Wakjira Hydrology and Water Resources Page 37
Figure 17. Soil map of Walga catchment (Source: MoWEI)
Table 3. Areal coverage of soil texture
Groundwater depth
Groundwater depth (Static water level) measurement was taken for accessible sites using deep
meter through observation pipe installed during water well construction. Inaccessible bore hole
sites groundwater depth and spring data were obtained from South West Shoa Water Resource
Development and Energy office and Ethiopian Construction Design and Supervision Works
Corporation (ECDSWC). The measured static water level was subtracted from surface elevation
and its raster map prepared using kriging spatial interpolation.
S.N Major soil texture CODE Area Area %
1 clay loam 9 1571 70.4997
2 sandy clay loam 7 305.88 13.7264
3 sandy loam 3 89.06 3.99676
4 clay 12 262.44 11.7772
Total 2228.38 100
Page 51
Groundwater Recharge estimation and Aquifer Characterization of Walga Catchment, Upper Gibe basin, Central Ethiopia
Tekalign Wakjira Hydrology and Water Resources Page 38
Figure 18. a) Groundwater depth and its contour map
Slope and Elevation
Digital elevation model (DEM) was downloaded from the Shuttle Radar Topography Mission
(SRTM) data sets of the United States Geological Survey (USGS). The lowest (minimum)
elevation point in the watershed is 1338.5 m in the downstream part and the highest is 3360.4 m
in the upper stream part, while the mean elevation of the watershed is 2070.35m (Figure 3b) . The
slope map of the watershed is derived from the digital elevation model using the spatial analyst
tool of ArcGIS 10.4.1. The slope ranges from 00 to 460 with a mean of 4.11 and standard deviation
of the slope is 4.25.
Page 52
Groundwater Recharge estimation and Aquifer Characterization of Walga Catchment, Upper Gibe basin, Central Ethiopia
Tekalign Wakjira Hydrology and Water Resources Page 39
Figure 19. Slope and Elevation map of the study area
Table 4. Input data of WetSpass model and description
Input Source Resolution Processing tool/method
Digital Elevation
Model
Shuttle Radar Topography
Mission (SRTM)
30 x 30 ArcGIS 10.4.1
LULC map USGS OLI8 Satellite 30 x 30 ArcGIS 10.4.1
Soil map MWEI 30 x 30 ArcGIS 10.4.1
Slope map Calculate from DEM 30 x 30 ArcGIS 10.4.1
Groundwater
depth
Direct measurement,
SWSZWERO, ECDSWC
30 x 30
Ordinary Kriging Interpolation in
ArcGIS10.4.1
Rainfall map National Meteorological
Agency
30 x 30 Ordinary Kriging Interpolation in
ArcGIS10.4.1
PET National Meteorological
Agency
30 x 30 CROPWAT 8 and Ordinary Kriging
Interpolation in ArcGIS10.4.1
Temperature National Meteorological
Agency
30 x 30 Ordinary Kriging Interpolation in
ArcGIS10.4.1
Wind speed National Meteorological
Agency
30 x 30 Ordinary Kriging Interpolation in
ArcGIS10.4.1
Page 53
Groundwater Recharge estimation and Aquifer Characterization of Walga Catchment, Upper Gibe basin, Central Ethiopia
Tekalign Wakjira Hydrology and Water Resources Page 40
4.3. Aquifer characterization
The occurrence and distribution of groundwater is related to geomorphological and geological
setting of the area. There is scarcity of hydrogeological data in the study area and scarce data
obtained does not have systematic data base that can be easily used. In this study data is obtained
from south west shoa zone water resource development and energy office, Woliso town water and
sewerage authority and ECDSWC.
An aquifer test is a controlled field experiment used to estimate hydraulic properties of aquifer
systems; such as transmissivity, hydraulic conductivity and specific capacity. Pumping test is
among the fundamental aquifer testing methods of characterizing aquifer hydraulic properties
(Okan et al., 2018) .
Single well test is more common than aquifer test with having observation well, since the
advantage of single well test is that the pumping test can be conducted on the production well with
the absence of observation well (Modelling et al., 2016). A kind of single well test, which is step-
drawdown test used to determine the efficiency and specific capacity of the well, however in case
of single well test it is possible to estimate Transmissivity, but Storativity is overestimated (Dinu
et.al , 2017).
Among groundwater hydrologists, the most familiar curve matching procedure for estimating
aquifer properties from pumping tests is due to Theis (1935). The Theis method allows one to
estimate the transmissivity and storativity of a non-leaky confined aquifer having infinite extent
by means of matching the Theis type curve to water-level changes (drawdowns) measured in wells
during a constant-rate pumping test.
Hence the method consists of drawing a straight line through the late time data points and
extending it backward to the point of zero drawdown (time axis intercept), which is designated to.
The drawdown per log cycle is obtained from the slope m of the line. Values for transmissivity T
and storativity S can then be found from
T= 2.3𝑄
4𝛱𝑚………………………………………………………………………………….8
S= 2.25𝑇𝑡0
𝑟2 ………………………………………………………………………….……9
where Q is the constant pumping rate and r is the radial distance to the observation well; if
drawdowns are measured at the pumping well, r is equal to the effective radius of the well (Tse &
Amadi, 2010).
Page 54
Groundwater Recharge estimation and Aquifer Characterization of Walga Catchment, Upper Gibe basin, Central Ethiopia
Tekalign Wakjira Hydrology and Water Resources Page 41
Discharge (l/s)
The topography of Walga catchment ranges from low land to very high elevated lands.
Topographically high lands like, Wonchi, Beda Kero and Roge mountains are classified under
area of recharge. Discharge areas are those area which are mostly at the foot of mountainous,
manifested by the presence of springs at the contact of the elevated and the low land areas. Areas
starting from Senkole down wards to Weliso & Walga, can be considered discharge zones by the
presence of shallow ground water depth up to 6m & abundance of artesian type springs and bore
holes. Presence of many springs at different elevations as a contact spring indicates that there is a
shallow ground water circulation in addition to the regional flow of groundwater.
Figure 20. Spatial distribution of groundwater discharge using IDW of study area
Groundwater discharge data measured from bore hole during pumping test was obtained from
government and non-governmental organization. The yield in the study area ranges from 0.4 l/s to
60.7 l/s. The average borehole yield in the area is 3.6 l/s. High discharge well producing 60.7l/s
was obtained around Woliso in ignimbrite and basalt volcanic rocks while, poor discharge wells
producing less than 1 l/s are also recorded in the area. Free flowing (artesian wells) are produced
from fractured basalt at Meti walga 5km from woliso town and at Gurura town following Walga
Page 55
Groundwater Recharge estimation and Aquifer Characterization of Walga Catchment, Upper Gibe basin, Central Ethiopia
Tekalign Wakjira Hydrology and Water Resources Page 42
catchment is a freely flowing without water tapping facilities. Cold and hot springs emanating at
low topography are discharging up to 25 l/s.
Specific Capacity
The Specific Capacity of a well is the pumping rate (gpm) (Q) divided by the drawdown in feet
(s). Specific Capacity can also be used to provide the design pumping rate or maximum yield for
the well and to estimate the transmissivity of the surrounding formations penetrated by the well
screens.
Sc= 𝑄
𝛥𝑆⁄ …………………………………………………………………………………...10
Where Sc is specific capacity, 𝑄 well discharge and 𝛥𝑆 is change in draw dawn
The maximum pumping rate of a well can be estimated using the initial Specific Capacity. The
maximum pumping rate is calculated as the Specific Capacity times the maximum available
drawdown.
Figure 21. Spatial distribution of specific capacity using IDW
Page 56
Groundwater Recharge estimation and Aquifer Characterization of Walga Catchment, Upper Gibe basin, Central Ethiopia
Tekalign Wakjira Hydrology and Water Resources Page 43
The initial Specific Capacity value can also be used to estimate the transmissivity (T) of the
aquifer. Transmissivity is the rate water is transmitted through an aquifer under a unit width and a
unit hydraulic gradient. It equals the aquifer’s hydraulic conductivity (K) times the aquifer
thickness (b). The higher the transmissivity, the greater the capability of the aquifer to move water
and the lower the drawdown in the well.
Transmissivity (T)
A pumping test is the best available method to evaluate aquifer parameters. This test involves
extracting water from a well at a controlled ate and observing the water level changes.The time
gap between the onset of pumping and the beginning of an appreciable flow of water from the
aquifer to the well depends mostly on the transmissivity of the aquifer(Khadri & Moharir, 2016).
Transmissivity (m2/day) is the rate at which water of a prevailing density and viscosity is
transmitted through a unit width of an aquifer or confining bed under a unit hydraulic gradient. It
may also a measure of the amount of water that can be transmitted horizontally through a unit
width by the full saturated thickness of the aquifer under a hydraulic gradient. It is a function of
properties of the liquid, the porous media, and the thickness of the porous media.
Figure 22. Spatial distribution of Transmissivity using in Walga
Page 57
Groundwater Recharge estimation and Aquifer Characterization of Walga Catchment, Upper Gibe basin, Central Ethiopia
Tekalign Wakjira Hydrology and Water Resources Page 44
Single well aquifer testing can provide the value of Transmissivity, whereas preclude the cost and
access of multi-well aquifer testing, so usually in this case the test data analyzed by Cooper-Jacob's
(1946) straight line method due to its simplicity. Transmissivity was estimated by fitting a straight
line between time versus drawdown on semi-logarithmic paper using the equation 8.
Hydraulic conductivity (K)
It is the quantitative measurement of permeability that is the ease in which water can pass through
a unit thickness of an aquifer. Hydraulic conductivity K and Transmissivity T are related by the
expression. Thus,
K =Tb⁄ ………………………………………………………………………….………11
where b = saturated thickness of the aquifer, which is equivalent to total screen length (Tse &
Amadi, 2010).
Figure 23. Spatial distribution of Hydraulic Conductivity of Study area
Page 58
Groundwater Recharge estimation and Aquifer Characterization of Walga Catchment, Upper Gibe basin, Central Ethiopia
Tekalign Wakjira Hydrology and Water Resources Page 45
4.4. Groundwater potential evaluation
Groundwater potential evaluation is an essential for the proper utilization and management of this
precious natural resource. Among techniques used to evaluate groundwater potential; GIS and
remote sensing are efficient techniques in groundwater studies; in facilitate better data analysis
and their interpretations of groundwater potential controlling parameters (Gintamo, 2015; Hussein
et al., 2017; Oikonomidis et al., 2015; Solomon & Quiel, 2006; Yeh et al., 2016b).
All the thematic layers were then assigned weights according to their relative importance in
groundwater occurrence and the corresponding normalized weights were obtained based on the
Saaty's analytical hierarchy process (Saaty, 1984). Digital image processing of the satellite data
were carried out for extraction of pertinent information about the potential groundwater. The
groundwater potential assessment using multi-criteria evaluation involved thematic map
generation and their integration through GIS.
Analytical Hierarchy Process (AHP) is one of the more popular methods of MCDA techniques
and has many advantages. One of its advantages is its ease of use, its use of pairwise comparisons
can allow decision makers to weight coefficients and compare alternatives with relative ease. It is
scalable, and can easily adjust in size to accommodate decision making problems due to its
hierarchical structure and although it requires enough data to properly perform pairwise
comparisons (Velasquez & Hester, 2013).
Prior to integration of different information, individual class weights and map scores were assessed
based on Satty’s Analytic Hierarchy process where a pair – wise comparison matrix prepared for
each map using a nine point important scale (Whitaker & Foundation, 2017, Wang et al., 2017).
The main purpose of this study is to determine groundwater potential using Geographic
Information System and Remote Sensing.
Page 59
Groundwater Recharge estimation and Aquifer Characterization of Walga Catchment, Upper Gibe basin, Central Ethiopia
Tekalign Wakjira Hydrology and Water Resources Page 46
Table 5. Scale of Relative importance (Goepel, 2013)
Intensity of I Definition Explanation
1 Equal Importance Two activities contribute equally to the
objective
3 Weak importance of one over
another
Experience and judgement slightly favor
one activity over another
5 Essential or strong importance Experience and judgement strongly favor
one activity over another
7 Demonstrated importance An activity is strongly favored and its
dominance demonstrated in practice
9 Absolute Importance The evidence favoring one activity over
another is of the highest possible order of
affirmation
2,4,6,8 Intermediate values between
the two adjacent judgements
When compromise is needed
Reciprocals of
above nonzero
J has reciprocal value with i
4.4.1. Preparation of thematic maps using GIS and RS
The groundwater potential evaluation involved thematic map generation and their integration
through GIS. Thematic maps were prepared in the proper scale with a spatial resolution of 30 meter
pixel size from satellite imagery, topographical, and geological mapping and other
hydrogeological field data.
All the thematic maps were converted into grid (raster format) and superimposed by weighted
overly method (rank and weight wise thematic maps and integrated with one another through
ArcGIS).The maps were developed in a GIS environment using eight input parameters for
groundwater potential evaluation. Groundwater potential zonation means identifying and mapping
the prospective ground water zones in an area by quantitative assessment of the controlling and
indicative parameters.
The thematic layers considered in this study were lithology, drainage density, recharge, discharge,
soil, slope, land use/ land cover and Groundwater depth. Thematic maps for each parameters were
prepared as follows:
Page 60
Groundwater Recharge estimation and Aquifer Characterization of Walga Catchment, Upper Gibe basin, Central Ethiopia
Tekalign Wakjira Hydrology and Water Resources Page 47
Precipitation
For hydrologic analyses it is important to know the areal distribution of precipitation. Several areal
precipitation estimation techniques are currently used for averaging precipitation depths collected
at ground stations.
The Inverse distance weight and Kriging spatial interpolation techniques are conventional
techniques that are usually applied to estimate the areal precipitation . As stated under 4.2.1, data
from eight meteorological station having 22 years record was used for this study.
The higher the amount of rainfall indicates as there is groundwater recharge and lower amount of
rainfall indicates lower values of groundwater potential. But, the recharge from rainfall is
influenced by slope, land use land cover, soil, lithology and drainage density.
Figure 24. Reclassified annual precipitation of Walga catchment
Page 61
Groundwater Recharge estimation and Aquifer Characterization of Walga Catchment, Upper Gibe basin, Central Ethiopia
Tekalign Wakjira Hydrology and Water Resources Page 48
Slope
Slope is one of the important terrain parameters, explained by horizontal spacing of the contours.
The lower slope values indicate the flatter terrain (gentle slope), shown by sparse contours and
higher slope values correspond to steeper slope of the terrain showing closely spaced contours
(Waikar & Nilawar, 2014).
The slope gradient directly influences the infiltration of rainfall. Larger slopes produce a smaller
recharge because water flows rapidly down a steep slope during rainfall, so it does not have
sufficient time to infiltrate the surface and recharge the saturated zone (Yeh et al.,2016b). Steeper
the slope, greater will be the runoff and thus lesser is the groundwater recharge. Digital Elevation
model (DEM) is derived using contour information from the topographical map for estimation of
slope in degree (Bose et al., 2010, ).
In this study, slope map (figure 19) was reclassified into four classes like 0-6° (gentle), 6-15°
(moderate), 15-27° (high), and 27-46° (more (steep).
Figure 25. Reclassified slope
Page 62
Groundwater Recharge estimation and Aquifer Characterization of Walga Catchment, Upper Gibe basin, Central Ethiopia
Tekalign Wakjira Hydrology and Water Resources Page 49
Drainage density map
Drainage density indicates rock permeability and infiltration capacity, and therefore recharges
capacity. They are reflection of the rate that precipitation infiltrated compared to surface runoff.
Where rocks are highly permeable, infiltration to groundwater is high, and less water is transported
in rivers as surface water; but where rocks have low permeability there is little infiltration and
more surface water runoff. Low drainage density is therefore related to higher recharge and higher
groundwater potential (Rahmati et al., 2016, Nagarajan & Singh, 2009, Hussein et al., 2017).
Drainage density delineated using Digital Elevation Model hydro-processing module of SRTM
data of the study area after consecutive processes such as importing of SRTM data, filled sinks for
undefined values, created flow direction, created flow accumulation, created stream network,
generated stream order and finally converted stream order to drainage density. The stream order
values were regrouped to produce a drainage density map that was reclassified into four categories
i.e., 0-0.33(high), 0.33-0.665 (medium) , 0.665-0.99 (low), and 0.99-1.33 (very low ) density.
Figure 26. Reclassified Drainage Density map
Page 63
Groundwater Recharge estimation and Aquifer Characterization of Walga Catchment, Upper Gibe basin, Central Ethiopia
Tekalign Wakjira Hydrology and Water Resources Page 50
Land use Land Cover
Land use plays a significant role in the development of groundwater resources. It controls many
hydrogeological processes in the water cycle viz.,infiltration, evapotranspiration, surface runoff
etc. Surface cover provides roughness to the surface, reduce discharge thereby increases the
infiltration. In the forest areas, infiltration will be more and runoff will be less whereas in urban
areas rate of infiltration may decrease. Land use map prepared for WetSpass can be used for
groundwater potential evaluation (figure 16).
Soil map
Soil properties influence the relationship between runoff and infiltration rates which in turn control
the degree of permeability, the principal factor in hydrogeology that determines the groundwater
potential (Manikandan et al. 2014). Clay soil enhances surface runoff due to its low permeability
while Sandy clay loam reduces surface runoff due to its high permeability. In general soil type
influences the amount of groundwater recharge which has an influence on groundwater potential
mapping. Soil map prepared for WetSpass data input was used after reclassification (figure 17).
Lithology/Geology
Lithology plays an important role in the occurrence and distribution of groundwater (Yeh, et al.
2016b). Higher porosity contributes to higher groundwater storage and higher permeability
contributes to higher groundwater yields.
Manikandan et al., (2014) identified as the storage capacity of the rock formations depends on the
porosity of the rock. In the rock formation the water moves from areas of recharge to areas of
discharge under the influence of hydraulic gradients depending on the hydraulic conductivity or
permeability. The same map (figure 6) was used.
Groundwater recharge
One of the outputs of WetSpass simulation was groundwater recharge (figure 42) was used in
evaluating groundwater potential zoning of Walga catchment. Areas of good groundwater recharge
was given higher value while the reverse is true.
Groundwater Depth
Shallow groundwater table was given higher rank while deep groundwater was given lower rank
(figure 39).
Page 64
Groundwater Recharge estimation and Aquifer Characterization of Walga Catchment, Upper Gibe basin, Central Ethiopia
Tekalign Wakjira Hydrology and Water Resources Page 51
4.4.2. Groundwater Potential Zone
After spatially analyzed weighted overlay analysis Walga catchment was classified into four
groundwater potential zone. Very good groundwater potential of the area covers 46.6km2 while
0.87km2 of bare impermeable rock area is very poor groundwater potential. High amount of
rainfall, gentle slope, fractured rocks, low drainage density, good ground coverage and sand clay
loam area is classified und eve good groundwater potential.
Figure 27. Groundwater potential zone
Page 65
Groundwater Recharge estimation and Aquifer Characterization of Walga Catchment, Upper Gibe basin, Central Ethiopia
Tekalign Wakjira Hydrology and Water Resources Page 52
4.5.Groundwater quality/ Hydro-geochemistry
Water quality is a term used to describe the chemical, physical, and biological characteristics of
water, usually in respect to its suitability for a particular purpose.
Groundwater of Walga catchment is mainly used for drinking and irrigation purposes. Therefore,
quality criteria depend on the use of water for a particular purpose, and quality standards have to
be maintained in water supply for different uses to avoid deleterious effects. In other words,
whether a groundwater of a given quality is suitable for a particular purpose depends on the criteria
or standards of acceptable quality for that use (Patil et al., 2012).
Ayenew, (2006), has been carried out a broad survey to study the spatial variation of the major
ions composition of the surface and groundwater systems in the Ethiopian volcanic terrain and
associated Plio-Quaternary sediments. The result revealed wide hydrochemical variations
controlled by geological, geochemical, geomorphological and climatological factors
Hydro-geochemistry is the study of the chemical composition of natural waters (Canora et al.,
2019; Rajesh et al., 2019). The chemical composition of natural waters results from both geogenic
(natural) and anthropogenic sources. Once precipitation reaches the ground, it reacts with soil,
rock, and organic debris, dissolving still more chemicals naturally aside from any pollution
generated by human activities (Rahmanian et al., 2015). Among the factors determining the level
of trace and major elements are the content of solute in the initial rain, the extent of reaction with
rock and soil, loss of constituents by precipitation or absorption, and loss of water because of
evaporation, transpiration or reaction with minerals.
According to Rahmanian et al., (2015), one of the most important natural changes in groundwater
chemistry occurs in the soil. Soils contain high concentrations of carbon dioxide which dissolves
in the groundwater, creating a weak acid capable of dissolving many silicate minerals. In its
passage from recharge to discharge area (Nur et al., 2012), groundwater may dissolve substances
it encounters or it may deposit some of its constituents along the way. The eventual quality of the
groundwater depends on temperature and pressure conditions, on the kinds of rock and soil
formations through which the groundwater flows, and possibly on the residence time.
Page 66
Groundwater Recharge estimation and Aquifer Characterization of Walga Catchment, Upper Gibe basin, Central Ethiopia
Tekalign Wakjira Hydrology and Water Resources Page 53
The present study focused on the hydrochemistry of groundwater in Walga watershed to assess the
quality of groundwater for determining its suitability for drinking and agricultural purposes using
analysis of Laboratory result.
4.5.1. Laboratory result data Collection and Analysis
Chemical groundwater result data were collected from Woliso town water supply and sewerage
authority, Southwest Shoa Zone water resource development and energy office and Ethiopian
Construction Design and Supervision Works Corporation (ECDSWC). A total of 148 schemes (72
BH, 13 HDW, 17SHW and 46 spring) laboratory results data were collected and analyzed using
piper diagram and chart. Data collected contains physical parameters such as pH, electrical
conductivity (EC), total dissolved solids (TDS), salinity, temperature (T), and ions including Ca2+,
Na+, K+, Mg2+,Cl-, SO42-, NO3
- and HCO3-.
Table 6. Descriptive statics of water quality parameters with WHO standards (Kurniawan et al.,
2019)
Parameter Max Min Mean STDE WHO limits
Temp. oC 40. 5 7.08 23.63 12.53
Ph 9.66 6.37 7.56 0.78 6.5-8. 5
Electrical Conductivity(µS/cm) 1172.1.00 185.9 535.03 317.54 -
T. Dissolved Solid 1050c 750.6 138.47 292.7 115.12 1000
Ammonia(mg/l NH3) 1.51 0.00 0.28 0.29 25
Sodium (mg/l Na) 300.00 4.50 80.27 69.06 200
Potassium (mg/l k) 23.50 0.09 7.23 4.93 200
Total Hardness(mg/l CaCo3) 421 40 114.49 58. 57 300
Calcium (mg/l Ca) 155.80 2.28 33.13 34.96 200
Magnesium (mg/l Mg) 66.70 0.55 9.62 11.71 150
Total Iron (mg/l Fe) 4.29 0.00 0.18 0.59 0.3
Manganese (mg/l Mn) 2.20 0.00 0.14 0.31 1
Fluoride (mg/l F) 16.40 0.00 1.40 2.90 1. 5
Chloride (mg/l Cl) 127.50 0.00 15.98 21.49 600
Nitrite (mg/l No2) 1.00 0.00 0.12 0.26 1
Nitrate (mg/l No3) 84.70 0.00 10.54 17.91 10
Alkalinity(mg/l CaCo3) 948.00 5.63 238.38 160.92 200
Carbonate (mg/l CO3) 90.00 0.00 22.79 16.48 -
Bicarbonate (mg/l HCO3) 1156.60 31.72 279.26 198.58 -
Sulphate (mg/l SO4) 169.80 0.10 14.76 32.18 250
Phosphate (mg/l PO4) 23.00 0.08 1.08 4.00 50
Page 67
Groundwater Recharge estimation and Aquifer Characterization of Walga Catchment, Upper Gibe basin, Central Ethiopia
Tekalign Wakjira Hydrology and Water Resources Page 54
Figure 28. Bio-statistical representations of phsio-chemical parameters
4.5.2. Phsico-chemical Analysis
According to Patil et al., (2012), physico chemical parameter study is very important to get exact
idea about the quality of water and we can compare results of different physico chemical parameter
values with standard values. In specifying the quality characteristics of groundwater, physical
(temperature, turbidity, color and tastes and odor) and chemical (total solids, total dissolved solids,
total suspended solids, specific conductance, PH, dissolved oxygen, hardness and alkalinity)
analysis were done from previously collected laboratory results as follows.
4.5.2.1.Classification and presentation of analytical results
Piper diagram outline certain fundamental principles in a graphic procedure which appears to be
an effective tool in separating analytical data for critical study with respect to sources of the
dissolved constituents in water(Tank & Chandel, 2010; Rajesh et al., 2019). Piper diagram consists
of three parts: two trilinear diagrams along the bottom and one diamond-shaped diagram in the
middle. The trilinear diagram illustrates the relative concentration of cations (left diagram) and
anions (right diagram) in each sample. The concentration of 8 major ions (Na+, K+, Mg2+, Ca2+,
Clˉ, CO32-, HCOˉ3 and SO4
2-) are represented on a trilinear diagram by grouping the K+ with Na+
and the CO32- with HCOˉ3, thus reducing the number of parameters for plotting to 6 (Amadi et al.,
2014). On the Piper diagram, the relative concentration of the cations and anions are plotted in the
lower triangles, and the resulting two points are extended into the central field to represent the total
0200400600800
1000120014001600
Ave Max Min STDEV
Page 68
Groundwater Recharge estimation and Aquifer Characterization of Walga Catchment, Upper Gibe basin, Central Ethiopia
Tekalign Wakjira Hydrology and Water Resources Page 55
ion concentrations. The degree of mixing between freshwater and saltwater can also be shown on
the Piper diagram.
Page 69
Groundwater Recharge estimation and Aquifer Characterization of Walga Catchment, Upper Gibe basin, Central Ethiopia
Tekalign Wakjira Hydrology and Water Resources Page 56
Figure 29. Piper diagram of different water sources
The Piper diagram can also be used to classify the hydro-chemical facies of the groundwater
samples according to their dominant ions. The water in the area is majorly Na-Cl-facies, followed
by Ca-Mg-HCO3-facies, Na-Ca-SO4-facies, Ca-Mg-Cl-facies, Na-K-Cl-facies and facies in their
order of dominance respectively.
4.5.3. Drinking water Quality Variations
Fluoride
Fluoride is a naturally occurring element in water that is dissolved from some types of rocks or
associated with geothermal waters. Rock-water interaction is the prime factor responsible for
fluoride enrichment in water (Dinu et al., 2017; Tekle-Haimanot et al., 2006).
The concentration of fluoride in ground drinking water greater than the world health organization
standard value imposes a serious health, social and economic problem in developing countries. In
the Ethiopian Rift Valley where deep wells are the major source of drinking water, high fluoride
level is expected (Halford et al., 2006; Demelash et al., 2019).
Page 70
Groundwater Recharge estimation and Aquifer Characterization of Walga Catchment, Upper Gibe basin, Central Ethiopia
Tekalign Wakjira Hydrology and Water Resources Page 57
Figure 30. Spatial distribution of Fluoride concentration
Table 7. Areal coverage of Fluoride
No
Level of
Fluoride Area km2 Percent(%)
1 0-1.5 1099.512 49.34
2 1.5-3.5 671.1984 30.12
3 3.5-4.88 149.976 6.73
4 4.88-6.5 182.088 8.17
5 6.5-11.23 125.4528 5.63
Fluoride is beneficial when present in small concentrations (0.8 to 1.0 mg/l) in drinking water for
calcification of dental enamel but it causes dental and skeletal fluorosis if present in higher
amounts. Higher concentrations of fluoride in drinking water are also linked with cancer. The
permissible limit of Fluoride depends on temperature; a higher intake of fluoride can be
permissible in colder climates (Fejerskov et al., 1994).
Page 71
Groundwater Recharge estimation and Aquifer Characterization of Walga Catchment, Upper Gibe basin, Central Ethiopia
Tekalign Wakjira Hydrology and Water Resources Page 58
Hardness
Hardness of water is its content of metallic ions which reacts with sodium soaps to produce solid
soaps or scummy residue and which react with negative ions, when the water is evaporated in
boilers, to produce solid boiler scale (Camp, 1963). It is predominantly caused by divalent cations
such as calcium, magnesium, alkaline earth metal such as iron, manganese, strontium, etc. It is a
water quality indication of the concentration of alkaline salts in water, mainly calcium and
magnesium.
Hardness is normally expressed as the total concentration of Ca2+ and Mg2+ as milligrams per liter
equivalent CaCO3. The total hardness is the sum of calcium and magnesium concentrations, both
expressed as CaCO3 in mg/l.
Figure 31. Spatial distribution of Total hardness of Walga catchment
Table 8. Areal coverage of Hardness
No Hardness Area Percent (%)
1 9.6 - 300 725.9184 32.58
2 300-400 858.9888 38.55
3 400-500 419.3568 18.82
4 500-600 143.7552 6.45
5 600 - 6615 80.208 3.60
Page 72
Groundwater Recharge estimation and Aquifer Characterization of Walga Catchment, Upper Gibe basin, Central Ethiopia
Tekalign Wakjira Hydrology and Water Resources Page 59
4.5.4. Irrigation water quality
The primary water quality in most irrigation situations is salinity levels, since salts can affect both
the soil structure and crop yield. Irrigation water containing large amounts of sodium is of special
concern due to sodium’s effects on the soil and poses a sodium hazard (Tank & Chandel, 2010).
Sodium hazard is usually expressed in terms of SAR or the sodium adsorption ratio. SAR is
calculated from the ratio of sodium to calcium and magnesium (Fipps, 1995).
SAR=(Na+)
√(𝐂𝐚𝟐+)+(𝐌𝐠𝟐+)
𝟐
⁄,…………………………………………………………………….12
Figure 32. Spatial distribution of SAR values of the stud area
Salinity of water is usually measured by the TDS (total dissolved solids) or the EC (electric
conductivity). TDS is sometimes referred to as the total salinity and is measured or expressed in
parts per million (ppm) or in the equivalent units of milligrams per liter (mg/L) (Kumar, 2014).
EC is a good measure of salinity hazard to crops. Excess salinity reduces the osmotic activity of
plants and thus interferes with the absorption of water and nutrients from the soil (Tank & Chandel,
2010).
Page 73
Groundwater Recharge estimation and Aquifer Characterization of Walga Catchment, Upper Gibe basin, Central Ethiopia
Tekalign Wakjira Hydrology and Water Resources Page 60
Figure 33.Spatial distribution of EC
The sodium in irrigation water is usually expressed in % Na. As per Indian standards maximum of
60% sodium is permissible for irrigation water. Tank and Chandel, (2010) formulated the
following equation to determine % Na.
Na%=(Na++K+)100/(Ca2++Mg2++Na++K+)……………………………………………………13
Figure 34. Spatial distribution of sodium %
Page 74
Groundwater Recharge estimation and Aquifer Characterization of Walga Catchment, Upper Gibe basin, Central Ethiopia
Tekalign Wakjira Hydrology and Water Resources Page 61
Table 9. Areal distribution of EC
Table 10. Irrigation water quality evaluation based on EC and SAR
(adapted from Tank and Chandel, 2010)
Figure 36. Spatial distribution of TDS
No EC (µs/cm) Area Percent (%)
1 165.41 - 250 517.133 23.2
2 250 - 750 770.026 34.6
3 750 - 950 569.275 25.5
4 950-1200 268.978 12.1
5 1200- 1,549 102.816 4.6
Water class Excellent Good Permissible Doubtful Unsuitable
EC (µs/cm) 0-250 251-750 751-2250 2251-3000 3000
Na% <20% 20-40% 40-60% 60-80% >80%
Sodium hazard
of water
Low Medium High Very high
SAR Values 1-10 10-18 18-26 >26
Figure 35. Spatial distribution of Alkalinity in mg/l of CaCO3
Page 75
Groundwater Recharge estimation and Aquifer Characterization of Walga Catchment, Upper Gibe basin, Central Ethiopia
Tekalign Wakjira Hydrology and Water Resources Page 62
CHAPTER FIVE
5. RESULTS AND DISCUSION
5.1. Hydro-meteorological data analysis
To estimate hydrological balance of a given basin, each of the hydro-meteorological elements has
to be quantified. Those basic meteorological data are; rainfall, wind speed, temperature, humidity
and sunshine hours. Accordingly groundwater recharge, actual evapotranspiration and surface
runoff have been calculated.
5.1.1. Rainfall
Rainfall distribution analysis and its temporary variability which was done based on rainfall data
obtained in and near the study area was characterized by unimodal (single peak) rainfall pattern.
It is the major factor controlling the hydrologic cycle of a region. Since much of the ecology,
geography, and land use of Walga catchment depend upon the function of the hydrological cycle,
and therefore precipitation provides both constraints and opportunities in land and water
management of the catchment. The relevant precipitation in the catchment is in the form of rainfall.
Rainfall is one of the most important climatic variables, which shows the nature and climatic
conditions of Walga Catchment. The catchment has four seasons, named as summer (which is June
to August), autumn; (September to November), winter; (December to February) and spring;
(March to May). The main rainy months are June, July, August and September which is considered
as Summer season and the rest months are considered as dry months in the modeling.
Figure 37. Annual average rainfall
0
200
400
600
800
1000
1200
1400
1600
1800
1995 2000 2005 2010 2015 2020
Rai
nfa
ll (m
m)
Year
Page 76
Groundwater Recharge estimation and Aquifer Characterization of Walga Catchment, Upper Gibe basin, Central Ethiopia
Tekalign Wakjira Hydrology and Water Resources Page 63
Figure 37 shows that, the rain fall pattern over the years showed variation, the area received highest
and lowest rainfall in the year of 1998 and 2015 respectively. The rainfall of the area also showed
a decreasing trend from the year of 2010.
The distributed rainfall map is generated using interpolation tool by kriging in ArcGIS spatial
analyst module using the point rainfall data from the meteorological stations. Accordingly, the
area receives an average annual rain fall of 1357.43 mm per year. The summer average rainfall is
794.08mm while winter average rainfall is 541.19mm (figure 11).
5.1.2. Temperature
The average temperature values of each season are converted to spatially distributed grid maps
using ordinary kriging. The monthly temperature results were subdivided into two seasons; four
months of summer and eight months of winter. The grid maps of temperature for both seasons
were converted to ASCII file format and used with other input parameter in WetSpass model.
Mean, minimum & maximum temperature data were collected from National Meteorological
Service of Ethiopia which has been measured at Woliso, Wolkite, Ameyya and Ambo
meteorological stations for 22 years (1987-2018). Based on the data it could be observed that
Walga catchment is experiencing high temperature in the months February, March & April and
low temperature in October. The following graph shows the monthly average, maximum and
minimum temperature recorded at Woliso weather station over the years.
Figure 38. Monthly min, max and Average Temperature
0
5
10
15
20
25
30
0 5 10 15 20 25
Tem
per
atu
re
Year
Tmin Tmax Tav
Page 77
Groundwater Recharge estimation and Aquifer Characterization of Walga Catchment, Upper Gibe basin, Central Ethiopia
Tekalign Wakjira Hydrology and Water Resources Page 64
The summer season average temperature is 18.18 0c while the winter is 19.980c. The annual
minimum and maximum average temperature is 17.40c and 190c respectively (figure 13).
5.1.3. Wind Speed
Wind speed data are available for few meteorological stations. These data were used uniformly
over the watershed. Similar to the other seasonal parameters, wind speed results are also
subdivided into two seasons i.e. 4 months of summer (June to September) and 8 months of winter
(October to May). Then, the average wind speed values of each season, were interpolated and
converted to grid maps using ordinary kriging interpolation method. These grid maps of wind
speed for both seasons were converted to ASCII file format and used as input parameters in
WetSpass model. The average wind speed of summer and winter is 1.12m/s and 5.37m/s
respectively (figure 14).
5.1.4. Potential evapotranspiration
According to Dereje & Nedaw (2019), evapotranspiration is an important parameter in water
budget which abstracts water from the system and controls the soil moisture content, groundwater
recharge and stream flow components of a certain basin.
Penman-Montieth based FAO CROPWAT software was used to estimate potential
evapotranspiration of Walga watershed using two meteorological stations having recorded
minimum and maximum temperature, wind speed, sunshine hours and relative humidity. As other
meteorological data, PET calculated monthly results are subdivided into two main seasons i.e. 4
months of summer (rainy season) and 8 months of winter (Dray season). Finally, those PET values
of each season, were converted to spatially distributed grid maps by means of kriging interpolation.
As listed under (figure 15), summer average potential evapotranspiration is 354.3 mm, where the
winter is 982 mm, and the average annual potential evapotranspiration is 1336.5 mm with 1311
mm and 1387 mm as the minimum and maximum annual PET respectively.
5.1.5. Groundwater depth
A total of 175 water schemes static water level was collected for groundwater depth mapping.
Ground water level elevation was calculated by subtracting water depth (SWL) from elevation
Page 78
Groundwater Recharge estimation and Aquifer Characterization of Walga Catchment, Upper Gibe basin, Central Ethiopia
Tekalign Wakjira Hydrology and Water Resources Page 65
above sea level. The minimum and maximum groundwater level is 1484m and 2592m while
1865m is the average depth of groundwater level.
Static water level (depth to groundwater table) of Walga catchment ranges from free flowing
(artesian) to 98m, with average depth is 16m to groundwater (figure 39). The distributed
groundwater depth map is generated using interpolation tool by kriging in ArcGIS spatial analyst
module using collected groundwater data as shown on (figure 18).
Figure 39. Depth to groundwater table
Page 79
Groundwater Recharge estimation and Aquifer Characterization of Walga Catchment, Upper Gibe basin, Central Ethiopia
Tekalign Wakjira Hydrology and Water Resources Page 66
5.2. Output of the WetSpass model
The main outputs of the WetSpass model are raster maps of seasonal groundwater recharge,
surface runoff and actual evaporation for the period of 1997 to 2018. In this maps every pixel
represents the magnitude of the water budget components.
5.2.1. Actual evapotranspiration
It is difficult to directly measure actual evapotranspiration, hence it is estimated from potential
evapotranspiration. A WetSpass model calculates a total actual evapotranspiration per pixel as a
sum of evaporation from open water, impervious surface area, bare soil, interception of vegetated
area and the transpiration of the vegetated cover (Salem et al., 2019).
Evapotranspiration is the process which returns water to the atmosphere and therefore completes
the hydrologic cycle and, it includes evaporation from open water, vegetation and ground surface.
Also transpiration, which is the removal of water from the soil by plant roots, transport of the water
through the plant into the leaf as well as evaporation of the water from the leaf’s interior into the
atmosphere. Actual evapotranspiration is one components of water balance to determine
groundwater recharge of Walga watershed using WetSpass model.
The model simulated the annual evapotranspiration of the watershed to be 282.39 mm and 1336.4
mm as minimum and maximum values respectively while 736 is the mean AET which accounts
for about 54.22% of the total annual rainfall lost by evapotranspiration. About 58.2% of the total
annual evapotranspiration is lost during winter season while the rest 41.8% is released in the
summer season. This variation occurs due to low cloud cover, minimum relative humidity and
longer time range in winter than summer season. As a result the winter evapotranspiration is higher
than the summer.
The output annual evapotranspiration grid map (figure 40) shows that high annual
evapotranspiration is observed in northern, middle parts and north eastern parts of the catchment,
because these areas covered by cultivated crop, woodland, and also the presence of high annual
rainfall. Lower annual actual evapotranspiration is observed at southern and southeastern part of
the catchment due low coverage of forest, woodland and low annual rainfall. Generally, the value
of annual evapotranspiration of Walga river catchment varies with land-use/land-cover. Hence,
land-use/land-cover are the main controlling factors of evapotranspiration in the catchment.
Page 80
Groundwater Recharge estimation and Aquifer Characterization of Walga Catchment, Upper Gibe basin, Central Ethiopia
Tekalign Wakjira Hydrology and Water Resources Page 67
Figure 40. Summer, Winter and Annual AET of Walga catchment
Page 81
Groundwater Recharge estimation and Aquifer Characterization of Walga Catchment, Upper Gibe basin, Central Ethiopia
Tekalign Wakjira Hydrology and Water Resources Page 68
5.2.2. Surface runoff
To estimate the surface runoff of Walga catchment WetSpass uses runoff coefficient which varies
its value with vegetation type, soil type and slope. The surface runoff of Walga catchment shows
variation with land-use, soil type, slope, topography, precipitation and the other meteorological
parameters.
Figure 41. Summer, Winter and Annual Surface runoff
Page 82
Groundwater Recharge estimation and Aquifer Characterization of Walga Catchment, Upper Gibe basin, Central Ethiopia
Tekalign Wakjira Hydrology and Water Resources Page 69
The simulated annual surface runoff varies from a minimum of 99.6mm to a maximum of
1244.76mm with a mean of 519.16mm that accounts about 38.25% from the mean annual rainfall
(1357.43). The amount of surface runoff also shows variation in summer and winter season. The
mean surface runoff (Sv) of the watershed in rainy season is 301. 5 mm, while the mean surface
runoff (Sv) in dry season is approximately 148.7 mm. About 66.97% of Sv occurs during the rainy
seasons (June to September), while the remaining 33.03% occurs in dry months (October to may).
This variation comes from rainfall changes in the two seasons.
Higher surface runoff occurs partially at north, middle pat, and south western parts of the
catchment due to cliff topography, steep slope, clay soil and poor vegetation cover (figure 4.1).
Vegetation enhances rainfall reception and evapotranspiration increasing infiltration of water into
soil and recharging groundwater. Northern, eastern and southern part of Walga catchment is
dominantly areas of low surface runoff due to forest, grass land with shrub with high ground cover,
agriculture, clay loam, sandy clay loam, sandy loam and gentle topography. Surface runoff of
Walga catchment is strongly influenced by landscapes and land use land cover
5.2.3. Groundwater recharge
Recharge is an important factor in evaluating groundwater resources but is difficult to quantify.
The WetSpass model estimates seasonal and annual long term spatial distribution amounts of
groundwater recharge of Walga catchment as a spatial variable dependent on the soil texture, land-
use, slope, meteorological conditions by subtracting the seasonal and annual surface runoff and
evapotranspiration from the seasonal and annual precipitation respectively. The annual
groundwater recharge of Walga catchment varies from 0 mm to 564.17mm with 102.2 mm mean
value. The average annual groundwater recharge is 7.5% of the annual average precipitation..
Based on this the average groundwater recharge is estimated to be 227.7 MCM. This amount of
infiltration into the groundwater depends on vegetation cover, slope, soil composition, depth to the
water table, the presence or absence of confining beds and other factors. Recharge is promoted by
natural vegetation cover, flat topography, permeable soils, a deep water table and the absence of
confining beds (Graf & Przybyłek, 2018).
Usually the recharge areas are in topographic high places; discharge areas are located in
topographic low. Using only topographic setup of the area could not be enough to classify the area
as recharge and discharge zones. Land use/land cover, soil types and morphology of land are
Page 83
Groundwater Recharge estimation and Aquifer Characterization of Walga Catchment, Upper Gibe basin, Central Ethiopia
Tekalign Wakjira Hydrology and Water Resources Page 70
equally important in classification of the area into recharge and discharge zones. The highland area
gets relatively higher precipitation than the lowland.
Figure 42. Summer, Winter and Annual Walga recharge
Page 84
Groundwater Recharge estimation and Aquifer Characterization of Walga Catchment, Upper Gibe basin, Central Ethiopia
Tekalign Wakjira Hydrology and Water Resources Page 71
Figure 42 above shows that Northern and north western part is areas of high groundwater recharge
due to sand clay loam soil texture (relative proportion of clay, silt and sand ), dense forest,
vegetation and high rainfall. Eastern and south eastern part of study area also classified under high
groundwater recharge enhanced by soil surface roughness (ploughed land), cultivated crop land
and irrigation area, gentle to moderate slope and lower drainage density. South and south western
part is areas of low groundwater recharge due to high drainage density, steep slope, impermeable
clay soil and poor ground cover. Summer and annual groundwater recharge map shows that
Wonchi lake is classified under low groundwater recharge and during dry season the lake and
groundwater recharges surface water. Kasahun Beyene (2005) has conducted his study entitled “
groundwater resources evaluation of Walga river basin” over area of about 1786.75 km2 and
estimated groundwater recharge was 174.42mm using water balance method. Abera Gonfa (2018),
has estimated the spatial variability of ground water recharge of Walga catchment using SWAT
model based on precipitation distribution, soil type, land cover, topography (slope class) of the
study area. According to his study, total groundwater recharge to shallow aquifer, as estimated
using SWAT model was 315mm/yr, which is 24.4% of the annual rainfall amount of the study
area.
Table 11.Summary of annual water balance components
Water balance component Annual (mm)
Min Max Mean
Precipitation (P) 1003 1827 1357.43
Evapotranspiration (AET) 282.39 1336.4 736
Runoff (RO) 99.6 1244.76 519.16
Recharge (GR) 0 564.17 102.2
Difference P-AET-RO-GR=0.07
The mean annual water balance components (0.07mm) shown on table 12 above shows that
groundwater recharge estimation using WetSpass is the best method, since it is a dynamic state
spatially distributed water balance model for simulating groundwater recharge. The simulated
groundwater recharge is minimum due to high actual evapotranspiration and high surface runoff.
Simulated annual and seasonal water balance components ae shown under annex 6
Page 85
Groundwater Recharge estimation and Aquifer Characterization of Walga Catchment, Upper Gibe basin, Central Ethiopia
Tekalign Wakjira Hydrology and Water Resources Page 72
5.3. Aquifer Characterization
In the study area (Walga catchment), pumping test is one of the ways to determine the performance
and efficiency of a well and also to characterize and parameterize the hydraulic properties of an
aquifer for a lot of bore holes located in this catchment. Step drawdown, Constant discharge and
Recovery tests was done on single well to provide estimation of hydraulic parameters. The aquifer
hydraulic properties were estimated from the pumping test by fitting mathematical models (type
curves) to response data (water level changes) through computer software known as AQUIFER
TEST. The Cooper Jacob’s Straight-line was used to analyze the pumping test results of drawdown
with respect to time. This method was chosen because it is built upon the most simplified
assumptions.
Borehole properties in terms of depth, screen intervals (assumed aquifer thickness), static and
dynamic water levels, drawdown and yield together with the aquifer constants T, K and Sc
obtained from the Cooper- Jacob methods are presented in Table 6 below.
Table 12. Summary of aquifer properties
Well depth ranges from 12m (hand dug well) to 474m (bore holes) with average depth of 105m is
drilled in the Walga catchment by government, private, NGOs and cooperation. Yield or discharge
(Q) values range from 0.15 l/sec. to 61 l/sec (figure 20). The mean discharge value for the 72
boreholes is 4.09 l/s. The maximum discharge in Walga catchment is extracted from fractured
basalt and ignimbrite aquifer lithologies while lowest discharge is from pyroclastic fall.
Transmissivity (figure 22) ranges from 3.5 x10⁻⁴ m2/day to 290 m2/day with an average of 50.94
m2/day. The lowest transmissivity values 3.5x10⁻⁴ m2/day is indicative of the poor permeability in
Properties Max Min Ave
Well Depth (m) 473.58 12 105.35
SWL (m) 98 0 17.66
Q (l/s) 60.7 0.15 4.09
Sc (l/s/m) 75.79 0.0167 9.39
DD(m) 147.8 3.72 45.66
T (m2/day) 290 0.00045 50.94
K (m/sec) 16.04 0 1.2
Page 86
Groundwater Recharge estimation and Aquifer Characterization of Walga Catchment, Upper Gibe basin, Central Ethiopia
Tekalign Wakjira Hydrology and Water Resources Page 73
the pyroclastic lithologic formations, the same to low discharge to wells. The low T values also
imply that it will take a considerable time for the aquifers to replace water into wells removed
during pumping. Hydraulic conductivity values ranges from 0 to 16.04 m/se with mean values of
1.2 m/s (figure 23) . The sum of the yield from 72 boreholes is 430 l/s (119.4 m3/hr), this gives a
total of 37152000 liters per day. Drawdown of cover between 3.72 and 147.8m were recorded in
most boreholes and this gives an indication of the relative inefficiency of the aquifer materials as
hydraulic structures.
5.4. Groundwater potential evaluation
To evaluate the different ground water potential zones, essential parameters were considered, and
the maps were prepared for each layer. These maps were converted to raster data sets having the
same pixel size and different weightage were assigned as per their groundwater potential
controlling capacity within the study area and reclassification of each map was done based on the
weight values produced.
Accordingly, the value 1 was given for highly controlling units, 2 for moderately controlling units,
3 for low controlling units and 4 for poor controlling reclassified units. Finally the maps integrated
using GIS software with the purpose intended to delineate the groundwater potential areas for the
study region.
5.4.1. Criteria weights and map scores
Thematic map with another paired-comparison 8x8 matrix was prepared by 28 pair wise
comparison on Satty’s importance scale to determine the relative importance or weights of each.
These matrices have the property of consistency known as consistency ratios (CR). Satty indicates
that the matrices with CR ratings greater than 0.1 should be re-evaluated. This way it helps to
analyses the matrix to determine the inconsistency in defining the interrelationships. In this case
the consistency value was 7% which was accepted (Figure 43). The weights were normalized by
multiplying with 100 to avoid complexities of computation (table 14). These weights were applied
in linear summation equation to obtain a unified weight map containing due weights of all input
variables, which was further reclassified to arrive at groundwater potential map.
A total of eight thematic map were used for analyzing groundwater potential of Walga catchment.
The contribution of rainfall in recharging groundwater is very high and has taken 26.1% while the
Page 87
Groundwater Recharge estimation and Aquifer Characterization of Walga Catchment, Upper Gibe basin, Central Ethiopia
Tekalign Wakjira Hydrology and Water Resources Page 74
role of drainage density in the area is very low (2.2%). High scale value (4) was assigned for lower
annual rainfall, while lowest value (1) for highest annual rainfall. To account for varying geology;
Fractured mokonnin basalt and lower jimma basalt have given 1 scale values while wochecha
trachyte and wonchi dendi pyroclastic fall contribution in evaluating groundwater potential is giver
lowest (4) scale value.
The slope degree between 0-6° (high value), 6-15° (moderate value), 15-27° (low value), and 27-
46° (least value) was assigned on account of increasing run off and decreasing infiltration
respectively. The resulting weights for the criteria based on pairwise comparison of the following
criteria is as follows. In the contrary to lineament density, higher drainage density value were
assigned the lowest and the lowest drainage density values assigned highest values for decreasing
runoff in the area.
For clayey Soil least value was assigned because of the presence of clay-horizons in the area
considerably restricts percolation whereas highest value was assigned for fine sandy clay loam for
their low water holding capacity and high permeability allow fast percolation. Shallow
groundwater table area (discharge area) assigned highest values and deep groundwater table (areas
of recharge) assigned least values.
Table 13. Relative weight and ranks of criteria
No Categories Weight(%) Rank
1 Recharge 26.1 1
2 LULC 18.0 2
3 Discharge 15.4 3
4 Groundwater depth 14.1 4
5 Slope 10.4 5
6 Soil 9.2 6
7 Lithology 4.5 7
8 Drainage density 2.2 8
Page 88
Groundwater Recharge estimation and Aquifer Characterization of Walga Catchment, Upper Gibe basin, Central Ethiopia
Tekalign Wakjira Hydrology and Water Resources Page 75
Table 14. Paired comparison matrix
Figure 43. Principal Eigen value and CR
From the table 14, recharge map and LULC holds the first and second ranks while drainage density
contribution is very low in groundwater potential evaluation when compared with other criteria’s.
Page 89
Groundwater Recharge estimation and Aquifer Characterization of Walga Catchment, Upper Gibe basin, Central Ethiopia
Tekalign Wakjira Hydrology and Water Resources Page 76
5.4.2. Groundwater potential zoning map
By integration of all the thematic maps, groundwater potential zones were delineated and classified
as: very good (most important, high groundwater potential), good (important), Satisfactory (less
important) and poor (not much important) potential zones (figure 27). The very good potential
zones correspond to alluvial plains, lacustrine sediments, the fracture valleys, and valley fills,
which coincide with the low slope and high lineaments density areas. The good zones mainly
comprise structural hills and escarpments which contributes high run-off. Poor groundwater
potential zones are present in the mountain peaks, plateaus and escarpments with steep cliff, where
consolidated pyroclastic fall and less fractured acidic rocks exists.
Table 16 specifies that, 65.8% of Walga catchment coverage is under Satisfactory ground water
potential while 0.72% is classified under very good groundwater potential, as well as 1.53% is
areas here there is Poor groundwater table, gentle slope and very low drainage density is covered
by good groundwater potential.
Table 15. Area coverage of groundwater potential zone
No Groundwater potential zone Area Coverage (km2) Percentage
1 Very good 16 0.72
2 Good 712 31.96
3 Satisfactory 1466 65.80
4 Poor 34 1.53
5.5.Groundwater Quality
5.5.1. Dinking water
PH value
The statistical summary of ground water data is shown in table 6. Majority groundwater pH ranges
from 6.37 to 9.66 with mean of 7. 6. Measurement of pH relates to the acidity or alkalinity of the
water, meanwhile majority of the water sample of Walga catchment is classified under alkaline
water shows as there is disinfection in water and above WHO maximum limit. The maximum pH
value 9.66 was collected from Galeyi rogda deep bore hole of 459m depth extracted from fractured
basalt aquifer and minimum pH value 6 measured at Goru kersa site of Goro woreda.
Page 90
Groundwater Recharge estimation and Aquifer Characterization of Walga Catchment, Upper Gibe basin, Central Ethiopia
Tekalign Wakjira Hydrology and Water Resources Page 77
Electrical Conductivity
It is the ability of water to carry out electric current. The presence of dissolved solids such as
calcium, chloride, and magnesium in water samples carries the electric current through water. The
maximum electrical conductivity is 1172.1 µS/cm measured at Kulit/shola ber shallow bore hole
site at downstream of Walga catchment while the minimum EC value is 185.93 µS/cm. According
to Rahmanian et al., (2015), it is expected to find high mineral contents in mineral water, which
resulted in higher conductivity value. They also stated that, conductivity does not have direct
impact on human health. It is determined for several purposes such as determination of
mineralization rate (existence of minerals such as potassium, calcium, and sodium) and estimating
the amount of chemical reagents used to treat this water.
High conductivity may lead to lowering the aesthetic value of the water by giving mineral taste to
the water. For the industrial and agricultural activity, conductivity of water is critical to monitor.
Spatial distribution map (figure 33) of EC (µS/cm ) of Walga catchment shows; the Northern part
is classified under low EC while the Southern part is under high EC (figure 33). Water with high
conductivity may cause corrosion of metal surface of equipment such as boiler, home appliances
such as water heater system and faucets.
Total Dissolved Solids
The maximum inorganic matters and minimum amounts of organic matter (TDS), which are
present as solution in water sample of the area is 750.6mg/l, 138.47mg/l while the mean is 292.7
mg/l (figure 35). The standard allowable value set by WHO is 1000mg/l. But, all water sample of
Walga catchment are below maximum allowable limits.
Fluoride
Statistical data (table 7) shows, the maximum fluoride concentration 16.4 mg/l is recode at Negash
logde site medium bore hole of 297m depth meanwhile 0, 1.4 and 2.9 is the minimum, mean and
standard deviation of fluoride concentration in Walga catchment. A lot of bore holes for Woliso
town water supply and Private(mercy, lions club, and Negash lodge) bore holes were closed due
to high fluoride concentration above maximum allowable limit set by WHO.
Page 91
Groundwater Recharge estimation and Aquifer Characterization of Walga Catchment, Upper Gibe basin, Central Ethiopia
Tekalign Wakjira Hydrology and Water Resources Page 78
Spatial distribution of Fluoride concentration Walga catchment (figure 30) shows dominantly the
area exceeds permissible WHO limit. Since the area is classified under intense agriculture, F-
concentration results from soil contamination as a result of the use of phosphate fertilizers and
pesticides leached in to the aquifer.
According to guidelines for drinking water-quality set by WHO (2017), the chemicals of greatest
health concern in some natural waters are usually excess natural fluoride, nitrate/nitrite and arsenic.
Some commercial water treatment technologies are available for small applications for the removal
of chemical contaminants. For example, anion exchange using activated alumina or iron-
containing products will effectively reduce excess fluoride concentrations. Bone char has also been
used to reduce fluoride concentrations.
Total Hardness
The maximum, minimum, average and standard deviation of hardness in Walga catchment is 421,
40,114.5 and 58.47espectively. WHO has not established guideline value for hardness because of
not of health concern at levels found in drinking-water. Depending on the interaction of other
factors, such as pH and alkalinity, water with a hardness above approximately 200 mg/l may cause
scale deposition in the treatment works, distribution system and pipework and tanks within
buildings. It will also result in high soap consumption and subsequent “scum” formation (WHO,
2017) .
5.5.2. Irrigation water quality
Spatial distribution of electrical conductivity (figure 33) shows dominantly the study area is
suitable for irrigation in terms of EC. Spatial distribution of EC ranges from 165 to 1549 with
mean of 507.26 and std dev of 174.36.
SAR is important parameters for determining the suitability of groundwater for irrigation because
it is a measure of sodium hazard to crops. Spatial distribution of SAR value in the study area (figure
32) ranges from 0.01 to 149.76 with mean of 30.22 and std dev of 20.68. Irrigation water quality
index based on SAR values adapted from Kuma (2014), Walga catchment lies from low to high
salinity area.
Page 92
Groundwater Recharge estimation and Aquifer Characterization of Walga Catchment, Upper Gibe basin, Central Ethiopia
Tekalign Wakjira Hydrology and Water Resources Page 79
Spatial distribution of Na+ (figue 34), percentage of sodium ranges from 0.004 to 95.9, while 53
and 14.2 is the mean and standard deviation of Na%. It shows, majority of the study area is in
between 40-60% which is permissible quality of water for irrigation (table 8)
Classification of groundwater
Piper diagram (figure 28) and (table 6) shows, existing works and data on physico- chemical
parameters of groundwater quality in Walga ccatchment shows that, the category of water type is
bicarbonate, Na-HCO3 type as a leading followed by Ca-Na-HCO3 type and Mg-HCO3 type.
Page 93
Groundwater Recharge estimation and Aquifer Characterization of Walga Catchment, Upper Gibe basin, Central Ethiopia
Tekalign Wakjira Hydrology and Water Resources Page 80
CHAPTE SIX
6. CONCLUSION AND ECOMMENDATION
6.1.Conclusion
Being water is life, proper planning and management for utilization of this resource is very
important. In order to have successful groundwater management, identifying the amount of spatial
and temporal recharge and characterizing aquifer properties is very essential. WetSpass was
applied to estimate long-term seasonal/annual average spatial and temporal groundwater recharge,
actual evapotranspiration and surface runoff of the basin as a function of land-cover, soil type,
topography and hydro-meteorological factors in Walga catchment. The mean value of surface
runoff accounts 38.75% of the total annual precipitation, 54.22% of the total annual rainfall is lost
by evapotranspiration while 7.5% of annual rainfall is recharged the groundwater of Walga
catchment. The total water balance of this catchment is 0.07mm that shows that WeSpass gives
good estimation of groundwater recharge. Less groundwater recharge is simulated due to high
evapotranspiration and surface runoff which leads to drop in water table. It has also a negative
impact in fulfilling increasing demand of water in Walga catchment.
Recharge is the primary method through which water enters an aquifer. In order to characterize
the aquifer properties hydrogeological data was collected and aquifer hydraulic properties were
estimated from the pumping test by fitting mathematical models to response data through computer
software known as AQUIFER TEST. The Cooper Jacob’s Straight-line was used to analyze the
pumping test results of drawdown with respect to time. The maximum discharge in Walga
catchment is extracted from fractured basalt and ignimbrite aquifer lithologies while lowest
discharge is from pyroclastic fall. The low T values of the catchment implies poor permeability in
the pyroclastic lithologic formations, the same to low discharge to wells and that it will take a
considerable time for the aquifers to replace water into wells removed during pumping.
The source of groundwater recharge in Walga catchment is mainly rainfall. Rainfall has
contributed highest weightage in evaluating groundwater potential of Walga catchment. To
account for varying geology; Fractured mokonnin basalt and lower jimma basalt have given
highest scale values while wochecha trachyte and wonchi dendi pyroclastic fall contribution in
evaluating groundwater potential is given lowest scale value. By integration of all the thematic
maps (Rainfall, Lithology, Slope, Groundwater depth, Soil, LULC and Drainage density),
Page 94
Groundwater Recharge estimation and Aquifer Characterization of Walga Catchment, Upper Gibe basin, Central Ethiopia
Tekalign Wakjira Hydrology and Water Resources Page 81
groundwater potential zones were delineated and classified as: very good (most important, high
groundwater potential), good (important), poor (not much important) and very poor (least
important) potential zones. From classified groundwater potential delineation 66.4% of Walga
catchment is classified as good groundwater potential. Integrated GIS and remote sensing
techniques are very efficient and useful, time and cost effective tool for the
identification/delineation of groundwater potential zones. Paired Comparison matrix analysis
indicates that all parameters are significant but the most effective parameters in the area are: litho
logy, geomorphology, lineament density, drainage density and slope.
Understanding only the amount of groundwater recharge, aquifer properties and delineating
groundwater potential is not enough unless its quality is not known. Descriptive statics of water
quality parameters shows that the average water quality parameters are within the limited WHO
standards. Irrigation water quality was studied based on EC, SAR and Na%. Spatial distribution
of electrical conductivity shows dominantly the study area is suitable for irrigation in terms of EC.
Irrigation water quality index based on SAR values Walga catchment lies from low to high salinity
area while Na% shows majority of the study area is permissible quality of water for irrigation.
6.2.Recommendations
WetSpass input data was prepared from meteorological data with a lot of missing values filled by
linear regression; the result can be changed based on accurate input of hydro meteorological data,
soil and land use land cover. Water chemistry used in this research is based on laboratory data
collected from different office, since quality varies spatially and temporally recent water sample
data can change what is presented in this work. Based on this
Proper recorded hydrogeological and hydrogeochimcal data is very important for
management and scientists interested to study Walga catchment.
Groundwater monitoring is very fundamental step towards evaluating and managing shallow
and deep groundwater resources since there is less groundwater recharge.
Further study on groundwater chemistry is needed to have clear information of
groundwater for drinking and irrigation water supply.
In general, proper well inventory with full necessary data is needed to have good water
planning and management and also make life easy for further study.
Page 95
Groundwater Recharge estimation and Aquifer Characterization of Walga Catchment, Upper Gibe basin, Central Ethiopia
Tekalign Wakjira Hydrology and Water Resources Page 82
Bibliography
Amadi, A. N., Olasehinde, P. I., Dan-Hassan, Okoye, N. O., & Ezeagu, G. G. (2014). Hydrochemical Facies
Classification and Groundwater Quality Studies in Eastern Niger Delta, Nigeria. International Journal
of Engineering Research and Development, 10(3), 2278–67.
Amatya, D. M., Harrison, C. A., & Trettin, C. C. (2014). Comparison of Potential Evapotranspiration (
PET ) using Three Methods for a Grass Reference and a Natural Forest in Coastal Plain of South
Carolina. (2011).
Aquifer, C., Flow, G., Conductivity, H., Table, W., & Hydrogeology, A. (2015). Unconfined Aquifer
Unconfined Aquifers The Subsurface Environment Groundwater Hydrology.
Area, M., Africa, S., & Kurniawan, T. A. (2019). Hydrogeochemical Assessment of Groundwater Using
Statistical Approach.
Aslan, S., Yozgatligil, C., Iyigun, C., & Batmaz, I. (2013). Comparison of Missing Value Imputation
Methods for Turkish Monthly Total Precipitation Data. Theor Appl Climatol, 143–167.
https://doi.org/10.1007/s00704-012-0723-x
Ayenew, T. (2006). Major ions composition of the groundwater and surface water systems and their
geological and geochemical controls in the Ethiopian volcanic terrain. SINET: Ethiopian Journal of
Science, 28(2), 171–188. https://doi.org/10.4314/sinet.v28i2.18253
Ayenew, T., Demlie, M., & Wohnlich, S. (2008). Hydrogeological framework and occurrence of
groundwater in the Ethiopian aquifers. Journal of African Earth Sciences, 52(3), 97–113.
https://doi.org/10.1016/j.jafrearsci.2008.06.006
Bashe, B. B. (2017). Groundwater Potential Mapping using Remote Sensing and GIS in Rift Valley Lakes
Basin, Weito Sub Basin, Ethiopia. International Journal of Scientific & Engineering Research, 8(2),
43–50. Retrieved from http://www.ijser.org
Batelaan, O., & De Smedt, F. (2001). WetSpass: A flexible, GIS based, distributed recharge methodology
for regional groundwater modelling. IAHS-AISH Publication, (269), 11–18.
Batelaan, O., & De Smedt, F. (2007). GIS-based recharge estimation by coupling surface-subsurface water
balances. Journal of Hydrology, 337(3–4), 337–355. https://doi.org/10.1016/j.jhydrol.2007.02.001
Baxter, C. (2016). Gradient Effects on Measured Hydraulic Conductivity Submitted to the Faculty of
Christopher David Price Baxter In Partial Fulfillment of the Requirements for the Degree of Master
of Science in Civil Engineering August 1994. (January 1994).
https://doi.org/10.13140/RG.2.2.24655.07845
Canora, F., Rizzo, G., Panariello, S., & Sdao, F. (2019). Hydrogeology and hydrogeochemistry of the lauria
mountains northern sector groundwater resources (basilicata, italy). Geofluids, 2019, 1–16.
https://doi.org/10.1155/2019/7039165
Chandra Bose, A. S., Giridhar, M. V. S. S., & Viswanadh, G. K. (2010). Identification of groundwater
potential zones using RS and GIS. 31st Asian Conference on Remote Sensing 2010, ACRS 2010, 1,
327–333.
CSA, MOWIE, World Bank, UNICEF, W. and J. (2017). Drinking Water Quality in Ethiopia. Results from
the 2016 Ethiopia Socioeconomic Survey. (December), 22.
Demelash, H., Beyene, A., Abebe, Z., & Melese, A. (2019). Fluoride concentration in ground water and
prevalence of dental fluorosis in Ethiopian Rift Valley: Systematic review and meta-analysis. BMC
Public Health, 19(1). https://doi.org/10.1186/s12889-019-7646-8
Dereje, B., & Nedaw, D. (2019). Groundwater Recharge Estimation Using WetSpass Modeling in Upper
Bilate Catchment, Southern Ethiopia. Momona Ethiopian Journal of Science, 11(1), 37.
https://doi.org/10.4314/mejs.v11i1.3
Dhar, A., Sahoo, S., Dey, S., & Sahoo, M. (2014). Evaluation of Recharge and Groundwater Dynamics of
a Shallow Alluvial Aquifer in Central Ganga Basin, Kanpur (India). Natural Resources Research,
23(4), 409–422. https://doi.org/10.1007/s11053-014-9251-y
Dinu, C., Drobot, R., Pricop, C., & Blidaru, T. V. (2017). Flash-Flood Modelling With Artificial Neural.
Mathematical Modelling in Civil Engineering, 13(3), 10–20. https://doi.org/10.1515/mmce
Page 96
Groundwater Recharge estimation and Aquifer Characterization of Walga Catchment, Upper Gibe basin, Central Ethiopia
Tekalign Wakjira Hydrology and Water Resources Page 83
Editor, S., Carlos, J., & Cerezal, S. (n.d.). Springer Hydrogeology.
Edmond Moeletsi, M., Phumlani Shabalala, Z., De Nysschen, G., & Walker, S. (2016). Evaluation of an
inverse distance weighting method for patching daily and dekadal rainfall over the free state province,
South Africa. Water SA, 42(3), 466–474. https://doi.org/10.4314/wsa.v42i3.12
Eilers, A., Miller, J., Watson, A., & Sigidi, N. (2017). Groundwater Recharge Quantification from
Historical Rainfall Records and Salinity Profiling in the RAMSAR Listed Verlorenvlei Catchment,
South Africa. Procedia Earth and Planetary Science, 17, 586–589.
https://doi.org/10.1016/j.proeps.2016.12.150
Erickson, T. O., & Stefan, H. G. (2008). Baseflow analysis of the Upper Vermillion River, Dakota County,
Minnesota. University of Minnesota St. Anthony Falls Laboratory Project Report, (507), 55.
Ewusi, A., & Kuma, J. S. Y. (2014). Groundwater Assessment for Current and Future Water Demand in
the Daka Catchment, Northern Region, Ghana. Natural Resources Research, 23(4), 355–365.
https://doi.org/10.1007/s11053-014-9227-y
Fejerskov, O., Larsen, M. J., Richards, A., & Baelum, V. (1994). Dental tissue effects of fluoride. Advances
in Dental Research, 8(1), 15–31. https://doi.org/10.1177/08959374940080010601
Fipps, G. (1995). Standards and Salinity Management and Salinity Management Water Analysis : Agrilife
Extension, 4(3), 1–17.
Gintamo, T. T. (2015). Ground Water Potential Evaluation Based on Integrated GIS and Remote Sensing
Techniques, in Bilate River Catchment: South Rift Valley of Ethiopia. American Scientific Research
Journal for Engineering, Technology, and Sciences (ASRJETS) ISSN (Print), (January), 2313–4410.
Retrieved from http://asrjetsjournal.org/
Goulburn-Murray Water (GMW). (2010). Groundwater Terms and definitions. Goulbourn-Muray Water,
(February), 1–22.
Graf, R., & Przybyłek, J. (2018). Application of the WetSpass simulation model for determining conditions
governing the recharge of shallow groundwater in the Poznań Upland, Poland. Geologos, 24(3), 189–
205. https://doi.org/10.2478/logos-2018-0020
Haile, M. Z., & Mohammed, E. T. (2019). Analysis of Physico-chemical Characteristics of Water Collected
from Different Sampling Sites of Lake Hawassa ,. 9(2), 38–45.
https://doi.org/10.5923/j.env.20190902.02
Halford, K. J., Weight, W. D., & Schreiber, R. P. (2006). Interpretation of transmissivity estimates from
single-well pumping aquifer tests. Ground Water, 44(3), 467–471. https://doi.org/10.1111/j.1745-
6584.2005.00151.x
Hamerlynck, O. (2013). Water conflict. In New Scientist (Vol. 218). https://doi.org/10.1016/S0262-
4079(13)60875-1
Hammouri, N., El-Naqa, A., & Barakat, M. (2012). An Integrated Approach to Groundwater Exploration
Using Remote Sensing and Geographic Information System. Journal of Water Resource and
Protection, 04(09), 717–724. https://doi.org/10.4236/jwarp.2012.49081
Hasanuzzaman, M., Song, X., Han, D., Zhang, Y., & Hussain, S. (2017). Prediction of groundwater
dynamics for sustainable water resource management in bogra district, northwest bangladesh. Water
(Switzerland), 9(4). https://doi.org/10.3390/w9040238
Hoque, M. A., & Burgess, W. G. (2012). 14C dating of deep groundwater in the Bengal Aquifer System,
Bangladesh: Implications for aquifer anisotropy, recharge sources and sustainability. Journal of
Hydrology, 444–445, 209–220. https://doi.org/10.1016/j.jhydrol.2012.04.022
Hussein, A.-A., Govindu, V., & Nigusse, A. G. M. (2017). Evaluation of groundwater potential using
geospatial techniques. Applied Water Science, 7(5), 2447–2461. https://doi.org/10.1007/s13201-016-
0433-0
I, A. E., P, F. I., Resources, W., & State, C. R. (2018). Determination of Aquifer Hydraulic Parameters
Using Single Well Pumping Test Borehole Data within Boki Local Government Area , Cross River
State , South Eastern Nigeria. 8(3), 26–36.
I, Yu, C., Chen, R., Li, J. J., Li, J. J., Drahansky, M., … Reading, F. (2012). We are IntechOpen , the world
’ s leading publisher of Open Access books Built by scientists , for scientists TOP 1 %. Intech,
Page 97
Groundwater Recharge estimation and Aquifer Characterization of Walga Catchment, Upper Gibe basin, Central Ethiopia
Tekalign Wakjira Hydrology and Water Resources Page 84
i(tourism), 13. https://doi.org/10.1016/j.colsurfa.2011.12.014
In, S., Africa, S., Lorentz, S., & Hughes, G. O. (2003). TECHNIQUES FOR ESTIMATING
GROUNDWATER RECHARGE AT DIFFERENT Groundwater Recharge Estimation in Southern
Africa Edited by Published by UNESCO Paris Printed in Cape Town.
Jhariya, D. C., Kumar, T., Gobinath, M., Diwan, P., & Kishore, N. (2016). Assessment of groundwater
potential zone using remote sensing, GIS and multi criteria decision analysis techniques. Journal of
the Geological Society of India, 88(4), 481–492. https://doi.org/10.1007/s12594-016-0511-9
Kawo, N. S., & Karuppannan, S. (2018). Groundwater quality assessment using water quality index and
GIS technique in Modjo River Basin, central Ethiopia. Journal of African Earth Sciences, 147(June),
300–311. https://doi.org/10.1016/j.jafrearsci.2018.06.034
Khadri, S. F. R., & Moharir, K. (2016). Characterization of aquifer parameter in basaltic hard rock region
through pumping test methods: a case study of Man River basin in Akola and Buldhana Districts
Maharashtra India. Modeling Earth Systems and Environment, 2(1), 1–18.
https://doi.org/10.1007/s40808-015-0047-9
Kumar, P. J. S. (2014). Interpretation of groundwater chemistry using piperand chadha ´ s diagrams : a
comparative study from perambalur taluk Geoscience Interpretation of groundwater chemistry using
piper and chadha ´ s diagrams : a comparative study from perambalur taluk. (January 2013).
Lapworth, D. J., Krishan, G., MacDonald, A. M., & Rao, M. S. (2017). Groundwater quality in the alluvial
aquifer system of northwest India: New evidence of the extent of anthropogenic and geogenic
contamination. Science of the Total Environment, 599–600(May), 1433–1444.
https://doi.org/10.1016/j.scitotenv.2017.04.223
Manikandan, J., Kiruthika, A. M., & Sureshbabu, S. (2014). Evaluation of groundwater potential zones in
Krishnagiri District , Tamil Nadu using MIF Technique. International Journal of Innovative Research
in Science, Engineering and Technology, 3(3), 10524–10534.
Meier, P. M., Carrera, J., & Sánchez-Vila, X. (1998). An evaluation of Jacob’s method for the interpretation
of pumping tests in heterogeneous formations. Water Resources Research, 34(5), 1011–1025.
https://doi.org/10.1029/98WR00008
Meresa, E., & Taye, G. (2018). Estimation of groundwater recharge using GIS-based WetSpass model for
Birki watershed, the eastern zone of Tigray, Northern Ethiopia. Sustainable Water Resources
Management, 0(0), 0. https://doi.org/10.1007/s40899-018-0282-0
Meybeck, M., Kuusisto, E., Mäkelä, A., & Mälkki, E. (1996). Quality Water. Water Quality Monitoring -
A Practical Guide to the Design and Implementation of Freshwater Quality Studies and Monitoring
Programmes, 1–22.
Modelling, M., Engineering, C., Mawlood, D. K., Region, K., Mustafa, J. S., Directorate, G., & Region, K.
(2016). COOPER-JACOB ’ S METHOD FOR ESTIMATING OF THE AQUIFER PARAMETERS.
12(1), 9–20. https://doi.org/10.1515/mmce
Murthy, K. S. R., Amminedu, E., & Venkateswara Rao, V. (2003). Integration of thematic maps through
GIS for identification of groundwater potential zones. Journal of the Indian Society of Remote
Sensing, 31(3), 197–210. https://doi.org/10.1007/BF03030826
Nag, S. K. (2008). Application of remote sensing and GIS in groundwater exploration. Groundwater
Dynamics in Hard Rock Aquifers: Sustainable Management and Optimal Monitoring Network Design,
3(10), 87–92. https://doi.org/10.1007/978-1-4020-6540-8_5
Nagarajan, M., & Singh, S. (2009). Assessment of groundwater potential zones using GIS technique.
Journal of the Indian Society of Remote Sensing, 37(1), 69–77. https://doi.org/10.1007/s12524-009-
0012-z
Naranjo, G., Cruz-Fuentes, T., Cabrera, M. del C., & Custodio, E. (2015). Estimating natural recharge by
means of chloride mass balance in a volcanic aquifer: Northeastern Gran Canaria (Canary Islands,
Spain). Water (Switzerland), 7(6), 2555–2574. https://doi.org/10.3390/w7062555
Nur, A., Ishaku, J. M., & Yusuf, S. N. (2012). Groundwater Flow Patterns and Hydrochemical Facies
Distribution Using Geographical Information System (GIS) in Damaturu, Northeast Nigeria.
International Journal of Geosciences, 03(05), 1096–1106. https://doi.org/10.4236/ijg.2012.35111
Page 98
Groundwater Recharge estimation and Aquifer Characterization of Walga Catchment, Upper Gibe basin, Central Ethiopia
Tekalign Wakjira Hydrology and Water Resources Page 85
Oikonomidis, D., Dimogianni, S., Kazakis, N., & Voudouris, K. (2015). A GIS/Remote Sensing-based
methodology for groundwater potentiality assessment in Tirnavos area, Greece. Journal of Hydrology,
525, 197–208. https://doi.org/10.1016/j.jhydrol.2015.03.056
Patil, P. N., Sawant, D. V, & Deshmukh, R. N. (2012). Physico-chemical parameters for testing of water –
A review. 3(3), 1194–1207.
Pollution, G., & Recharge, A. (2015). MIEA & Erasmus Mundus GroundwatCH · Groundwater
Pollution and Protection · (M. Teresa Condesso de Melo). Retrieved from
https://fenix.tecnico.ulisboa.pt/downloadFile/1970943312278793/GROUNDWATER
RECHARGE.pdf
Rahmanian, N., Hajar, S., Ali, B., Homayoonfard, M., Ali, N. J., Rehan, M., … Nizami, A. S. (2015).
Analysis of Physiochemical Parameters to Evaluate the Drinking Water Quality in the State of Perak
, Malaysia. 2015(Cd).
Rahmati, O., Pourghasemi, H. R., & Melesse, A. M. (2016). Application of GIS-based data driven random
forest and maximum entropy models for groundwater potential mapping: A case study at Mehran
Region, Iran. Catena, 137, 360–372. https://doi.org/10.1016/j.catena.2015.10.010
Rajesh, R., Brindha, K., & Techniques, G. (2019). Hydrogeochemistry Methods for Assessing the
Groundwa- ter Quality.
Romman, Z. A., Al-bakri, J., & Kuisi, M. Al. (2019). Estimation of Rainfall Missing Data in an Arid Area
using Spatial and EM Estimation of Rainfall Missing Data in an Arid Area using Spatial and EM
Methods. (March). https://doi.org/10.9790/9622-
Rukundo, E., & Doğan, A. (2019). Dominant influencing factors of groundwater recharge spatial patterns
in Ergene river catchment, Turkey. Water (Switzerland), 11(4). https://doi.org/10.3390/w11040653
Rushton, K. R. (1991). Groundwater support of stream flows in the Cambridge area , UK. (202), 367–376.
Salem, A. (n.d.). Assessment of Groundwater Recharge , Evaporation , and Runoff in the Drava Basin in
Hungary with the WetSpass Model. 1–11. https://doi.org/10.3390/hydrology6010023
Sattari, M., Rezazadeh-joudi, A., & Kusiak, A. (2016). Uncorrected Proof missing data in precipitation
studies Uncorrected Proof. 1–13. https://doi.org/10.2166/nh.2016.364
Scanlon, B. R., Healy, R. W., & Cook, P. G. (2002). Choosing appropriate techniques for quantifying
groundwater recharge. Hydrogeology Journal, 10(1), 18–39. https://doi.org/10.1007/s10040-001-
0176-2
Sener, E., Davraz, A., & Ozcelik, M. (2005). An integration of GIS and remote sensing in groundwater
investigations: A case study in Burdur, Turkey. Hydrogeology Journal, 13(5–6), 826–834.
https://doi.org/10.1007/s10040-004-0378-5
Solomon, S., & Quiel, F. (2006). Groundwater study using remote sensing and geographic information
systems (GIS) in the central highlands of Eritrea. Hydrogeology Journal, 14(5), 729–741.
https://doi.org/10.1007/s10040-005-0477-y
Tank, D. K., & Chandel, C. P. S. (2010). Analysis Of The Major Ion Constituents In Groundwater Of Jaipur
City. 2(5), 1–7.
Tekle-Haimanot, R., Melaku, Z., Kloos, H., Reimann, C., Fantaye, W., Zerihun, L., & Bjorvatn, K. (2006).
The geographic distribution of fluoride in surface and groundwater in Ethiopia with an emphasis on
the Rift Valley. Science of the Total Environment, 367(1), 182–190.
https://doi.org/10.1016/j.scitotenv.2005.11.003
Teklebirhan, A., Dessie, N., & Tesfamichael, G. (2012). Groundwater Recharge, Evapotranspiration and
Surface Runoff Estimation Using WetSpass Modeling Method in Illala Catchment, Northern Ethiopia.
Momona Ethiopian Journal of Science, 4(2), 96. https://doi.org/10.4314/mejs.v4i2.80119
Tilahun, K., & Merkel, B. J. (2009). Estimation of groundwater recharge using a GIS-based distributed
water balance model in Dire Dawa , Ethiopia. 1443–1457. https://doi.org/10.1007/s10040-009-0455-
x
Tse, A., & Amadi, P. (2010). Hydraulic properties from pumping tests data of aquifers in Azare area, North
Eastern Nigeria. Journal of Applied Sciences and Environmental Management, 11(4).
https://doi.org/10.4314/jasem.v11i4.55198
Page 99
Groundwater Recharge estimation and Aquifer Characterization of Walga Catchment, Upper Gibe basin, Central Ethiopia
Tekalign Wakjira Hydrology and Water Resources Page 86
Velasquez, M., & Hester, P. T. (2013). An Analysis of Multi-Criteria Decision Making Methods. 10(2), 56–
66.
Waikar, M. L., & Nilawar, A. P. (2014). Identification of Groundwater Potential Zone using Remote
Sensing and GIS Technique. 3(5), 12163–12174.
Wang, S., Sheng, Z., Xi, Y., Ma, X., Zhang, H., Kang, M., … Han, Z. (n.d.). The Application of the Analytic
Hierarchy Process and a New Correlation Algorithm to Urban Construction and Supervision Using
Multi-Source Government Data in Tianjin. https://doi.org/10.3390/ijgi7020050
Whitaker, R., & Foundation, C. D. (2017). The Analytic Hierarchy Process – What It Is and How It Is Used.
0255(December 1987). https://doi.org/10.1016/0270-0255(87)90473-8
Xia, Y., Fabian, P., Stohl, A., & Winterhalter, M. (1999). Forest climatology: Estimation of missing values
for Bavaria, Germany. Agricultural and Forest Meteorology, 96(1–3), 131–144.
https://doi.org/10.1016/S0168-1923(99)00056-8
Yair, A., & Kossovsky, A. (2002). Climate and surface properties: Hydrological response of small arid and
semi-arid watersheds. Geomorphology, 42(1–2), 43–57. https://doi.org/10.1016/S0169-
555X(01)00072-1
Yeh, H. F., Cheng, Y. S., Lin, H. I., & Lee, C. H. (2016a). Mapping groundwater recharge potential zone
using a GIS approach in Hualian River, Taiwan. Sustainable Environment Research, 26(1), 33–43.
https://doi.org/10.1016/j.serj.2015.09.005
Yeh, H. F., Cheng, Y. S., Lin, H. I., & Lee, C. H. (2016b). Mapping groundwater recharge potential zone
using a GIS approach in Hualian River, Taiwan. Sustainable Environment Research, 26(1), 33–43.
https://doi.org/10.1016/j.serj.2015.09.005
Yenehun, A., Walraevens, K., & Batelaan, O. (2017). Spatial and temporal variability of groundwater
recharge in Geba basin, Northern Ethiopia. Journal of African Earth Sciences, 134, 198–212.
https://doi.org/10.1016/j.jafrearsci.2017.06.006
Zeinolabedini, M., & Esmaeily, A. (2015). Groundwater potential assessment using geographic information
systems and AHP method (case study: Baft city, Kerman, Iran). International Archives of the
Photogrammetry, Remote Sensing and Spatial Information Sciences - ISPRS Archives, 40(1W5), 769–
774. https://doi.org/10.5194/isprsarchives-XL-1-W5-769-2015
Page 100
Groundwater Recharge estimation and Aquifer Characterization of Walga Catchment, Upper Gibe basin, Central Ethiopia
Tekalign Wakjira Hydrology and Water Resources Page 87
Appendices
Annex 1: Mean monthly annual rainfall of Walga catchment
Years Jan Feb Mar Apr May Jun Jul Aug Sep Oct Nov Dec
1997 40.37857 0.1 66.54286 107.5557 74.31429 179.9714 271.4571 178.9129 102.4143 88.79286 51.91429 0.4
1998 53.18571 35.45714 72.58571 76.4 158.2214 274.0686 330.0929 318.2743 153.43 66.93857 4.008571 0
1999 8.785714 3.485714 27.45714 20.91429 104.4143 183.3714 281.0714 272.8286 151.8957 153.0429 0.185714 3.301429
2000 1.575714 2.628571 10.61429 78.91143 90.45714 142.5271 250.5714 235.3057 187.1286 59.81429 30.48571 13.57143
2001 5.528571 10.08571 90.2 60.88571 148.6857 190.4 322.4143 256.2 117.8 55.15714 13.74286 2.357143
2002 54.98571 40.02857 129.5286 46.74286 77.3 213.2286 247.3757 234.7343 85.82857 2.998571 0 40.52857
2003 31.11429 37.82857 73.11429 115.0571 18.94286 191.8714 290.5143 275.9429 153.7114 15.51429 6.914286 15.35714
2004 61.7 19.37143 43.97 111.5857 54.67143 220.2429 261.7271 247.2857 163.0429 46.95714 5.228571 6.457143
2005 49.32083 1.997917 92.03542 110.6604 89.65833 181.575 257.55 221.3625 175.9875 61.2 27.475 0.55
2006 6.5125 27.8875 104.7375 86.86125 115.875 183.5625 296.5175 312.8313 140.2875 60.5375 23.50292 22.0875
2007 40.875 56.7 54.7375 84.125 175.5125 248.9 322.7875 270.5 205.4625 33.85 0 0
2008 0.277083 3.7 8.160417 49.00417 200.4125 206.25 326.875 276.7375 140 63.25417 67.5 1.60625
2009 31.1325 25.2275 47.11875 68.52125 82.76125 122.1125 253.1875 300.475 117.2625 106.8563 0.78125 31.2625
2010 19.95 69.7 76.325 87.4125 186.2125 188.6688 315.4813 312.4792 144.8125 9.479167 17.18958 36.375
2011 19.7625 8.39875 44.3625 91.3 154.7958 187.46 264.0517 290.4038 183.8917 14.64458 39.15625 1.23375
2012 6.271875 7.198333 23.55292 87.10313 75.44396 170.1354 271.0425 216.385 201.9531 34.62813 6.708333 4.998958
2013 2.538958 6.163333 62.21583 121.8713 134.7938 171.7646 261.0736 247.3625 152.5538 87.8125 12.53125 1.873958
2014 13.00688 37.79125 64.2125 47.17708 193.1613 143.3646 281.0958 183.8854 187.9146 40.59438 9.187292 1.417708
2015 15.73875 18.2375 55.87 42.49 143.6613 166.5963 265.6083 202.3625 122.9 7.445625 20.59104 13.90271
2016 27.91458 7.1375 54.21875 165.3 224.3338 189.1031 196.105 243.72 183.41 30.24 20.48083 13.62271
2017 2.48875 24.13875 39.57375 68.79875 138.0388 157.445 230.5263 270.9094 155.7313 112.2125 33.22688 4.585
2018 9.91875 13.85 73.6675 163.4813 189.1588 154.8013 167.8925 200.3775 107.4888 61.49875 100.0238 7.0775
Page 101
Groundwater Recharge estimation and Aquifer Characterization of Walga Catchment, Upper Gibe basin, Central Ethiopia
Tekalign Wakjira Hydrology and Water Resources Page 88
Annex 2: Chemical parameters of DBH, SBH, HDW and MBH
SN X Y Z,(m) Depth,
(m) SWL,m Aquifer_Lith. T oC Ph EC(µS/cm) TDS
NH3
(mg/l)
Na (mg/l
)
K
(mg/l)
TH
(mg/l)
Ca
(mg/l Ca)
1 358290 926080 1699 459 82.0
Fractured
Basalt 28 9.660 994 209 0.260 72 0.500 20.000 4.800
2 370781 943250 1867 470.52 29.3 Bsaltic 24.7 7.66 974 595 0.55 230 7.85 40 11.5
3 385801 939409 1953 473.58 65
Basalt and
ignimbrite 30 7 920 598 1.35 200 19 69.7 18.4
4 389562 922209 1931 450 98 pyroclastic 7.05 515 340 0.340 118 9.100 42.840 14.690
5 375734 926348 1787 360 8.9
Fractured
Basalt 7.930 565 360 1.510 115 3.400 32.000 8.000
6 357700 944225 1822 360 25 Basaltic 8.28 287 168 0.05 72 2 108 4
7 383826 947387 2058 265 0 Fractured Basalt 7.790 835 476 0.340 166 12.500 26.600 6.080
8 408282 939498 2311 360 22 Pyroclastic 7.35 413 236 0.17 76 9 32.3 8
9 363415 915588 1788 280 98 Pyroclastic 9.46 414 216 0.17 89 1 28.8 4
10 376617 902505 1941 347 57 Pyroclastic 6.90 425 278 0.20 64 10 78.3 26.4
11 386183 943986 2023 108 0 Basaltic / Ash 29 9.000 303 190 0.25 61 3.000 22.000 5.000
12 387549 945858 2067 93 0.0 Basaltic /Ash 8.51 303 190 0.25 61 3.2 21.7 5.2
13 393191 944399 2153 47 0 Pyroclastic 40.5 7.000 741 488 0.13 147 9.000 33.000 11.000
14 342165 903933 1654 45 0 Basaltic 24.1 7.51 490 320 0.19 20 7.6 209 67.6
15 339077 902523 1685 60 20 Basaltic 20.7 6.92 360 232 0.17 16 3.3 142.5 45.6
17 342000 903672 1669 60 Basaltic
18 342369 903357 1655 8 1 Basaltic 18.7 6.98 465 304 0.22 31 6.3 186.2 60.8
19 337131 931265 1525 39 10 20.7 7.34 652 420 0.2 82 7.5 190 50.16
20 337246 929566 1538 52 33 7.29 617 404 0.39 45 6.1 247 76
21 337688 927934 1548 54 11 7.87 1316 852 0.11 282 7.1 30.4 6.84
22 338664 924779 1527 51 23 Basaltic 7.34 1193 770 0.2 190 19 210.9 63.1
23 340300 924367 1551 Basaltic 7.18 1080 700 0.48 124 14 269.8 73.7
24 340966 924430 1558 130 Basaltic 7.28 1246 810 0.28 158 14.5 323 85.1
25 339029 924979 1519 Basaltic 20.8 7.29 1116 720 0.65 194 15.5 191.9 53.2
26 341088 924567 1557 81 35 Basaltic 20.9 8.01 726 466 0.73 125 11 89.3 19
27 340662 924050 1547 54 Basaltic 21.9 7.05 890 570 0.36 84 10.7 285 79.04
28 342102 923134 1526 58 42 Basaltic 22.7 7.18 1301 842 0.71 198 13.8 307.8 55.5
29 343453 924775 1587 61 41 Basaltic 23.1 7.08 939 604 0.59 50 9.1 418 102.6
30 342266 922432 1533 54 Basaltic 22.2 7.05 1275 826 0.65 126 9.2 446.5 129.2
31 343035 921923 1547 92 48 Basaltic 23.1 7.55 1166 754 0.29 220 11.6 152 34.2
32 343578 920886 1540 70 Basaltic 23 6.64 1555 1008 0.73 102 15 665 155.8
33 344574 921296 1549 Basaltic 21 7.08 782 510 0.43 28 5.3 351.5 123.9
Page 102
Groundwater Recharge estimation and Aquifer Characterization of Walga Catchment, Upper Gibe basin, Central Ethiopia
Tekalign Wakjira Hydrology and Water Resources Page 89
34 344752 920691 1535 69 36 Basaltic 19.5 7.31 855 556 0.65 33 7.6 389.5 98.04
35 349391 918430 1632 Basaltic 21.8 9.23 575 374 0.08 134 3.4 19 3.8
36 347338 916729 1582 78 42 Basaltic 20.7 7.14 954 620 0.12 45 9.2 427.5 126.9
37 352791 917485 1668 10 Basaltic 19.5 7.12 820 536 0.12 46 6.5 361 98.8
38 352585 915007 1691 80 Basaltic 22.4 8.32 566 370 0.06 113 2.1 19 4.56
40 360489 912322 1747 82 Basaltic 20.9 7.99 442 282 0.12 87 2.7 47.5 14.44
41 387659 946376 2065 93 0 Basaltic 7.78 337 222 0.12 32 6.6 108.3 30.4
44 387835 943260 2037 297 5 Basaltic 7.84 1185 770 0.47 300 11 11.4 2.3
45 387802 943130 2034 300 5 Basaltic 16.9 8.000 180 680 236 12.000 23.000 6.000
46 386986 945147 2050 133 0 Basaltic 7.39 845 510 0.1888 130 23.5 86.8 27.8
47 383586 933863 1925 15 8 Basaltic 18.4 6.82 314 206 0.13 9 2.7 155.8 39.5
48 381713 933854 1896 100 7.46 Basaltic 7.28 339 222 0.16 18 6 136.8 35.7
49 379119 929764 1869 12 2.20 Pyroclastic 17 6.51 222 146 0.13 8 7.1 85.5 28.12
51 378206 930111 1858 50 5 Pyroclastic 21.4 7.09 517 338 0.23 22 4 237.5 76
52 376875 927146 1803 Pyroclastic 22.8 7.02 358 230 0.79 18 10 152 45.6
53 375476 924377 1812 9 8.2 Pyroclastic 19.1 6.74 573 374 0.17 27 20 178.6 57
54 372612 925524 1814 20 14 Basaltic 18.8 6.89 165 110 0.21 15 7.6 45.6 15.2
55 369056 924670 1812 10 Pyroclastic 19.2 6.63 286 190 0.09 16 8.3 106.4 34.2
56 367619 923308 1730 Pyroclastic 20.6 8.72 395 252 0.03 82 2.8 19 3.8
57 365029 924648 1743 60 28 Pyroclastic 20.5 7.41 506 290 0.12 39 16 172.9 57
58 364581 925183 1753 23 12.60 Pyroclastic 20.4 7.04 677 448 0.23 30 7.9 304 92.7
59 365125 925132 1763 14 7.60 Pyroclastic 20.1 7.43 448 286 0.13 33 8.8 157.7 53.96
60 358314 927117 1671 7 3 Basaltic 20 7.31 623 406 0.98 36 6.4 266 87.4
62 357207 927172 1647 8 3 Basaltic 22.4 7.27 685 448 0.49 58 6.5 258.4 73.7
63 365447 922747 1713 152 53.68 Basaltic 24.4 9.16 360 240 0.12 75 0.6 9.5 2.28
64 366637 921104 1746 146 29.38 Basaltic 8.39 439 286 0.23 90 5 28.5 7.6
65 367564 915793 1864 Pyroclastic 7.92 319 204 0.12 32 11.2 95 30.4
Page 103
Groundwater Recharge estimation and Aquifer Characterization of Walga Catchment, Upper Gibe basin, Central Ethiopia
Tekalign Wakjira Hydrology and Water Resources Page 90
66 365168 908852 1845 105 Basaltic 16.9 8.2 493 320 0.11 86 7.1 57 15.2
67 398319 885302 2881 175 14 6.64 107 72 0.05 9 5.8 32.3 7.6
69 406040 939023 2071 Pyroclastic 24.7 7.08 412 272 0.13 24 6 171 45.6
71 349638 939008 1781 54 10 Basaltic 20.9 7.14 807 532 0.17 72 11 307.8 100.3
72 351822 949233 1906 60 18 Trachy basalt 23.8 6.71 449 298 0.18 22 5.5 176.7 55.5
74 366001 952270 2065 Basaltic 17.6 6.45 241 166 0.12 10 3.3 95 24.3
75 370635 950938 2003 Basaltic 209 140 0 12 2 87 24
76 373172 928362 1782 66 17 Basaltic 8.000 431 282 0.18 30 5.000 181.000 55.000
77 352087 943847 1816 57 12.5 Trachy basalt 8.000 511 344 0.2 59 5.000 179.000 55.000
79 376015 902512 1928 66 25 Pyroclastic 7.000 222 66 0.08 11 4.000 29.000 6.000
80 377799 900288 1975 Pyroclastic 6.37 99 68 0.07 5 0.09 28.5 8
82 377401 897193 1989 25 Pyroclastic 6.000 158 64 0.1 7 6.000 30.000 7.000
83 377414 897350 1969 30 Pyroclastic 7 270 192 0.11 25 7.2 98.8 31.9
84 374345 933340 1839 61 5 Basaltic 7.000 425 270 0.12 24 5.000 186.000 54.000
85 381267 951278 2093 53 Basaltic 7 235 174 0.12 23 9.2 76 16.7
86 378626 961413 2572 173 Pyroclastic 82 7.000 235 154 0.12 23 9.000 76.000 17.000
87 377000 942000 1952 174 14.7 Basaltic 7.08 338 222 25 4 136.5 40.32
88 363500 939000 1779 53 15 Basaltic 7.55 7.55 978 642 186 12 128.1 40.32
89 363500 939000 1783 56 15 Basaltic 7.48 702 442 109 9.1 157.5 42
90 356500 937500 1721 56 16 Basaltic 9.15 382 228 88 0.9 14.7 4.2
91 378500 945500 2156 56 21 Basaltic 7 393 258 12 5.000 206.000
127 355538 900934 1858 147 7.000 320 0.324
128 355920 899064 1854 57 7.000 418 199 72.000
129 357237 898799 1829 63 7.000 345 164 0.051
130 358405 896016 1882 56 7.000 411 198
131 358975 892500 1918 149 8.000 393 276 0.347 3.000
132 359617 895285 1882 149 9.000 526 252 0.0017 9.000 239.000 14.000
Page 104
Groundwater Recharge estimation and Aquifer Characterization of Walga Catchment, Upper Gibe basin, Central Ethiopia
Tekalign Wakjira Hydrology and Water Resources Page 91
133 367270 905131 1902 172 7.000 408 30.000
134 368709 891744 1906 62 7.000 285 135 0.049
135 374419 908195 1876 226 8.000 468 325
136 381524 915483 1877 134 7.000 444 298 0.375 7.000 48.000 39.000
137 367147 916532 1859 200 41.7 pyroclastic 7.220 431 248 0.120 53 9.700 116.000 28.000
138 366872 916448 1863 200 76 pyroclastic 7.240 389 235 0.000 83 5.900 95.000 26.400
139 368739 906671 1901 215 65.05 pyroclastic 6.790 142 96 0.160 23 4.500 42.000 8.000
140 367928 905831 1887 226 157.6 6.950 243 146 0.470 20 4.700 91.080 25.340
Mg
(mg/l) Fe(mg/l)
Mn
(mg/l) F (mg/l)
Cl
(mg/l)
NO2
(mg/l)
NO3
(mg/l)
Alkalinity
(mg/l CaCo3)
Carbonate
(mg/l CO3)
Bicarbonate
(mg/l HCO3)
Sulphate
(mg/l
SO4)
Phosphat
e (mg/l
PO4)
Date of Analysis
Water
Point
Type
Rema
rk
1 0.080 Trace
1.300
38.72
0 0.001 1.090 110.000 Nil 31.720 20.880 0.860 DBH
2 2.5 0.01 Trace 0.25 127.5 0.005 335 Nil 409 11.5 0.25 DBH
3 5.9 0.07 Trace 6.12 29.54 0.01 247 Nil 301.44 3.12 0.08 DBH
4 1.470 0.130 Trace 0.870
23.03
0 0.010 0.200 234.300 Nil 285.850 22.490 0.330 15/12/2017 DBH
5 2.880 4.290 Trace
0.780 28.210 Trace 0.110 260.300 Nil 317.570 15.110 1.470 DBH
6 0.55 0.00 Trace 0.60 10.60 0 0.10 124.00 90 34 3 18.000 DBH
7 2.740 0.020 - 1.140 27.30 Trace 6.710 370.500 NIL 452.010 0.190 0.310 22/2/2012 DBH
Artesi
an
8 3.19 0.19 0 1.03 11.83 Trace 0.23 189.00
Nil 231 12 0.400 DBH
9 4.75 0.07 Trace 0.70 23.45 1 3.64 140.80 69 32 37 0.130 DBH
10 2.88 0.13 Trace 0.76 13.23 Trace 1.20 190.00 Nil 232 20 0.180 DBH
11 2.000 0 0 6.000 6.000 8.000 9.6 155.000 0.28 0.08 01-24-06 DBH
12 2.1 0 0 1.6 5.8 8 0 154.7 0.28 0.08 01-24-06 MBH
Artesi
an
13 1.000 0 0 6.000 11.28 0.000 0 438.000 7.15 0.164 04-18-06 SBH
14 9.66 Trace trace 0.64 7.6 66.2 210 Nil 256.2 0.29 0.2 SBH
15 6.9 0.02 0.05 0.63 5.7 30.2 160 Nil 195.2 1.1 0.46 MBH
17 MBH
18 8.28 0.01 0.05 0.82 14.25 26.7 222 Nil 270.8 0.3 0.43 HDW
Page 105
Groundwater Recharge estimation and Aquifer Characterization of Walga Catchment, Upper Gibe basin, Central Ethiopia
Tekalign Wakjira Hydrology and Water Resources Page 92
19 15.64 0.02 trace 0.73 3.8 25.6 370 Nil 451.4 0.29 0.38 SBH
20 13.8 0.02 0.02 0.8 3.8 5 336 Nil 409.9 0.38 0.36 SBH
21 3.22 0.11 0.02 0.55 36.1 8.11 580 Nil 707.6 76.8 0.26 SBH
22 12.9 0.08 0.02 0.62 62.7 6.9 460 Nil 561.2 116.3 0.41 SBH
23 20.7 0.02 trace 0.28 43.7 18.9 388 Nil 473.36 136 0.33 MBH
24 26.7 0.11 0.02 0.15 48.5 15.2 422 Nil 514.8 169.8 0.5 DBH
25 14.26 0.28 0.02 0.69 52.3 46.3 410 Nil 500.2 76.16 0.33 MBH
26 10.12 0.31 0.02 0.51 44.7 1.8 316 Nil 385.5 28.6 0.17 MBH
27 21.2 0.44 0.05 0.8 24.7 18.6 394 Nil 480.68 68.9 0.5 SBH
28 40.9 0.38 0.02 1.11 15.2 1.7 710 Nil 866.2 18.7 0.25 SBH
29 39.1 0.25 0.02 0.68 5.7 10.4 530 Nil 646.6 9 0.31 MBH
30 29.9 0.06 trace 0.58 62.7 47.9 576 Nil 702.7 65.2 0.32 SBH
31 16.5 0.31 0.02 0.74 16.15 1.4 570 Nil 695.7 9.6 0.41 MBH
32 66.7 Trace trace 0.82 20.9 1.3 948 Nil 1156.6 0.48 0.55 MBH
33 10.12 0.02 trace 0.68 9.5 31.8 400 Nil 488 1.05 0.28 MBH
34 34.96 0.02 trace 0.83 10.45 41.3 460 Nil 561.2 0.28 0.3 MBH
35 2.3 Trace trace 1.07 24.7 0.9 240 26.4 239.12 29.6 0.13 MBH
36 26.7 0.2 trace 0.7 15.2 84.7 490 Nil 597 0.57 0.3 MBH
37 27.6 Trace 0.07 0.65 9.5 7.5 450 Nil 549 0.19 0.44 HDW
38 1.84 0.03 0.03 0.74 60.8 28.4 138 9.6 148.8 40.3 0.29 MBH
40 2.76 0.02 trace 0.5 10.45 1.8 210 Nil 256.2 0.5 0.25 MBH
41 7.82 0.01 trace 0.97 8.55 9.1 168 Nil 204.96 0.19 0.37 MBH
44 1.38 0.02 trace 16.4 37.05 1.3 536 Nil 653.9 0.28 0.35 MBH
45 2.000 0.06 2.2 14.000 14.00 10.000 504 615.000 0.83 DBH
46 4.2 0.1 0.05 2 69.1 14.25 0 336 46.8 0.246 01-24-06 DBH
47 13.8 0.02 trace 0.39 19.95 58 86 Nil 104.9 0.57 0.13 HDW
48 11.5 0.02 trace 0.97 5.7 8.5 184 Nil 224 0.19 0.25 DBH
Page 106
Groundwater Recharge estimation and Aquifer Characterization of Walga Catchment, Upper Gibe basin, Central Ethiopia
Tekalign Wakjira Hydrology and Water Resources Page 93
49 3.68 0.24 0.03 0.22 10.45 32 88 Nil 97.6 1.4 0.25 HDW
51 11.5 Trace 0.02 1.45 3.8 29.1 264 Nil 322.1 0.28 0.19 HDW
52 9.2 0.12 0.03 1.2 5.7 1.39 184 Nil 224.5 1.4 0.76 HDW
53 7.8 0.32 0.03 0.18 2.85 129.9 76 Nil 92.72 47.6 0.41 HDW
54 1.84 0.13 trace 0.65 8.55 13.2 60 Nil 73.2 2.38 0.28 HDW
55 5.06 0.35 trace 0.9 10.5 14.1 130 Nil 158.6 0.48 0.33 HDW
56 2.3 0.02 trace 0.76 11.4 0.69 180 12 195.2 0.19 0.21 MBH
57 7.36 0.03 trace 0.65 3.8 2.67 260 Nil 317.2 0.19 0.13 MBH
58 17.5 0.02 trace 0.37 26.6 75.7 314 Nil 383.1 4 0.61 HDW
59 5.52 0.02 0.02 1.64 11.4 9.8 202 Nil 246.4 0.38 0.41 HDW
60 11.5 0.04 0.03 0.68 7.6 46.9 330 Nil 402.6 0.48 0.4 HDW
62 17.9 0.05 0.02 1.4 5.7 18.7 374 Nil 456.3 0.28 0.54 HDW
63 0.92 0.02 trace 1.3 24.7 0.4 124 19.2 112.24 26.4 0.11 DBH
64 2.3 0.03 0.02 0.93 11.4 1.5 212 9.6 239.1 9.9 0.09 DBH
65 4.6 0.22 0.02 1.46 3.8 0.84 154 Nil 187.9 0.19 0.16 MBH
66 4.6 0.02 trace 0.5 2.85 1.14 232 12 263.5 0.19 0.11 DBH
67 3.22 0.09 0.02 0.39 4.75 4.8 52 Nil 63.44 0.19 0.25 DBH
69 13.6 0.04 trace 0.66 6.65 8.7 210 Nil 256.2 0.47 0.26 MBH
71 13.8 0.03 trace 0.7 5.7 9.3 464 Nil 566.1 0.19 0.17 SBH
72 9.2 0.18 trace 0.8 23.8 78.2 150 Nil 183 2 0.26 MBH
74 9.18 0.11 trace 0.22 7.6 51.3 80 Nil 97.6 3.7 0.23 MBH
75 6 0 Trace 0.3 3.8 9.1 110 Nil 134.2 0.2 0.53 MBH
76 11.000 0.03 trace 0.000 11.33 25.000 228.9 Nil 279.000 1.43 0.15 MBH
77 10.000 0.03 trace 1.000 7.21 6.000 319.2 Nil 389.000 0.95 0.35 SBH
79 3.000 Trace 0.02 0.000 1 4.000 56 Nil 68.000 0.57 0.138 MBH
80 0.03 trace 0.46 1.90 6.70 50 Nil 61 0.19 0.09 MBH
82 3.000 0.09 0.03 0.000 1 1.000 48 Nil 59.000 0.19 0.49 SBH
83 4.6 0.23 0.02 1.03 1.9 1.3 140 Nil 170.8 0.19 0.27 SBH
84 12.000 0.03 0.02 0.5 2.85 3.000 230 Nil 281.000 0.1 0.24 MBH
85 8.28 0.23 trace 1.02 3.8 12.4 120 Nil 146.4 0.5 0.33 SBH
Page 107
Groundwater Recharge estimation and Aquifer Characterization of Walga Catchment, Upper Gibe basin, Central Ethiopia
Tekalign Wakjira Hydrology and Water Resources Page 94
86 8.000 0.23 trace 1.02 3.8 12.000 120 Nil 146.000 0.5 0.33 DBH
87 8.67 0.1 1.3 5.96 0.16 180 219.6 0.25 11-06-08 DBH
88 6.63 0.03 0.97 47.66 0.2 398 485.56 46.1 0.26 24/06/2008 SBH
89 12.75 0.01 0.93 3.97 0.22 364 444.08 22.4 0.19 24/06/2008 SBH
90 1.02 0.03 0.9 26.81 0.005 0.03 148 24 131.76 15.26 0.07 24/06/2008 SBH
91 17.000 0.05 0.000 0.000 0.000 216 264.000 3.31 0.17 MBH
127 0.000 1.000 249.6 305.000 DBH
128 1.000 2.000 166 166.000 MBH
129 1.000 1.000 140 140.000 MBH
130 1.000 146 146.000 MBH
131 1.000 4.000 201.6 19.2 207.000 DBH
132 0.000 154 16 138.000 DBH
133 1.000 0.000 218.96 267.000 DBH
134 0.000 1.000 106 106.000 MBH
135 1.000 0.000 5.63 254.000 DBH
136 1.000 4.000 220 269.000 DBH
137 11.040 0.600 0.320 0.584 5.840 0.020 0.660 195.700 Nil 238.750 25/02/2016 DBH
138 0.030 0.028 1.200 8.000 0.100 `1.5 165.000 26.400 198.400 5.000 23.000 DBH
139 0.040 Trace 0.620 2.770 0.020 0.220 82.000 Nil 100.040 0.300 0.280 DBH
140 0.200 0.020 0.650 3.580 0.010 0.210 132.670 Nil 161.850 0.590 0.350 DBH
Page 108
Groundwater Recharge estimation and Aquifer Characterization of Walga Catchment, Upper Gibe basin, Central Ethiopia
Tekalign Wakjira Hydrology and Water Resources Page 95
Annex 3: Hydrogeological parameters
SN X Y Z Depth,m SWL,m Aquifer_Lith. Q,l/s Sc, l/s/m DD,m T,
m2/day
EC
(µS/Cm)
Temp._o
C
Water Point
Type Remark
1 358290 926080 1699 459 82.0 Fractured Basalt 11 0.1970 53 20 994 28 DBH
2 364751 906029 1910 307 173.1 basalt 0.75 47.15 DBH
3 370781 943250 1867 470.5 29.3 Bsaltic
16.3
7 0.3 53.7 43.1 974 24.7 DBH
4 385801 939409 1953 473.6 65 Basalt and ignimbrite 60.7 2.76 22.02 6.66 920 30 DBH
5 389562 922209 1931 450 98 pyroclastic 20.3 0.41 49.13 36 488 DBH
6 375734 926348 1787 360 8.9 Fractured Basalt 3 0.0169 148 DBH
7 357700 944225 1822 360 25 Basaltic 5.3 0.043 124 24 287 DBH
8 383826 947387 2058 265 0 Fractured Basalt 22 0.2861 77 125 DBH Artesian
9 408282 939498 2311 360 22 Pyroclastic 24 1 43 43 413 DBH
10 363415 915588 1788 280 98 Pyroclastic 3 0 23 3 414 DBH
11 337295 929032 1526 354 114
Fractured trachy Basalt
& scoriacious basalt DBH
12 376617 902505 1941 347 57 Pyroclastic 25 4 7 604 425 DBH
13 386183 943986 2023 108 0 Basaltic overlaid by Ash 5.00 76 75.79 303 29 DBH
14 387305 945410 2052 100 0 Pyroclastic 54.66 MBH
15 387549 945858 2067 93 0.0
Basaltic overlaid by
Ash
11.1
0 12.68 MBH Artesian
16 389339 940715 1992 50 28.5 Pyroclastic SBH
17 408475 952876 2276 50 10 Basaltic SBH
18 407460 953526 2277 36 9 Trachy basalt SBH
19 381158 951315 2099 60 Basaltic SBH
20 383469 948467 2071 60 0 Basaltic 150 18.4 SBH
21 415254 939047 2378 47 SBH
22 412826 949736 2260 50 0 Pyroclastic SBH
23 402350 951544 2426 60 26.73 Pyroclastic 0.18 18 16.37 MBH
24 393964 957477 2489 61 39.12 Basaltic 0.14 6 8.58 MBH
25 397276 954511 2394 61 17.45 Basaltic 0.55 6 36.55 MBH
26 397540 953574 2376 60 17.93 Pyroclastic 0.15 6 34.87 MBH
Page 109
Groundwater Recharge estimation and Aquifer Characterization of Walga Catchment, Upper Gibe basin, Central Ethiopia
Tekalign Wakjira Hydrology and Water Resources Page 96
27 396861 952816 2388 36 20.48 Trachy basalt 2.17 6 4.17 SBH
28 398182 951093 2377 62 14.13 Pyroclastic 1.30 6 32.92 MBH
29 400409 954207 2376 48 21.58 Pyroclastic 4.00 6 4.65 SBH
30 398901 951499 2400 60 24.43 Basaltic 1.30 12 21.03 MBH
31 400317 931223 2150 66 38.35 Pyroclastic 0.12 23 14.75 MBH
32 394200 944338 2214 62 36.5 Pyroclastic 0.16 18.39 MBH
33 381500 933000 1928 100 7.33 Pyroclastic 5.60 42 3.72 MBH
34 393191 944399 2153 47 0 Pyroclastic
20.0
0 12 741 40.5 SBH
35 342165 903933 1654 45 0 Basaltic 300 24.1 SBH
36 339077 902523 1685 60 20 Basaltic 250 20.7 MBH
37 342000 903672 1669 60 Basaltic MBH
38 342369 903357 1655 8 1 Basaltic 320 18.7 HDW
39 337131 931265 1525 39 10 320 20.7 SBH
40 337249 931410 1538 41 15 3.00 320 SBH
41 337246 929566 1538 52 33 3.50 480 SBH
42 337688 927934 1548 54 11 1.50 970 SBH
43 338664 924779 1527 51 23 Basaltic 1.75 560 SBH
44 340300 924367 1551 Basaltic 470 MBH
45 340966 924430 1558 130 Basaltic 500 DBH
46 339029 924979 1519 Basaltic 520 20.8 MBH
47 341088 924567 1557 81 35 Basaltic 2.00 400 20.9 MBH
48 340662 924050 1547 54 Basaltic 2.50 410 21.9 SBH
49 342102 923134 1526 58 42 Basaltic 2.50 530 22.7 SBH
50 343453 924775 1587 61 41 Basaltic 3.50 430 23.1 MBH
51 342266 922432 1533 54 Basaltic 500 22.2 SBH
52 343035 921923 1547 92 48 Basaltic 3.5 500 23.1 MBH
53 343578 920886 1540 70 Basaltic 580 23 MBH
54 344574 921296 1549 Basaltic 390 21 MBH
55 344752 920691 1535 69 36 Basaltic 0.50 410 19.5 MBH
56 344600 920184 1532 81 24 Basaltic 3.00 430 20.5 MBH
Page 110
Groundwater Recharge estimation and Aquifer Characterization of Walga Catchment, Upper Gibe basin, Central Ethiopia
Tekalign Wakjira Hydrology and Water Resources Page 97
57 345006 920268 1521 82 27 Basaltic 1.75 360 21.8 MBH
58 345108 920062 1545 74 50 Basaltic 0.50 380 21.8 MBH
59 346814 919983 1582 74 50 Basaltic 0.50 380 22.1 MBH
60 346819 920574 1562 Basaltic 370 21.3 MBH
61 349391 918430 1632 Basaltic 330 21.8 MBH
62 347338 916729 1582 78 42 Basaltic 420 20.7 MBH
63 348795 916923 1624 115 Basaltic DBH
64 348571 919246 1612 Basaltic 370 24.4 MBH
65 350867 918698 1615 52 16 Basaltic 1.00 370 20.7 SBH
66 352791 917485 1668 10 Basaltic 390 19.5 HDW
67 352585 915007 1691 80 Basaltic 330 22.4 MBH
68 353117 915342 1719 39 Basaltic SBH
69 352065 916658 1683 90 Basaltic MBH
70 355341 916638 1732 204 Basaltic DBH
71 354023 915772 1716 84 Basaltic 320 22.3 MBH
72 355882 914531 1541 84 Basaltic 310 22 MBH
73 356903 915385 1761 85 Basaltic MBH
74 356884 914283 1716 Basaltic 350 21.5 MBH
75 357443 913873 1722 64 Basaltic 350 20.2 MBH
76 360489 912322 1747 82 Basaltic 280 20.9 MBH
77 387659 946376 2065 93 0 Basaltic 11.1 12.68 MBH
78 388820 947604 2085 148 5 Basaltic DBH
79 375409 928322 1846 80 7.46 Basaltic 5.6 200 23.2 MBH
80 375733 928451 1846 14 2 Basaltic 230 21.6 HDW
81 377246 929075 1861 12 2 Basaltic 260 17.7 HDW
82 387025 943705 2052 9 Basaltic HDW
83 387835 943260 2037 297 5 Basaltic 7.50 1185 MBH
84 387802 943130 2034 300 5 Basaltic 7.50 44.04 180 16.9 DBH
85 386986 945147 2050 133 0 Basaltic
11.1
0 845 DBH
86 383711 933823 1926 15 9 Basaltic HDW
87 383586 933863 1925 15 8 Basaltic 150 18.4 HDW
88 383538 933892 1926 15 10 Basaltic 200 17.6 HDW
89 382633 934291 1913 15 8 Basaltic 180 21.1 HDW
Page 111
Groundwater Recharge estimation and Aquifer Characterization of Walga Catchment, Upper Gibe basin, Central Ethiopia
Tekalign Wakjira Hydrology and Water Resources Page 98
90 382560 934038 1924 16 11 Basaltic 150 18 HDW
91 381713 933854 1896 100 7.46 Basaltic 5.6 339 DBH
92 381304 933280 1896 16 Basaltic 200 19.3 HDW
93 379119 929764 1869 12 2.20 Pyroclastic 180 17 HDW
94 379015 929886 1856 10 Pyroclastic 140 18.5 HDW
95 379757 929087 1905 12 Pyroclastic 3.00 210 22.6 HDW
96 379726 928664 1879 15 Pyroclastic 250 20.1 HDW
97 378805 929216 1870 15 Pyroclastic 150 19 HDW
98 378206 930111 1858 50 5 Pyroclastic 270 21.4 HDW
99 379297 930413 1864 22 Pyroclastic 250 19.1 HDW
100 379714 930273 1872 Pyroclastic 210 22 HDW
101 374091 926846 1829 17 Basaltic 200 20.6 HDW
102 376875 927146 1803 Pyroclastic 230 22.8 HDW
103 375881 926048 1788 12 10 Pyroclastic 200 20 HDW
104 375476 924377 1812 9 8.2 Pyroclastic 310 19.1 HDW
105 372612 925524 1814 20 14 Basaltic 140 18.8 HDW
106 372198 924591 1761 15 11 Pyroclastic 180 19.7 HDW
107 372148 924659 1780 14 13 Pyroclastic 158 20.5 HDW
108 372178 924570 1783 10 9 Pyroclastic 190 19.7 HDW
109 371819 924542 1773 60 Pyroclastic 260 25.6 MBH
110 373129 924713 1781 Pyroclastic 310 23.8 MBH
111 371319 925254 1793 9 8 Pyroclastic 140 16.6 HDW
112 369812 924396 1828 19 14.70 Pyroclastic 190 19 HDW
113 369056 924670 1812 10 Pyroclastic 200 19.2 HDW
114 369578 924736 1829 17 13.40 Pyroclastic 180 18.8 HDW
115 369399 923494 1807 12 Pyroclastic HDW
116 369057 923489 1812 18 5.20 Pyroclastic 430 19.8 HDW
117 369100 923299 1801 9 1.80 Pyroclastic 200 19.2 HDW
118 369141 923357 1808 8 3.00 Pyroclastic 300 20.1 HDW
119 369254 923373 1804 9 1.60 Pyroclastic 310 18.8 HDW
120 369317 923493 1818 10 5.70 Pyroclastic 230 20.5 HDW
121 369255 923511 1831 19 10.60 Pyroclastic 170 20.6 HDW
122 367619 923308 1730 Pyroclastic 260 20.6 MBH
123 365029 924648 1743 60 28 Pyroclastic 0.40 300 20.5 MBH
124 363868 925587 1748 75 Basaltic MBH
125 364581 925183 1753 23 12.60 Pyroclastic 340 20.4 HDW
Page 112
Groundwater Recharge estimation and Aquifer Characterization of Walga Catchment, Upper Gibe basin, Central Ethiopia
Tekalign Wakjira Hydrology and Water Resources Page 99
126 365125 925132 1763 14 7.60 Pyroclastic 260 20.1 HDW
127 358314 927117 1671 7 3 Basaltic 330 20 HDW
128 357207 927172 1647 8 3 Basaltic 330 22.4 HDW
129 358319 926963 1676 195 Basaltic DBH
130 364905 923161 1690 152 11.74 Basaltic 7.20 44.83 56.92 DBH
131 365433 923338 1693 200 34.55 Basaltic 2.40 104 0.616 DBH
132 365427 923242 1688 103 2.96 Basaltic 8.40 6.63 221.4 DBH
133 365447 922747 1713 152 53.68 Basaltic 4.68 83.13 1.76 240 24.4 DBH
134 366319 921583 1738 160 Basaltic 5.50 DBH
135 366637 921104 1746 146 29.38 Basaltic 10.0 51.92 439 DBH
136 369148 915960 1831 105 Pyroclastic DBH
137 369104 915815 1828 81 21.83 Pyroclastic 2.00 15.32 4.83 MBH
138 372001 916722 1843 68.5 11.95 Pyroclastic 2.50 39.39 13.73 348 25.1 MBH
139 369592 915660 1838 Pyroclastic 200 20 HDW
140 369739 915686 1849 14 8 Pyroclastic 210 20.1 HDW
141 367564 915793 1864 Pyroclastic 323 MBH
142 365168 908852 1845 105 Basaltic 300 16.9 DBH
143 365732 908980 1825 Basaltic 280 14.8 MBH
144 364468 907392 1894 78 Basaltic 131.5 18.7 MBH
145 358908 904545 1857 Pyroclastic 241 21.6 MBH
146 355924 903192 1809 73 Basaltic MBH
147 352242 903636 1744 75 Basaltic 310 MBH
148 393894 886062 2764 175 92.95 5.95 25.32 14.1 39.2 DBH
149 398319 885302 2881 175 92.4 14 DBH
150 397933 884153 2869 188 DBH
151 399310 885059 2905 48 SBH
152 406040 939023 2071 Pyroclastic 237 24.7 MBH
153 403037 937939 2256 10 Pyroclastic 225 17.5 HDW
154 387202 944167 2043 2 Basaltic HDW
155 347532 943211 1815 175 Basaltic DBH
156 349638 939008 1781 54 10 Basaltic 0.40 360 20.9 SBH
Page 113
Groundwater Recharge estimation and Aquifer Characterization of Walga Catchment, Upper Gibe basin, Central Ethiopia
Tekalign Wakjira Hydrology and Water Resources Page 100
Annex 4.. Summer Land Use parameters NUMBEA1:N27R
LUSE_TYPE
RUNOFF_VEG
NUM_VEG_RO
NUM_IMP_RO
VEG_ AREA
BARE_ AREA
IMP_ AREA
OPENW_AREA
ROOT_DEPTH LAI
MIN_ STOM
INTERC_PER
VEG_ HEIGHT
1 city center build up grass 2 1 0.2 0 0.8 0 0.3 2
21 agriculture crop 1 0 0 1 0 0 0.35 0 180 0 0.6
33 mixed forest forest 3 0 0.5 0.5 0 0 2 4.5 500 38
36 shrub grass 2 0 0.2 0.8 0 0 0.6 0 110 5 2
37 beach/dune bare soil 4 0 0.3 0.7 0 0 0.5 2 110 15
51 navigable river open water 5 0 0 0 0 1 0.05 0 110
Annex 5. Winter Land Use parameters
NUMBER LUSE_ TYPE
RUNOFF_ VEG
NUM_VEG _RO
NUM_ IMP_RO
VEG_ AREA
BARE_ AREA
IMP_ AREA
OPENW_ AREA
ROOT_ DEPTH LAI
MIN_ STOM
INTERC _PER
VEG_ HEIGHT
1 city center build up grass 2 1 0.2 0 0.8 0 0.3 2
21 agriculture crop 1 0 0.8 0.2 0 0 0.4 4 180 15 0.6
33 mixed forest forest 3 0 1 0 0 0 2 5 375 35
36 shrub grass 2 0 1 0 0 0 0.6 6 110 15 2
37 beach/dune bare soil 4 0 0.3 0.7 0 0 0.5 2 110 15
51 navigable river open water 5 0 0 0 0 1 0.05 0 110
Annex 6. Annual and Seasonal Water balance components
Annual Rainy Season Dray Season
Components Min Max Ave Stdev Min Max Ave Stdev Min Max Ave Stdev
Precipitation 1003 1827 1357.38 193.74 394.42 1122 794.08 166.36 240.1 707.67 541.19 118.79
Evapotranspiration
(AET) 282.39 1336.29 736
214.3 111.12 377. 54 312.68 68.08 78.08 982.09 434.95 135.03
Runoff (RO) 99.6 1244.76 519.16 188.8 62.7 768.3 301. 5 119.2 0 477.3 148.7 86
Recharge (GR) 0 564.17 102.2 118.19 0 652. 5 179.8 175.2 -202.1 121.7 -41.98 44.93