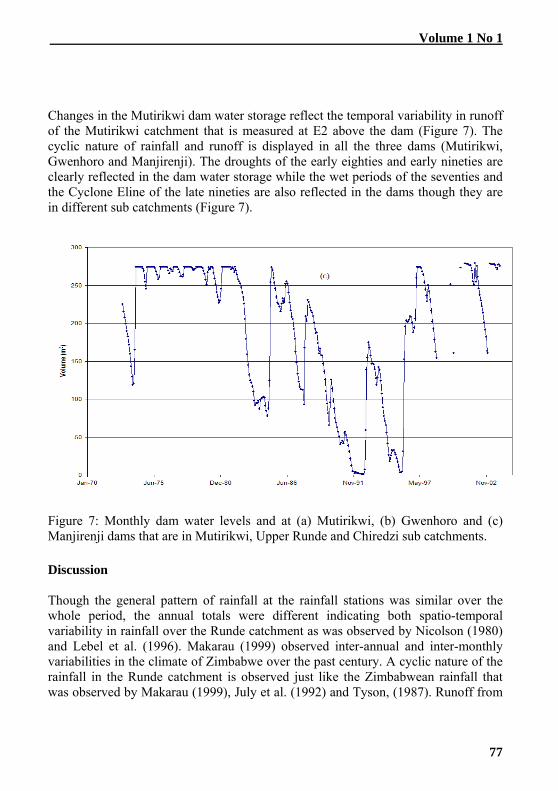
African Water Journal UN-Water/Africa African Water Journal March 2007 – ISBN 92-1-125089-7 Volume 1 No. 1 National Water Policies and Water Services at the Extremes: What Challenges Must be Faced in Bridging the Gap? Learning from the South Africa Experience Fidelis A. Folifac Water for Food in the Cities: The Growing Paradigm of Irrigated (Peri)- Urban Agriculture and its Struggle in Sub-Saharan Africa Olufunke O.Cofie and Pay Drechsel, The Water Resources Management Study of the Wadi Tafna Basin (Algeria) Using the Swat Model Djilali Yebdri, Mohamed Errih, Abdelkader Hamlet, Abdellatif El-Bari Tidjani Agricultural Water Management in Ephemeral Rivers: Community Management in Spate Irrigation in Eritrea Berhane Haile Ghebremariam, Frank van Steenbergen Spatio-Temporal Rainfall and Runoff Variability of the Runde Catchment, Zimbabwe, and Implications on Surface Water Resources Mugabe, F.T., Hodnett, M.G., Senzanje, A., Gonah, T. Some Improper Water Resources Utilization Practises and Environmental Problems in the Ethiopian Rift Tenalem Ayenew Management of Shared Groundwater Basins in Libya Omar Salem A Publication of UN-Water/Africa
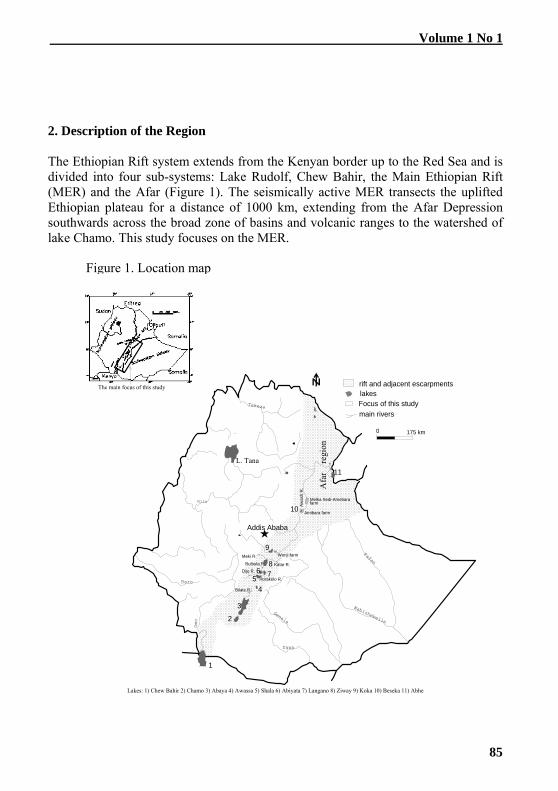
Transcript
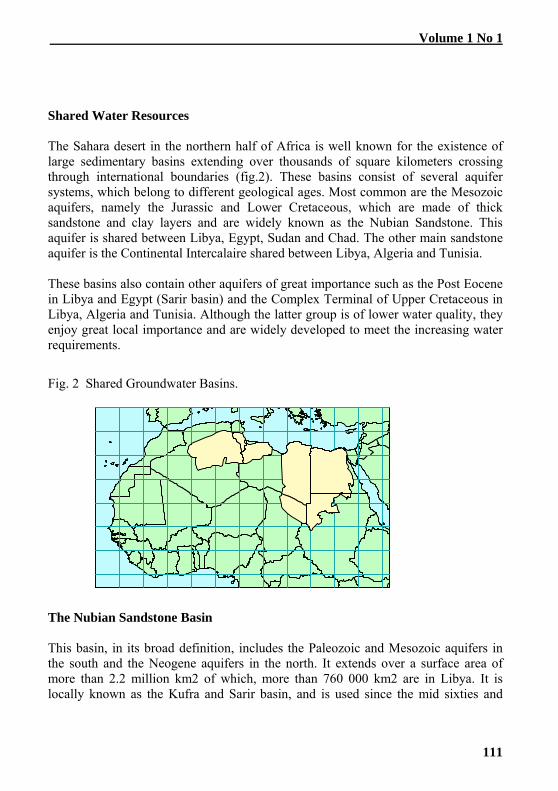
African Water Journal
UN-Water/Africa
African Water JournalMarch 2007 – ISBN 92-1-125089-7
Volume 1 No. 1
National Water Policies and Water Services at the Extremes: What
Challenges Must be Faced in Bridging the Gap? Learning from the South Africa Experience
Fidelis A. Folifac
Water for Food in the Cities: The Growing Paradigm of Irrigated (Peri)-Urban Agriculture and its Struggle in Sub-Saharan Africa
Olufunke O.Cofie and Pay Drechsel,
The Water Resources Management Study of the Wadi Tafna Basin (Algeria) Using the Swat Model
Agricultural Water Management in Ephemeral Rivers: Community Management in Spate Irrigation in Eritrea
Berhane Haile Ghebremariam, Frank van Steenbergen
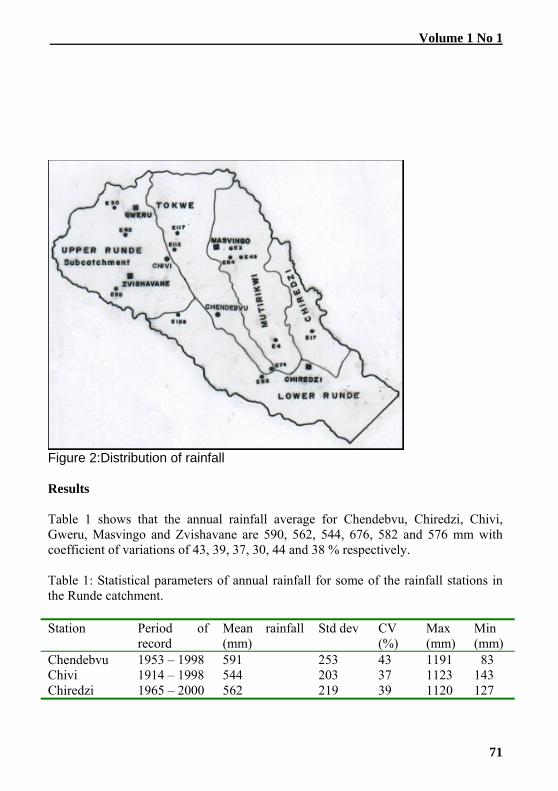
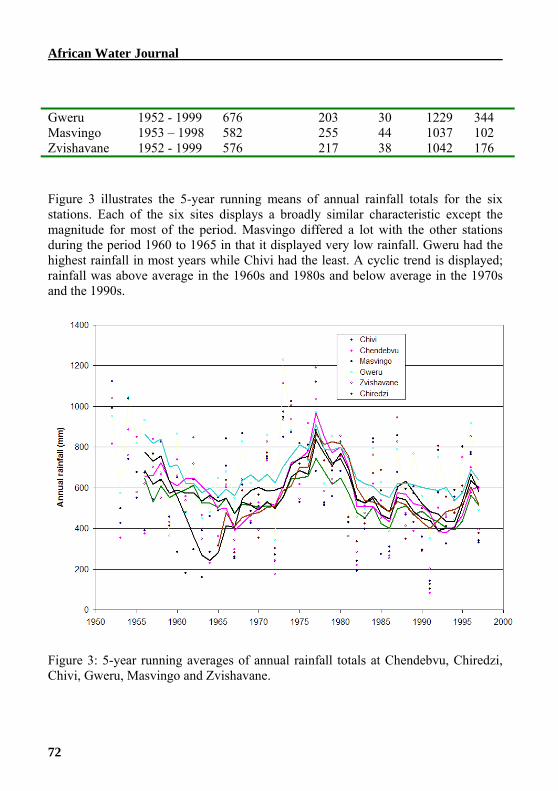
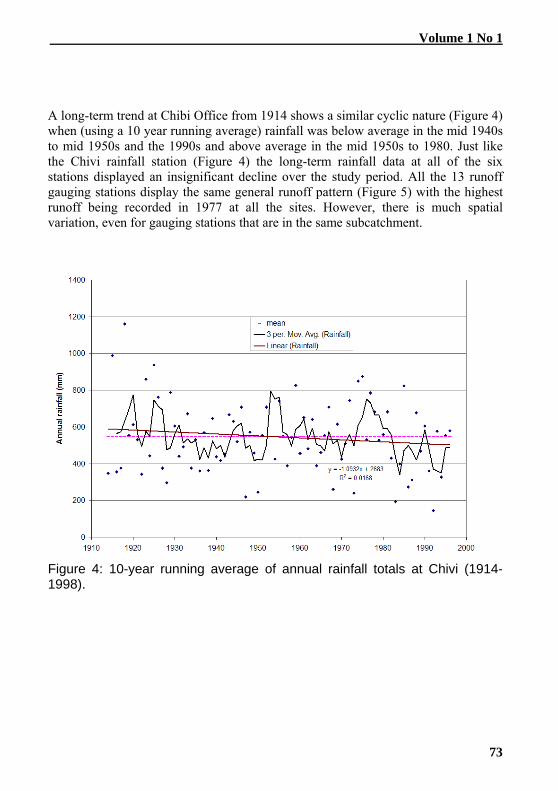
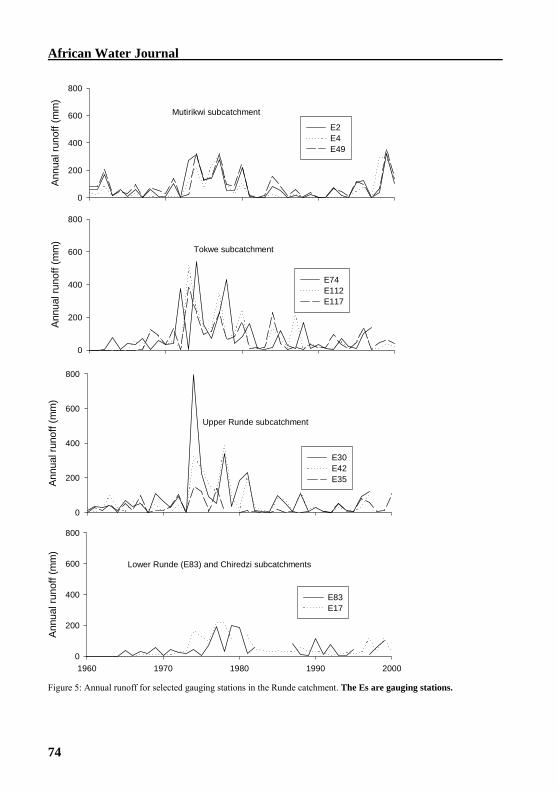
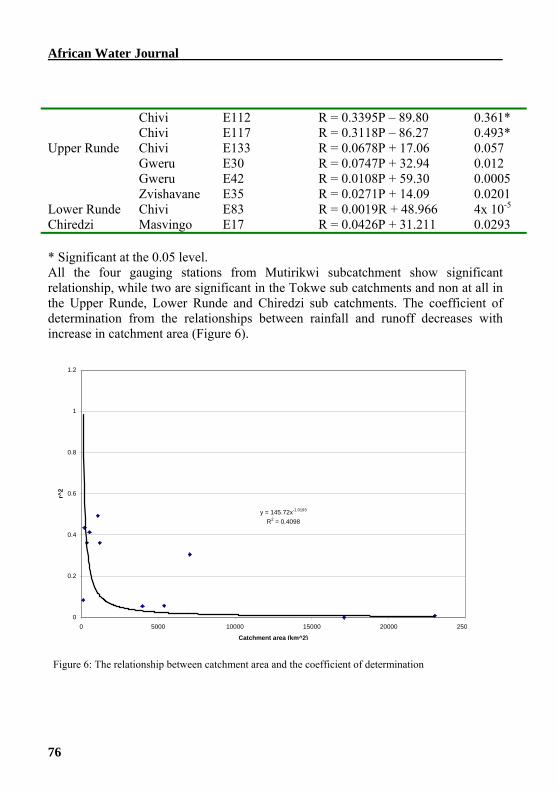
Spatio-Temporal Rainfall and Runoff Variability of the Runde Catchment, Zimbabwe, and Implications on Surface Water Resources
Mugabe, F.T., Hodnett, M.G., Senzanje, A., Gonah, T.
Some Improper Water Resources Utilization Practises and Environmental Problems in the Ethiopian Rift
Tenalem Ayenew Management of Shared Groundwater Basins in Libya
Omar Salem
A Publication of UN-Water/Africa
African Water Journal
ii
Editor-in-Chief Prof. G.O.P. Obasi, former Secretary General, World Meteorological Organization (WMO), Geneva This Edition: Editor: Dr. Stephen Maxwell Kwame Donkor, Coordinator, UN Water/Africa Economic Commission for Africa (ECA), Addis Ababa. Copy Editor: Ms. Mercy Wambui, Communications Officer, ECA Ms. Lullit Kebede, MA., Associate, UN Water/Africa UNEP Office, Addis Ababa Graphics/Layout: Ms. Aster Gebremariam, Technical Assistant, UN Water/Africa ECA, Addis Ababa Production Coordinators: Ms. Aster Gebremariam, ECA, Addis Ababa Ms. Lulit Kebede, UNEP Office, Addis Ababa The African Water Journal is intended to provide an outlet to: • Consolidate and disseminate the growing knowledge and experiences of African national
professionals in water resources development and management to help provide a strong foundation for regional and national water policies and plans;
• Enhance the capacity of the professionals and practitioners to directly or indirectly provide effective technical backstopping to the political hierarchy; and
• To facilitate the documentation and sharing of African experiences within Africa and the outside world.
Management of the Journal Published every year, the African Water Journal is a joint publication of the following major stakeholders of the African water sector: • The United Nations Agencies organized as UN-Water/Africa coordinated by the Economic
Commission for Africa (ECA). • The African Minister’s Council on Water, which provides policy guidance to the water sector
in Africa; • International Water Management Institute; • The United Nations University International Network on Water, Environment and Health
(UNU-INWEH) Programme; • African Water Research Institutes and Universities; and • The Global Water Partnership branches in Africa. The Journal is available by subscription. For details, please contact Dr. Stephen Maxwell Donkor, Editor, at [email protected] OR [email protected]
Volume 1 No 1
iii
African Water Journal
PREFACE Stephen Maxwell Donkor ......................................................................................................... 6
NATIONAL WATER POLICIES AND WATER SERVICES AT THE EXTREMES: WHAT CHALLENGES MUST BE FACED IN BRIDGING THE GAP? LEARNING FROM THE SOUTH AFRICA EXPERIENCE 8 Fidelis A. Folifac ...................................................................................................................... 8
WATER FOR FOOD IN THE CITIES: THE GROWING PARADIGM OF IRRIGATED (PERI)-URBAN AGRICULTURE AND ITS STRUGGLE IN SUB-SAHARAN AFRICA Olufunke O.Cofie And Pay Drechsel ..................................................................................... 26
THE WATER RESOURCES MANAGEMENT STUDY OF THE WADI TAFNA BASIN (ALGERIA) USING THE SWAT MODEL Djilali Yebdri, Mohamed Errih, Abdelkader Hamlet, Abdellatif El-Bari Tidjani................. 36
AGRICULTURAL WATER MANAGEMENT IN EPHEMERAL RIVERS: COMMUNITY MANAGEMENT IN SPATE IRRIGATION IN ERITREA Berhane Haile Ghebremariam (†), Frank Van Steenbergen ................................................ 51
SPATIO-TEMPORAL RAINFALL AND RUNOFF VARIABILITY OF THE RUNDE CATCHMENT, ZIMBABWE, AND IMPLICATIONS ON SURFACE WATER RESOURCES Mugabe, F.T., Hodnett, M.G., Senzanje, A and Gonah, T ................................................... 69
SOME IMPROPER WATER RESOURCES UTILIZATION PRACTISES AND ENVIRONMENTAL PROBLEMS IN THE ETHIOPIAN RIFT Tenalem Ayenew..................................................................................................................... 83
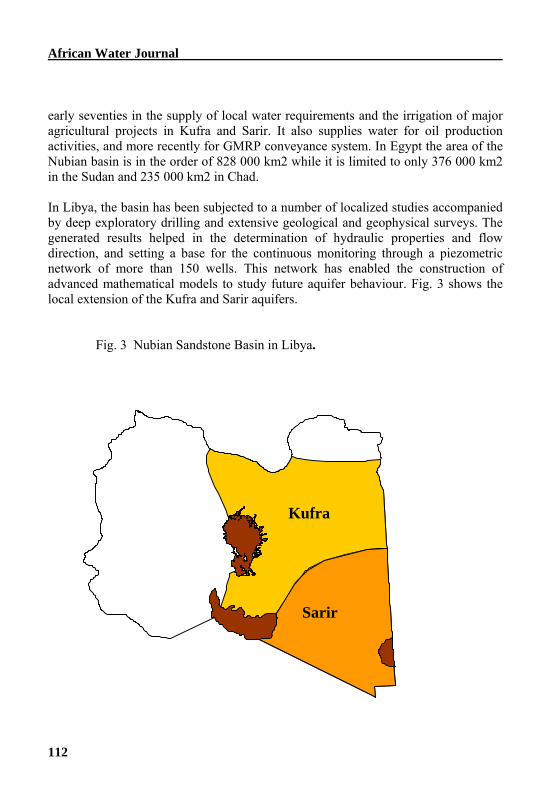
MANAGEMENT OF SHARED GROUNDWATER BASINS IN LIBYA Omar Salem .......................................................................................................................... 109
UN/Water Africa
Volume 1 No. 1
African Water Journal
iv
CONTRIBUTORS National Water Policies and Water Services at the extremes: What Challenges must be faced in bridging the gap? Learning from the South Africa Experience Fidelis A. FOLIFAC, Department of Geography, University of Concordia, Canada, Ph. 514-365-3464, e-mail: [email protected]
Water for Food in the Cities: The Growing Paradigm of Irrigated (Peri)-Urban Agriculture and its Struggle in Sub-Saharan Africa Olufunke O.Cofie and Pay Drechsel, International Water Management Institute (IWMI), Africa Office, PMB CT 112, Accra, Ghana, e-mail: [email protected]
The Water Resources Management Study of the Wadi Tafna Basin (Algeria) Using the Swat Model Djilali Yebdri, Mohamed Errih*, Abdelkader Hamlet, Abdellatif El-Bari Tidjani, USTO, HYDRE Research Laboratory ,P.O. Box 1505 El-Mnaouer Oran 31000 Algeria, Phone / Fax + 213 (0) 41 53 65 04 ; e-mail: [email protected]
Agricultural Water Management in Ephemeral Rivers: Community Management in Spate Irrigation in Eritrea Berhane Haile Ghebremariam, (†), Frank van Steenbergen
Ministry of Agriculture Government of Eritrea, PO Box 1048 Asmara, Eritrea. (†)Mr. Berhane Haile tragically lost his life in a flood accident; MetaMeta Research Paardskerkhofweg 14 5223 AJ Den Bosch – The Netherlands ([email protected]), Secretary Spate Irrigation Network (www.spate-irrigation.org) Spatio-Temporal Rainfall and Runoff Variability of The Runde Catchment, Zimbabwe, and Implications on Surface Water Resources Mugabe, F.T.1*, Hodnett, M.G.2, Senzanje, A.3 and Gonah, T1 1Department of Land and Water Resources Management, Midlands State University, P. Bag 9055, Gweru, Zimbabwe, 2 Centre for Ecology and Hydrology, Wallingford, Oxon OX10 8BB, UK, 3 Department of Soil Science and Agricultural Engineering, University of Zimbabwe. P.O. Box MP 167, Mount Pleasant, Zimbabwe, *To whom all correspondence should be addressed: Phone: 263 54 60496; fax: 263 54 60233; e-mail: [email protected]
Some Improper Water Resources Utilization Practises and Environmental Problems in the Ethiopian Rift Tenalem Ayenew, Addis Ababa University, Department of Geology and Geophysics, P.O.Box 1176. Tel. and Fax. 251-1-553214, Addis Ababa, Ethiopia, e-mail: [email protected]
Management of Shared Groundwater Basins in Libya Omar Salem, General Water Authority, P.O.Box 5332, Tripoli, Libya, Tel: +2182 14832129, Fax: +2182 14832129, e-mail: [email protected]
Volume 1 No 1
1
List of Acronyms ADE Algerenne des Eaux(Algerian of Waters) AET Actual Annual Evapotranspiration ANB Agence Nationale des Barragesw (National Water
Resources Agency) ANRH Agence Nationale des Resources Hydrauliques
(National Water Resource Agency) ARS Agricultural Research Service AWJ African Water Journal BOTT Build, Operate, Train and Transfer CEDARE Centre for Environment and Development in the
Arab Region and Europe CGIAR Consultative Group on International Agricultural
Research CMA Catchments Management Agencies Cvp Coefficient of Variation of annual precipitation Cvr Coefficient of Variation of annual runoff DO Dissolved Oxygen DWAF Department of Water Affairs and Forestry FAO UN Food and Agriculture Organization GMRP Great Man Made River Project GNI General Net Income IDB Islamic Development Bank IFAD International Fund for Agricultural Development MAP Mean Annual Precipitation MDG Millennium Development Goal MER Main Ethiopian Rift NGO Non-Governmental Organization NWA National Water Act NWRS National Water Resource Strategy IWMA International Water Management Institute
African Water Journal
2
ONM Office Nationale de la Meteorologie(National office
of Meteorology SASS System Aquifere du Sahara Septentrional SCS Soil Conservation Service SOD Sediment Oxygen demand SSA Sub-Saharan Africa SWAT Soil and Water Assessment Tool WAT Water Assessment Tool WSA Water Service Act SWRRB Simulator for Water Resources in Rural Basins UN United Nations UPA Urban and Peri-urban agriculture USDA United States Department of Agriculture UMA Union of Maghreb Arab Countries WMA Water Management Areas
Volume 1 No 1
3
PROFESSOR GODWIN OLU PATRICK OBASI SECRETARY- GENERAL EMERITUS AND EDITOR-IN-CHIEF OF THE
AFRICAN WATER JOURNAL PASSES AWAY
A Tribute by Yinka Rotimi ADEBAYO
Professor Godwin Olu Patrick Obasi, Secretary General of the World Meteorological Organization (WMO) from 1 January 1984 to 31 December 2003 died in Abuja, Nigeria on 2 March 2007, aged 73 years. He was Secretary General Emeritus of WMO till he died.
An ardent family man, he married Madam Winifred on 1 October 1976 and they had six children: Jane Abisola, Omowumi, Christine Folakemi, Albert Babatunde, Margaret Iyabo and Mary Omotayo Obasi.
Professor Obasi was born in Ogori, Kogi State, Nigeria on 24 December 1933. After schooling and early life in his home country, he proceeded for university studies in North America where his distinguished academic record included a Bachelor of Science (1959) with Honours from McGill University in Montreal, Canada and a Master of Science (1960) and Doctorate (1963) in Meteorology from Massachusetts Institute of Technology (MIT) in the USA. At MIT, he received the Carl-Gustav Rosby Award for the best doctoral thesis of his graduating year.
Following his graduation, Professor Obasi joined the National Meteorological Service of Nigeria. Four years later, he joined the Faculty of the University of Nairobi, where he was later appointed Chairman of the Department of Meteorology and Dean of the Faculty of Science. In 1978, he moved to Geneva to join the WMO Secretariat as Director of the Education and Training Department.
In May 1983 the World Meteorological Congress elected him Secretary-General of WMO with a four years mandate beginning 1 January 1984. He was subsequently re-elected for four terms (in 1987, 1991, 1995 and 1999). Upon completion of his fifth term, he became Secretary-General Emeritus of WMO as decided by the 14th World Meteorological Congress.
African Water Journal
4
During his tenure, Prof. Obasi was active in promoting global solutions to environmental issues, with special attention to the atmosphere, fresh water and the oceans. He was at the forefront in drawing the world's attention to the issue of climate change, notably in convening the Second World Climate Conference, held in Geneva, Switzerland, in 1990. He played an important role in the negotiations leading to the establishment of the United Nations Framework Convention on Climate Change, the United Nations Convention to Combat Desertification, the Intergovernmental Panel on Climate Change, the World Climate Research Programme, the Global Climate Observing System and the Vienna Convention on the Protection of the Ozone Layer and its Montreal Protocol.
In May 1983, the Ninth World Meteorological Congress elected Professor Obasi as Secretary General of WMO and he was re-elected by the four subsequent Congresses in 1987, 1991, 1995 and 1999. The Fourteenth Congress in May 2003 conferred on him the title of Secretary-General Emeritus. During his twenty years as Secretary General, Professor Obasi was untiring in his promotion of international cooperation in Meteorology and Operational Hydrology, in his initiatives for strengthening the NMHSs of all countries and in his commitment to enhancing the impact and influence of WMO within the United Nations and the broader international system. He worked hard to build links with WMO’s sister organisations and to promote the vision of an Integrated World Geophysical organisation supporting the goals of sustainable development. He worked closely with his good friend Dr Mostafa Tolba, Executive Director of UNEP (United Nations Environment Programme), to provide the scientific underpinning for the Vienna Convention for the Protection of the Ozone Layer. He championed the setting up of the Intergovernmental Panel on Climate Change (IPCC). He led the organisation of the 1990 Second World Climate Conference and played a key role in pointing the way towards the negotiation of the UN Framework Convention on Climate Change (UNFCCC). Professor Obasi travelled widely to represent the interests of WMO and he was always there for the opening of regional association and technical commission sessions to meet the delegates, commend their achievements and explain the WMO vision for the future. He was both outward-looking and forward-looking and he gained particular satisfaction from the outcome of the Eminent Persons Group that he brought to Geneva in 1996 to help map out a visionary future for WMO. He was a determining influence in strengthening the role of WMO and NMHSs in natural
Volume 1 No 1
5
disaster reduction and climate. Though his scientific and policy interests ranged widely, however, his own special focus remained on education and training and capacity building for the NMHSs of developing countries. His service to Africa and his fatherlands Nigeria, was enormous. Aside from his distinguished teaching career as university professor in Kenya, he contributed to development of scientific institutions and policy through the African Academy of Sciences and the then Third World Academy of Sciences. He strongly supported the African water community, in several ways. Professor Obasi was proud of what he achieved as an African head of a United Nations organisation and the entire developing world was rightly proud of him. His greatest legacy lies in the scientific calibre and commitment of the meteorological and hydrological communities of the developing countries as much as it is in the United Nations system and the broader institutions of international scientific collaboration. He also pushed for and ensured the construction of the new WMO Headquarters building in Avenue de la Paix, This beautiful Geneva landmark will stand as a publicly visible legacy of his WMO career. No other meteorologist in history has visited so many countries, opened so many meetings and conferences, met so many Prime Ministers, Presidents and Kings and been so widely honoured by so many governments and organisations. No other meteorologist in history has done more to promote the role and influence of the National Meteorological and Hydrological Services (NMHSs) of the developing countries and no other meteorologist from a developing country has achieved so much status and influence in the highest levels of international affairs. To many of his peers, he was know as “GOP” (Godwin Olu Patrick Obasi), to several of his staff, he was know as “SG” (Secretary General) , while to some of us, he was know as “Oga” (the Master, in an African parlance). I was privileged to work with him directly as Executive Assistant from 2002 till his retirement in December 2003. I can confirm without any iota of doubt that he was a very strong, courageous, determined and honest man till the end.
African Water Journal
6
Preface
By the Coordinator, UN Water/Africa Stephen Max Donkor, B.Sc (Hons), M.Sc, Ph.D
Africa’s water challenges remain daunting and numerous. The most obvious challenge is to reduce the proportion of Africans without access to safe water (and sanitation) by 50 per cent before the end of 2015 as specified in the Millennium Development Goals. This target pales when compared to those of the African Water Vision 2025 that aims at a reduction of 75 % and 70 % for water supply and sanitation respectively. In 2007, we are almost half way to the MDG target date, however the general consensus is that though some countries have made rapid progress and may even exceed the Goal especially in Urban areas, most will not attain it. This applies especially to rural and peri-urban areas. To quote from Country Status Overviews compiled for African Ministers’ Council on Water (AMCOW) by a consortium consisting of the World Bank (Water and Sanitation Programme), the African Development Bank and UNDP: “Sub- Saharan Africa is lagging behind the rest of the world with respect to achieving the Millennium Development Goal (MDGs) on water supply and sanitation…………… Most African countries have developed plans to reach the MDGs on water supply and sanitation (WSS), but these often only exist as documents and are neither country-owned nor actively implemented. ….” Unquote. The struggle to reach the MDGs however obscures the broader objectives of the African Water Vision 2025 that sets sharper targets and longer time frames for meeting all the development challenges of the African Water Sector. These challenges range from Water Governance, Meeting Urgent Needs, Improving Water Wisdom and most importantly Strengthening Access to Finances. The African Water Journal aims at providing an outlet for publishing research results, policy implementation and broader analyses of progress made and difficulties being
Volume 1 No 1
7
encountered in implementing the African Water Vision 2025. The selected articles cover all facets of water in Africa from the technical to the socio-economic and from quantitative to qualitative articles but all with one aim – To share knowledge on Africa’s water endowment. This edition of the African Water Journal took long in coming into being but sets the stage for a regular semi-annual production schedule. It covers articles from different geographic, thematic and disciplinary orientations and fulfils the objective of covering all aspects of the African Water Agenda set out in the African Water Vision 2025. With your support and regular contributions we will endeavour to keep the quality, regularity and purposefulness of this unique Journal for Africa by Africans and on Africa. Your articles and comments should be sent to: [email protected] with a copy to [email protected] especially for large files with graphs and pictures.
African Water Journal
8
National Water Policies and Water Services at the extremes: What Challenges must be faced in bridging the gap? Learning from the
South Africa Experience
Fidelis A. FOLIFAC Abstract This paper argues that there is a gap between national water policies and water services in most African countries, which compound the drive to achieve the Millennium Development Goals (MDGs) for water and sanitation. It explores important lessons (good practices) from South Africa and applies them to justify possibility to significantly bridge the gap between water policies and services. Furthermore, the case is made that these lessons can be applied to other countries, making it possible to develop a generic model for water and sanitation. It concludes that the immediate challenge that must be faced in bridging the gap is a strong political will in policy implementation and moving resources in the right direction. Keywords: Water, Policies and Services, South Africa, Development Goals, Policy Implementation 1. Introduction At the 2000 Millennium Summit, the global community adopted the challenge of attaining the eight Millennium Development Goals (MDGs). Countries pledged to meet specific targets aimed at eradicating extreme poverty by 2015 (United Nations 2000a). Central to all 8 goals is water. The central role of water in human and physical development and its intrinsic value in sanitation, health and poverty reduction was formally recognised in target 10: “Halve by 2015, the proportion of people without sustainable access to safe drinking water and basic sanitation” (UNDP 2003) Subsequently, there has been an increase, both at National and International levels, of dialogue, conferences, and workshops on what approaches could accelerate the achievement of this goal. Recently, some nations have been giving commendable attention to water policies issue; be it in developing new water policies or modifying
Volume 1 No 1
9
existing ones. Unfortunately, despite the attractiveness of many such policies, national water services have typically not witnessed commendable improvement. This paper argues that national water policies and national water services are at extremes due to lack of political commitment in moving resources in the right direction, giving rise to what is herein referred to as a gap between policies and services. The case is made that to attain the MDGs target 10 or at least attain an appreciable level, it is essential to bridge this gap. The question then is what challenges must be faced in bridging the gap? The challenges can be brought to focus by attempting answers to some key questions such as:
i) Is it the absence of policy or wrong policies in the water sector? ii) Is it the issue of implementation; ranging from lack of adequate
institutions, knowledgeable personnel with integrity, public involvement, and lack of political will or simply ignorance?
iii) Are policies and/or directives enough or do countries require legally binding law?
iv) What is the role of natural factors? To adequately address questions of this nature, it is important to examine some “success stories”. In this paper, South Africa is used as a case study with the objective of identifying and exploring;
1. What are the unique lessons in the South African case that have accounted for their progress?
2. Can the lessons from South Africa be applied to other African countries?
3. Is it possible to develop a generic model that would assist in bridging the gap between policies and services?
Prior to examining South Africa water policy and services, a brief discussion on the challenges in meeting the MDGs shall be presented. Section two shall be devoted to the South Africa Water Sector. A general overview of the current water resource management situation in South Africa shall be discussed before focusing on water supply services in particular. Water supply services as used in this paper shall mean the provision of water services to support human life and personal hygiene, although much bias shall be on supporting human life. In section three, attention shall be on some lessons learned and the possibilities for application in other African countries.
African Water Journal
10
Finally, in section four a generic framework for bridging the gap between water policies and services shall be proposed prior to conclusion. 1.1 Challenges in meeting the MDGs Although critics hold that the MDGs will not be attained (De Paladella Salord 2005, Gleick 2004), they however recognise that the weakness lies not in the goal itself as being ambitious but lack of human commitments in the mobilisation of resources in the positive direction. De Paladella Salord (2005,120) coined the challenge as such; “…The international community will fail to reach the MDGs if significant resources are not diverted to meeting the goals…northern governments actually begin to address some of the issues of poverty, including increased and better overseas development aid, more equitable trade rules and debt forgiveness. Without action on these significant areas, the MDGs will not be met whether the deadline is 2015 or 2115”. Gleick (2004) perceives the challenge as such: “… are unlikely to be achieved given current levels of financial and political commitments…. Despite growing awareness of water issues, international economic support for water projects of all kinds is marginal and declining...The lack of agreement about how best to proceed, however makes it increasing unlikely that the goals will be met”. Based on the above arguments, it could be said that the main challenge is human commitment in moving resources to the right direction. This author pushes it further that in sub-Saharan Africa where a rigid, yet porous system of government exist, the classic top-down approach which characterise decision-making demands that top management (ministers and politicians) must express authentic commitment for anything good to happen.
2. The Case of South Africa South Africa water supply sector, which has been characterised by immense challenges, can pride itself today as champion in water supply development in Africa based on government determination to deal with those challenges and formally recognising water as a human right. To elucidate on the achievements made in the
Volume 1 No 1
11
water sector, it is important to picture briefly the hydro-geography and water policies. 2.1 Background South Africa has an average annual rainfall of 500mm, characterised by high annual variability and unpredictability, (43% of the rain falls on 13% of the land), almost 60% of the country as semi-arid to arid (Nomquphu, 2005, Abrams, 1996). Prior to 1994, water supply responsibility was fragmented, with no single national government department responsible for its management. This resulted in different levels and quality of services between the white and black areas. Further compounding the issue was the lack of any coherent national water legislation or support structure (Muller and Lane 2002). As noted by Abrams (1996), the policy and functions of the Department of Water Affairs and Forestry (DWAF) were limited exclusively to irrigation and forestry. This had far reaching consequences for the water sector and the environment in general. Out of a total population of about 41 million at the time, an estimated 15.2 million (12 million of whom lived in rural areas) lacked access to basic water supply and 20.5 million, lacked basic sanitation. 2.2 Water Sector reforms The first non-racial democratic government of 1994 was sensitive to the urgent need for a new policy for the country, of which the water sector was just one. A strong political will was demonstrated to implement sustainable water development through sound water governance. This lead to reforms in water policies and institutions, some of the outstanding policies are summarised below:
a) Water Service Policy, (White Paper) 1994. Addresses the backlogs in the country’s water service and the institutions and mechanisms needed to remedy the backlogs
b) Republic of South Africa Constitution (Act 108 0f 1996). Establishes a human right dimension for access to adequate and sustainable water supply and services and enshrine the Bill of Right.
c) Water Service Act (WSA) of 1997 (act 108 of 1997) ensures the right of access to basic water supply and sanitation, and also provides a
African Water Journal
12
regulatory framework and establishment of water services institutions such as water boards, water services providers etc. It creates a comprehensive legislative framework for the provision of water supply and sanitation services to support life and personal hygiene and recognises the need to operate in a manner consistent with the broader goals of water resources management. It encourages cooperative governance with emphasis on capacity building at all levels. It spells out the role of DWAF in the event of non-performance by provincial and local governments.
d) National Water Policy of 1997 (DWAF 1997) redefined ownership and allocation of water. It declares that all water irrespective of where it occurs in the hydrological cycle is public water, and that the national government will act as a public trustee.
e) National Water Act of 1998 (Act 36 0f 1998). Founded on 2 pillars: sustainability and equity, it amongst other things required the establishment of a National Water Resource Strategy (NWRS) to set out a national framework for managing water resources.
f) National Water Resource Strategy (DWAF, 2004a) provides the national implementation framework and divides the country into 19 water Management Areas (WMA).
g) The National Water and Sanitation Program, an international partnership aimed at enhancing accessibility to safe and affordable water supply and sanitation for the poor.
It should be mentioned that the above legislations or policies could not have been established by error or as a requirement but clearly demonstrate a strong political commitment from the government. This means that the problems are acknowledged and the need for solutions given adequate attention. The above policies focus on water resource management in general and collectively have;
i) Provided clarity in the water sector which was formally in disarray ii) Created a framework for investment iii) Provided an avenue for the outworking of political objectives and
above all, iv) Reduced institutional fragmentation that characterised the sector.
The institutional framework of the water sector can be broadly simplified to three tiers:
Volume 1 No 1
13
At the1st tier is the National government (Department of Water Affairs and Forestry), responsible for water resource management, support to local government, setting of norms and standards, monitoring and administration of the Water Act. The 2nd tier consists of Water Boards, with principal responsibility being the supply of bulk treated water on a commercial basis. Finally, the 3rd tier made up of Local Governments charged with the supply of water and sanitation services to consumers.
2.3 Water Supply Services As mentioned earlier, prior to 1994, there was great inequity in water services between different groups; where only about 45 % of blacks had piped water against nearly 100 % of the other groups. Thompson et al. (2004), attribute the inequity and inadequate water services to:
a) The absence of a coherent policy, b) The absence of an institutional framework, which established clear
responsibilities, c) The overlapping of institutional boundaries as well as the exclusion of many
areas of great need, d) A lack of political legitimacy and will, e) Failure to make resources available where they were most needed, and f) The low level of economic activity in vulnerable areas.
However, post 1994, there was a drastic change to harmonise service provision and reach out to the rural masses, evident by reforms made in the water sector (see section 2.2). Certain principles and objectives, (Fundamental Principles) were developed, of importance to water services are: Principle 1, which promotes the values enshrined in the Bill of Rights. Principle 8, the water required to ensure that all people have access to sufficient water shall be reserved. Principle 10, the water required to meet the basic human needs referred to in principle 8 and the needs of the environment shall be identified as “the Reserve” and
African Water Journal
14
shall enjoy priority of use by right. The use of water for all other purposes shall be subject to authorisation. Principle 25, the right of all citizens to have access to basic water services necessary to afford them a healthy environment on an equitable and economically and environmentally sustainable basis shall be supported.
3. Lessons from South Africa Water Supply Services Much has been done in South Africa to move rhetoric to substantive progress, which can be heralded. In this section, some of the specific issues shall be addressed to reflect what lessons emerged from them. The issues range from political will expressed in policy development, organisational issues (institutions and capacity development) to public participation, monitoring and feedback. 3.1 The political will and clear policy framework Critical to the progress made in South Africa, water sector is top-level political will and support. DWAF was completely innovated with a substantive budget to draw up and implement water service projects, which will turn “the right to water” into reality (NWA, Act 36 for 1998). The commitment in enacting clear policies cannot be over-emphasised. Clear policy is the first step towards implementation at scale, without which development strategies cannot be easily established. Without clear policy, the political will to genuinely address the problems cannot be easily generated. A clear political framework paves the way for the development of water supply management plans including structure and responsibilities. If resources have to be moved towards a positive direction, it is essential to define who has to do what, how it must be done , when it should be done and why it should be done. Informed by local and international experiences, clear policy principles constitute a legal framework for water services. The South Africa principle is based on universal human rights and equality of all persons and amongst others advocates that:
a) Development should be demand-driven and community based. b) Basic services are human right. c) “Some for all” rather than “All for some”.
Volume 1 No 1
15
3.2 Establishing the enabling environment Cognisance of the huge challenge inherent in proving efficient water services, division of labour was introduced and the role of the different levels of government defined (Water Service Policy 1994).
The national government is charged amongst others with establishing policy guidelines, development strategy, criteria for State subsidies, minimum service standard as well as monitoring and regulating service provision, while the provincial government assures service provision through the promotion of effective local government. Ensuring access to services for all persons in a sustainable manner is the task of the local government. NGOs and the private sectors are regarded as important components whose resources could be harnessed to foster the policy implementation. Such recognition and division of labour will no doubt impact a sense of responsibility and create meaningful linkage in the delivery of services. As a case to elucidate the issue of enabling environment, DWAF budget was substantially increased within 18 months following the reforms (Abrams, 1996). The government also made available capital grants for the construction of basic infrastructures, finances for the training of communities to undertake the governance, administration, operation and maintenance of the water services (Muller and Lane 2002). At the level of DWAF, a new Chief Directorate of community water supply and sanitation was created, with the responsibility of, inter-alia, ensuring the effective ongoing operation of the water supply systems and the planning of the expansion of these services in collaboration with the other spheres of the government. A well-established structure, which defines roles and responsibilities, reduces institutional conflicts and at the same time promotes cooperative governance. Internal and external communication will also facilitate while making it less cumbersome for the public to address concerns as they become aware where specific issues can be addressed. 3.3 From Rhetoric to Action; Policy Responsiveness It is not uncommon to find excellent policies stay on paper forever-rhetoric, and also for leaders to be indifferent when a policy is not yielding fruits once implemented. This has not been the case in South Africa, at least for water services.
African Water Journal
16
First, the NWA mandated the creation of Catchment Management Agencies (CMAs) in 19 delineated Water Management Areas; this has already been done (Versfeld 2000). Water User Associations (WUAs) were also recognised and encouraged.
These bodies at minimum provide for customary input in decision making and enhance sustainability of projects as such community-driven projects are usually more fluid (Malzbender et al, 2005). It has been reported that of the 13 million people who lacked access to basic water services in 1994, a minimum of 8 million were given that access as of 2002 (Muller and Lane, 2002). This represents an increase of 62% within a period of 8 years. How has this been achieved is a logical question which leads us to some of the actions taken by the national government. Three major issues shall be addressed; defining access to basic water services and setting goals, on the ground action and policy responsiveness.
3.3.1 Defining Access to Basic Water Services and setting goals
In the terms of WSA, the standard for basic water supply is as follows:
a) For low-density areas, a minimum quantity of 7 litres per person of potable water, available on a regular, daily basis
b) For high-density areas: - A minimum quantity of potable water of 25 litres per person
per day - Available within 200 meters walking distance - At a minimum flow rate of not less than litres per minute
available on a regular, daily basis - Supplied from a source of raw water, which is available 98 %
of the time, not failing more than 1 in 50 years with effectiveness of not more than 1 week interruption in supply per year.
Goals were also established to reflect short term, medium term and long- term objectives (Thompson 2002) with respect to water supply services. Although construction was funded, all recurring costs are to be borne by the communities, and those that desire a higher level of service must find the finance elsewhere. Keeping strictly to this policy has build trust and confidence in the water sector which have not only attracted local but also international finance to promote water supply development initiatives
Volume 1 No 1
17
(Abrams, 2002). The establishment of standards, goals and targets ensure that resources can be well directed, issues can be prioritised and progress can be monitored and evaluated providing feedback for alternative planning and management.
3.3.2 On the ground action; the capital works programme
The national water and sanitation program; an international partnership to help the poor gain sustained access to improved water supply and sanitation services constitute real action. Between 1994 and 2002, with substantial government funding of about US$ 400 million, DWAF, in collaboration with public and private sector constructed new water and sanitation services for a design population of seven million. Informed by shortage of delivery capacity, DWAF responded in 1996 (an example of policy responsiveness) by entering into partnership with the private sector to undertake Build, Operate, Train and Transfer (BoTT) services with the aim of achieving flexible mechanism for speeding up delivery and enhancing public-private partnership (Muller and Lane 2002).
3.3.3 Free Basic Supply: a case of policy responsiveness
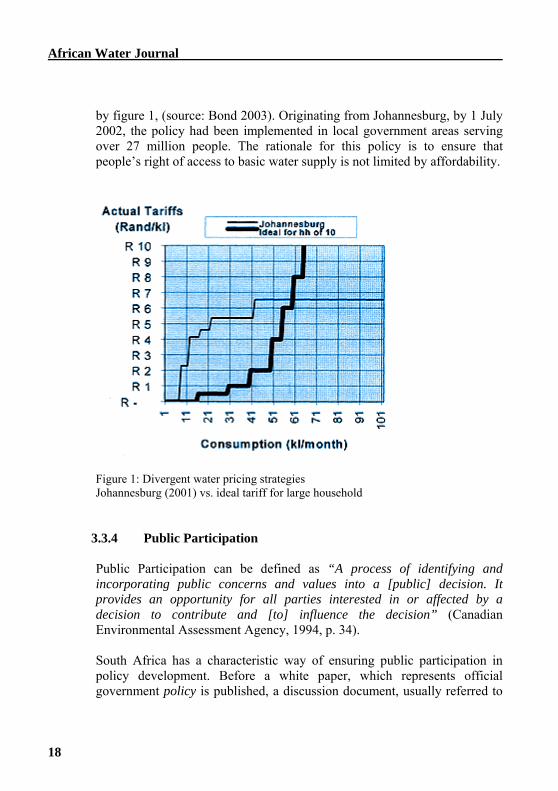
Things were not all right even with the BoTT approach, there was much resistant to pay for water, pre-paid meters and privatization were criticised (Bond, 2003). Non-payment meant disconnection with negative consequences on the population. Responding to a NEW YORK TIMES front page report on South Africa water issues, on May 29, 2003, Minister Kasrils attested that there have been approximately 10 million people affected by the disconnections, and Africa’s worst-ever recorded cholera outbreak can be traced to an August 2000 decision to cut water to people who were not paying a KwaZulu-Natal regional water board. Informed by demonstrations on the issue, the case of a Lutsheko woman seen (by a Minster during a field visit to appreciate operation of newly constructed water facilities) fetching water from a bore hole in village where a DWAF water scheme was fully operational (Kasrils 2000), and keeping to the December 2000 electoral promise, in July of 2001 the government responded with a free basic water policy (Bond 2003). The debate over the policy is beyond the scope of this paper; however, the objective of the policy will be briefly presented. It provides for free, the first 6000 litres per household a month, after which a rising block tariff is introduced as shown
African Water Journal
18
by figure 1, (source: Bond 2003). Originating from Johannesburg, by 1 July 2002, the policy had been implemented in local government areas serving over 27 million people. The rationale for this policy is to ensure that people’s right of access to basic water supply is not limited by affordability.
Figure 1: Divergent water pricing strategies Johannesburg (2001) vs. ideal tariff for large household
3.3.4 Public Participation
Public Participation can be defined as “A process of identifying and incorporating public concerns and values into a [public] decision. It provides an opportunity for all parties interested in or affected by a decision to contribute and [to] influence the decision” (Canadian Environmental Assessment Agency, 1994, p. 34).
South Africa has a characteristic way of ensuring public participation in policy development. Before a white paper, which represents official government policy is published, a discussion document, usually referred to
Volume 1 No 1
19
as a ‘ Green Paper is made available to a wide group of interested parties through the country. This is often the topic of regional and national workshops and conferences, with special focus on previously disadvantaged sectors (Abrams 1996).
The importance and rationale of authentic Public Participation in water supply cannot be over-emphasised based on the fact that it has no substitute, therefore concern all and sundry. It should be noted that different individuals would have widely diverse knowledge and interest, contrary views and arguments to water supply projects, which demands integration. In order to improve fairness, trust and competence in decision-making, it is important to have a full understanding of public concerns.
In as much as public participation benefits the public by way of enhanced responsibility and a feeling of ownership of the project, it also imparts special knowledge to the decision-makers in the form of possible shortcomings of particular actions and processes as well as identifying cost-effective and sustainable alternatives.
Effective public participation in water supply projects can be viewed as a win-win paradigm which can be summarised under the following points:-
a) Opportunity for Social learning (knowing, based on experience and
practice) and change b) Access to specialized and lay knowledge c) Capacity building and knowledge transfer
African Water Journal
20
Social learning is of fundamental importance in achieving sustainable water supply projects as it helps the citizen to learn new skills needed to maximise their participation and protect their health. It also introduces both experts and citizen, through interaction, to multi-levels issues that affect outcomes such as process, attitudes, cultural, and institutional norms (Tippett et al 2005). This has the potential of broadening the scope of institutional governance in water supply through a learning-orientated approach, which can combine iterative management and responsive change in decision- making. However, for this to be effective, public participation has to occur early enough in the process and be on-going. The South Africa approach can enhance fairness and public confidence and even if it does not contribute to the final policy, the public at least has a feeling of what the policy is all about and would have been educated on it.
3.4 Can the Lessons from South Africa be applied to other African
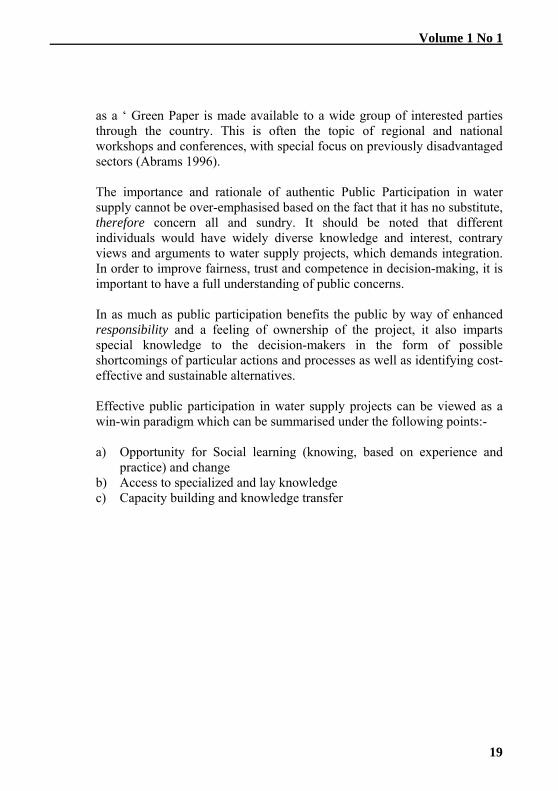
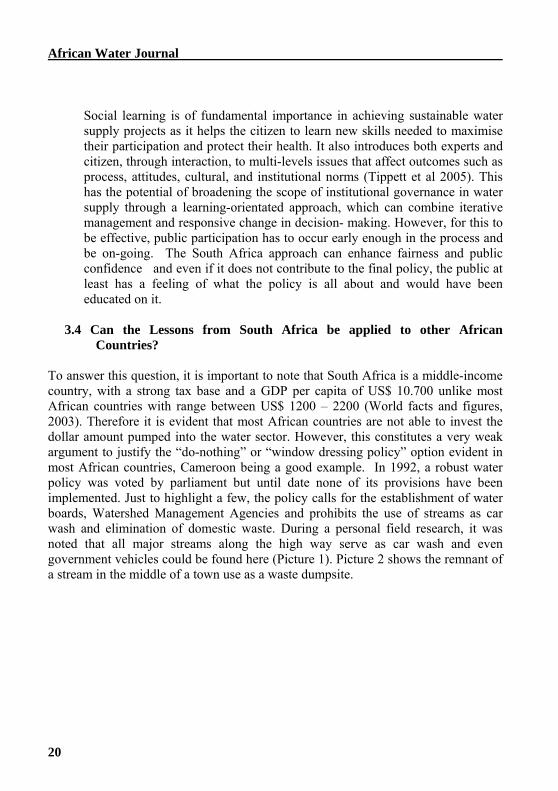
Countries? To answer this question, it is important to note that South Africa is a middle-income country, with a strong tax base and a GDP per capita of US$ 10.700 unlike most African countries with range between US$ 1200 – 2200 (World facts and figures, 2003). Therefore it is evident that most African countries are not able to invest the dollar amount pumped into the water sector. However, this constitutes a very weak argument to justify the “do-nothing” or “window dressing policy” option evident in most African countries, Cameroon being a good example. In 1992, a robust water policy was voted by parliament but until date none of its provisions have been implemented. Just to highlight a few, the policy calls for the establishment of water boards, Watershed Management Agencies and prohibits the use of streams as car wash and elimination of domestic waste. During a personal field research, it was noted that all major streams along the high way serve as car wash and even government vehicles could be found here (Picture 1). Picture 2 shows the remnant of a stream in the middle of a town use as a waste dumpsite.
Volume 1 No 1
21
Picture 1. Domestic waste in stream
Picture 2. Stream serving as car wash
Cognisance of the fact that application of lessons learned is totally different from the crude importation of policies (a common practice in many African countries anyway), it is therefore possible to apply these lessons from South Africa and even adapt the policy to fit the local realities. South Africa developed a clear vision for water services, defined and prioritized her goals, developed a framework for action and is continuously harnessing the necessary resources to achieve the vision (Mackay et al, 2003).
African Water Journal
22
Cameroon has the potential, both human and financial, to initiate water policies and move resources in the right direction. The problem lies in the fact that environmental issues have not been integrated into economic development. The proliferation of ministries with overlapping and sometimes contradicting functions only worsen the situation. Corrupt practices, lack of an efficient tracking mechanism as well as an organised database are just some of the obstacles. This author however argues that the lessons from South Africa are applicable to other African countries. Strategic Environmental Assessment is one of the many tools. 4. A Generic Model for Water Services From the South Africa lessons and the do-nothing scenario in Cameroon, it is argued that although a clear and enforceable policy is very important, the political will of top leaders is paramount. Further more, a good policy that is not implemented can be parallel to a car without fuel while a good policy without committed political will of top leaders can be liken to a good car with a bad driver. Therefore a strong political will is paramount to initiate and implement reforms in the water sector. Everything being equal, once a clear and enforceable policy is adopted, administrative and implementation issues will follow in the positive direction. Resources will be moved into the right direction, projects will be implemented, monitored and evaluated, and policies will be responsive. Enshrining certain sensitive issues such as the concept of the Bill of Right in the South Africa Constitution is worthy. Based on the above arguments, a generic model for water supply services is hereby proposed as follows; At the core of the model is water supply and related services, closely followed by strong political commitment; Policy, Administrative and Institutional reforms, which are then encapsulated in box of Good Water Governance, including but not limited to public participation, accountability, effective monitoring, evaluation, feedback and management review.
Volume 1 No 1
23
5. Conclusion This paper has explored some challenges in improving water supply services. The case study cited (South Africa) demonstrates that the gap between national water policies and water services can be substantially narrowed and also that, meeting the MDGs is not an impossible task; all it takes is human commitment. South Africa has recorded an increase of 62% coverage by 2002. Although the need for new policies was important for the country, the political will to develop and implement the policies is worthy of praise. The case of Cameroon also cited, where a parliamentary act on water was adopted since 1992 with all provisions still on paper until date, demonstrates that policy alone is not enough (although a necessary first step); it must be backed by actions if success is to be achieved. In conclusion, while there will never be a perfect time to do something with 100% efficiency it could be worthy of effort for other African countries to emulate the lessons from South Africa. Thus the immediate challenge that must be faced in bridging the gap between water policies and services is a strong political commitment.
African Water Journal
24
References Abrams, L.J. 1996. Policy development in the water sector - the South African
experience. Paper written for the Cranfield International Water Policy Conference, Cranfield University, Bedford UK, September 1996.
Bond, P. 2003. The Battle over Water in South Africa, New York Times, 29 May Canadian Environmental Assessment Act, 1994, p. 34 De Paladella Salord M. (2005). MDGs as friends or foes for human development
and child rights. Development, 48, 115-121 Dirk Versfeld. 2000. Sharing South Africa’s water: uncovering challenges for
development through Strategic Environmental Assessment. Paper prepared for the International Symposium on Contested Resources: Challenges to Governance of Natural Resources in Southern Africa, Cape Town, 18-20 October 2000.
Fundamental Principles and Objectives for a New Water Law in South Africa. Availa
ble at http://www.thewaterpage.com/Principles.htm Gleick, P. H. 2004. The millennium development goals for water: crucial objectives,
inadequate commitments. In P.H. Gleick (ed), The world’s water: the biennial report on freshwater resources 2004-2005 (pp.1-15). Washington, DC: Island Press
Kasrils, R. 2000. The Value and Price of Water (The Women of Lutsheko), Proc. of the 10th Stockholm Water Symposium “Water Security for the 21st Century- Innovative Approaches” 14 – 17 August 2000, Stockholm Sweden
MacKay, HM., Rogers, KH, Roux, DJ., (2003). Implementing the South African water policy: Holding the vision while exploring an uncharted mountain. Water SA Vol.29 No. 4 October 2003
Malzbender, D., Goldin, J., Turton, A., Earle, A., 2005. Traditional Water Governance and South Africa’s “National Water Act” – Tension or Cooperation. Int. Workshop on ‘African Water laws: Plural Legislative Frameworks for Rural Water Mgt in Africa’, 26-28 Jan. 2005, Johannesburg, SA
Muller, M. and J. Lane. 2002. The National Water and Sanitation Programme in South Africa: turning the “right to water” into reality, Vol. 1 of 1.
Nomquphu, W. 2005. Overview of the situation and challenges for the water quality monitoring and reporting in South Africa. Work session on Water Statistics, Vienna 20-22 June 2005
Republic of South Africa 1996. Constitution of the Republic of South Africa Act 108 of 1996. Available at www.gov.za
Volume 1 No 1
25
Republic of South Africa. 1994. Water Supply and Sanitation White Paper Republic of South Africa Water Services Act. 1997. Available at http://www-
dwaf.pwv.gov.za/Documents/Legislature/wsa97.PDF Republic of South Africa National Water Act, 36 of 1998 Available at
http://www-dwaf.pwv.gov.za/Documents/Legislature/nw_act/nwa.pdf Republic of South Africa National Water Policy 1997 Available at http://www-
dwaf.pwv.gov.za/Documents/Legislature/nw_act/nwa.pdf Thompson, H., Stimie, C. M., Richters, E. and S. Perret. 2004. Policies,
Legislation and Organisations related to Water in South Africa, with special reference to the Olifants River Basin. South Africa working paper No. 7
Tippett, J., Searle, B., Pahl-Wostl, C., and Y. Rees. 2005. Social learning in public participation in river basin management-early findings from HarmoniCOP European case studies. Environmental Science & Policy, 2005; 8:287-299.
United Nations, 2000a.. United Nations Millennium Declaration A/RES/55/28 September 2000. The millennium goals. New York: United Nations.
United Nations Development Programme (UNDP). 2003. Human development report 2003. New York: United Nations
World Facts and Figures, GDP per capital. 2003. Available at http://www.worldfactsandfigures.com. Last accessed 04/15/2006
African Water Journal
26
Water for Food in the Cities: The Growing Paradigm of Irrigated (Peri)-Urban Agriculture and its Struggle in Sub-Saharan Africa
Olufunke O.Cofie and Pay Drechsel
Summary
The urban population of Sub-Saharan Africa (SSA) will soon exceed its rural population, which demands for a paradigm shift in agricultural research and development. Besides urban sanitation, feeding the cities will become a major challenge of the urban millennium. Urban and peri-urban agriculture (UPA) has significant share in the food supply of many cities in SSA as it supports non-traditional urban diets, particularly with perishable vegetables, fresh milk and poultry products. It also contributes to employment, livelihoods and poverty alleviation. Urban and peri-urban vegetable production, which is intensive throughout the year, depends largely on the availability of water for irrigation. As urban and peri-urban water sources are often polluted, vegetable contamination is common and limiting the official recognition of this informal sector. There are, however, increasing signs of support taking advantage of different options for health risk reduction, which go beyond restrictive irrigation water guidelines.
Introduction
In developing countries, the rate of urbanization is accelerating and from UN estimates the urban population is expected to nearly double in size between 2000 and 2030. According to the projection, between 2015 and 2020, urban population will exceed rural population for the first time and will continue to escalate sharply while rural numbers remain more or less static (UN, 2002). This development inspired the General Secretary of the UN, Kofi Annan, to announce the “urban millennium” (UN-Habitat, 2001). Africa in particular is experiencing one of the fastest rates of urban growth. As population grows, so is the demand for employment, urban infrastructure and food. One of the consequences of urban growth is that the urban resources are put under much pressure. While the World Summit in Johannesburg emphasized the need for appropriate sanitation, ensuring food security and appropriate nutrition for the urban population is a similar challenge particularly for the poorest urban and
Volume 1 No 1
27
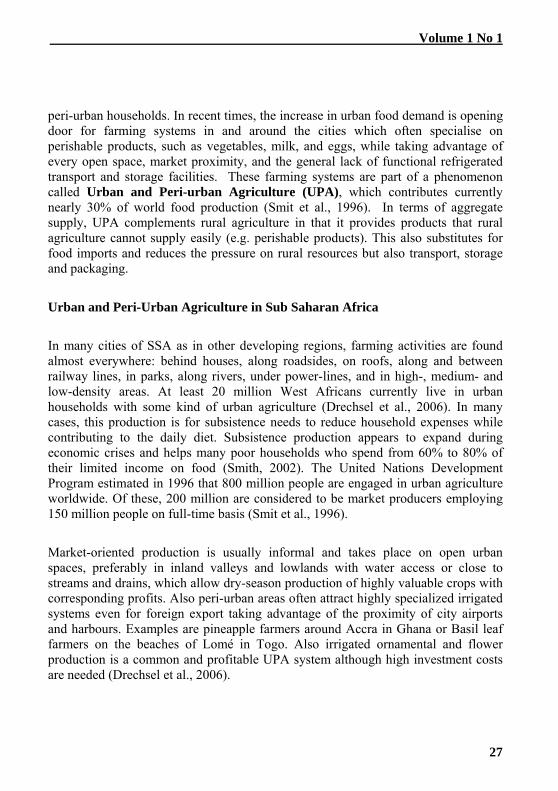
peri-urban households. In recent times, the increase in urban food demand is opening door for farming systems in and around the cities which often specialise on perishable products, such as vegetables, milk, and eggs, while taking advantage of every open space, market proximity, and the general lack of functional refrigerated transport and storage facilities. These farming systems are part of a phenomenon called Urban and Peri-urban Agriculture (UPA), which contributes currently nearly 30% of world food production (Smit et al., 1996). In terms of aggregate supply, UPA complements rural agriculture in that it provides products that rural agriculture cannot supply easily (e.g. perishable products). This also substitutes for food imports and reduces the pressure on rural resources but also transport, storage and packaging.
Urban and Peri-Urban Agriculture in Sub Saharan Africa
In many cities of SSA as in other developing regions, farming activities are found almost everywhere: behind houses, along roadsides, on roofs, along and between railway lines, in parks, along rivers, under power-lines, and in high-, medium- and low-density areas. At least 20 million West Africans currently live in urban households with some kind of urban agriculture (Drechsel et al., 2006). In many cases, this production is for subsistence needs to reduce household expenses while contributing to the daily diet. Subsistence production appears to expand during economic crises and helps many poor households who spend from 60% to 80% of their limited income on food (Smith, 2002). The United Nations Development Program estimated in 1996 that 800 million people are engaged in urban agriculture worldwide. Of these, 200 million are considered to be market producers employing 150 million people on full-time basis (Smit et al., 1996).
Market-oriented production is usually informal and takes place on open urban spaces, preferably in inland valleys and lowlands with water access or close to streams and drains, which allow dry-season production of highly valuable crops with corresponding profits. Also peri-urban areas often attract highly specialized irrigated systems even for foreign export taking advantage of the proximity of city airports and harbours. Examples are pineapple farmers around Accra in Ghana or Basil leaf farmers on the beaches of Lomé in Togo. Also irrigated ornamental and flower production is a common and profitable UPA system although high investment costs are needed (Drechsel et al., 2006).
African Water Journal
28
Depending on cultural specifics and production system these activities can have a very specific gender involvement with women in charge of production and/or marketing and often it is the only source of family income. A survey in 13 countries of West Africa showed that in 16 of 20 cities, men are mostly involved in open-space urban vegetable farming while in most cases, women dominated the vegetable retail sector (Drechsel et al., 2006).
Water use Open-space urban agricultural production can become a profitable venture if market proximity is combined with water availability for irrigation. This permits dry-season production and supports intensive year-round production. Different sources of water are used for UPA in SSA. In Lagos, for example, peri-urban farming depend solely on the Fadama (wetland) where farmers are able to cultivate continuously throughout the year using water from flowing river, ponds, dugwells or washbores. A survey of irrigated UPA by IWMI showed that shallow hand dug wells are commonly used e.g. in Niamey, Lome, Dakar, Kumasi and Cotonou, but also streams were available. Deep wells are reported for example from Bamako while Accra’s urban farmers mostly use water from drains or polluted streams. Some UPA farmers in Nairobi, Ouagadougou and Dakar use wastewater directly from city sewage for agriculture. Pipe water is seldom used because of the cost. Water lifting devices commonly used include buckets, watering cans (Accra, urban Kumasi, Lagos), treadle and motor pumps (Lome, peri-urban Kumasi, Lagos) while water application methods in most cases involve overhead irrigation with watering cans or spraying from hand held hose, while sprinkler and furrow irrigation is seldom, largely dependent on tenure security (Drechsel et al., 2006). The volume of water used depends on the type of crop, its water requirement and intensity of cultivation. In urban Kumasi, for example, about 600- to 1500 mm of water is applied in year-round irrigation of leafy vegetables, compared to about 200 mm in peri-urban dry-season irrigation (IWMI, unpublished; Cornish and Lawrence, 2001). The positive impact of this type of production is related in the first instance to the direct benefits that accrue to the households involved in UPA. Backyard production supports self-employment, income from sales of surpluses, and savings on food expenditures. Open-space production, on the other hand, is straight for the market and can be a full-time job. A review of profits from mixed vegetable production in open-space urban agriculture showed that monthly net income ranges in wide margins between US$10 and more than US$300 per farmer, mostly depending on the
Volume 1 No 1
29
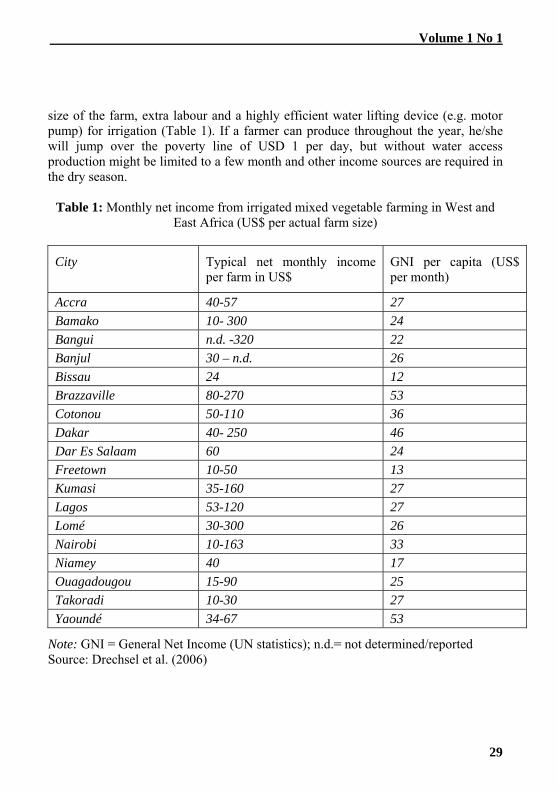
size of the farm, extra labour and a highly efficient water lifting device (e.g. motor pump) for irrigation (Table 1). If a farmer can produce throughout the year, he/she will jump over the poverty line of USD 1 per day, but without water access production might be limited to a few month and other income sources are required in the dry season.
Table 1: Monthly net income from irrigated mixed vegetable farming in West and East Africa (US$ per actual farm size)
Note: GNI = General Net Income (UN statistics); n.d.= not determined/reported Source: Drechsel et al. (2006)
African Water Journal
30
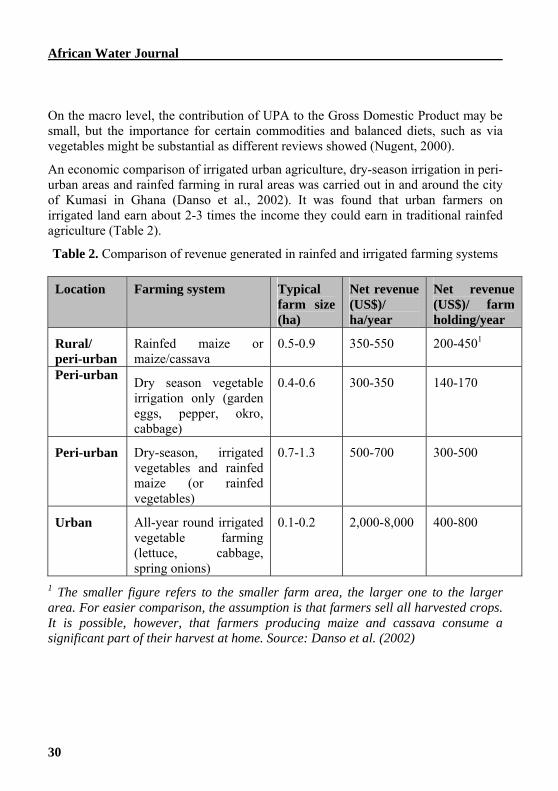
On the macro level, the contribution of UPA to the Gross Domestic Product may be small, but the importance for certain commodities and balanced diets, such as via vegetables might be substantial as different reviews showed (Nugent, 2000).
An economic comparison of irrigated urban agriculture, dry-season irrigation in peri-urban areas and rainfed farming in rural areas was carried out in and around the city of Kumasi in Ghana (Danso et al., 2002). It was found that urban farmers on irrigated land earn about 2-3 times the income they could earn in traditional rainfed agriculture (Table 2).
Table 2. Comparison of revenue generated in rainfed and irrigated farming systems
Location Farming system Typical farm size (ha)
Net revenue (US$)/ ha/year
Net revenue (US$)/ farm holding/year
Rural/ peri-urban
Rainfed maize or maize/cassava
0.5-0.9 350-550 200-4501
Peri-urban Dry season vegetable irrigation only (garden eggs, pepper, okro, cabbage)
0.4-0.6 300-350 140-170
Peri-urban Dry-season, irrigated vegetables and rainfed maize (or rainfed vegetables)
0.7-1.3 500-700 300-500
Urban All-year round irrigated vegetable farming (lettuce, cabbage, spring onions)
0.1-0.2 2,000-8,000 400-800
1 The smaller figure refers to the smaller farm area, the larger one to the larger area. For easier comparison, the assumption is that farmers sell all harvested crops. It is possible, however, that farmers producing maize and cassava consume a significant part of their harvest at home. Source: Danso et al. (2002)
Volume 1 No 1
31
The Complementary Role of Urban, Peri-Urban And Rural Agriculture Overviews given by Nugent (2000) and Smith (2002) showed significant contribution of irrigated UPA to urban food supply, especially with respect to leafy vegetables, and for low-income households. In Senegal, for example, about 60% of the vegetables consumed in Dakar are produced within or close to the city (Niang et al., 2002), while in Accra and Kumasi, the cities supply up to 90% of the most perishable vegetables (Drechsel et al., 2007). Many of these vegetables are “exotic” ones, and not part of traditional diets. But with increasing urbanization, also diets change. In Accra and Kumasi, for example, street vendors selling fast food purchase 60% to 83% of the lettuce available in the markets. The remaining share goes to restaurants, canteens and hotels. Private households take only about 2% in each of the two cities (Obuobie et al., 2006). Especially poorer urban households spend about 40% of their food budget on street food due to lack of water or space for cooking. It was calculated that about 200,000 people from all walks of life consume in Accra’s streets uncooked vegetables from urban agriculture on daily basis. If canteens and restaurants are added, another 80,000 beneficiaries of urban agriculture are possible (Obuobie et al., 2006). But this large group also comprises the part of Accra’s population at risk of food contamination due to polluted irrigation water used for vegetable production as it is common in and around most African cities (Drechsel et al., 2006). The Challenge of irrigated UPA Irrigated (peri)urban vegetable production appears as one of the most productive and income generating farming systems in Africa despite often marginal soils, insecure tenure and its informal character. The success, which is steered by the large urban market and demand for high value crops, also require high inputs in form of water, nutrients and pesticides. While pesticide and fertilizer/manure can be bought, it is difficult to find sites with proper, reliable and cheap water access. In this situation, farmers often make use of typical urban ‘resources’ like water from streams or drains, exposing urban farming to urban pollution. Most farmers are not aware of their personal risk involved with the use of polluted irrigation water, or face other (health) threats of higher priority (malaria, etc.). And in many cases, wastewater is the only reliable water source throughout the year, i.e. the basis of their livelihoods and no issue for discussion (Keraita et al., 2002). Due to low industrialization, the contamination is seldom through heavy metals but through faecal matter. Studies from Ghana, Senegal or Nairobi confirmed that the
African Water Journal
32
bacteriological contamination of urban water sources generally exceeds irrigation standards, for example, by WHO and FAO, and can contribute significantly to crop contamination (Niang et al., 2002; Keraita et al., 2002, 2003; Cornish and Lawrence, 2001). Other problems can be soil and groundwater pollution or salinisation. Thus despite all its benefits in terms of food supply, nutrition, employment, and poverty alleviation, urban vegetable production poses human health and environmental risks which makes it struggle for official recognition, not to mention support, especially in Sub-Saharan Africa with its complex urban sanitation problems (Obuobie et al., 2006; Drechsel et al., 2006).
However, in recent times, cities, such as Dar es Salaam (Kitilla and Mlambo, 2001) are beginning to realise that restrictive policies are bound to be ineffective. The tendency of many local governments now is to formulate more diversified and regulatory policies that seek to actively manage the health and other risks through an integrated package of measures, with the involvement of the direct stakeholders in the analysis of problems and development of workable solutions. In March 2002, the Dakar declaration was signed by seven mayors and city councillors from West Africa in support of the development of the urban agriculture sector, well recognizing the potential problems of wastewater use (Niang et al., 2002). Also a recent declaration (29 August 2003, Harare) by five Ministers of Local Government from East and Southern Africa called for the promotion of a shared vision of UPA. However, recognition is not yet action. To support the important role of irrigated urban and peri-urban agriculture, city authorities will have to work with their farmers to find the right balance between health risk mitigation and livelihood security. There are many options also in situations where better municipal water treatment is not possible in the near future thus no possibility to meet the common irrigation water quality guidelines (Drechsel et al., 2002): Instead of banning urban farmers, authorities could for example allocate areas with safer water sources for farming as done in Cotonou. But also the research community could assist with safer irrigation practices as currently under investigation in projects funded under the CGIAR Challenge Program on Water and Food (www.waterandfood.org/index.php?id=265; www.waterandfood.org/index.php?id=259). As vegetables are usually “refreshed” in markets, the Challenge Program projects are also addressing post-harvest contamination.
Volume 1 No 1
33
Conclusions
Informal irrigation in urban and peri-urban Africa has an impressive niche contribution in the supply of many African cities with perishable food and contributes to employment, livelihoods and poverty alleviation. But it also poses a potential health threat through the common use of polluted water sources. It is therefore important to find a productive balance between safeguarding consumers’ health, food supply and farmers’ livelihoods. This will require sensitive policies and the establishment of new multi-stakeholder partnerships between the sanitation and agricultural sectors across the urban-rural continuum, and between municipal authorities, education and research. This process is facilitated in Africa and beyond by the network of Resource Centres on Urban Agriculture and Food Security (www.ruaf.org).
African Water Journal
34
References
Cornish, G. A. and P. Lawrence. 2001. Informal Irrigation in peri-urban areas: A
summary of findings and recommendations, Report OD 144 HR Wallingford/DFID
Danso, G., P. Drechsel, T. Wiafe-Antwi and L. Gyiele. 2002. Comparison of farm income and trade offs of major urban, peri-urban and rural farming systems around Kumasi, Ghana. Urban Agriculture Magazine 7: 5-6
Drechsel, P., U.J. Blumenthal and B. Keraita. 2002. Balancing health and livelihoods: Adjusting wastewater irrigation guidelines for resource-poor countries. Urban Agriculture Magazine 8: 7-9
Drechsel, P. S. Graefe, M. Sonou, and O.O. Cofie. 2006. Informal Irrigation in Urban West Africa: An Overview. IWMI Research Report 102.
Drechsel, P, Graefe, S, and M. Fink. 2007. Rural-urban food, nutrient and water flows in West Africa, IWMI Research Report (in preparation).
Keraita, B., Drechsel, P. and Amoah, P. 2003. Influence of urban wastewater on stream water quality and agriculture in and around Kumasi, Ghana. Urbanization and Environment (in press)
Keraita, B., P. Drechsel, F. Huibers, and L. Raschid-Sally. 2002. Wastewater use in informal irrigation in Urban and Peri-urban areas of Kumasi, Ghana. Urban Agriculture Magazine 8: 11-13
Kitilla, M.D. and A. Mlambo. 2001. Integration of agriculture in city development in Dar Es Salaam. Urban Agriculture Magazine 4: 22-24.
Niang, S., A Diop, N. Faruqui, M. Redwood and M. Gaye. 2002. Reuse of untreated wastewater in Market gardens in Dakar, Senegal. Urban Agriculture Magazine 8: 35-36
Nugent, R. 2000. The impact of urban agriculture on the household and local economies. In: Bakker, N., M. Dubbeling, S.Guendel, U. Sabel Koschella, H. de Zeeuw (eds.). 2000. Growing Cities, Growing Food, urban agriculture on the policy agenda. DSE Germany, p. 67-97
Obuobie, E., Keraita, B., Danso, G., Amoah, P., Cofie, O.O., Raschid-Sally, L. and P. Drechsel. 2006. Irrigated urban vegetable production in Ghana: Characteristics, benefits and risks. IWMI-RUAF-IDRC-CPWF, Accra, Ghana: IWMI, 150 pp. http://www.cityfarmer.org/GhanaIrrigateVegis.html
Smit, J., Ratta, A., and J. Nasr (Eds.) 1996. Urban agriculture: food, jobs and sustainable cities. UNDP, Habitat II Series, 300 p.
Volume 1 No 1
35
Smith, O.B. 2002. Overview of urban agriculture and food security in West African cities. In: Akinbamijo, O.O., S.T. Fall, and O.B. Smith (eds.). Advances in crop-livestock integration in West African cities. ITC-ISRA-IDRC. Printed by Grafisch Bedrijf Ponsen en Looijen B.V., Wageningen, p. 17-36.
UN. 2002. United Nations World Population Prospects: The 2000 Revision. Population Division, Dept of Economic and Social Affairs, New York
UN-Habitat. 2001. Cities in a globalizing world. Global Report on Human Settlements 2001. UNCHS, Earthscan Publications, London, page 271.
African Water Journal
36
The Water Resources Management Study of the Wadi Tafna Basin (Algeria) Using the Swat Model
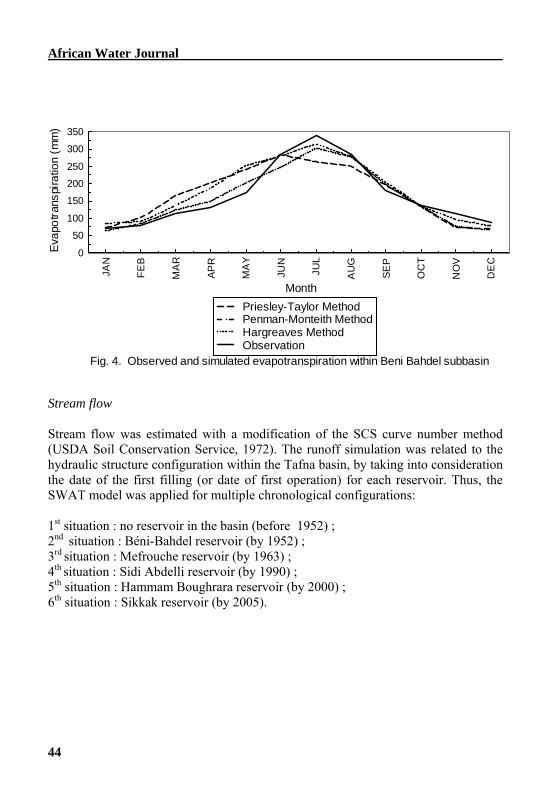
Abstract The water resources management of a hydrosystem corresponds to a set of the decisions making affecting the future of the water resources. This situation requires the use of a methodological approach to the hydrosystem. The hydrological simulation takes a significant part in the water resources management. The worldwide used SWAT model (Soil and Water Assessment Tool), represents a set of large basin modelling tools, such as a hydrologic modelling including climate change, management of water supplies in arid regions, large scale flooding, and offsite impacts of land management. The case of the transboundary wadi Tafna basin (7245 km² of area), the most large and complex hydrosystem in the N-W of Algeria, is studied. The SWAT model is applied to this important hydrosystem, to perform a long-term and an exhaustive analysis of its spatial and temporal water balance variability, representing the required data for the rational and sustained water resources management. The aim of this application is to evaluate the SWAT model, by analysing its proposed opportunities on the hydroclimatic conditions of the Maghreb region. The results of this application demonstrate that the model reproduces and generates properly the climatic variables and permits correct water resources assessment in the basin. The SWAT model gives powerful tools to understand, simulate and evaluate the hydroclimatic phenomena in the large Maghreb wadi basin. Key Words : Hydrosystem, Tafna basin, Maghreb region, Water resources management, hydrological simulation, SWAT model, Water balance Introduction The water resources management is achieved in the spatial unit, the river basin, by means of a required simulation of the hydrological behaviour of its hydrosystem. The hydrological simulation of the river basin provides an effective improvement to the decision making related to the sustained water resources management programs.
Volume 1 No 1
37
The SWAT (Soil and Water Assessment Tool) is a river basin, or watershed, scale model developed by Dr. Jeff Arnold (1998) for the USDA Agricultural Research Service (ARS). The model is the modification of the SWRRB model for application to large basins (Arnold et al., 1990). The model was used with success in several basins worldwide, primarily in the United States and in the many European countries, like the Motueka basin (2075 km²) in New Zelande (Cao et al., 2003), the Alban Hills basin (1000 km²) in Central Italia (Benedini et al., 2003), the Celone Creek basin (24072 km²) in Italia (Papagello et al., 2003), and others. The SWAT model was applied to the Tafna wadi basin that represents the most potential source of water of Western Algeria. An important program of hydraulic structures construction was carried out in this basin, like reservoirs, intake and transfer structures. The objective of the Tafna basin water balance study is to perform the sustained water resources management primarily during the prolonged droughts, similar to the one last drought, started in the early 1980s, and that was characterized by most significant deficits in water supply, were caused an important socio-economical disturbance within the whole N-W Algeria (Errih, 1993). Methodology The SWAT Model The SWAT simulation tool was developed to simulate the effect of alternative management decisions on water, sediment, and chemical yields with reasonable accuracy for ungaged basins. This is the most complete and used model (Arnold et al., 1998; Neitsch et al., 1999; Neitsch et al., 2001 ; Neitsch et al., 2002). This agrohydrological model was firstly used by Arnold in 1994 (Arnold et al., 1998), and it is in continual development and enhancement. Hence, there are several available versions of SWAT, such as SWAT992, running under Windows. SWAT is a comprehensive model that requires a diversity of information in order to run. These informations, organized into database, are related to hydrology, weather, sedimentation, soil temperature, crop growth, nutrients, pesticides, ground water and lateral flow, and agricultural management. The hydrological cycle simulated by SWAT model is based on the water balance equation (Neitsch et al., 2002):
African Water Journal
38
∑=
=−−−−+=
ti
igwpercasurfdayt QWEQRSWSW
10 ) ( (1)
where SWt , SW0 are, respectively, final and initial soil water content (mm/d) ; t is the time (day) ; Rday is the precipitation (mm/d) ; Qsurf is the runoff (mm/d) ; Ea is the evapotranspiration (mm/d) ; Wperc is the percolation (mm/d) ; Qgw is the return flow (mm/d). SWAT operates on a daily time step and requires the use, if available, daily rainfall data and maximum and minimum air temperature. If not, they are generated by the model. The precipitation simulation model developped by Nicks (1974) is a first-order Markov chain model. Solar radiation, wind speed and relative humidity are always simulated. The SWAT model simulates surface runoff by using the SCS curve number technique (USDA-SCS, 1972). Three methods are recommended by the model for estimating potential evapotranspiration: Penman-Monteith (Monteith, 1965), Hargreaves and Samani (1985), and Priestley-Taylor (1972). The Penman-Monteith method requires as input, solar radiation, air temperature and relative humidity. The Priestley-Taylor method requires solar radiation and air temperature, while the Hargreaves method requires only the air temperature. The hydraulic structures integration within the hydrosystem, such as reservoirs, are carried out by the reservoir daily water balance equation (Neitsch et al., 2002) :
seepevappcpflowoutflowinstored VVVVVVV −−+−+= (2) where V is the volume of water in the reservoir at the end of the day (m3), Vstored is the volume of water stored in the reservoir at the beginning of the day (m3), Vflowin is the daily volume of water entering the reservoir (m3), Vflowout is the daily volume of water flowing out of the reservoir (m3), Vpcp is the daily volume of precipitation falling on the reservoir (m3), Vevap is the daily volume of water removed from the reservoir by evaporation (m3), and Vseep is the daily volume of water lost from the reservoir by seepage (m3). The flowing volume represents the water supply, such as domestic demand, industry and irrigation needs.
Volume 1 No 1
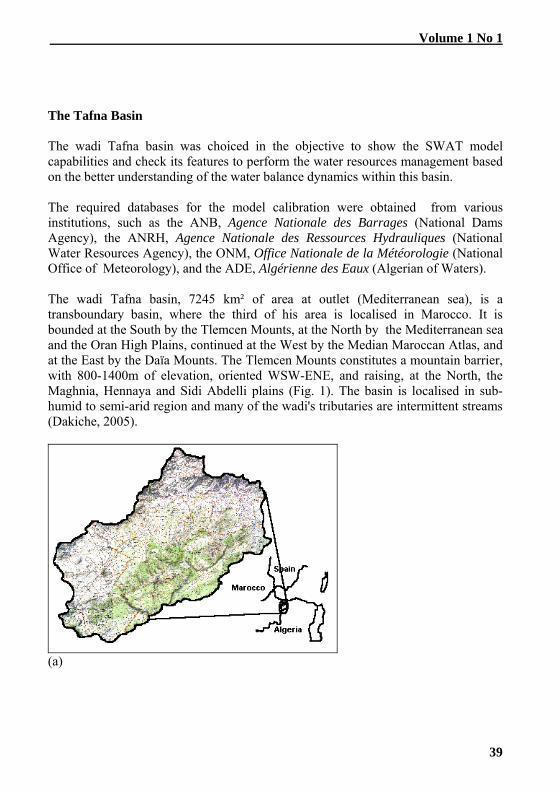
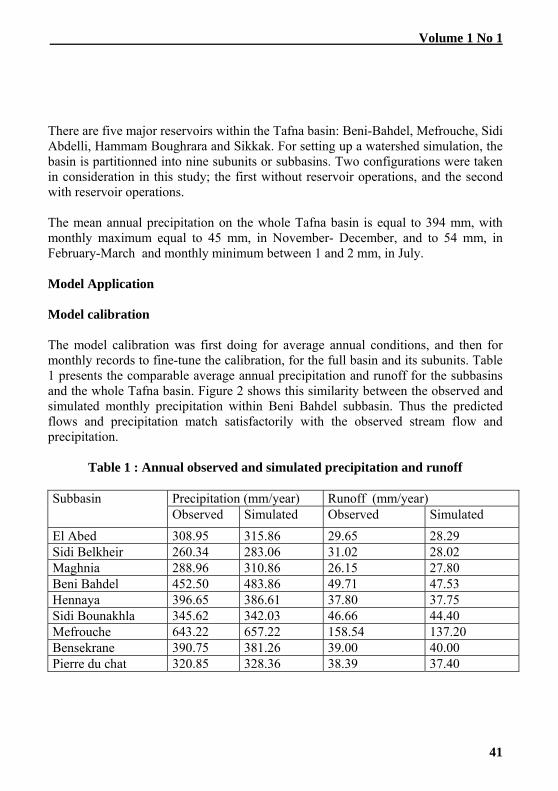
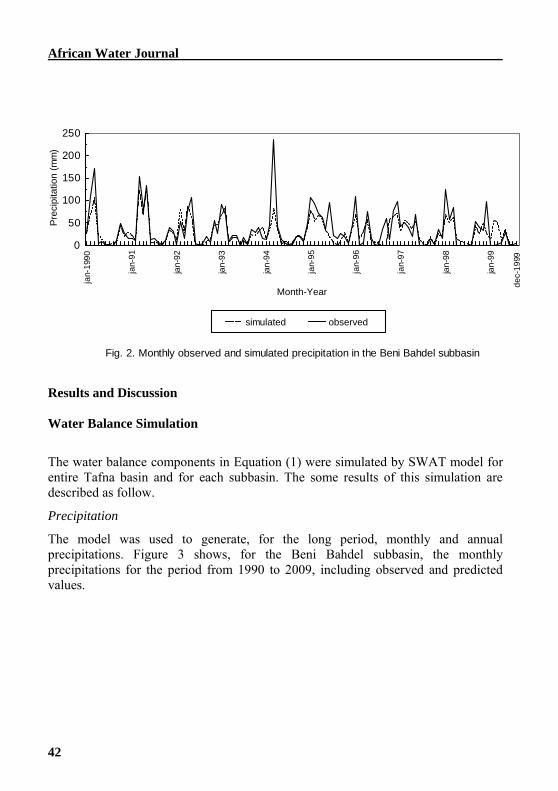
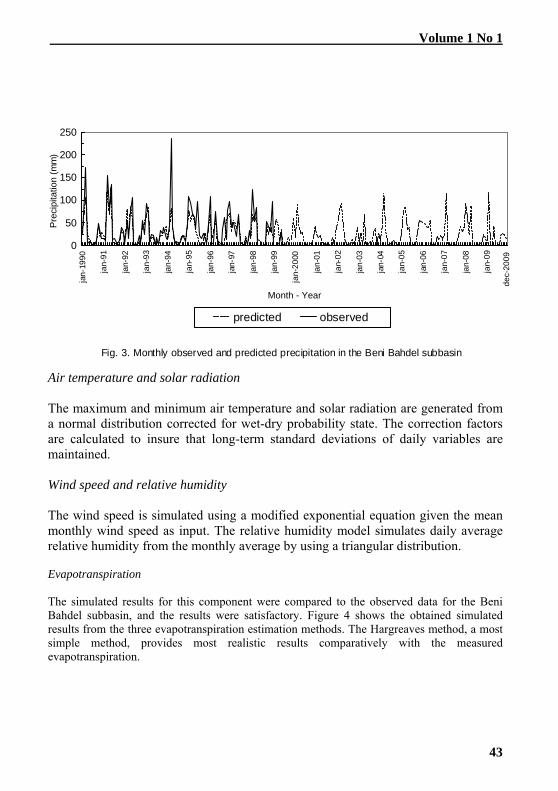
39
The Tafna Basin The wadi Tafna basin was choiced in the objective to show the SWAT model capabilities and check its features to perform the water resources management based on the better understanding of the water balance dynamics within this basin. The required databases for the model calibration were obtained from various institutions, such as the ANB, Agence Nationale des Barrages (National Dams Agency), the ANRH, Agence Nationale des Ressources Hydrauliques (National Water Resources Agency), the ONM, Office Nationale de la Météorologie (National Office of Meteorology), and the ADE, Algérienne des Eaux (Algerian of Waters). The wadi Tafna basin, 7245 km² of area at outlet (Mediterranean sea), is a transboundary basin, where the third of his area is localised in Marocco. It is bounded at the South by the Tlemcen Mounts, at the North by the Mediterranean sea and the Oran High Plains, continued at the West by the Median Maroccan Atlas, and at the East by the Daïa Mounts. The Tlemcen Mounts constitutes a mountain barrier, with 800-1400m of elevation, oriented WSW-ENE, and raising, at the North, the Maghnia, Hennaya and Sidi Abdelli plains (Fig. 1). The basin is localised in sub-humid to semi-arid region and many of the wadi's tributaries are intermittent streams (Dakiche, 2005).
(a)
African Water Journal
40
Fig. 1. Tafna basin (a) Geographic location (b) sub basins An extensive system of water structures captures and controls the flow of the basin's waters in order to meet regional needs for flood control and storage for domestic, agricultural and industrial purposes. The major surface water resources of the Tafna basin are exploited for water supply of the great municipalities of the N-W of Algeria, such as Oran, Sidi Bel Abbes and Tlemcen, where, approximately, 2 million people depend on the surface water resources for agriculture, municipal and industrial water demands.
Volume 1 No 1
41
There are five major reservoirs within the Tafna basin: Beni-Bahdel, Mefrouche, Sidi Abdelli, Hammam Boughrara and Sikkak. For setting up a watershed simulation, the basin is partitionned into nine subunits or subbasins. Two configurations were taken in consideration in this study; the first without reservoir operations, and the second with reservoir operations. The mean annual precipitation on the whole Tafna basin is equal to 394 mm, with monthly maximum equal to 45 mm, in November- December, and to 54 mm, in February-March and monthly minimum between 1 and 2 mm, in July. Model Application Model calibration The model calibration was first doing for average annual conditions, and then for monthly records to fine-tune the calibration, for the full basin and its subunits. Table 1 presents the comparable average annual precipitation and runoff for the subbasins and the whole Tafna basin. Figure 2 shows this similarity between the observed and simulated monthly precipitation within Beni Bahdel subbasin. Thus the predicted flows and precipitation match satisfactorily with the observed stream flow and precipitation.
Table 1 : Annual observed and simulated precipitation and runoff
Fig. 2. Monthly observed and simulated precipitation in the Beni Bahdel subbasin
simulated observed
Results and Discussion Water Balance Simulation
The water balance components in Equation (1) were simulated by SWAT model for entire Tafna basin and for each subbasin. The some results of this simulation are described as follow.
Precipitation
The model was used to generate, for the long period, monthly and annual precipitations. Figure 3 shows, for the Beni Bahdel subbasin, the monthly precipitations for the period from 1990 to 2009, including observed and predicted values.
Volume 1 No 1
43
jan-
1990
jan-
91
jan-
92
jan-
93
jan-
94
jan-
95
jan-
96
jan-
97
jan-
98
jan-
99
jan-
2000
jan-
01
jan-
02
jan-
03
jan-
04
jan-
05
jan-
06
jan-
07
jan-
08
jan-
09
dec-
2009
0
50
100
150
200
250
Month - Year
Prec
ipita
tion
(mm
)
Fig. 3. Monthly observed and predicted precipitation in the Beni Bahdel subbasin
predicted observed
Air temperature and solar radiation The maximum and minimum air temperature and solar radiation are generated from a normal distribution corrected for wet-dry probability state. The correction factors are calculated to insure that long-term standard deviations of daily variables are maintained. Wind speed and relative humidity The wind speed is simulated using a modified exponential equation given the mean monthly wind speed as input. The relative humidity model simulates daily average relative humidity from the monthly average by using a triangular distribution. Evapotranspiration The simulated results for this component were compared to the observed data for the Beni Bahdel subbasin, and the results were satisfactory. Figure 4 shows the obtained simulated results from the three evapotranspiration estimation methods. The Hargreaves method, a most simple method, provides most realistic results comparatively with the measured evapotranspiration.
African Water Journal
44
JAN
FEB
MA
R
APR
MA
Y
JUN
JUL
AU
G
SEP
OC
T
NO
V
DE
C
0
50
100
150
200
250
300
350
Month
Evap
otra
nspi
ratio
n (m
m)
Fig. 4. Observed and simulated evapotranspiration within Beni Bahdel subbasin
Stream flow Stream flow was estimated with a modification of the SCS curve number method (USDA Soil Conservation Service, 1972). The runoff simulation was related to the hydraulic structure configuration within the Tafna basin, by taking into consideration the date of the first filling (or date of first operation) for each reservoir. Thus, the SWAT model was applied for multiple chronological configurations: 1st situation : no reservoir in the basin (before 1952) ; 2nd situation : Béni-Bahdel reservoir (by 1952) ; 3rd situation : Mefrouche reservoir (by 1963) ; 4th situation : Sidi Abdelli reservoir (by 1990) ; 5th situation : Hammam Boughrara reservoir (by 2000) ; 6th situation : Sikkak reservoir (by 2005).
Volume 1 No 1
45
Water Resource management
The water balance for reservoirs in Equation (2) was simulated by SWAT model sequentially for sixth above described situations of hydraulic structure configuration within the Tafna basin. The water balance simulation method for reservoirs used reads in measured outflow and allow the model to simulate the other components of the water balance. Figure 5 shows this chronological variation of the stream flow at the basin outlet related to the variation of hydraulic structure within the basin. In the year 1940, the annual mean flow at the outlet was estimated equal to 285.88 cubic million, as ‘natural’ non influenced flow, and was reduced to 170 cubic million in 1952, with the operation of the first reservoir, the Beni Bahdel reservoir. In 1963, this flow was decreased to 162.9 cubic million with the construction of the Mefrouche reservoir. But in 1990, the basin annual outflow was estimated equal to 140 cubic million with the operation of the Sidi Abdelli reservoir. With the construction of the reservoirs Hammam Boughrara and Sikkak, respectively in 2000 and 2005, the annual mean flow at the basin outlet was reduced, to 75.12 and 50.5 cubic million, respectively. Therefore, any additional structure management should be designed, taking into consideration the available flow.
0 1 2 3 4 50
50100150200250300
Number of major reservoirs
Run
off v
olum
e (m
illion
m3 )
Fig. 5. Mean annual runoff volume variation at Tafna basin outletrelated to the reservoir operation
No reservoir
Beni Bahdel reservoir
Mefrouche reservoir
Sidi Abdelli reservoirHammam Boughrara reservoir
Sikkak reservoir
African Water Journal
46
Figures 6 and 7 show, for the most old reservoirs, Beni Bahdel and Mafrouche, the monthly variation of the storage, the measured and predicted inflow and the reservoir diversions and releases. The SWAT model explains the general trend of the time- series very well. The results of the simulation until 2009 allows a partial sustained water management strategy (with reduced inflow and storage), characterized by a compromise between the complete and restricted supply, in the goal to delaying the moment when occurs the minimum reservoir storage. This related hydrologic situation is explained by the longest drought period that was occurred in 1980 in the N-W of Algeria. Therefore, the rationale water management scheme should be performed for these conditions.
jan-
1990
jan-
91
jan-
92
jan-
93
jan-
94
jan-
95
jan-
96
jan-
97
jan-
98
jan-
99
jan-
2000
jan-
01
jan-
02
jan-
03
jan-
04
jan-
05
jan-
06
jan-
07
jan-
08
jan-
09
dec-
2009
0
10
20
30
40
Months
Milli
on c
ubic
met
ers
Fig. 6. Monthly inflow and outflow variation for the Beni Bahdel reservoir
Outflow Storage Observed inflow Simulated inflow
Volume 1 No 1
47
jan-
1990
jan-
91
jan-
92
jan-
93
jan-
94
jan-
95
jan-
96
jan-
97
jan-
98
jan-
99
jan-
2000
jan-
01
jan-
02
jan-
03
jan-
04
jan-
05
jan-
06
jan-
07
jan-
08
jan-
09
dec-
2009
02468
10121416
Month - Year
Milli
on c
ubic
met
ers
Fig. 7. Monthly inflow and outflow variation for the Mefrouche reservoir
Outflow Storage Observed flow Simulated inflow
Conclusions and Recommendations
Because the principal objective of the water resources management is to regulate the stream flow related to various requirements and usages, the operation plan of each reservoir should be defined in the global water management scheme. Hence, the environmental impacts of the hydrosystem should be carried out to attain an optimal global water management scheme. The managers and decision makers should take into account the water resource shortage and irregularity, and the asynchronism between the significant inflow, occurring in the wet period and the significant outflow (needs), that occurs, in opposite, in dry period.
The study of the complex hydrosystem of the wadi Tafna basin was achieved using the SWAT model to define the operation of each hydraulic structure within the basin. The obtained results show that the SWAT weather generator simulates rainfall correctly in comparison with the corresponded observed values.
The annual stream flow decreases at oulet related to the hydraulic structure improvement was carried out by the SWAT model, which allows to assist managers and planners to make a decision in the opportunity for an additional hydraulic structure within the Tafna basin.
African Water Journal
48
The reservoir operation was established on the water balance simulation results, which allow for Beni Bahdel and Mefrouche reservoirs were proned for severe drought, an optimal decision making to reduce or increase water allocation. Hence, The SWAT model allows to define the management purposes under severe climatic constraints, which produce water deficits that cause the major water management plan disturbances.
In the last years several apprehensions over water quality have arisen because of the environmental stresses caused by agricultural, municipal and industrial sectors, which sources are both in Morocco and Algeria. Knowledge of water quality is of considerable importance in water resources management of the Tafna basin because the recent situation of the Hammam Boughrara reservoir that possesses a range of water quality problems (heavy metals, nutrients, fecal coliform…). This reservoir receives, via the important Tafna tributary, Mouillah Wadi, the major contaminants from the Marocco. Hence, the fact is that the Tafna basin lying across Marocco and Algeria causes several environmental problems, which allow the management of this hydrosystem complex.
scale simulation model for soil and water resources management, Texas A&M Press. College Station, TX., 1990, 255 p.
Arnold, J. G., Williams, J. R., Srinivason R. & King, K. W., SWAT : Soil and Water Assessment Tools, USDA, ARS 1998, 92p.
Benedini, E., Commellozzi, F.& Martinelli, A., “ Model SWAT application in the Alban Hills (central Italy)”, 2ème conférence internationale de SWAT à Bari (Italie) 1-4 juillet 2003
Cao, W., Boaden, W. B., Davie, T.& Fenemor, A., “Application of SWAT in large mountainous catchment with high spatial variability”, 2ème conférence internationale de SWAT à Bari (Italie) 1-4 juillet 2003
Dakiche, A., Contribution à l’étude des régimes hydrologiques des bassins de la Tafna : Evaluation du bilan des ressources en eau superficielle, Mémoire de Magister; USTO, Département d’Hydraulique, Laboratoire HYDRE, 2005, 152p.,
Errih, M., “MIYAH : Programme de calcul de régularisation des ressources en eau superficielles au moyen de barrages-réservoirs” In Actes des Deuxièmes Journées Tunisiennes de Géologie Appliquée, 17-19 mai, Sfax, Tunisie, 1993, pp.590-600
Hargreaves, G.H., Samani, Z.A., “Reference crop evapotranspiration from temperature” Applied Engr. Agric. 1, 1985, pp. 96-99
Nicks, A. D., “Stochastic generation of the occurrence, pattern, and location of maximum amount of daily rainfall” In Proc. Symp. Statistical Hydrology, Tucson, AZ, USDA Misc. Pub. No. 1275, US Gov. Print. Office, Washington, DC, 1974, pp.154-171
Neitsch, S. L., Arnold, J. G. & Williams, J. R., Soil and Water Assessment Tools : user’s manual version 99.2 , Grassland, Soil and Water Reasearch Laboratory, ARS, octobre 1999, 185 p.
Neitsch, S. L., Arnold, J. G., Kiniry, J. R., Williams, J. R.& King, K. W., Soil and Water Assessment Tools : theoretical documentation version 2000, Grassland, Soil and Water Reasearch Laboratory, ARS, 2002, 91p.
Neitsch, S. L., Arnold, J. G., Kiniry, J. R. & Williams, J. R., Soil and Water Assessment Tools : user’s manual version 2000, Grassland, Soil and Water Reasearch Laboratory, ARS, 2001, 781p.
Papagallo, G., Lo Porto, A. & Leone, A., “Use of the SWAT model for evaluation of anthropic impacts on water resource quality and availability in the Celone
African Water Journal
50
Creek basin (Aupilia Italy)”, 2ème conférence internationale de SWAT à Bari (Italie) 1-4 juillet 2003
Priestley, C.H.B. & Taylor, R.J., “On the assessment of surface heat flux and evaporation using large-scale parameters” Mon. Weather Rev., 100, 1972, pp. 81-92.
US Department of Agriculture, Soil Conservation Service (USDA-SCS), National Engineering Handbook, Hydrology section, 1972, Chapters 4-10
Volume 1 No 1
51
Agricultural Water Management in Ephemeral Rivers: Community Management in Spate Irrigation in Eritrea
Berhane Haile Ghebremariam1 (†)
Frank van Steenbergen2 Summary This paper describes the mechanisms that underlie the management of spate irrigation systems. Spate irrigation is a fascinating type of river basin water management, unique to semi-arid environments, whereby floods are diverted from ephemeral rivers to cultivate subsistence or sometimes cash crops. In Eastern Africa the area under community spate irrigation is gradually increasing. An important feature of the traditional spate irrigation systems is the repeated reconstruction of the diversion structures. The institutional challenge is how to organize the reconstruction and maintenance and how to distribute water in the face of the uncertainties and inequities that are inherent to the spate system. The paper describes and analyzes the local organization and water management rules for the Bada system in Eritrea and argues that the local rules and institutions represent precious social capital, that needs to be nourished in the development of spate irrigation in Eritrea. Key words: Spate irrigation, river basin management, water harvesting, ephemeral rivers, maintenance, community management, water distribution, Eritrea. 1. Spate Irrigation in Eritrea Spate irrigation is a type of river basin water management that is unique to semi-arid environments. Water is harvested from river basins or large parts thereof by diverting
1 Ministry of Agriculture Government of Eritrea, PO Box 1048 Asmara, Eritrea. Mr. Berhane Haile tragically lost his life in a flood accident. 2 MetaMeta Research Paardskerkhofweg 14 5223 AJ Den Bosch – The Netherlands ([email protected]), Secretary Spate Irrigation Network (www.spate-irrigation.org)
African Water Journal
52
water from ephemeral rivers. Spate irrigators use the infrequent flash floods in short steep canals, supplying cascades of bunded fields. The objective is to divert as much water as possible during the periods, a few hours to a few days, when spate floods occur. Water is stored in the soil profile. Subsistence crops are common but also sometimes cash crops such as cotton and oilseeds and in some minor areas even vegetables. Spate irrigation is inherently risk-prone. The uncertainty stems from the unpredictable nature of the floods, frequent changes to the river beds from which the water is diverted, and the damage to diversions canals and fields caused by uncontrolled spate flows. Even then in many semi-arid areas spate irrigation is the most cost-effective way to retain and store water and improvements in soil and water management and agronomy have considerable potential to improve water productivity. This article describes a community spate irrigation system in Eritrea and explores the link between local engineering and organization. It particularly explores the organization of maintenance and the distribution of the variable quantities of spate water. Different from other resource systems the special challenge in spate irrigation is the organized cooperation between water users to manage an uncertain resource – with the likelihood of receiving adequate irrigation varying among the water users itself. Spate irrigation is a relatively new phenomenon in Eritrea. Its introduction is traced back to Yemeni settlers from across the Red Sea 100 years ago. The area presently under spate irrigation in Eritrea is assessed at 14,000 ha, which is a fraction of the area that can be developed, estimated to be between 60,000 to 90,000 ha. As elsewhere in the Horn of Africa the area under spate irrigation is gradually increasing. In Eritrea the water management policy in fact is to develop spate irrigation, both in the Western and the Eastern Lowlands. An earlier strategy of constructing micro dams has been abandoned, because of siltation and storage problems. At present there are approximately 11 areas along the Eastern Lowlands where spate irrigation is practiced to a considerable degree. Bada is one of these sites, irrigating in a good year up to an estimated 2000 ha. It is located in one of the most hostile environment of the world, at minus 115 meter below sea level, the Danklyl depression – practically on the border with Ethiopia. The climate in Bada is semi-desert and hot. The months November to March are the coolest periods with an average maximum temperature ranging from 20 to 300C, but July and August temperatures soar to 50 degrees Celsius (MoA, 1995), exacerbated by strong dry winds, that cause soil erosion and reduce soil moisture. The source of the water for the Bada is the Regali River. The floods originate from the catchments of Adi-Keih (Eritrea), Adigrat and Edaga Hammus in Tigray
Volume 1 No 1
53
(Ethiopia). The elevation of these catchments is approximately about 2500 meter above sea level. Using empirical formula the annual runoff was estimated 117 million cubic meters and the peak discharge estimated 650 m3 /s. As in other spate irrigation areas the predominant soils of the plains are alluvial silts, which originating from the heavy sediment loads that the spate flows bring. In Bada one flooding can accumulate 5-7 cm silt on the field. This article first describes the Bada system and the organization that sustains it. It then goes into detail into established practices in maintenance and in the distribution of the spate water supplies. 2. The Bada Spate Irrigation System The Bada area comprises four central villages, using four diversion structures or agim. Using the most recent statistics (1996), the population in Badin is estimated at 4884 persons or 848 families. Most people are of the Afar origin and are sedentary farmers. The agricultural system in Bada is to plough the land, to construct the agim and to repair the field bunds (kifaf) in the period March to April. Flooding the fields and maintenance of the agim takes place in July and August and fields are ploughed to conserve soil moisture. The first crop, usually sorghum, is normally seeded in September. The actual seeding date however depends on timing of the floods. If the flood arrives very early, cultivation may start even in August and the crop may be harvested in December. If an additional flood is available, the sorghum is usually ratooned for a further two months, although some farmers plant maize. Occasionally, if water is available, planting watermelon follows the ratoon (FAO 1994). The average yields range between 800-1600 kg/ha for the first crop and an additional 500-800 kg/ha for the second or ratoon crop. Several indigenous engineering techniques have been developed to divert and use the temporary flows. The irrigation methods are elementary, but effective. They are similar to local structures found in spate irrigation systems elsewhere (van Steenbergen 1997; FAO 1987). Two types of agim are common: deflector type low earthen bunds and weir type low earthen bunds. Deflectors extend into the bed of the wadi at an angle in a direction parallel to the current and are protected by brushwood and stones. In Bada they are of relatively short length, i.e. 20-40 meter. If the flood is very high and beyond the capacity of the off take, the structure will be breached. This serves as a safety valve and spares farmers the destruction of canals and field embankments. The weir type of agim is constructed at more or less at right angles to the wadi banks and extends over its full width. In this system the diversion structure is built from
African Water Journal
54
riverbed material extending across the low flow channel of the wadi with the objective of diverting the entire low stage of the spate flow to their fields. As there is no provision for a spillway, this type of agim – as with the deflector type - during a large spate is either breached deliberately or it is overtopped and breaches by itself. The demolition of the agim can happen before the whole command area is irrigated. Repairs works have to be carried out as soon as possible after the breaching before the next spate flow arrives; otherwise an additional irrigation is missed. How soon this can be effectively achieved will depend on subsequent wadi flows and the availability of labour and animal power. Missing a spate flow will decrease yield and can sometime leads to the total failure of crops. Depending on the location and on the availability of material the agim can be built of stones, soil, brushwood and tree trunks, gabions or a mixture of materials. Different agims have different characteristic. Farmers in Bada assess soil agim as having minimum seepage, but being relatively easy washed away by the floods. Stone agim resist more the force of floods better, but cannot retain water. An agim constructed of brushwood and tree trunks neither resists the force of the flood, nor retains the water. Gabion agims are relatively costly to build initially and the material and skills are sometimes difficult to obtain. Table 1 compares the typical construction and maintenance of different type of agim in Bada. Table 1: Cost Comparison Traditional type of agims Type of agims Initial
cost in $
Estimated damage in % of initial cost during normal spate season
Number of repetitions of construction during normal spate season
Annual maintenance cost in $
Stone 88 50 1 44.5 Soil 31 100 2-4 63.5 - 126 Brush wood 40 60 2-4 48.6 - 97.2 Mixed 60 40 2-4 48 - 96 Gabion 325 20 ----- 65 Apart from the diversion structures, there is an extensive network of flood channels in spate irrigation systems. The primary canals taking off from the wadi have a large capacity in relation to the area irrigated because of the short duration of spate flows.
Volume 1 No 1
55
The structures in the channel network consist of:
• Spillways • Drop structures • Field channels • Soil retention structure.
Box 1 describes the different structures. The network of flood channels often represents the major local investment and farmers will carefully avoid too much damage either by uncontrolled floods or heavy sedimentation in the channel network. By having traditional diversion structures that are inherently weak and that are washed away in very large floods, uncontrolled water flows into the command area are avoided. Box 1: Flood channel network structures Spillway (Khala) Spillways in Bada are called khala. The purpose of this structure is to control the distribution of water entering to the fields. The structure is therefore constructed on the side of the embankments of the field canals. The size of the spillways varies between 1.2 and 3.5 meters. Any discharge exceeding the capacity of the canals (bajur) will return through this structure back to the main canal. Occasionally this type of structure is also built to transfer spate water from one field to another when the difference in ground surface level is relatively high. Khala is usually built on the earth embankments of the bajur. The crest of the khala is covered by grass or riprap to control erosion. The free board of the spillway varies between 40 and 75 cm. Drop structure (Mefjar) Drop structures in Bada are called Mefjar. These structures are built in spate canals either when a canal has a steep longitudinal gradient; the water is transferred from a higher canal to a lower one; or the water is diverted from one field to another. The purpose is to dissipate flow energy so that scouring is minimised. The structures are usually made from with stones interlocked properly and the gaps filled-in with smaller stone. In some cases the drop structure is covered only by grass. The width of these drop structures varies according to the size of the canals; the height varies between 40 to 60 cm. Field channels (bajur)
African Water Journal
56
The bajur is the channel leading water to the fields. The word is also used for the subsections in the command area. In case of water distribution with permanent distributory canals the purpose of the field channel is to delivery water from the main canal to the agricultural lands in quantities proportional to the irrigated areas independent of the size of the flood in the wadi. But in the field-to-field system it conveys water from the diversion structure or agim to the field directly. Soil retention structures (Weshae) The structure is built on the edge of the wadi to protect the agricultural lands adjacent to the wadi. Besides, the structure is used to silt up plots during the development of new lands. The structure is usually built from stones and the gaps are filled with stones of smaller size. Stones used in construction are usually laid in one plane as a smooth surface to minimise the tangential flood force on the structure. According to interviewed farmers, this type of structure is also used to control large floods together with the diversion structure or agim. In this situation the structure is constructed at least 10 m upstream of the diversion structure or agim. The purpose of the structure is to reduce the velocity and the strong current force of the floods. The size of the structure depends on the topographical position of the site. In most cases the length varies between 10 and 15 m and the width between 40 and 60 cm at the initial stage. The structure is built on the edge of the wadi to protect the agricultural lands adjacent to the wadi. Besides, the structure is used to silt up plots during the development of new lands. The structure is usually built from stones and the gaps are filled with stones of smaller size. Stones used in construction are usually laid in one plane as a smooth surface to minimize the tangential flood force on the structure. According to interviewed farmers, this type of structure is also used to control large floods together with the diversion structure or agim. In this situation the structure is constructed at least 10 m upstream of the diversion structure or agim. The purpose of the structure is to reduce the velocity and the strong current force of the floods. The size of the structure depends on the topographical position of the site. In most cases the length varies between 10 and 15 m and the width between 40 and 60 cm at the initial stage. 3. Organization and Management of Spate Irrigation As the continuity of spate irrigation strongly depends on collective labour and collective water management and will fail without it robust organizational structures have developed in Bada. Unwritten rules govern the distribution of irrigation water
Volume 1 No 1
57
as well as the maintenance of the diversion works. The system of collective organization came about in the 1940’s and has been sustained ever since then. Although the villages have their own agim they are administrated as one system. The organization has a number of outstanding features:
• Strong linkage with local government, creating a continuum between the formal government organization and the informal user organization
• Articulation into smaller groups, that allow face- to- face contact and facilitate the organization of collective labour
• Accepted manner of distributing the uncertainty in water supplies that is inherent to spate irrigation
3.1. Continuum between Local Government and User Organization In Bada the local council (baito) is the most important institution. It is the link between the community and the local administration. Before the baito were established as part of the liberation struggle, village councils or mahber were in place. The mahber were composed of all male elder and sheikhs. The head sheikh of the village called on the mahber to discuss issues, such as disputes over grazing territory, agricultural lands, blood feuds and many others problems. When liberated areas came under the control and influence of revolutionary movements in Eritrea, new political structures emerged, sustained by younger members of the community. The main responsibility of the baito during the war was to secure areas, to mobilize communities for self-rule and self-help and to manage relief and development assistance. After the war the baito remained an important political power, but its main function became development oriented. The baito is nowadays formed of persons elected by all villagers with voting rights, whereas 30% of the total seats in the baito are reserved for women. The Executive Committee elected by the baito is composed of a chairperson, a treasurer and a secretary. The establishment of the baito led to significant changes in terms of power relations. Groups of lower strata, including women began to dominate these political institutions. The Irrigation Committee is a subcommittee of the Baito and extends into the informal organization. In Bada it consists of four members, i.e. one from each village. Under each village's representative there are bajur (or irrigation group) leaders. The main task of the Irrigation Committee is to assess problems related to the diversion structures. The committee assesses the common work to be done, the human and animal labour requirements for each type work and the kind of raw
African Water Journal
58
materials (boulders, stones, soil, brushwood) needed. Another task of this committee is to decide which agim should receive water and for how long. Within the bajur (subdivision) the responsibility to distribute the water are with the bajur leaders, who also give orders to the farmers concerning the maintenance and construction works. A bajur consists of 15 to 45 farmers, the actual number depending on the size of the bajur. The bajur leaders have the following responsibilities:
• Organising and supervising their group during construction and maintenance of the main and sub-system;
• Supervising the water distribution within their group and solve any problems arising;
• Implementing local rules for the management of floodwater; • Imposing fines on those who waste water or steal water from adjacent
fields. • Collect land tax among the individual farmers in the group.
If the (bajur) leaders are confronted with problems, which cannot be solved by them selves, they have to inform the Irrigation Committee. If this committee cannot find a direct solution, they send an emergency call to the baito and its Agricultural Committee to discuss the issue. If even at this level the problem cannot be solved, the case is transferred to the district office, but this does not happen often. 3.2 Articulation into Smaller Groups The organization is further articulated into sub-groups. The sub-groups have been formed for administrative reasons and allow information to reach each individual farmer easily. For instance, individual farmers can be member of a specific sub-group, because their houses are in the vicinity of each other, or their fields are situated next to each other. Each sub-group has a leader, who is an important intermediary between the individual farmers in his sub-group and the bajur leader in conveying information and orders of the bajur leader to individual farmers and in submitting messages and requests of the individual farmers to the bajur leader. The sub-group members elect the leaders of sub-group. The farmers elect their sub-group leader, bajur leader and committee members directly, without any intervention of others. In general, leaders are elected for an unlimited period of time. In order to be elected as bajur or sub-group leader, a candidate should be physically fit, having authority to mobilize the farmers for collective labour and preferably literate. The different leaders do not receive any
Volume 1 No 1
59
remuneration for their services and they even have to cover themselves all administrative costs involved, such as the purchase of paper and pens. Before any measure is taken by the committees or bajur leaders, they have to organize meetings. Most of the bajur have regular meetings during a year. Other bajurs meet only if there is a need. In general, at system level there are four regular meetings during the year. The first meeting is typically held after the harvest to discus the reconstruction of the agim. The second meeting takes place after the reconstruction work to evaluate the work on the agim. The third meeting is held before the start of the planting season to discuss if agim requires additional maintenance and the measures to take to avoid damage to the crops by pests and livestock. During this meeting the farmers also decide to which fields the water of late floods should be diverted. The fourth meeting takes place after the planting period to organize the protection of the field crop and to discuss measures to control floods especially in the field to field system. The general consensus is that meetings should be attended by at least two-third of all farmers. Farmers absent during a meeting have to accept the decisions made. At system level the meetings are in general organized if there are new issues to be discussed. For routine work, the committees and the bajur leaders make all decisions. In urgent cases the chairperson of the Agricultural Committee has the authority to give direct orders to the bajur leaders or sub-group leaders. 3.3 Fair Rules On Contributions The most important activity by farmers in the study area is the construction and maintenance of agim. Without these structures farmers will not be able to cultivate crops and thus suffer from draught and hunger. All the farmers in this area consider these activities part of their main livelihood strategy. The nature of spate irrigation however is that, different farmers have different probabilities of being served by irrigation. Inequity is hence part of the system and the challenge is to develop rules and practices, which are accepted as fair. The reconstruction activities are organized by the Irrigation Committee, which orders the 20 bajur leaders to bring the required amount of labour and materials. Each of the bajur leaders has the responsibility to bring their members to the destined place on time. This is arranged before the floods start. If the structure fails during a high flood, the Agricultural Committee gives an emergency call and even small children have to participate in maintenance activities. In the construction of the agim everybody in the village should participate except for females heading a farm. After
African Water Journal
60
the main diversion structure has been constructed, bajur cleaning and reinforcement of the individual field embankments (kifaf) proceed. The contribution of labour for construction and maintenance work depends on the size of land holding of the individuals and is proportional to that holding size. For example: if a farmer is having 1 ha of land he is ordered to work for one day, the one who has 3 ha should work for three days. Steenbergen (1997) also noticed in Barag (Las Bela district in Pakistan) that all landowners are expected to participate in the repair work in proportion to the size of their holding irrespective of its location. According to the interviewed farmers this rule has been developed throughout the times and to some extent avoids the inequality in the system. The benefits however, are not proportional to the contributions made because of the inherent uncertainty of spate diversion. The traditional way of constructing the diversion structure is cumbersome as the agim are built from soil, brushwood and/or boulders. They tend to fail several times every season (see table 1), and have to be rebuilt repeatedly. The unproportional benefit is caused by the fact that upstream farmers can irrigate their land several times per season (especially in the field to field system), while some of downstream farmers may not irrigate at all. In more equitable systems, some landowners benefit from the first constructed agim, others from the second, yet others from the third and so on. Who will benefit from which agim is not known in advance. Van Steenbergen (1997) noticed in Balochistan (Pakistan) that at the reconstructing of agim, upstream farmers might be reluctant to participate in constructing the later version, unless they can utilize water for a second time. In turn, tail-enders may refuse to contribute to the construction of the initial agim. In the case of Bada all farmers participate in the construction and reconstruction of agim, irrespective of the location of their plot. One farmer from the tail-end said, when asked why he did not terminate his participation since he received less water than others: “This system has been used by our fathers (predecessors). We have to take the same path, in the some sprit in order to achieve what we are getting now. Refusing the inherited traditional culture is not acceptable by the community. So we make a comparison and work together. But water is a gift of God no other one is capable to take or to give this natural resource.”
Volume 1 No 1
61
4. Construction and Maintenance Activities Various activities are carried out during construction and maintenance of agim:
• Cutting and transporting bushes and tree trunks; • Dislocating and gathering boulders from the wadi; • Stone quarry and transporting from other places; and • Enforcement of agim by scooping the wadi bed materials.
The type of work differs with the type of wadi, the type of agim and the period of the year. During winter, when water levels are low, soil agim are constructed and the main activity will be the scooping of wadi bed materials. None of the work is mechanized in Bada and farmers participate with their oxen drawn scooping tools, locally called mehar. This activity needs a minimum of two pairs of oxen: one to break the crust of the topsoil and the other one to scoop the soil (mejehaf). The rental cost per oxen/day is 30 Nakfas3 (one oxen/day is 4 hours during the hot season and 7 hours in the cool season). Two pair of oxen can make an agim of 5 m length, 0,5 m height and 1.5 m width, if the soil is sandy or silty. Transporting boulders takes place before the construction of any type of agim. Even soil agim need boulders as foundation, and brushwood agim needs boulders to press the brushwood after the alignments. The farmers indicate that one person can transport a cubic meter of boulders per day at the construction site, at a cost of 15 Nakfas. If the quarry site is far away, camels are used to transport the stones. The rental cost of a camel/day is 30 Nakfas. The total cost per m3 of boulders depends on the distance of the quarry area from the diversion site. Tree cutting and transporting takes place during the construction of brushwood and mixed agim. This activity is carried out with the help of oxen and camels. The time and the quantity of work depend on the distance of the forest area from the diversion site. If human labour is used to transport, it will take 10 - 15 men to carry one trunk. According to farmers the transport of stones and boulders is the most labour consuming activity, followed by the transport of trunks. Farmers said that their oxen have to spend much power to transport tree trunks. Scooping soil (Mejehaf) is considered the easiest job.
3 1 USD is 13.5 Nakfa
African Water Journal
62
The traditional spate irrigation system demands a great deal of labour and large amount of draught power. A minimum critical mass of human and animal resources is essential. In Bada, this determines the timing of the major activities in the construction and the repair of agim as well as that of the field level preparation activities (such as levelling, enforcement of kifaf and building the perimeter bunds, locally called sheham). Mostly men and boys above 12 years of age do the reinforcement of the plot embankments, levelling and ploughing and participate in the construction of main agim. Hired labour is only used by those who can afford it. Women are participating only in irrigation and harvesting activities, but not in the repair of the diversion and field structures. Several unwritten rules create a tight discipline in the preparation of land, labour contributions, the maintenance of field bunds, construction of agim and non co-operation of farmers. Farmers are highly interdependent and the neglect of someone’s field bunds upstream can cause a loss of water to the areas downstream. The Agricultural and the Irrigation Committees are responsible to set additional rules when needed and then the rules have to be approved by all farmers at system level. These rules also include fines to be paid in cash, if a farmer does not obey (see box 2). The rules are best understood as norms and agreed sanctions. Actual punishment is often based on the judgment of the Irrigation Committee members and the rules are not applied rigidly. Reputation and the relations of the farmer with the committee member, influences actual punishment. Box 2: Penalties in maintenance of distribution network in Bada
• If a farmer is ordered to contribute labour or to bring his oxen with scoop, for the construction or maintenance of agim, but fails to do so, he is penalised. He has to pay an amount of money equivalent to the value of the expected contribution. The treasury of the Baito keeps the income from the penalty and used to cover cash expenses at system level;
• A farmer who does not take care of his farm (especially with respect to erosion control) during the first 6 months is liable to pay 30 Nakfas;
• If damage is caused by failing to construct the two types of kifaf (outer or inner field bund) the penalties differ:
Volume 1 No 1
63
a farmer who refuses to construct the inner kifaf is liable to pay 30 Nakfas and should do the work which he was supposed to do or he should pay for the work to be done by others; a farmer who knowingly damages the inner kifaf during irrigation is
liable to pay 60 Nakfas and should repair the damage or pay for the maintenance cost; a farmer who refuses to construct the outer kifaf after his leader order,
will be fined 60 Nakfas; a farmer who knowingly damages or breaks the outer kifaf during
irrigation will be fined 120 Nakfas. Beside that, he will be forced to construct the kifaf or to pay the cost of its repair;
• a farmer who breaks the gasbet (small field channel) will be fined 120 Nakfas. In addition, he will be forced to repair it or pay the costs of its repair;
• if a farmer opens the gasbet before the upstream field is fully irrigated, he will fined 30 Nakfas. If, due to the consequence of this action the above field is not irrigated, half of the farm land will be confiscated and given to the owner of the farm land above so that he can plant his crop for that particular cropping season;
• any farmer who does not leave enough space for gasbet on in his farm land will be fined 30 Nakfas;
• any farmer who rejects the orders of a bajur leader will be fined 30 Nakfas;
• any farmer who rejects the order of the sub-group leader will be fined 15 Nakfas.
5. Water Distribution System In Bada two types of water distribution systems are in existence. The first is the field-to-field distribution system without permanent division structures and without canals at field level. Water travels from one bunded field to another. The second type of water distribution system in Bada has a network of division structures and distribution canals supplying the different fields. This second type is predominant in Bada. 5.1 Field to Field Systems In the field- to -field system the main canal or bajur diverts the water to a block of
African Water Journal
64
fields. The bunded fields, locally known as a seham, are surrounded by raised earthen dikes. The shortest earthen bund is called kifaf and the longer side is called sherje. The size of a bund in a new developed field ranges from 75 to 150 cm in height and from 100 to 200 cm in width. In older fields the height might reach up to 300 cm and the width up to 400 cm. This is because the silt that is deposited annually in the field is partly removed and scooped to the field bunds. The sehams are most of the time rectangular in shape and vary in size. Most of them have a width of 40 to 80 m in the down-slope direction and about 110 to 200 meters in the contour direction. Normally a field has one opening to allow water to enter. During irrigation the water will be ponded up till a depth of 60 to 100 cm. Water is conveyed to the next seham by breaching one of the inner kifaf, facing the field to be irrigated. So water flows from the top-most field to the next until all fields under the command of a branch canal are covered. When all the fields in a certain block are watered, the farmers breach the check bund in the bajur. Flow along the bajur continues until it is diverted by the check bund in the bajur commanding the next block of sehams. This process is repeated until the entire spate flow is dissipated. The reliability of getting water through this system is directly related to the distance to the wadi on both flanks of the rivers and the distance from the point of diversion. The system is quite effective with regards to sediment transport. Nearly all the sediment carried by the natural wadi flow is conveyed with reasonable efficiency to the fields. The field to field system has however a number of shortcomings:
• The system operates on first come, first served basis. Furthermore the conveyance and the distribution system are not well developed. The farmers at the top of the system receive a relatively high amount of water, while those at the tail-end receive smaller amounts or nothing at all;
• As most of the fields are not well leveled, the water depth in the field is varying. This results in highly varying yields with in one field. Scoring and deposition of spate flow sediments create the unevenness in field level;
• Overtopping of water from one seham to another often erodes the kifaf, due to the difference in ground levels between the fields;
• In most cases it is difficult to control erosion, as there are no reinforced overflow or escape structures between the plots.
. 5.2 Permanent Networks
Volume 1 No 1
65
These shortcomings are avoided in permanent distribution networks. In such areas – most common in Bada – water is conveyed to the fields through separate channels. There is a main canal, which supplies water to smaller canals (bajur). The width and the length of bajur depend on the extent of the fields irrigated from the specific bajur. In most cases the width of bajur varies between 1 to 3 m. where the topography is not allowing to supply water directly from the bajur to the field, water is conveyed from the bajur through a smaller canal to the field. This canal is called gasbet. The width of the gasbet varies between 0.75 and 1.25 meters. Each field has an off-take locally known as mekfel, which regulates the amount of water entering the fields. The size of these off-takes varies, but mostly the width is between 1 and 2mts. The kifaf is a bund constructed for retaining water inside the farmland. There are two types of kifaf. The inner kifaf or zebir is constructed within the plots in case of high elevation differences. In this way water is spread relatively uniform within the plot. The outer kifaf is larger in size and is constructed around the entire field to retain the floodwater and to prevent erosion. 5.3 Water Distribution Rules Unpredictability is inherent to spate irrigation. Water distribution rules regulate the distribution of the unpredictability water supplies. They impose a pattern and reduce uncertainty by at least regulating the relation between the landowners that have access to flood water. In Bada there exist several types of rules. The most important ones being the sequence in which the different fields along a flood channel are watered. Sequence rules in Bada are called Dinto. In Pakistan they are called numberwar and in Yemen rada’ah. The sequence usually adjusts to the level of the floods. If the flood is low, the water will only flow in one or two of the priority bajur. But if the flood brings large quantities of water, it will find its way through a large number bajur simultaneously and a large number of fields are irrigated at the same time. There is restriction on second irrigation turns. Particularly in the areas with a permanent network, upstream farmers are not allowed to irrigate for the second time before all fields downstream have received water. Water distribution depends on the availability of water. If the Irrigation Committee believes that there is enough water, all four agim operate simultaneously. But if the water is insufficient, then the upstream agim is given first priority. In times of scarcity, the Irrigation Committee further decides which part of the fields – served by a certain agim - will be irrigated. This is not necessarily the upstream land. The
African Water Journal
66
selection of fields is often based on their moisture condition. The first fields to be irrigated preferably are those with the driest soil, not necessarily those that are found in the upstream part. Both the restriction on second turns and the preference to serve dry fields first in times of water shortage serve to maintain a certain degree of equity. In turn this equity serves to keep all water users on board in the organization of the common labour tasks. 6. Conclusion: Managing Inequity and Managing Uncertainty The risks in spate-irrigated agriculture are high and not equally distributed throughout the system. There are fields with high, medium and low probability of irrigation. This probability depends in first instance on the location along the wadi. In Bada the upstream fields take often precedence. The sequence of irrigation depends heavily on the ability to control the flood at any given location. Where the river is deep and its bed is steep, the management and the control of floodwater is precarious because obstructions will not withstand high floods. If floods are moderate, the downstream intakes will be dry and all the water will be diverted by upstream off-takes. Fields that are located in the head reaches of a flood channel usually take priority in water supply. There are however a number of mechanisms in Bada to reduce inequity in water distribution. First is the prevalence of the permanent channel network that avoids water that is concentrated excessively in the upper reaches, as is the case in field- to- field irrigation. The second set of rules that modifies the difference between upstream and downstream plots are the restrictions on second turns and the practice of distributing water to the driest fields first in times of water scarcity. These mechanisms serve to reduce the difference between landowners and help to keep the local organization intact that is required to undertake the continuous maintenance on the bunds. As mentioned in restoring the agim and undertaking the other maintenance work, a critical mass of human and animal labour is required. Inequities are further mitigated, because farmers, whose land did not receive a single watering during the season, may employ themselves as labourers on land that was irrigated. This is particularly true of farmers who own draught animals. Tenancy and seasonal labour are widespread in the area and are partly a response to the differences in water supply in Bada. The question arises if farmers frequently deprived of irrigation and farmers with fields watered during every flood should contribute in the same proportion to the building and the repair of agim. To apply a differentiation in labour input is however very difficult, as it is impossible to weigh
Volume 1 No 1
67
the different probabilities in receiving irrigation water. Hence the inequity is being compensated through the inequity reducing mechanisms above and through the labour market. On top of that, there is a robust local organization that combines a number of features – integration into the local administration, articulation into smaller groups, a set of penalties to induce discipline and the flexibility of a local irrigation committee to apply these measures at discretion. All this represents considerable social capital that needs to be nourished and carefully considered in the development of spate irrigation systems, as is the current policy in Eritrea. Investments in the local organization managing the water systems are equally if not more important than other investments that help to increase the utilization of scarce flood water in the country.
African Water Journal
68
References FAO, 1987. Spate irrigation, proceeding of the sub regional expert consultation on
wadi development for agriculture in the natural Yemen. FAO, 1994. Eritrea Agricultural Sector Review project identification. MoA, 199 Bada-project proposal paper. MoA, 1997. Eastern Low lands Wadi Development project. Engineering feasibility
study. MoA, 1997. Strategy on farmer participation and formation of farmer organisation Nooij, A. 1997. Social Methology. Normative and Descriptive Methodology of
Basic Designs of social research. Wageningen Agricultural University; Netherlands.
Van Steenbergen, F. 1997a. Understanding the sociology of spate irrigation: cases from Balochistan. Journal of Arid Environments, 35, 349-365.
Vincent, L and Lackner, H.1998. Participatory irrigation management in spate irrigation.
Volume 1 No 1
69
Spatio-Temporal Rainfall and Runoff Variability of The Runde Catchment, Zimbabwe, and Implications on Surface Water
Resources
Mugabe, F.T.1*, Hodnett, M.G.2, Senzanje, A.3 and Gonah, T1 Abstract The variability of the rainfall and runoff of the Runde catchment is considered both temporarily and spatially and its implications on surface water resources explored. Data from six rain gauge stations and 12 stream flow gauging stations of the Runde catchment (41 000 km2) were used to study this variability and to determine whether any useful relationships could be established between. The mean annual rainfall of the six rain gauge stations Chiredzi, Chendebvu, Chivi, Masvingo, Zvishavane and Gweru are 562, 591, 544, 582, 576 and 676 mm with coefficient of variation of 39, 43, 37, 44, 38 and 30% respectively, showing strong inter-annual and spatial variability in the catchments. Cycles of variation of annual rainfall were observed and the long-term trends in runoff and surface water resources reflect the effect of such rainfall cycles. Significant correlations between rainfall and runoff were observed for some of the sub-catchments. Keywords: rainfall, runoff, variability, and surface water resources. Introduction
Zimbabwe has been divided into 7 catchments (ZINWA, 1995) each defined by a major river system and its associated tributaries. Catchment delineation was done in order to effectively manage water resources with the participation of all stakeholders (ZINWA, 1999). Of these catchments, Runde (41 000 km2) is one of the three catchments that lie in the driest parts of the country covering Natural Regions III, IV and V and major districts and towns. It constitutes of 22% of the area (Figure 1) of the country and 40% of this catchment is in communal lands (Anderson, et al., 1993). Its mean annual rainfall is about 684 mm and droughts are frequent. The catchment contains 45 large dams that are used by communal, resettled and commercial farmers for irrigation and water supply. Some are also used for mining
African Water Journal
70
purposes. The Lowveld sugar industry is the major user of water in the catchment. The main estates are Triangle, Hippo Valley and Mkwasine, which obtain their irrigation water from Mutirikwi, Bangala, Manjirenji and Siya dams. There are also a number of small-scale irrigation schemes including Mushandike, Banga, Zananda, Mavhaire, Mabwematema, Musaverema, Mhende, Muchigwe and Musvuvugwa, which obtain their water from some of the dams in the catchment. The six major municipal areas that obtain raw water from Runde catchment are Gweru, Masvingo, Zvishavane, Shurugwi, Chiredzi and Gutu. The ZIMASCO mine in Shurugwi, the Shabani and the Mimosa mines, the Gaths mine and the Renco mine use water from Impali, Palawani, Muzhwi and Nyajena dams respectively. It is therefore apparent that rainfall and runoff has an impact on the socio-economy of the people living in the Runde catchment and Zimbabwe as a whole, hence the need to understand the temporal and spatial variability of both rainfall and runoff and how it determines the reliability of surface water resources. The objective of this study is to determine how rainfall and runoff varies both temporarily and spatially and the implications on surface water resources in the Runde catchment and also to determine whether any useful relationships exist between rainfall and runoff. Study Sites and Methods Runde catchment is located in Southwest Zimbabwe and stretches from Gweru to Gonarezhou (Figure 1). The Department of Water Development has divided Zimbabwe into 6 hydrological zones, A to F, and the Runde catchment falls within the Hydrological zone E, which comprises areas drained by Runde, Tokwe, Mutirikwi and Chiredzi rivers and finally draining into the Limpopo river. Rainfall data for Chibi Office, Masvingo, Chiredzi, Zvishavane, Gweru and Chendebvu stations was obtained from the Department of Meteorology. Rainfall recording started in different years, but for purposes of uniformity data used for this analysis starts in 1960. The rain gauge stations are fairly well distributed within the catchment (Figure 2). Data from 13 stream flow gauging stations were used (Figure 2) to determine both its spatial and temporal variability. The runoff gauging stations were installed in the 1960s and early 1970s and all of these stations have been in continuous operation since then. Dam water level changes for three dams (Mtirikwi, Gwenhoro and Bangala) were obtained from the Data and Research Unit of ZINWA.
Volume 1 No 1
71
Figure 2:Distribution of rainfall Results Table 1 shows that the annual rainfall average for Chendebvu, Chiredzi, Chivi, Gweru, Masvingo and Zvishavane are 590, 562, 544, 676, 582 and 576 mm with coefficient of variations of 43, 39, 37, 30, 44 and 38 % respectively. Table 1: Statistical parameters of annual rainfall for some of the rainfall stations in the Runde catchment. Station Period of
Gweru 1952 - 1999 676 203 30 1229 344 Masvingo 1953 – 1998 582 255 44 1037 102 Zvishavane 1952 - 1999 576 217 38 1042 176 Figure 3 illustrates the 5-year running means of annual rainfall totals for the six stations. Each of the six sites displays a broadly similar characteristic except the magnitude for most of the period. Masvingo differed a lot with the other stations during the period 1960 to 1965 in that it displayed very low rainfall. Gweru had the highest rainfall in most years while Chivi had the least. A cyclic trend is displayed; rainfall was above average in the 1960s and 1980s and below average in the 1970s and the 1990s.
Figure 3: 5-year running averages of annual rainfall totals at Chendebvu, Chiredzi, Chivi, Gweru, Masvingo and Zvishavane.
Volume 1 No 1
73
A long-term trend at Chibi Office from 1914 shows a similar cyclic nature (Figure 4) when (using a 10 year running average) rainfall was below average in the mid 1940s to mid 1950s and the 1990s and above average in the mid 1950s to 1980. Just like the Chivi rainfall station (Figure 4) the long-term rainfall data at all of the six stations displayed an insignificant decline over the study period. All the 13 runoff gauging stations display the same general runoff pattern (Figure 5) with the highest runoff being recorded in 1977 at all the sites. However, there is much spatial variation, even for gauging stations that are in the same subcatchment.
Figure 4: 10-year running average of annual rainfall totals at Chivi (1914-1998).
African Water Journal
74
Figure 5: Annual runoff for selected gauging stations in the Runde catchment. The Es are gauging stations.
Ann
ual r
unof
f (m
m)
0
200
400
600
800
E2E4E49
Ann
ual r
unof
f (m
m)
0
200
400
600
800
E74E112E117
Ann
ual r
unof
f (m
m)
0
200
400
600
800
E30E42E35
1960 1970 1980 1990 2000
Ann
ual r
unof
f (m
m)
0
200
400
600
800
E83E17
Mutirikwi subcatchment
Tokwe subcatchment
Upper Runde subcatchment
Lower Runde (E83) and Chiredzi subcatchments
Volume 1 No 1
75
The Tokwe subcatchment produced the most runoff in most of the years, while the least runoff was recorded at Chiredzi and Lower Runde subcatchment (Table 2).
Table 2: Statistical parameters of runoff at the different gauging stations Sub-catchment
Chiredzi E17 1700 57.6 104 220 6 E2, E4, E49, E54, E112 and E117 showed significant relationships between runoff and rainfall (Table 3), while E74, E133, E30, E42, E35, E83 and E17 were not significant.
Table 3: Linear equations of rainfall-runoff relation. Sub-catchment
Masvingo E54 R = 0.1491P – 32.77 0.435* Tokwe Chivi E74 R = 0.0585P + 63.90 0.008
African Water Journal
76
Chivi E112 R = 0.3395P – 89.80 0.361* Chivi E117 R = 0.3118P – 86.27 0.493* Chivi E133 R = 0.0678P + 17.06 0.057 Gweru E30 R = 0.0747P + 32.94 0.012 Gweru E42 R = 0.0108P + 59.30 0.0005
Upper Runde
Zvishavane E35 R = 0.0271P + 14.09 0.0201 Lower Runde Chivi E83 R = 0.0019R + 48.966 4x 10⁻⁵ Chiredzi Masvingo E17 R = 0.0426P + 31.211 0.0293 * Significant at the 0.05 level. All the four gauging stations from Mutirikwi subcatchment show significant relationship, while two are significant in the Tokwe sub catchments and non at all in the Upper Runde, Lower Runde and Chiredzi sub catchments. The coefficient of determination from the relationships between rainfall and runoff decreases with increase in catchment area (Figure 6).
Figure 6: The relationship between catchment area and the coefficient of determination
y = 145.72x-1.0193
R2 = 0.4098
0
0.2
0.4
0.6
0.8
1
1.2
0 5000 10000 15000 20000 250
Catchment area (km^2)
r^2
Volume 1 No 1
77
Changes in the Mutirikwi dam water storage reflect the temporal variability in runoff of the Mutirikwi catchment that is measured at E2 above the dam (Figure 7). The cyclic nature of rainfall and runoff is displayed in all the three dams (Mutirikwi, Gwenhoro and Manjirenji). The droughts of the early eighties and early nineties are clearly reflected in the dam water storage while the wet periods of the seventies and the Cyclone Eline of the late nineties are also reflected in the dams though they are in different sub catchments (Figure 7).
Figure 7: Monthly dam water levels and at (a) Mutirikwi, (b) Gwenhoro and (c) Manjirenji dams that are in Mutirikwi, Upper Runde and Chiredzi sub catchments. Discussion Though the general pattern of rainfall at the rainfall stations was similar over the whole period, the annual totals were different indicating both spatio-temporal variability in rainfall over the Runde catchment as was observed by Nicolson (1980) and Lebel et al. (1996). Makarau (1999) observed inter-annual and inter-monthly variabilities in the climate of Zimbabwe over the past century. A cyclic nature of the rainfall in the Runde catchment is observed just like the Zimbabwean rainfall that was observed by Makarau (1999), July et al. (1992) and Tyson, (1987). Runoff from
African Water Journal
78
all the gauging stations display a similar general pattern to rainfall which both show an increase that had a peak in 1977 and then declined. Gauging stations in Upper Runde and Tokwe sub catchments have less runoff than the other sub catchments because rainfall increases from Southwest to Southeast in the Runde catchment. The lack of similarity in the pattern of the runoff from the same subcatchment is an indication of high spatial variability in runoff. The 13 gauging stations show differences in runoff that might be emanating from differences in the average rainfall received, land use type or soil type. There were both significant and insignificant relationships between rainfall and runoff, with those from the drier Upper and Lower Runde and Chiredzi showing insignificant relationships. Thiam and Singh (2002) observed relationships between rainfall and runoff that had coefficient of determination that were above 0.5 in Southern Senegal. The low values of the coefficients of determination might be due to the large variability in rainfall, land use, soil and vegetation cover in the Runde catchment (Whitlow, 1979) like most areas in Zimbabwe (Anderson, 1993). Rainfall distribution is often more important in runoff generation mechanisms in semi-arid areas than rainfall totals (Sandstrom, 1977; Mugabe, 2004). Runoff normally occurs in a few months (February and March) of the year, when there are closely spaced rainfall events (Mugabe, 2004). The lack of good relationship between rainfall and runoff is due to a considerable temporal and spatial variability exhibited by rainfall-runoff process (Sivakumar et al., 2000). The considerable spatial and temporal variability exhibited by the rainfall-runoff process is due to the various physical mechanisms that govern the dynamics of the process (Sivakumar et al., 2000). One of the characteristics feature of the rainfall within the semi-arid areas of Zimbabwe is that it comes mostly in the form of convective thunderstorms that are highly isolated resulting in a high spatial variability. For example, Lebel, et al. (1996) observed a seasonal difference of 275 mm (39%) for two rain gauges just 9 km apart in the Sahel during the 1992 season. More representative catchment rainfall values could have been obtained if there was a network of rain gauges in each catchment, thereby enabling application of the Thiessen Polygon method. The change in land use might also affect the relationship between rainfall and land use. For example the Lundi E83 catchment stretches from Gweru to Ngundu and there are a number of soil types and land use types (communal use, natural vegetation and commercial use). Whitlow (1979) observed an increase of over 36%
Volume 1 No 1
79
of cultivated land area between 1963 and 1977 in Communal lands in Zimbabwe. Lorup, et al. (1998) observed a decrease in the annual runoff with time in catchments that were located in communal land, which they attributed to increases in population and agricultural intensity. The factors that affect runoff are more uniform for smaller catchments and we would have expected the coefficients of determination to increase with decrease in area. This resuls in smaller catchments having the highest coefficients of determination while bigger catchments have smaller coefficients determination. A similar trend was observed by Lacobellis et al. (2002), which they ascribed to the limited spatial extent of extreme events, which leads to a decrease of CV of areal rainfall intensity. The same trend as rainfall and runoff is reflected in the dam water storage changes of the three dams that are in three distinct sub catchments. This is in agreement with several studies that show that most of the variability in catchment hydrology is attributed to rainfall variability (Thiam and Singh, 2002; Farmer, et al. 2003; Rodda, 1967; Dawdy and Bergman, 1969) hence renewable water resources are directly related to rainfall. Peel et al. (2001) demonstrates that rainfall variance (Equation 1) is the same as runoff variance since the variability of actual evapotranspiration is small relative to the variability of annual precipitation and runoff.
][ AETMAPMAPCvpCvr
−= Equation 1
where: Cvr is coefficient of variation of annual runoff, Cvp is coefficient of variation of annual precipitation, MAP is mean annual precipitation and AET is actual annual evapotranspiration. The wet period between 1974-1980 and 1985-88 are reflected in both the runoff and dam water level while the dry periods of 1981-1984 and 1988-1992 are also shown in both parameters indicating that both rainfall and runoff have a bearing on surface water resources. Gwenhoro is not affected much during these dry periods because it is a smaller dam that has a relatively larger catchment area as shown by a dam capacity/catchment area ratio of 0.076 compared to 0.346 mm and 0.179 for Mutirikwi and Manjirenji respectively. The dry periods during the study period had a serious impact on the agricultural productivity of the sugar cane industry especially in the 1991/2 season when
African Water Journal
80
irrigation demands could not be met (Lecler, N; Scoones et al. 1996). This resulted in some sugar cane fields being neglected or planted to dryland crops and it took four years for the sugar industry to recover to full capacity. Acknowledgment This publication is an output from a project funded by the UK Department of International Development (DFID) for the benefit of developing countries. The views expressed are not necessarily those of DFID. The research was partially supported by an African Doctoral Fellowship provided by START and the Pan-African Committee for START.
Volume 1 No 1
81
References Anderson, I.P., Brinn, P.J., Moyo, M. and Nyamwanza, B. 1993. Physical
resource inventory of the Communal NRI Bulletin 60, Lands of Zimbabwe- an overview,. Chatham, UK: Natural
Resource Institute. Dawdy, D.R. and Bergman, J.M. 1969. Effect of rainfall variability on stream flow
simulation. Water Resources Research, 5: 958-966. Farmer, D., Sivapalan, M. and Jothityangkoon, C. 2003. Climate, soil and
vegetation controls upon variability of water balance in temperate and semi-arid landscape: Downward approach to water balance analysis. Water Resources Research, 39(2): 1029-1035.
Jury, M.R., Pathack, B. and Sohn, B.J. 1992. Special structure and interannual variability of summer convective over Southern Africa and Southwest Indian Ocean. South African Journal of Science..,: 275-280.
Lacobellis, V., Claps, P. and Fiorentino, M. 2002. Climatic control on the variability of the flood distribution. Hydrology and Earth Systems Sciences, 6(2): 1-9.
Lebel, T., Taupin, J.D. and D’Amato, N. 1996. Rainfall monitoring during HAPEX-Sahel: 1 General rainfall conditions and climatology. Journal of Hydrology, 188-189: 74-96
Lecler, N. Optimal water management strategies for sugarcane. www.sasa.org.za/sasex/about/agronomy/aapdfs/nlecler.pdf
Lorup J.K., Refsgaard, J.C. and Masvimavi, D. 1998. Assessing the effect of land use change on catchment runoff by combined use of statistical tests and hydrological modelling: Case study from Zimbabwe. J. Hydro. 205: 147 – 163.
Makarau, A. 1996. Zimbabwe’s climate: past, present and future. ZIMWESI workshop on Water for Agriculture: Current practices and future prospects, 11-13th March 1996, Harare.
Mugabe, F.T. 2004. Temporal and spatial variability of the hydrology semi-arid Zimbabwe and implications on surface water resources. Unpublished Dpil. thesis, Department of Soil Science and Agricultural Engineering, University of Zimbabwe.
Rodda, J.C. 1967. The systematic errors in rainfall measurement. Journal of Institute of Water Engineers, London, 21: 173-177.
Peel, C.M., McMahon, T.A., Finlayson, B.L. and Watson, F.G.R. 2001. Implications of the relationship between catchment type and the variability in annual runoff. Hydrological Processes, 16: 2995-3002.
African Water Journal
82
Sandstrom, K. 1997. Ephemeral rivers in the tropics. Hydrological processes and water resources management: A review and pathfinder. Research Programme on environmental policy and society. Institute of Tema, Linkopint University. Research report No. 8 from EPOS.
Scoones, I., Chibudu, C., Chikura, S., Jeranyama, P., Machaka, D., Machanya, W., Mavedzenge, B., Mombeshora, B., Mudhara, M., Murimbarimba, F. and Zirereza, B. 1996. Hazards and Opportunities, Farming livelihoods in dryland Africa: Lessons from Zimbabwe.
Sivakumar, B., Berndtsson, R., Olsson, J., Jinno, K. and Kawamura, A. 2000. Dynamics of monthly rainfall runoff process at the Gota basin: A search for chaos. Hydrology and Earth Systems Sciences, 4(3): 407-417.
Thiam, E.I. and Singh, V.P. 2002. Space-time-frequency analysis of rainfall, runoff and temperature in the Casamance river basin, southern Senegal, West Africa. Water SA, 28(3): 259-270.
Tyson, P.D. 1987. Climatic change and variability in Southern Africa. Oxford University Press, Cape Town, 220pp.
Whitlow, J.R. 1979. An assessment of cultivated lands in Zimbabwe Rhodesia, 1963-1977. The Zimbabwe Science News, 13(12): 286-290.
Zhang, L., Dawes, W.R. and Walker, G.R. 2001. Response of mean annual evapotranspiration to vegetation changes at catchment scale. Water Resources Research, 37:701-708.
ZINWA. 1999. Towards Integrated Water Resources Management
Volume 1 No 1
83
Some Improper Water Resources Utilization Practises and Environmental Problems in the Ethiopian Rift
Tenalem Ayenew
Abstract The Ethiopian rift is characterized by a chain of lakes varying in size, hydrological and hydrogeological setting. Some of the lakes and feeder rivers are used for irrigation, soda abstraction, commercial fish farming, recreation and support a wide variety of endemic birds and wild animals. A few lakes shrunk due to excessive abstraction of water; others expanded due to increase in surface runoff and groundwater flux from percolated irrigation water. Excessive land degradation, deforestation and over-irrigation changed the hydrometeorological setting of the region. The chemistry of some of the lakes has also been changed dramatically. This paper addresses the major environmental problems in the last few decades in the Main Ethiopian Rift (MER). The methods employed include field hydrogeological mapping supported by aerial photograph and satellite imagery interpretations, hydrometeorlogical data analysis, catchment hydrological modeling and hydrochemical analysis. A converging evidence approach was adapted to reconstruct the temporal and spatial variations of lake levels and the hydrochemistry. The result revealed that the major changes in the rift valley are related mainly to recent improper utilization of water and land resources in the lakes catchment and direct lake water abstraction aggravated intermittently by climatic changes. These changes appear to have grave environmental consequences on the fragile rift ecosystem, which demands the urgent need for integrated basin-wide sustainable water management.
Key Words: Environmental problems, Ethiopian rift, lake levels, irrigation, water resources 1. Introduction Reconstruction of climate and environmental changes over the last few decades is essential for understanding the impact of natural processes and anthropogenic factors on the hydrological setting and ecosystems and to forecast their evolution in the near
African Water Journal
84
future. This is especially relevant in the semi-arid regions of the African tropics, including the Ethiopian Rift, characterized by large interannual changes in precipitation (Vallet-Coulomb et al., 2001) and where increasing population pressure makes areas more sensitive to the fluctuations of water resources and land degradation. Analysis of observed records available for recent decades has considerably assisted in the understanding of the response of inland water bodies to climate changes and human-induced factors in many East African rift lakes (Makin et al., 1976; Chernet, 1982, Ayenew, 2002c). These studies related the major environmental problems to antheropogenic influences. The most important large-scale withdrawals of water in the rift is related to irrigation and soda (NaCO3) production. These activities have reduced the level of some of the lakes and hydrochemical setting (Gebremariam, 1989; Kebede et al., 1996; Ayenew, 2002c). The lakes, which have undergone significant changes are those located in a terminal position. In the last few decades, over-irrigation has induced salinization of irrigation fields and lake level changes (Hailu et al., 1996). Application of agrochemicals and fertilizers has also slightly changed water and soil chemistry (Dechassa, 1999). Apart from the various inflow and outflow components of the water balances of the lakes and antheropogenic factors, volcano-tectonism and sedimentation played important roles in affecting lake levels in the past (Street, 1979). At present there is no volcanic activity except for the existence of geothermal activities, which have little or no role in changing the level of the rift lakes. However, the existence of frequent earthquakes and formation of new fractures might have influenced the present day hydrogeologic regime of some of the lakes (Ayenew, 1998; Tessema, 1998. Most of the lakes in the rift fluctuate according to the precipitation trends in the adjacent highlands (Street, 1979). For the last four decades there has been no substantial declining trend of rainfall in the region (Ayenew, 2002a). The lake level changes addressed in this study are related to anthropogenic factors. It is believed that the present improper utilisation of water will certainly lead to large-scale negative consequences on the fragile rift environment in the foreseeable future. Therefore, it requires immediate action. The main objective of this paper is to present the major environmental problems based on tangible scientific evidence so as to give signals for decision makers and relevant professionals for future sound and sustainable mitigation measures. The problems are treated under three categories: lake level changes (rise and decline), hydrochemical changes, and salinization of irrigation fields.
Volume 1 No 1
85
2. Description of the Region The Ethiopian Rift system extends from the Kenyan border up to the Red Sea and is divided into four sub-systems: Lake Rudolf, Chew Bahir, the Main Ethiopian Rift (MER) and the Afar (Figure 1). The seismically active MER transects the uplifted Ethiopian plateau for a distance of 1000 km, extending from the Afar Depression southwards across the broad zone of basins and volcanic ranges to the watershed of lake Chamo. This study focuses on the MER.
Addis Ababa
1
2
3
456 7
8
9
10
11
rift and adjacent escarpmentslakesFocus of this studymain rivers
The climate is sub-humid in the central part of the MER, semi-arid close to the Kenyan border and arid in the Afar region. One of the hottest places on Earth the “Dalol Depression” with average annual temperature of around 50 0C is found in the Afar Region. The annual rainfall within the limits of the rift varies from around 100 mm in much of the Afar Region up to around 900 mm close to lake Abaya. The rainfall is much higher in the adjacent highlands; some times as high as 1500 mm. The elevation within the rift varies in a wide range from close to 2000 m.a.s.l at lake Abaya and around 120 m below sea level in the Dalol Depression. There are many highly elevated volcanic hills and mountains both within the rift floor and the highlands. The hills, ridges and volcano-tectonic depressions separate the rift lakes. Many of the lakes are located within a closed basin fed by perennial rivers. The major rivers in the region are Awash, Meki-Katar, Dijo and Bilate feeding lakes Abhe, Ziway, Shala and Abaya respectively. Lakes Abaya and Chamo are seasonally connected by overflow channel, Ziway and Abiyata by the Bulbula river, Langano and Abiyata by the Horakelo River. Awassa, Abiyata, Shala, Bskea and Afrera are terminal lakes. The alkalinity of the lakes increases generally as one goes towards the north. In fact terminal lakes with out surface water outlet such as Abiyata and Shala and the lakes in the arid Afar region have very high alkalinity and some of them are used for abstraction of salts. The largest commercial farms in the country are present downstream of the Koka dam irrigated by the regulated flow of the Awash river which drains through the rift starting from the central highlands through the northern part of the MER and finally ending in lake Abhe at the border with Djibouti. Out of the Awash basin, Meki and Katar rivers and lake Ziway are also used for irrigation. The geological and geomorphological features of the region are the result of Cenozoic volcano-tectonic and sedimentation processes. Except some patchy Precambrian outcrops to the south and northern edge the rift is covered with Cenozoic volcanics and sediments. The rift formation is associated with extensive volcanism. Several shield volcanoes were developed in large parts of adjacent plateaux. The volcanic products in many places were fissural basaltic lava flows, stacked one over the other, alternating with volcano-clastic deposits derived from tuff, ignimbrite and volcanic ash. The basalt extrusions were interspersed with large accumulations of rhyolite and trachyte, breccias, ignimbrite and related shallow intrusions. (Kazmin, 1979). Most of the rift valley flat plains around lakes are covered with thick lacustrine deposits and volcanoclastic Quaternary sediments.
Volume 1 No 1
87
The rift is bounded to the east and west by high altitude plateau characterized by high rainfall. The floor of the rift is occupied by a series of lakes fed by large perennial rivers originating from the highlands. The MER has seven major lakes and one large dam (Koka) used for various purposes: water supply, irrigation, commercial fish farming, recreation, soda abstraction, etc. These lakes are highly variable in size, hydrogeological and geomorphological setting (Table 1). Table 1. Basic morphometeric data of the lakes (Source: Wood and Talling,1988; Halcrow,1989; Ayenew,1998) Lake
Altitude (m.)
Surface Area (Km2)
Max. Depth (m)
Mean Depth (m)
Volume (Km3)
Salinity (g/1)
Conductivity (µS/cm)
Chamo 1233 551 13 - - 1.099 1320 Abaya 1285 1162 13.1 7.1 8.2 0.77 925 Awasa 1680 129 21.6 10.7 1.34 1.063 830 Shala 1550 329 266 87 36.7 21.5 21940 Abiyata 1580 176 14.2 7.6 1.1 16.2 28130 Langano 1585 241 47.9 17 5.3 1.88 1770 Ziway 1636 442 8.95 2.5 1.6 0.349 410 Beseka 1200 3.2 - - - 5.3 7155 Block faulting has disrupted the volcanic rocks and formed a horst and graben structure. The rift valley is distinctly separated from the plateaux by a series of normal step-faults usually trending parallel to the NNE-SSW rift axis. The floor of the rift is marked by a persistent belt of intense and fresh faulting particularly in what is known as the "Wonji Fault Belt", which extends from south of Lake Chamo to the Lake Abhe area of central Afar. Numerous geotehrmal manifestations and caldera volcanos characterize this active region. 3. Methodology The hydrology and hydrogeology of the Rift Valley lakes and feeder rivers, particularly in the MER (Ayenew, 1998) and the salinization problems of the irrigation fields of the Awash valley (Hailu et al., 1996) was studied in detail. River basin master plan studies outlined some of these problems (UNDP, 1973; Wenner,
African Water Journal
88
1973; Halcrow, 1989). The expansion of some of the lakes was also addressed in part (Tessema, 1998; Geremew, 2000). The relation of lake levels and climatic factors of some of these lakes were studied including the water balances (Nidaw, 1990; Tessema, 1998; Ayenew, 2002a). In this case more vigorous assessment was made based on time series of recent hydrological records, development of systematic relevant database from previous investigations, detection of the spatial variation of lake levels from satellite images and aerial photographs, hydrochemical and isotope analysis of water samples. The lake level records (since the late 1960s) were used to reconstruct the recent lake level changes. Information on abstraction of water for irrigation and soda ash production was gathered from relevant institutions. To reconstruct the positions of the different shore lines multi-temporal satellite images: Multispectral Scanner, MSS (1979), Thematic Mapper, TM (1987, 1989) and SPOT (1993), as well as panchromatic aerial photographs at the scale of 1:50,000 (1965, 1967) were used. Scattered data on lake levels were also available since the late 1930s (Benvenuti et al., 1995). Hydrocehmical analysis is used as an independent check of the recent changes in hydrological setting. 4. Results and Discussion
Lake Level Changes
Figure 2 shows the temporal variation of the levels of some of the lakes established based on monthly average stage records. The trend of lake levels in the Ethiopian rift is not uniform, some are expanding and some are shrinking. The most drastic changes have been observed in lakes Abiyata and Beseka, the former is shrinking and the later expanding; slight decline is evident in lake Ziway and rise in lakes Langano and Awassa.
Volume 1 No 1
89
Figure 2. Lake level fluctuations in the Main Ethiopian Rift
African Water Journal
90
Abiyata is a relatively shallow small alkaline closed terminal lake fed by rivers Horakelo and Bulbula originating from the near-by lakes Langano and Ziway respectively. The relatively shallow depth and its terminal position, make it more susceptible to changes in climate and input from precipitation and river discharge. The main inflow is from direct precipitation and discharge from the two rivers. As a closed lake, the only significant water loss is through evaporation. Groundwater flow model simulations indicate negligible groundwater outflow from the lake (Ayenew, 2001). Generally changes in lake level and volume reflect and amplify the changes in inputs from rainfall and rivers. However, recent development schemes, such as pumping of water from the lake for soda extraction, and the utilization of water from feeder rivers and lake Ziway for irrigation has resulted in rapid reduction in lake levels. The economic feasibility of soda extraction from lakes Abiyata and Shala was investigated in 1984. Subsequently, a large production process began in 1985 via a trial industrial plant. The present extraction is considered to be the first phase of a larger development scheme. At present, annual artificial water evaporation for soda ash extraction from Abiyata is estimated at 13 million cubic meter (mcm) (Ayenew, 2002a). This is equivalent to a depth of 0.07 m, based on the present average lake area of 180 km2. Large-scale irrigation was started in the 1970s in the Lake Ziway catchment, taking water directly from the lake and its two main feeder rivers (Maki and Katar). A three-phase irrigation development project was proposed covering a total area of 5500 hectar (ha). Since 1970, major irrigation activities were introduced around Lake Ziway and its catchments. The present annual abstraction for irrigation is estimated at only 28 mcm. If all the proposed irrigated areas are developed, the estimated annual water requirement will be 150 mcm (Makin et al., 1976). This would result in a 3 m reduction in the level of Lake Ziway and ultimately lead to a drastic reduction in the level of Lake Abiyata and drying up of the feeder Bulbula River. The reduction of the level of Abiyata is clearly visible from old shorelines from sattelite images (Figure 3).
Volume 1 No 1
91
Note: The outer maximum shore line is the 1940’s shore line (1582) and then in decreasing order 1971, 1983, 1984, 1976, 1985, 1996, 1997, 1995 and 1967. The inner thick shoreline is the current average lake level.
Figure 3. Shift of shoreline positions (A= regression of lake Abiyata; B= Transgression of Lake Abiyata)
African Water Journal
92
The maximum reduction in the level of lake Abiyata coincides with the time of large-scale water abstraction for soda production and water abstraction for irrigation from lake Ziway after the 1980s. In wet years, for 50 % of the time between November and June, Ziway shows a net loss of storage due to the outflow of water to lake Abiyata. During August and September a net gain to storage occurs because of large inflows from the Katar and Meki rivers. The gain is transferred to Abiyata and at times reaches as much as 17 % of the total volume of the lake (Halcrow, 1989). Many of the lakes fluctuate in accordance with the climatic conditions of the region, with the exception of few lakes located influenced by irrigation. The recent lake level fluctuations also reflect changes in the precipitation conditions over the adjacent highlands. Except for the interannual and seasonal variations of rainfall, there has been no declining trend of precipitation in the region for the last forty years. This has kept the level of many lakes with little or no change. However, after the commencement of large-scale abstraction of water in the late 1980s in the Abiyata catchment, substantial regression of the lake has occurred. There was a considerable reduction in the volume of Abiyata in 1985 and 1990, amounting to about 425 mcm, or 51% of its present volume. According to site managers at the Abiyata Soda Ash Factory, inflow from Lake Ziway has diminished from the long-term annual average value of 210 to 60 mcm in 1994 and 1995 due to both abstraction and the low rainfall of these two years. The fluctuation of Lake Abiyata follows the same trend as Lake Ziway, with an average time lag of about 20 days (Ayenew, 2008). Any abstraction of water in the Ziway catchment results in a greater reduction in the level of Lake Abiyata than in that of Lake Ziway. Over the past three decades, the depth reached a maximum of 13 m in 1970–1972 and 7 m in 1989. These extreme drops in levels correspond to water volumes of 1575 and 541 mcm, and lake surface areas of 213 and 132 km2 respectively. Before 1968, lake level variations, reconstructed from different sources (Street, 1979; Benvenuti et al., 1995; Ayenew, 1998), showed inter-annual fluctuations of the same order of magnitude, with, for example, a high level in 1940 and 1972, a low level in 1965 (inferred from aerial photographs) comparable to that of 1989, and a level even further reduced in 1967 (aerial photographs) and 1994 (field checks).
Volume 1 No 1
93
Table 2. Temporal changes of the size of Lake Beseka (modified from MWR, 1999) Period of recording
Elevation (m.a.s.l)
Area (km2)
Width (km)
Length (km)
Depth (m)
1957/1964 940.82 3 1.09 8 0.58 January 1972 942.77 11 1.86 21.5 1.38 April 1978 946.96 29.5 2.84 36.4 3.45 December 13,1998 950.701 39.97 3.5 44.4 5.8
The range of lake level fluctuations in Ziway is lower than for Langano and Abiyata, since wide and shallow lakes with an outlet do not usually show a large range of seasonal lake level changes. Referring to Figure 2, the lowest level of Ziway was recorded in June 1975 (0.13 m) and the maximum in September and October 1983 (2.17 m). However, for the last three years of the late 1970s and early 1980s the level was slightly lower due to the dry years of the 1970s. The lake shows a slight reduction after the late 1980s due to the abstraction of water for irrigation. The level of lake Langano is more stable compared to the other two lakes, which accords with the groundwater balance calculations using hydrological models (Aysenew, 2001). There is no irrigation activity in the Langano catchment. The stability of the lake is related to a large groundwater flow from springs and seepage through large faults. According to the local people the discharge of the large feeder springs have increased recently, which could be related to the formation and/or re-activation of regional faults by recent earthquakes. Whether neotectonism will affect the level in the near future remains a matter of conjecture.
In contrast to many East African terminal lakes Beseka has recently been growing as a result of increase in the net groundwater flux into the lake. This lake is located north of the MER some 190km east of Addis Ababa. Air photos taken at different times have shown that the area covered by the lake was about 3 km2 in the late 1950s; currently the total area is a little above 40 km2. These changes are well established as shown in Figure 3. The level of the lake has risen by 4m over two decades (1976-1997). The starting time of expansion is not exactly known, however, most previous studies tend to agree that the problem has initiated in 1964 when the Methara mechanized farm around the lake was started to be irrigated for cultivation of cotton and citric fruits which latter on shifted to sugarcane development. The main changes in the water balance of Lake Beseak comes from groundwater inputs, which is related to the recent increment of recharge from the irrigation fields
African Water Journal
94
and due to the rise of the Awash river level after the construction of the Koka dam located some 152 km upstream. Some authors relate the expansion of the lake to neotectonism (Ayenew, 1998; Tessema, 1998). Prior to the construction of the Koka dam Awash river could some times go dry between December and March. However, after the construction of the dam there has been fairly steady flow throughout the year. Hence, the regulated flow has become a source of continuous recharge to groundwater ultimately feeding the lake.
Recent estimation of the water balance shows that groundwater contributes 50 %(53.8 mcm/yr) input to the lake. 64% of the groundwater input to the lake comes from outside the catchment area i.e the Awash river transmission loss and irrigation loss accounting 23.5 and 10.5 mcm/yr respectively (Tessema, 1998). Irrigation excess water discharged into the lake was estimated to be in the order of 20 mcm (Halcrow, 1989). The reason for this has been poor irrigation efficiency. In 1977 the irrigation efficiency was 30 %. In 1990 it was reported to have improved to 70 %. The transmission loss from the Awash river and direct recharge are facilitated by the presence of modern active tensional faults. Hence the favourable geological factors combined with the availability of water have enhanced the modern recharge. Isotopic and geological evidences have shown the occurrence of modern and sub-modern cold water and thermal water. As evidenced from isotope and hydrochemical data and reconstruction of the piezometeric levels groundwater flows into the lake from the western side. The lake level has risen by 4 m during 1976-1977 as evidenced from lake daily stage records. The hydrograph of lake Beseka (starting in 1964) shows that the early part is gentler followed by steeper rise in recent years. The average lake level rise is 15 cm/yr. Table 2 shows the expansion of the lake in different years. By the end of 1997 the elevation of the lake was 952.4 meters above sea level (m.a.s.l). Inspection of 1:50,000 topographic map show the lowest point along its water divide is 954 m a.s.l to the northeastern side. The lake level is therefore 1.6m below the lowest point; if the inputs to the lake continue with the same rate, it will overpass the divide by the year 2008. If inputs increase more the overflow could occur shortly. Recently the government has proposed pumping out and releasing the lake water into the Awash river, although the ecological effect downstream is unknown.
Volume 1 No 1
95
Hydrochemical Changes The reduction of the level of Lake Abiyata is also reflected in the changes of ionic and salt concentrations (Tables 3-4). Table 3. Temporal changes of the chemistry of lake Abiyata (ions expressed mg/l) Source Tame of
Table 4. Salt concentrations in lake Abiyata in mg/l (Halcrow, 1989) Lake
NaCl
Na2Co3
NaHCo3
Na2So4
NaF
Abiyata, 1984
0.25
0.44
0.38
0.02
0.02
Abiyata ,1991
0.70
1.24
0.74
0.05
0.05
African Water Journal
96
Water input–output relationships are the dominant feature of the status in the salinity series of the rift lakes (Wood & Talling, 1988). If accompanied by a maintained lake level or volume and negligible seepage-out, evaporation loss can balance inflow plus direct precipitation; thus, with time, the lake becomes more saline. The extent of ionic enrichment depends on the lapse of time since the system became closed and on the changing rate of abstraction and evaporation over time. Compilation of the sparse chemical data available since 1926 (Kebede et al., 1996) and chemical analysis since 1995 (Ayenew, 1998) has revealed a considerable increase in the total dissolved solids. Between 1926 and 1998, the salinity fluctuated more than 2.6 times (from 8.1 to 26 mg/l), the alkalinity changed from 80 to 326 mg/l, and pH varied between 9.5 and 10.1. The conservative anion chloride showed a two-fold increase over 42 years (Omer-Cooper, 1930). The dominant cation, sodium, increased more than three-fold. Between 1984 and 1991 the sodium chloride levels of the lake water increased from 0.25 to 0.7 mg/l, sodium carbonate increased from 0.44 to 1.24 mg/l and sodium fluoride from 0.02 to 0.05 mg/l (Halcrow, 1989; Ayenew, 2002b). The salt concentration in the lake has also increased drastically. Lake Beseka presents a completely different hydrochemical picture; from an extremely alkaline water body it has changed to a nearly fresh lake over the last 40 years. The electrical conductivity has gone down from 74170 µS/cm to 7440 µS/cm between 1961 and 1991 corresponding to a change in size from 3 to 35 km2. Table 5 shows the temporal variation of the chemistry of lake Beseka. Improper ploughing, application of fertilizers and over-irrigation also affected soil chemistry, water and rock interaction and resulted in groundwater pollution, salinization and water logging of soils. One of the most obvious influences of application of fertilizers and over irrigation is the drastic increase of nitrate in irrigated fields. Besides, the natural high concentration of fluoride in the rift caused severe groundwater management problem (Lloyd, 1994); the concentration reaches as high as 250 mg/l in the MER (Ayenew, 1998). The study carried out in the irrigation fields of the Wonji sugarcane plantation (7000 ha), right downstream of the Koka dam shows high nitrate concentration due to excessive application of fertilizers, high population density (septic tanks) and animal breeding (Dechassa, 1999). The Wonji plain is active agro-industry area with high population density and urbanization. Around 50,000 people live within the plantation. In some wells the nitrate content reaches as high as 30 mg/l (Halcrow, 1989). The sugarcane plantation uses 200-600 kg/ha urea fertilizers accounting a total of over two million kilogram annually. Different types of herbicides and
Volume 1 No 1
97
insecticides are also used. Pesticides are likely to affect not only the chemistry of water, but also the soil chemistry. The effect of herbicides and insecticides is not well established in the rift agro-industry zones. Adsorption as well as residence time and mobility of fertilizers in soils determines the degree to which the quality of groundwater is affected. But, no variation of nitrate concentration was observed in the groundwater with respect to applied fertilizer quantity. The pollution of inorganic fertilizer in groundwater may be mainly controlled by residence time, plant uptake, etc. Even though, there are no clear euthrophication; algae blooms were observed in some small reservoirs and abandoned ponds. These developments of algae are due to nutrient supplied from sugar estate farm and the surrounding areas. Eutropication is also observed in some of the lakes due to high nutrient fluxes from fertilizers in their catchment. The typical example is Abiyata and moderate manifestations in lake Ziway. Soil Salinization Salinization is one of the most critical problems in the Awash valley irrigation fields. The most affected field is the Melka Sedi-Amibara irrigation project in the Middle Awash basin bordering the right bank of the Awash river located in the arid southern Afar region at an elevation of around 750 m.a.s.l (Figure 4). The high temperature of the region (average annual 26.7 0C) and low annual rainfall (500 mm) and the high evaporation aggravated the salinization process. The Methara sugar plantation has also suffered from salt water encroaching from lake Beseka and salinization as a result of irrigation water logging effect. Until 1997 nearly 30 ha of farmland has been abandoned by salinization and 150 ha of land has become unsuitable for ploughing by tractor in the plantation.
African Water Journal
98
850
750Aw
ash
Riv
er
To M
ile
main
cana
l
Aw
ash
Riv
er
Kesem
Rive
r
Kebana River
mai
n hi
ghwa
y
750
main irrigated areas
Expansion areas(with loical salinization)
topographic contours
9030
'
400 15'
800
Figure 4. Amibara irrigation project areas and plots showing groundwater level rise due to over-irrigation
Volume 1 No 1
99
The potential for large-scale irrigation development in Amibara area was first considered in 1964 and a feasibility study was completed in 1969. In 1973-74 there were as many as 20 farms with a minimum size of 4 ha later nationalized in the mid 1970’s and incorporated with the Amibara Irrigation Project in 1983. The current project includes the adjacent Melka Sadi farm irrigating 10300 ha. The main crops produced are cotton and banana with limited areas of pasture, cereals and vegetable. The gravity irrigation system was designed on the basis of a 24 hours operation, and comprises a network of secondary, tertiary and field canals, which distribute diverted Awash River water. The two main irrigation methods are basin and furrow irrigation methods for banana and cotton fields respectively; both require accurate land grading. The crop water requirement for banana is 1842.9 mm/yr. The net requirement is around 2000-2400 mm/yr. The available water which include the net irrigation plus the effective precipitation in the region ranges from 2200 to 2600 mm/yr. Based on 75% irrigation efficiency and 8% leaching requirement, the gross irrigation requirement is about 3170 mm/yr. Cotton is cultivated during the major cropping season from May to October. The seasonal available water ranges from 1000 and 1050 mm (equal to the net irrigation plus effective rainfall, assuming that the contribution by the groundwater and stored soil moisture is negligible). The gross irrigation requirement for cotton is 1230 mm. Although the crop-water requirement is well established for both crops, the amount of water used for irrigation is not well understood. There is in fact some irrigation water flow control in canals. However, there is no real information as to how much water is being released and proper irrigation scheduling. It is believed that the amount of water released is by far greater than the crop-water requirement. This is clear from the extensive salinization after the implementation of irrigation in the region. The high soil salinity levels are related to groundwater level rise due to over irrigation; which led to capillary rise. The inset in figure 4 shows the average groundwater level between 1981 and 1988. It is illustrated that with time groundwater progressively rises and quensequently salinization became critical. The rise is more pronounced in the banana fields, which use basin irrigation. Unfortunately, no routine monitoring of soil salinity levels has been undertaken so that there is no definite proof of correlation between soil salinity, groundwater level
African Water Journal
100
and subsequent capillary rise in areas where the water table is less than 1 m below the surface and the extent of water loss by capillary action is uncertain. However, monitoring of piezometers show rapid rise of groundwater during peak irrigation period. In the shallow piezometric system over-irrigation brings about capillary rise and contributes significantly to the salinization process. The Amibara irrigation project has 71 piezometers located randomly where the groundwater has been measured monthly since 1984. The long-term average depth to groundwater varies between 1 and 15 m. Groundwater modelling was made using Aquifer Simulation Model to study and delineate the most affected areas by groundwater level rise (Hailu et al., 1996). The result indicates the presence of wide cone of depressions and domes showing local groundwater abstraction and also rises of water levels. There is still substantial area with high-rise in groundwater level, which leads to capillary rise and subsequent salinization. Many of the places showing higher water tables are those, which are being highly irrigated, and with no proper drainage system. In fact the irrigation water is also slightly saline. The electrical conductivity of the water used for irrigation varies seasonally based on the flow regime of the Awash river. According to the USDA classification of irrigation water salinity the Awash river water in the Afar may be classified as medium salinity which can only be used on a long-term basis if a moderate amount of leaching occurs. According to Hailu et al. (1996) from June to December 1987 there was a little change in EC of the irrigation water, which varied between 0.34-0.4 mS/cm. At the beginning of 1988 a gradual increase occurred and continued to a peak monthly mean of 0.88 mS/cm in June as an overall peak of 1.04 mS/cm in the first week of July the same year. The highest salinity occurs (0.75 mS/cm on average) during the peak irrigation period. Environmental Problems Undoubtedly, improper utilization of water resources brought noticeable problems in the region. These problems will have far-reaching devastating environmental consequences in the foreseeable future unless proper mitigation measures are taken. The most important environmental implications are briefly outlined. Lake Abiyata is a shallow highly productive alkaline lake whose muddy shore supports a wealth of bird life almost unequalled perhaps in the whole of Africa; as such it is of great biological importance. The Ethiopian rift lakes also form an important migration route for palaearctic birds during the northern winter. Abiyata is part of the Rift Valley Lakes National Park, which is expected to play an increasing
Volume 1 No 1
101
role in the promotion of tourism. The high density of flamingo is able to subsist directly on the blue-green algae in the surface waters while many other birds are dependent on fish. Abiyata also forms a vital feeding ground for Cape Wigeon, Abdim's Stork and Great White Pelicans, which breed on lake Shala in large numbers. Due to very high alkalinity, lake Shala lacks the fish necessary to support such concentrations of fish eating birds. Therefore, they depend on the fish population in Abiyata. The higher temporal changes of the alkalinity of the lake will result in reduction of population ultimately leading to the death of fish-eating birds. The alarming lake level reduction is a burning question of saving the precious fauna and flora. Reduction in the volume of lake Ziway could be expected to increase the ionic concentration of the water as in the case of Abiyata, which will have grave consequences on the fragile aquatic ecosystem. With broad shallow margins fringed with swamp, dense floating vegetation and a high concentration of phytoplankton, lake Ziway supports the heaviest fish stock in the region and is the principal source of commercial fishing in Ethiopia. Therefore, the main economic consideration of altering the volume of Ziway for irrigation is the impact on its considerable potential as a freshwater fishery. The other more subtle effect of lake level reduction is on the vegetation around the lake edge, which plays an important role in providing food and shelter for numerous animals. Some species are apparently sensitive to short-term fluctuations and disruptions to their environment, including the marginal vegetation. The existence of a wide variety of bird life around the lake Ziway makes it more scenic. Irrigation around the lake and deforestation have already been profoundly affected the larger mammalian population (Makin et al., 1976). Many of the large mammals in the rift valley are on the verge of extermination. The only large wild mammals remaining are hyena, jackal and vervet monkeys. The highly productive rim of grassland close to the shore of lakes is the principal source of dry season grazing at high stocking densities. Lowering of lake level may result in an increase of the transpiration loss from the marginal vegetation and lowering of groundwater level and the grassland will be endangered. The lowering of groundwater level will also result in the drying up of springs used for community water supply purposes in the eastern shore of Ziway. The alarming rise of the level of Beseka has multiple effects. The highway and railroad, Ethiopia’s sole access to the harbor, pass just near the northern shore of lake Beseka. The lake water threatens this access more and more each rainy season. The problem has been overcome temporarily by constructing embankment to elevate the
African Water Journal
102
access. Still the rise of the lake level may drive to change the route corridor. If lake Beseka breaks the natural water-divide it will invade the small town of Addis Ketema with 3000 inhabitants, before it joins the Awash river. The mixing of the lake with Awash river will also certainly affect the hydrochemistry of the river and the aquatic ecosystem downstream. The rise in the salinity of the river water will also have negative implications on the downstream irrigation fields of Amibar, Melka-Sedi and many other large farms in the Afar expanding every year. Improper irrigation practises may also result in an invasion by both plant and disease causing organisms. These have proved more difficult to remedy than many problems related to irrigation. For example, a sombre aspect of the valuable contribution of irrigation activities in many places is the increase in the incidence of bilharziasis in the human population. Uncontrolled irrigation close to lake Ziway may favour the introduction of Schistosoma mansoni (bilharzia). This problem was reported, although due consideration was not given (Makin et al., 1976). The highlands where major feeder rivers come to the MER are highly cultivated and are source of lake sediment and fertilizers. The use of fertilizers is growing from time to time. Although scientific data were not existent; the common sense understanding is that rapid utilization of fertilizers increases the rate of supply of nutrients in to the lakes. If the proposed large-scale irrigation projects in the Maki and Katar valley are going to be fully implemented this problem will remain eminent. The notable effect of high nutrient in lakes is eutrophication. Eutrophication can be seen as the input of organic and inorganic nutrients into a body of water, which simulates the growth of algae or rooted aquatic plants which causes in the interference with desirable water uses of aesthetics, recreation, fishing and water supply. One of the principal stimulants for the growth of aquatic plants is excess level of nutrients such as nitrogen and phosphorous. These nutrients come principally from agricultural activities as well as from municipal and industrial sources. The incrustation of significant quantities of elements derived from fertilizers could markedly influence the population of phytoplankton and have major long-term effects including: (1) changes in the odour and colour of water; (2) phytoplankton and weeds settle to the bottom of the water and create a sediment oxygen demand (SOD) which lead to low dissolved oxygen (DO) in lake waters; and (3) extensive growth of rooted aquatic macrophytes (larger plant forms) interfere with navigation and aeration problems. Aside from its effect on lake levels, diversion of rivers for irrigation initiate downstream water demand conflicts. The notable example is the critical water
Volume 1 No 1
103
shortage along the spill regime between Ziway and Abyata through the Bulbula river. The importance of maintaining year round flow of the river, apart from the effect on the level of Abiyata, relates to the need for domestic water supply and livestock. Bulbula river represents the only source of fresh water for a large number of rural and urban community in its 30 km stretch in the semi-arid rift floor where good potable water is extremely scarce. Similar problems exist in the Dijo river catchment due to the damming of the river some 20 km west upstream of the confluence with Lake Shala. The obvious problem of salinization in irrigation fields is expected to lead to abandonment of more usable land, unless proper mitigation measures are taken. 5. Conclusions and Recommendations Improper utilization of water resources in the rift resulted in substantial changes in the hydrological and hydrogeological setting of the rift lakes. The major problem is in terminal lakes without surface water outlets, the notable example is Lake Abiyata and Lake Beseka with extreme reduction and expansion of lake levels respectively. Many of the levels of the rift lake fluctuate according to the precipitation trends in the adjacent highlands. However, the drastic changes have come in the last few decades after large-scale water use for irrigation and soda abstraction. Lake Abiyata reduced in size substantially after the implementation of the soda extraction and upstream irrigation in the Ziway catchment. It has reduced by about 10% in size in the last forty years. The future abstraction of water from Abiyata and Shala must be seen carefully. If any decision is made to implement the large water abstraction from Abiyata, the environmental impact must be assessed along with the Ziway and Langano catchments. In this regard the far-reaching devastating effect of the fish and bird life of the two lakes and possible water supply problem of the Bulbula river requires due consideration. Lake Beseka is expanding drastically as a result of the enhancement of recent groundwater recharge caused by very high infiltration from nearby over-irrigated fields and transmission losses in high rise of the Awash river affected by upstream damming.
African Water Journal
104
Soil salinization in many irrigation fields occurred due to over irrigation and subsequent groundwater level rise leading to capillary rise, aggravated by lack of proper grading of the land and irrigation canals which facilitates the leaching of soils. Proper irrigation scheduling and detail crop-water requirement study has to be made in irrigation fields to protect the lake level rise of Beseka and reduce the salinization problem. This needs studies on the duration of growing period and type of crops, water balance studies and continuous monitoring of piezometers, soil and water salinity. Proper drainage structures and land grading are also required to reduce salinization problem and flushing of the salts from the topsoil part. Some indications of nitrate pollution and eutrophication have been observed in the rift. The pollution sources have to be controlled to reduce the treat of further nitrate pollution of the groundwater system and eutrophication of lakes and reservoirs. Physical and chemical properties of soils have to be checked from time to time to regulate fertilizer and pesticide consumption. Water quality monitoring stations are required to detect the spatial and temporal changes of water quality. Upstream use of water must only be undertaken in such a way that it does not affect water quality or quantity to downstream users. Provisions of control of this requires a network of river monitoring stations in order to establish short and long-term fluctuations in relation to basin characteristics, to detect water quality changes and to determine seasonal short and long-term trends in relation to demographic changes, water use changes and management interventions for the purpose of water quality and quantity evaluation. Generally, the current and likely future uncontrolled water abstraction will have obvious repercussions, which are thought to bring grave consequences to the fragile rift environment in the near future. This demands a comprehensive water management and planning strategy requiring the process of protecting and developing the water resources in a broad, integrated, and foresighted manner. In practice, this is a complicated endeavour, since comprehensive water management involves a number of functions that are closely related but which are carried out by different agencies and organizations. The functions include water law and policymaking, regulation, technical assistance and coordination, monitoring and evaluation, administration and financing, public education and involvement. Comprehensive planning is used to integrate the diverse functions necessary for proper water management. The purpose of these functions is to identify alternative
Volume 1 No 1
105
courses of action to protect and develop the water resources. In the process, problems are identified, data are collected and analyzed, and projections are made. This process provides a basis for integrating all the functional components of comprehensive water management. Acknowledgements The author is grateful to the Department of Geology and Geophysics, Addis Ababa University for the field logistic support since 1994. Many Thanks to the Ethiopian Meteorological Services Agency, Ministry of Water Resources, Ethiopian Mapping Authority and Abiyata Soda Ash Factory for providing relevant data.
African Water Journal
106
References Ayenew,T., 2002a. Recent changes in the level of Lake Abiyata, central main
Ayenew,T., 2002b. Application of environmental isotopes for the study of the hydrogeological system of some Ethiopian Rift lakes. Proceedings of the 4th International Conference on Isotopes. 10-14 March 2002. Cape Town, South Africa.
Ayenew,T., 2002c. Integrated groundwater flow system analysis in the Central Main Ethiopian Rift lake basin. Proceedings of the Australian National Chapter of the International Association of Hydrogeologists " Balancing the Groundwater Budget". 12-17 May, Darwin, Australia.
Ayenew, T., 1998. The hydrogeological system of the lake district basin. Central Main Ethiopian Rift. PhD Thesis, Free University of Amsterdam. The Netherlands. 259 pp.
Benvenuti, M., N. Dainelli, C.Iasio, M.Sagri & D. Ventra, 1995. Report on EEC funded project " Land resources inventory, environmental change analysis and their applications to agriculture in the Abaya lakes region" report no.4, University of Florence, Italy. pp. 6-27.
Chernet, T., 1982. Hydrogeologic map of the lakes region (with memo). Ethiopian Institute of Geological Surveys. Addis Ababa, Ethiopia.
Dechassa, T., 1999. Water balance and effect of irrigated agriculture on groundwater quality in th Wonji area, Ethiopian Rift valley. Unpublished M.Sc thesis. Addis Ababa University. 136 pp.
De Filippis, N., 1940. Condizioni chimiche del lago Hora Abiata. Boll. Idrobiol. Africa Orientale Italiana 1: 77-79.
Gebremariam, Z., 1989: Water resources and fisheries management in the rift valley lakes. Sinet: Ethio. Jour.Sci.,12(2): 95 -109.
Geremew, Z., 2000. Engineering geological investigation and lake level changes in the Awassa basin. M.Sc thesis. Addis Ababa University, Department of Geology ad Geophysics. 185 pp.
Volume 1 No 1
107
Hailu, D., Hess, M., Ayenew, T., 1996. The problem of high rise groundwater in Amibara irrigation project, Middle Awash basin. Ethiopian Science and Technology Commission. Unpublished report, Addis Ababa.
Halcrow, 1989. Masterplan for the development of surface water resources in ten Awash basin, vol.6. Ministry of Water Resources, Addis Ababa.
Kazmin, V., 1979. Stratigraphy and correlation of volcanic rocks of Ethiopia. Ethiopian Institute of Geological Surveys. Note number 106: 1- 26.
Kebede, E., Gebremariam, Z. & Ahlgren, A., 1996. The Ethiopian rift valley lakes. Chemical characteristics along a salinity-alkalinity series. Hydrobiologia, 288: 1-12
Loffredo, S. & C.M. Maldura, 1941. Resulatati delle ricerche de chimica limnologica sulle acque dei laghi dell’Africa orienntale Italiana esplorati della Missione ittiologica. In Piccioli, A., (ed.), Esplorazione dei laghi della Fossa Galla. Collezione scientifica e documenatari dell’Africa Italiana III, Vol.I, 181-200.
Lloyd, J.W., 1994. Groundwater management problems in the developing world. Applied Hydrogeology (special publication of the International Association of Hydrogeologists). 4:35-48
Makin, M.J., T.J. Kingham, A.E.Waddams, C.J. Birchall & B.W. Eavis, 1976. Prospects for irrigation development around lake Ziway, Ethiopia. Land Res. Study. Division, Ministry of Overseas Development, 26. Tolworth, UK. 270 pp.
Mohr, P. A., 1967: The Ethiopian Rift System, Bulletin of the Geophys. Obs. Addis Ababa University, No. 11.
Nidaw, D., 1990. Hydrogeology of Awassa Area. M Sc thesis. Addis Ababa University , Department of Geology ad Geophysics. 106 pp.
Omer-Cooper, J., 1930. Dr. Hugh Scott’s expedition to Abyssinia. A preliminary investigation of the fresh water fauna of Abyssinia. Proc. Zool. Soc. Lond. (1930), 195-591.
Street F.A., 1979: Late Quaternary Lakes in the Ziway-Shala Basin, Southern Ethiopia. (UK). PhD Thesis [Quaternaire: STR-80.094]
Talling, J.F. & Talling, I.B., 1965. The chemical composition of African lake waters. Int.Rev.Ges. Hydrobiolgia. 50:421-463.
African Water Journal
108
Tessema, Z., 1998. Hydrochemical and water balance approach in the study of high water level rise of lake Beseka. M.Sc thesis. The University of Birmingham. 90pp.
UNDP, 1973. Geology, geochemistry and Hydrology of hot springs of the East African Rift system within Ethiopia, United Nations, New York.
Vallet-Coulomb, C., Legesse, D., Gasse, F., Travi, Y. & Chernet, T. (2001) Lake evaporation estimates in tropical Africa (Lake Ziway, Ethiopia). J. Hydrol. 245, 1–18.
Von Damm, K.L. & J.M. Edmond, 1984. Reverse weathering in the closed basin lakes f the Ethiopian Rift. Amer. J. Sci. 284: 835-862.
Wenner, C.G., 1973. A master plan for water resources and supplies in the Chilalo Awraja. CADU Publication no.89, Swedish International Development Agency, Stockholm.
Volume 1 No 1
109
Management of Shared Groundwater Basins in Libya
Omar Salem Introduction The Great Socialist People’s Libyan Arab Jamahiriya occupies the north central part of the African continent, and covers a surface area of more that 1.5 million square kilometers. It shares international borders with Egypt and Sudan in the east, Chad and Niger in the south and Algeria and Tunisia in the west. To the north it terminates at the Mediterranean Sea, where the Libyan coast extends for more than 2000 km. Libya shares large groundwater basins with neighbouring countries, the most important of which are the Nubian Sandstone basin with Egypt, Sudan and Chad, and the north Sahara basin with Algeria and Tunisia. The Libyan climate can be generally classified as a dry desert climate particularly in the central and southern regions. It is characterized by the wide variations in temperature between summer and winter seasons along with scarcity and irregularity of rainfall. The north coastal strip, on the other hand, is situated under a semi-Mediterranean climate and receives winter rainfalls ranging from 200 to 400 mm/yr. with moderate temperatures and high relative humidity. The northern plains witness high population densities particularly in the coastal strips, where soils are suitable for a wide range of agricultural production. Consequently more than 80% of the Libyan population, estimated at approximately 5 millions, are located in the large population centers in both Gefara and Benghazi plains and the other coastal cities. Population densities may exceed 120 persons/km2 in the north and less than 1 person/km2 in the desert areas in the central and southern regions. Water Resources Libya’s water resources fall under the two major categories, namely the surface and groundwater resources. The former is rather limited and contributes less than 3% of the total water use for the different activities. In order to better control these resources, sixteen dams and several reservoirs were constructed for the collection of over 60 Mm3 per year. Natural springs of low to medium discharge provide water for different uses in the Jabal Akhdar, Jabal Nefusa and the central zone.
African Water Journal
110
Groundwater on the other hand represents the main source of water supply in the Jamahiriya. It is extracted through wells ranging from a few meters to more than 1000 m in depth. Groundwater aquifers are either renewable or non-renewable. The renewable aquifers are those located in the northern zones and fall under high precipitation rates. They range in age from Quaternary to Cretaceous and contribute more than 2400 Mm3/yr against an annual recharge of less than 650 Mm3. This imbalance introduced continuous lowering of groundwater levels accompanied by deterioration in water quality due to seawater intrusion and invasion of saline water from adjacent aquifers. The large sedimentary groundwater basins cover extensive areas in the central and southern parts of Libya and contribute large quantities of fresh water for local use and agricultural development. Recently, several wellfields were developed to supply the Great Man made River Project (GMRP). When completed, the GMRP will supply more than 6 Mm3/day to the agricultural fields and population centers in the north. According to the hydrogeological studies, GMRP water will minimize the water balance deficits in the affected zones. Non-conventional water resources in the form of desalination cover only a small portion of the domestic and industrial water demand. Treated sewage is still very limited and is mainly used for irrigation purposes. Figure (1) shows the potential water resources.
Fig.1 Potential water resources
3000
650 170
surface renewable Non-renewable
(106 m3/y)
Volume 1 No 1
111
Shared Water Resources The Sahara desert in the northern half of Africa is well known for the existence of large sedimentary basins extending over thousands of square kilometers crossing through international boundaries (fig.2). These basins consist of several aquifer systems, which belong to different geological ages. Most common are the Mesozoic aquifers, namely the Jurassic and Lower Cretaceous, which are made of thick sandstone and clay layers and are widely known as the Nubian Sandstone. This aquifer is shared between Libya, Egypt, Sudan and Chad. The other main sandstone aquifer is the Continental Intercalaire shared between Libya, Algeria and Tunisia. These basins also contain other aquifers of great importance such as the Post Eocene in Libya and Egypt (Sarir basin) and the Complex Terminal of Upper Cretaceous in Libya, Algeria and Tunisia. Although the latter group is of lower water quality, they enjoy great local importance and are widely developed to meet the increasing water requirements.
Fig. 2 Shared Groundwater Basins.
The Nubian Sandstone Basin This basin, in its broad definition, includes the Paleozoic and Mesozoic aquifers in the south and the Neogene aquifers in the north. It extends over a surface area of more than 2.2 million km2 of which, more than 760 000 km2 are in Libya. It is locally known as the Kufra and Sarir basin, and is used since the mid sixties and
م
African Water Journal
112
early seventies in the supply of local water requirements and the irrigation of major agricultural projects in Kufra and Sarir. It also supplies water for oil production activities, and more recently for GMRP conveyance system. In Egypt the area of the Nubian basin is in the order of 828 000 km2 while it is limited to only 376 000 km2 in the Sudan and 235 000 km2 in Chad. In Libya, the basin has been subjected to a number of localized studies accompanied by deep exploratory drilling and extensive geological and geophysical surveys. The generated results helped in the determination of hydraulic properties and flow direction, and setting a base for the continuous monitoring through a piezometric network of more than 150 wells. This network has enabled the construction of advanced mathematical models to study future aquifer behaviour. Fig. 3 shows the local extension of the Kufra and Sarir aquifers.
Fig. 3 Nubian Sandstone Basin in Libya.
Kufra
Sarir
Volume 1 No 1
113
The Kufra Basin The Kufra basin covers an area of over 200 000 km2 and consists of a deep Paleozoic aquifer and a more widely used upper aquifer known as the Nubian Sandstone. The saturated thickness of both aquifers exceeds 3000 m. in the central part of the basin south of Kufra town. Production wells drilled for agricultural water supply range in depth from 400 to 500 m. with productivity ranging from 100 to 300 m3 /hr. and a water quality between 180 and 300 mg/l. Transmissivity from pumping tests falls between 300 and 3500 m2/day. Storativity is in the order of 0.0001 and 0.015. To the north of Kufra, Tazerbu wellfield was completed in depths ranging from 450 to 600 m, with productivity reaching 400 m3/hr and water quality of less than 500 mg./l. Tazerbu wells are tapping the lower aquifer (Paleozoic). Both aquifers are hydraulically connected at regional level and are also in contact with the Miocene aquifer in the Sarir basin to the north. Groundwater flow is from south to north and northeast in the direction of the natural depressions along the latitude 30 N such as the Qattara Depression in Egypt. The Sarir Basin Located to the north of Kufra basin, the Sarir basin covers a surface area of more than 450 000 km2 and consists of a number of aquifers belonging to the Post-Eocene. The basin is currently developed for agricultural activities in the Sarir area as well as for conveying water to the northern plains. Depth of wells tapping these aquifers range from 400 to 500 m with productivity varying from 150 to 300 m3/hr and water quality in the order of 1200 mg/l. Transmissivity and storativity determined from pumping tests fall between 750 and 1500 m2/day and 0.0005 and 0.0001 respectively. The Joint Commission for the Study and Development of the Nubian sandstone Aquifer The hydrogeological studies and mathematical models that were conducted on the Nubian sandstone aquifer in Libya showed that large quantities of water are available for development for many decades to come. These studies also emphasized the need for determination of the natural boundaries of the basin, its lateral extension and its hydraulic properties in neighbouring countries. The basin should therefore be treated
African Water Journal
114
as one hydrogeological unit to enable the representation of its future behaviour in accordance with the development schemes of the sharing countries. The announcement of the creation of a Joint Commission for the coordination between Libya and Egypt in managing the shared groundwater aquifer was made in Tobruk during a summit meeting in 17 October 1989. The establishment protocol was signed during the third round of the Libyan – Egyptian Joint Committee meeting and members of the board of the Joint Commission were nominated. The internal Code determined the objectives and functions of the Commission as follows: • Collection of data, information and study results from concerned countries for
classification, analysis and link; • Conducting complementary studies to determine the present state of the aquifer
from the qualitative and quantitative point of view; • Preparation of plans for the development of water resources and proposing and
implementing joint policies for the exploitation and use of water resources at national and regional levels;
• Management of the aquifer on sound scientific basis; • Cooperation in the field of training and capacity building; • Call for rational use of the Nubian Sandstone Aquifer water; • Study of environmental impacts of water development; and • Organization of scientific workshops and dissemination of aquifer related
information and strengthening ties with regional and international organizations of common interest.
Both Sudan and Chad joined the Commission at a later stage and became full members. The Commission has held six meetings, most of which were dedicated to the exchange of information and scientific data and follow up of the work progress in the Nubian Sandstone Aquifer System (NSAS) project. The Nubian Sandstone Aquifer System Study Project The Nubian Sandstone Aquifer System Study Project started in 1998 with the Center for Environment and Development in the Arab Region and Europe (CEDARE) as an executing agency. The first phase of the project is financed by the International Fund for Agricultural Development (IFAD) with contribution from the concerned countries. It aims at reviewing previous studies, establishing a regional database and preparing a mathematical model capable of representing the aquifer condition and
Volume 1 No 1
115
simulating its future behaviour in response to planned development schemes. The model is also expected to study the effect of future withdrawals on water levels and the extension of drawdown cones in neighbouring countries. The project also aims at training national teams in the different activities of the study including the application of the mathematical model, databases, GIS, and the use of advanced monitoring equipment. Member countries were supplied with field and office equipment, instruments and software needed for data collection and interpretation. National teams prepared national reports reflecting the state of the aquifer in each country at the early stage of the project. During the preparation of the mathematical model, several meetings of country representatives were held by technicians and decision-makers. The meetings were dedicated to validating data, providing information needed for each stage of the model, approving model calibration, and determining future development alternatives for the coming fifty years. This phase has been completed and a final report was produced. The present phase of the project covers the socio-economic studies and is financed by the Islamic Development Bank (IDB). Future Horizons The Nubian Sandstone Aquifer countries have succeeded in establishing a strong base for cooperation, which enables them to manage the basin in a sound and efficient manner. They realize the need for dealing with the basin as one hydrogeological unit and securing the flow of information. Future cooperation in the field of data collection and storage will enable member States to easily exchange information and update the regional mathematical model and allow its use as an effective management tool. It is important to continue the periodical monitoring of water levels and water quality. Improving legislation that guarantees the protection of the shared resources from pollution and overexploitation should also be given special attention. The North Sahara Basin The North Sahara Basin extends over a surface area of over one million km2, of which 700 000 km2 are in Algeria, 60 000 km2 in Tunisia and 250 000 km2 in Libya and is therefore considered as one of the most important basins in the region. In Libya, it is known as the Hamada al Hamra basin which is subdivided into two sub-basins: the Ghadames in the west and the Sawf al Jin in the east and terminates at the Sabkha of Tawurgha along the Mediterranean coast (fig.4).
African Water Journal
116
Fig. 4 North Sahara Basin
The North Sahara Basin contains two main groundwater aquifers: the Upper Jurassic –Lower Cretaceous Sandstone, known regionally as the Continental Intercalaire (CI) and locally as the Kikla aquifer and Upper Cretaceous limestone known regionally as the Complex Terminal (CT) and locally as Nalut and Mizda aquifers. In addition, a number of more recent aquifers belonging to the Miocene and Quaternary gain local importance in the north-eastern parts of the basin despite their relatively limited lateral extension. Water of the Upper Cretaceous aquifer is characterized by high salinity, which limits its use in a great number of localities, leaving Kikla as the most economically important aquifer. Several wells of more than 1000 m in depth are drilled for water supply in different parts of the basin. The aquifer properties can be summarized as follows:
• Depth from 700 to 1200 m bgl; • Productivity from 50 to 200 m3/hr; • Salinity from 1000 to 1500 mg/l; and • Transmissivity from 400 to 1500 m2/day.
Groundwater flow in the aquifer is from south to the north and northeast in the direction of Tawurgha spring and from south to the north and northwest towards Shott Djerid in southern Tunisia.
Volume 1 No 1
117
The aquifer is in contact with the Paleozoic aquifer in the Murzuq basin in the south, which contributes partly to its recharge through lateral inflow. The Kikla, as well as the Mizda and Nalut aquifers receive direct but limited recharge through formation outcrops along the southern flanks of Jebel Nefusah, which is dissected by a dense network of wadies and falls under the 100 to 250 mm/yr isohyets. The Atlas Mountains in Algeria also contribute local recharge to the CT and CI. The North Sahara Basin Study Project The study of the basin started in July 1999 after an agreement with IFAD for financing the project was signed. Other donors also contributed, along with the three concerned countries. OSS was selected as an executing agency, and Tunis was chosen for hosting the project management team, which consists of representatives of the three countries, assisted by technical working teams in each country for data collection and transfer to the project headquarters. The project, known as SASS (Systeme Aquifere du Sahara Septentrional) aims at defining the technical aspects of the basin and building of a database and a GIS. Other objectives include the preparation of a model able to represent aquifer behaviour under the proposed development schemes and act as a management tool for the basin to meet the common interests of the countries. The first phase of the project is currently coming to an end. During this phase, several technical meetings were held by water resources managers and technical teams. Several workshops and training courses on the different activities of the project were organized, in addition to the supply of equipment, software and vehicles that made data collection, interpretation and exchange possible. The second phase of the project is financed mainly by the United Nations Food and Agriculture Organization (FAO) and partly by the concerned countries. This phase is concerned with the establishment of a consultation mechanism among the basin countries. It includes a review of current water resources legislation in each country and proposing necessary amendments for better management of the shared resource. It will also improve the administrative systems and initiate a framework to realize free flow of information to meet development objectives. Implementation of this phase has already started and it is expected to be completed by the end of this year.
African Water Journal
118
Future Horizon Cooperation between Libya, Tunisia and Algeria in the field of managing the shared aquifer system goes back to the seventies. Periodical meetings of bilateral committees, and more recently in the framework of the Union of Maghreb Arab countries (UMA) are dedicated to the exchange of information on different water issues of common interest. A working group on water resources has been active since the creation of UMA and was recently promoted to a Ministerial Council for water. Upon completion of the SASS project, it is recommended to establish a permanent institution similar to the Joint Commission for the Study and Development of the Nubian Sandstone Aquifer, in which the departments responsible for the management of water resources in the three countries are represented. The new institution will be entrusted with monitoring the state of the aquifer and collecting necessary data for updating the mathematical model and future scenarios in view of the newly adopted development plans. The Need for Water Legislation To meet the growing demand for water, development of all available resources including those of the non-renewable and shared basins becomes necessary. Basin development could be for local use when necessary, or for conveyance to remote areas of high demand and more suitable conditions. Prior to any development, it is important to conduct hydrogeological studies in order to determine the volume in storage and the rates of extraction and future impacts, especially with regard to the horizontal extension of drawdown curves and water quality changes. It is therefore necessary to systematically collect technical information and deal with the basin as a complete hydrogeological unit. As a result, coordination among neighboring countries should take the form of a complementary approach, where determination of optimal extraction rates that satisfy the development policies of all countries, or amending such policies in view of the dominating hydrogeological conditions is implemented. Planning for the development of water resources is of long term nature and therefore requires solid legislation to regulate the use of shared water resources. Concerned countries must take necessary actions for the protection of water resources. Major
Volume 1 No 1
119
issues that need to be given special attention in the new legislation dealing with shared groundwater resource management are: • Exchange of geological, hydrological and hydrogeological data and study
results; • Exchange of information concerning future development plans; • Defining the allowed quantities for use by each country based on regional
study results; • Monitoring extraction and resulting drawdown; and • Setting rules for waste disposal control and prevention of industrial,
chemical, and petrochemical pollutants. Conclusion Libya is witnessing a growing demand for water, which requires the adoption of remedial measures to secure continuous supply of this important resource. Such a supply could be met from the large groundwater basins in central and southern parts of the country, most of which are shared basins. In the last decades, Libya started a cooperation program with neighbouring countries aiming at the adoption of a long-term strategy for managing shared water resources. This requires exchange of information related to the present and future extractions along with the results of water levels and water quality monitoring. These efforts lead to the launching of joint study projects and preparation of mathematical models, which reflect the present state of the aquifers and predict its future behaviour in accordance with the planned development schemes. In addition, establishment of a Joint Commission for the Study and Development of the Nubian Sandstone Aquifer was successfully accomplished and planning for the establishment of a similar body dealing with the North Sahara Basin is currently under consideration. These Commissions will be responsible for the issue of legislation, regulating the joint management of the shared basins and securing their protection from over-exploitation and pollution.
African Water Journal
120
References CEDARE. 2001. Regional Strategy for the Utilization of the Nubian Sandstone
Aquifer System. Draft Final Report. OSS. 2002. Systeme Aquifere du Sahara Septentrional. Definition ET Realization des
simulations exploratoires. Salem,O.. 1997. Evaluation of the Water Resources of Libya. GWA, Tripoli.Libya