AFRL-RX-WP-TR-2009-4069 DEVELOPMENT OF THE USAF COMPUTED RADIOGRAPHY (CR) PROCESS CONTROL Kenneth J. LaCivita Materials Integrity Branch System Support Division NOVEMBER 2008 Interim Report Approved for public release; distribution unlimited. See additional restrictions described on inside pages STINFO COPY AIR FORCE RESEARCH LABORATORY MATERIALS AND MANUFACTURING DIRECTORATE WRIGHT-PATTERSON AIR FORCE BASE, OH 45433-7750 AIR FORCE MATERIEL COMMAND UNITED STATES AIR FORCE
Transcript
AFRL-RX-WP-TR-2009-4069
DEVELOPMENT OF THE USAF COMPUTED RADIOGRAPHY (CR) PROCESS CONTROL Kenneth J. LaCivita Materials Integrity Branch System Support Division
NOVEMBER 2008 Interim Report
Approved for public release; distribution unlimited.
See additional restrictions described on inside pages
STINFO COPY
AIR FORCE RESEARCH LABORATORY MATERIALS AND MANUFACTURING DIRECTORATE
WRIGHT-PATTERSON AIR FORCE BASE, OH 45433-7750 AIR FORCE MATERIEL COMMAND
UNITED STATES AIR FORCE
NOTICE AND SIGNATURE PAGE Using Government drawings, specifications, or other data included in this document for any purpose other than Government procurement does not in any way obligate the U.S. Government. The fact that the Government formulated or supplied the drawings, specifications, or other data does not license the holder or any other person or corporation; or convey any rights or permission to manufacture, use, or sell any patented invention that may relate to them. This report was cleared for public release by the USAF 88th Air Base Wing (88 ABW) Public Affairs Office (PAO) and is available to the general public, including foreign nationals. Copies may be obtained from the Defense Technical Information Center (DTIC) (http://www.dtic.mil). AFRL-RX-WP-TR-2009-4069 HAS BEEN REVIEWED AND IS APPROVED FOR PUBLICATION IN ACCORDANCE WITH THE ASSIGNED DISTRIBUTION STATEMENT. *//Signature// //Signature// ________________________________________ ___________________________________ KENNETH J. LACIVITA MARY ANN PHILLIPS, Chief Project Engineer Materials Integrity Branch Materials Integrity Branch System Support Division System Support Division //Signature// ____________________________________ DANIEL J. McDERMOTT Deputy Chief System Support Division Materials and Manufacturing Directorate This report is published in the interest of scientific and technical information exchange, and its publication does not constitute the Government’s approval or disapproval of its ideas or findings. *Disseminated copies will show “//Signature//” stamped or typed above the signature blocks.
i
REPORT DOCUMENTATION PAGE Form Approved
OMB No. 0704-0188
The public reporting burden for this collection of information is estimated to average 1 hour per response, including the time for reviewing instructions, searching existing data sources, searching existing data sources, gathering and maintaining the data needed, and completing and reviewing the collection of information. Send comments regarding this burden estimate or any other aspect of this collection of information, including suggestions for reducing this burden, to Department of Defense, Washington Headquarters Services, Directorate for Information Operations and Reports (0704-0188), 1215 Jefferson Davis Highway, Suite 1204, Arlington, VA 22202-4302. Respondents should be aware that notwithstanding any other provision of law, no person shall be subject to any penalty for failing to comply with a collection of information if it does not display a currently valid OMB control number. PLEASE DO NOT RETURN YOUR FORM TO THE ABOVE ADDRESS.
1. REPORT DATE (DD-MM-YY) 2. REPORT TYPE 3. DATES COVERED (From - To)
November 2008 Interim 01 November 2005 – 01 June 2008 4. TITLE AND SUBTITLE
DEVELOPMENT OF THE USAF COMPUTED RADIOGRAPHY (CR) PROCESS CONTROL
5a. CONTRACT NUMBER
In-house 5b. GRANT NUMBER
5c. PROGRAM ELEMENT NUMBER
N/A 6. AUTHOR(S)
Kenneth J. LaCivita 5d. PROJECT NUMBER
N/A 5e. TASK NUMBER
N/A 5f. WORK UNIT NUMBER
N/A 7. PERFORMING ORGANIZATION NAME(S) AND ADDRESS(ES) 8. PERFORMING ORGANIZATION
REPORT NUMBER
Materials Integrity Branch (AFRL/RXSA) System Support Division Air Force Research Laboratory, Materials and Manufacturing Directorate Wright-Patterson Air Force Base, OH 45433-7750 Air Force Materiel Command, United States Air Force
AFRL-RX-WP-TR-2009-4069
9. SPONSORING/MONITORING AGENCY NAME(S) AND ADDRESS(ES) 10. SPONSORING/MONITORING
Air Force Research Laboratory Materials and Manufacturing Directorate Wright-Patterson Air Force Base, OH 45433-7750 Air Force Materiel Command United States Air Force
Approved for public release; distribution unlimited.
13. SUPPLEMENTARY NOTES
PAO Case Number: 88ABW-2009-0597; Clearance Date: 18 Feb 2009. Report contains color.
14. ABSTRACT
Computed Radiography (CR) has been introduced to the USAF in recent years, and following a USAF evaluation, CR was authorized in lieu of conventional film radiography for detection of foreign object debris (FOD), water, and in a few applications, and cracks. To assure satisfactory and repeatable results for nondestructive testing and to ensure long-term stability of the CR systems, CR Process Control procedures and an associated CR Process Control Standard (CRPCS) were developed. The procedures were placed into T.0.33B-I-2, Nondestructive Inspection General Procedures and Process Controls, and the CRPCS has been assigned a National Stock Number (NSN) and made available to the USAF. This report documents the tasks undertaken to develop the USAF CR process controls, and the rationale for selection of the various aspects of the tests and test standard.
15. SUBJECT TERMS
Computed radiography, x-ray, process control, nondestructive inspection (NDI)
16. SECURITY CLASSIFICATION OF: 17. LIMITATION OF ABSTRACT:
SAR
18. NUMBER OF PAGES
62
19a. NAME OF RESPONSIBLE PERSON (Monitor)
a. REPORT Unclassified
b. ABSTRACT Unclassified
c. THIS PAGE Unclassified
Kenneth J. LaCivita 19b. TELEPHONE NUMBER (Include Area Code)
N/A
Standard Form 298 (Rev. 8-98) Prescribed by ANSI Std. Z39-18
iii
Table of Contents
Section Page List of Figures ................................................................................................................................ iv List of Tables ................................................................................................................................. iv 1. Summary ............................................................................................................................... 1 2. Introduction ........................................................................................................................... 2 3. Approach ............................................................................................................................... 3 4. Development of Procedures and Standards .......................................................................... 7
4.1 Contrast (ASTM E2445, para. 6.1.1) ................................................................................. 8 4.2 Spatial Resolution and Unsharpness (ASTM E2445, para. 6.1.2 and 6.1.3) .................... 10 4.3 Geometric Distortion (ASTM E2445, para 6.2.1) ............................................................ 13 4.4 Laser Jitter (ASTM E2445, para 6.2.2)..............................................................................14 4.5 Scan Line Integrity (ASTM E2445, para. 6.2.2)…………………………………………16 4.6 Scan Line Dropout (ASTM E2445, para. 6.2.2)………………………………………....17 4.7 Afterglow a.k.a. Blooming or Flare (ASTM E2445, para. 6.2.3) ..................................... 18 4.8 Slippage (ASTM E2445, para. 6.2.4) .............................................................................. 20 4.9 Shading (ASTM E2445, para. 6.2.5)…………………………………………………….22 4.10 Erasure (ASTM E2445, para. 6.2.6) ................................................................................ 23 4.11 IP Artifacts (ASTM E2445, para 6.2.7) ........................................................................... 24 4.12 Signal-to-Noise Ratio (SNR) (ASTM E2445, para 6.2.8).................................................26
Johnson AFB (VMI), North Carolina. Using the “film-based” exposure parameters developed at
RXSA, CR exposure parameters were optimized by varying the exposure parameters
(kilovoltage (kV), milliamperage (mA), and time), until: (1) the maximum number of line pairs
could be visually ascertained on the duplex line pair gauge, and (2) the two percent contrast step
could be visually identified on the aluminum contrast gauge. Software tools were only used to
magnify the image to fill the viewing monitor and adjust image contrast. Once these exposure
parameters were established, all other test targets in the phantom were evaluated to confirm that
the necessary test information could be obtained from the other targets within the same CR
image. During the NDI shop visits, each manufacturer’s CR system software tools were
evaluated to define common procedures and acceptance criteria where possible. Based on results
of these visits, draft process control procedures were written and a prototype USAF CRPCS
design was developed.
Through an AFRL/RXLP managed Aging Aircraft program, “Computed Radiography
X-Ray System Validation Testing with Process Control Development,” one prototype USAF
CRPCS (Figure 2) was built by ARINC Inc. The actual prototype was identical to the USAF
prototype design, with the exception of the plate material being changed from Lucite to a clear
acrylic for better visibility of test targets. The wire-type line pair gauges were also changed to
foil-type line pair gauges as foil gauges incorporated easily identifiable markings. The prototype
CRPCS consisted of a two-piece clear acrylic plate, with regions milled out to accept various test
targets, and then bonded together with an adhesive. The two-piece plate was 0.69 inch x 14
inches x 17 inches; with a 0.50 inch thick upper plate and 0.19 inch thick lower plate. The test
targets were placed in the thinner (lower) plate at the plate-to-plate interface, and included:
A. T-target, brass
B. Duplex-wire (E2002)
C. BAM snail
D. Converging line pairs
E. Shading measurement pointsF. Cassette positioning locator
G. Homogeneous strip, Al
H. Lucite plate
I. Ruler for linearity check
J. Contrast gauges (Al, Cu, SS)
5
a. A brass T-target per ASTM E2445
b. Two lead foil line pair gauges
c. A crosshair target made with a sharpie marker for shot-centering
d. A 0.10 inch x 3 inch x 16 inch aluminum plate
e. Four 0.10 inch diameter x 0.19 inch long lead rods, placed 0.50 inch from each corner
of the plate and oriented such that the rod axis was perpendicular to the plane of the
plate
f. A ½-inch thick aluminum contrast gauge per ASTM E1647
Figure 2. First Prototype USAF CRPCS
Initial evaluations of the draft process control procedures were performed with both the
ASTM CR Test Phantom and the prototype USAF CRPCS, using the new GE CRxTower
system. The team conducted a round of field visits to perform validation and verification of the
procedures and CRPCS on various manufacturers’ CR systems owned by the USAF. These
visits included Sheppard AFB (GE), Texas, Ellsworth AFB (Fuji), South Dakota, and Seymour-
Johnson AFB (VMI), North Carolina. At each visit, the local NDI shop provided technicians to
perform all radiography and process control testing using the draft procedures.
Based on results of these visits, additional revisions were made to the procedures and
CRPCS (Figure 3). The revisions included:
1. Redesigned corner markers as 0.10 inch diameter brass ball bearings to eliminate
parallax effect of original markers
2. Elimination of homogeneous aluminum strip
3. Addition of lead numbers and letters to identify specific targets to aid procedure
interpretation
4. Replacement of T-target with two redesigned targets for jitter (new material and
geometry) and afterglow (separated from jitter target)
A
B
D
F
C
E
EE
E
6
5. Elimination of adhesive and addition of fasteners to join two halves of acrylic plate,
due to appearance of non-uniform adhesive in CR images
6. Revised machining of recesses for afterglow target to prevent false interpretation of
afterglow
7. Relocation of targets due to jitter target redesign
The final revisions were reviewed by all participants and NDIEWG members before being
approved to be published in the 2008 revision of T.O. 33B-1-2.
Figure 3. Final design of USAF CRPCS
7
4. DEVELOPMENT OF PROCEDURES AND STANDARD
Exposure parameters were optimized and established to minimize the number of
exposures required to evaluate all performance parameters. In most instances, one set of
exposure parameters was adequate to perform all system tests (Table 1). A second set of
exposure parameters was provided in the event that the contrast sensitivity test could not be
accomplished using the first set of exposure parameters. To conduct IP tests (artifact tests) a set
of exposure parameters (Table 2) were developed based on the number of IPs to be stacked up
and exposed in the same shot.
Table 1. Summary of CR Process Control Tests
Table 2. Exposure parameters for IP artifacts test
The test target designs and test procedures were optimized and finalized through a series
of laboratory and field evaluations. Each test, including the required test target, evaluation, and
acceptance criteria, are discussed in the following section in the same order as they appear in
ASTM E2445. A comparison of the resulting USAF requirements and ASTM E2445
requirements are also provided.
kV ma time (sec) SFD (in)
Geometric Distortion
Slippage
Scan Line Dropout
Shading
Afterglow
Laser Beam Jitter
Spatial Resolution
60 5 36 48 Contrast Sensitivity
n/a n/a n/a n/a Latent Image
IP 25 1.5A
20A
48A
IP Artifacts
Exposure Parameters
50
Process Control
Evaluation
System
Test
Type
20 483
Maximum Number of
IPs to be Exposed IP Layout
Distance from
Source to IPs (feet) kV mA
Time
(seconds)
1 1 4 25 1.5 20
4 2 x 2 6 25 2 30
9 3 x 3 9 50 2 30
16 4 x 4 12 50 3 30
25 5 x 5 15 50 5 30
8
4.1 Contrast (ASTM E2445, para. 6.1.1)
Purpose: The contrast test evaluates the ability of the CR system to detect variations in
image intensity. Contrast sensitivity is critical for detecting changes in density, such as
substructure features, entrapped water, FOD, and cracking.
Typical causes for loss of performance: Incorrect kV, excessive scatter, improper dose,
and erroneous detector response.
Test target: The ASTM phantom includes three contrast gauges, one each of aluminum,
copper, and stainless steel (Figure 1). To evaluate each of these gauges, multiple exposures are
necessary. In the interest of simplicity, and the fact that most USAF radiography exposures are
below 160kV for aluminum or less dense materials, it was determined that only the aluminum
contrast gauge was necessary for the USAF CRPCS to adequately monitor this parameter (Figure
3).
Evaluation procedure: The ASTM E2445 evaluation procedure involves taking a line
profile measurement (pixel width =1 pixel) across the contrast gauge. The average noise of the
profile shall be less than or equal to the difference in measured intensity between the full and
reduced wall thickness of the step. When this approach was evaluated on the GE CRxTower
system it was found that when a two percent step image was easily visible to the inspector, the
line profile software tool would only recognize the three percent step (Figure 4) using the ASTM
criteria. If wider profiles were used, that approached the width of the steps in the contrast gauge,
the two percent step could be identified in most but not all cases. Again, in the interest of
simplicity and due to the extremely conservative results using software tools, a visual evaluation
of the contrast gauge was chosen as the evaluation procedure for the USAF process controls.
Figure 4. Image of line profile tool drawn across computed radiograph of contrast sensitivity
gauge and corresponding line profile graph
2 percent step
9
Acceptance criteria: Based on the demonstrated capability of all USAF CR systems
evaluated using standard or high resolution imaging plates, the two percent contrast step image
was easily identified visually. Since all USAF CR systems were effectively being used for FOD,
water, and honeycomb evaluation, where contrast is critical, it was concluded that two percent
was a suitable acceptance criteria for these applications. Determining the contrast sensitivity
required for crack detection was beyond the scope of this effort and will have to be determined
by a separate test program.
10
4.2 Spatial Resolution and Unsharpness (ASTM E2445, para. 6.1.2 and 6.1.3)
Purpose: The spatial resolution and unsharpness test evaluates the ability of the CR
system to detect features with high aspect ratios such as cell walls in honeycomb core, FOD,
cracking, etc.
Typical causes for loss of performance: Condensation on optics (i.e., high humidity – air
conditioning failure in facility), missing focusing cup (i.e., after maintenance).
Test target: ASTM E2445 calls out two types of targets for spatial resolution and
unsharpness; a duplex wire gauge and a converging line pair gauge (Figure 1). Initially the
duplex wire gauge was used since it was less subjective to visually interpret and, if necessary,
was also easier to evaluate using software tools such as line profiles. The duplex wire gauges
were difficult to acquire; however, and during the search for a supplier, an alternate foil line-pair
gauge was identified, which covered the same range of spatial resolution, and included easily
identifiable markings which made the procedures easier to follow. Two foil gauges were used,
one for the X-axis and one for the Y-axis. As defined by ASTM E2445, both foil gauges were
rotated five degrees to prevent alignment with image pixels, ensuring an assessment of spatial
resolution independent of pixel orientation (Figure 3).
Evaluation procedure: ASTM E2445 contains two methods for measuring spatial
resolution or unsharpness.
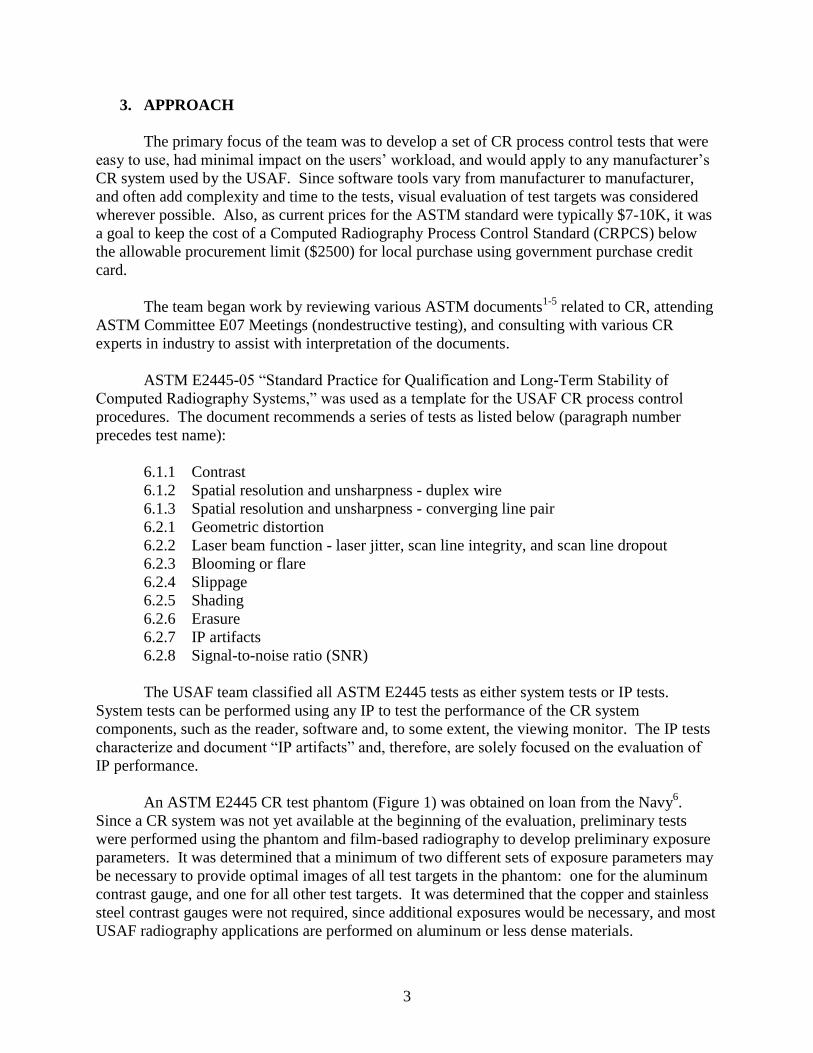
Method 1: Using the duplex wire gauge (Figure 5), two exposures must be taken so the
X and Y axes can be evaluated. The first unresolved wire pair, which is the first wire pair
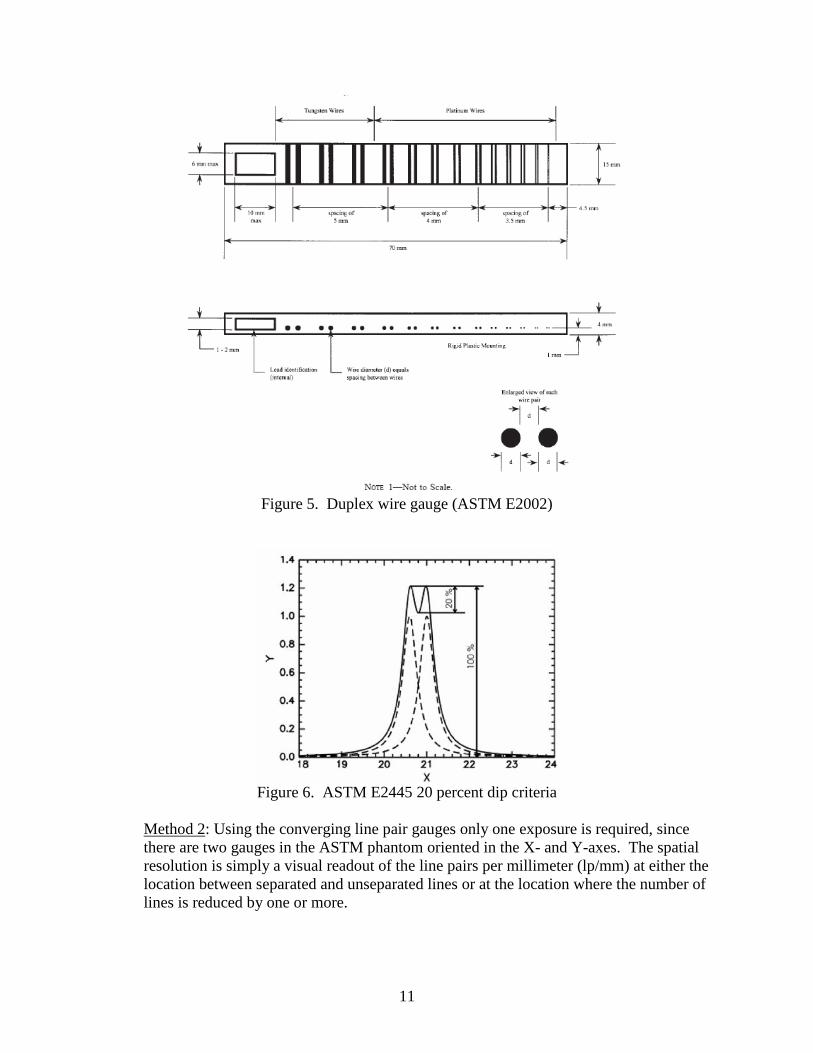
with a projected intensity dip between the wires of less than 20 percent (Figure 6),
determines the unsharpness per ASTM E2002. The 20 percent dip can be determined by
taking a line profile measurement across the wire pairs. Spatial resolution is one half of
the measured unsharpness.
11
Figure 5. Duplex wire gauge (ASTM E2002)
Figure 6. ASTM E2445 20 percent dip criteria
Method 2: Using the converging line pair gauges only one exposure is required, since
there are two gauges in the ASTM phantom oriented in the X- and Y-axes. The spatial
resolution is simply a visual readout of the line pairs per millimeter (lp/mm) at either the
location between separated and unseparated lines or at the location where the number of
lines is reduced by one or more.
12
During evaluation of the foil line pair gauges, it was confirmed that the ASTM E2445 20
percent dip criteria, which required the use of software tools, agreed well with visual evaluation
of the CR image which did not require software tools (Figure 7). The visual evaluation was
performed at a magnification level that presented the line pair gauges such they filled the entire
viewing area of the CR system monitor. As a result, the USAF procedure requires only a visual
readout of the smallest resolved line pair on each of the two foil line pair gauges.
Figure 7. Image of line profile tool drawn across smallest visible line pair. Corresponding line
profile graph illustrating approximately 20 percent dip in intensity between lines.
Acceptance criteria: Initial acceptance criteria were determined from field evaluations of
the various CR systems. A very conservative minimum capability was established for baseline
test acceptance criteria that all systems could meet based on the pixel pitch or resolution of the
scanner (Table 3) and operator visual acuity. It is required the scanner resolution be selected to
correspond to the imaging plate type (i.e., standard versus high resolution) IAW manufacturer’s
instructions. Acceptance criteria for subsequent tests shall be no less than the next larger line
pair as compared to the baseline test result. Software tools can be used to obtain a less subjective
evaluation, but are not required in an effort to maintain simplistic procedures. Again, these
criteria do not apply to crack detection.
Table 3. Baseline Test - Spatial Resolution Acceptance Criteria
pixel pitch or scanner resolution (microns) 100 87 70 50
minimum line pairs per mm required for baseline test 1.2 2.8 2.8 4.0
13
4.3 Geometric Distortion (ASTM E2445, para 6.2.1)
Purpose: The geometric distortion test evaluates the image to determine if it is distorted
in the X- and/or Y-axes.
Typical causes for loss of performance: Problem with CR transport through reader (e.g.,
slippage) affecting the “slow” scan (X) axis, or electronics (e.g., pixel clock) affecting the “fast”
scan or Y axis.
Test target: ASTM E2445 utilized two linear scales, one along the long edge of the
image and one along the short edge of the image (Figure 1). This configuration allowed only for
evaluating two edges of the image. The USAF targets incorporated the design approach of a
discontinued Fuji medical device, which used markers at select locations to measure for
distortion. The USAF targets were initially chosen as short lead rods (0.10-inch dia. x 0.25-inch
long) placed on end and located at each corner of the CRPCS. This allowed measurement of all
four edges, as well as two diagonals if necessary. Crosshairs were considered but practical
designs risked exceeding the CRPCS cost threshold. The final design was changed to 0.10-inch
diameter brass ball bearings (Figure 3) to eliminate a slight parallax effect of the lead rod
markers as imaged in the radiographs. The material change to brass was due to availability and
adequate density for imaging.
Evaluation procedure: ASTM E2445 requires measuring each linear scale which
evaluates the linear distortion in both the X- and Y-axes but only on two of the four sides of the
image. A twist measurement was not addressed in E2445, other than stating that the CR system
should not allow twist. The USAF procedure requires measuring the distance between the corner
markers along one long side, one short side, and one diagonal. This permits evaluation of linear
distortion in both axes, as well as distortion resulting in twist.
Acceptance criteria: ASTM E2445 requires measurements to within five percent of
actual, which equates to a maximum allowable error of 0.85 inch in the long direction of the
image. The USAF procedure requires calibrating on the “short” direction of the image and then
provides allowable values for distances between the corner markers in the other two directions
(Table 4) which allow 0.25 inch error, equating to 1.3-1.6 percent depending on the measurement
length. The 0.25 inch error was selected because the worst-case misplacement of software
measurement cursors on the 0.10 inch diameter corner markers could produce a maximum error
of 0.20 inch, meaning distortions of 0.05 inch to 0.45 inch could be accepted. Although not
ideal, the USAF criteria are more restrictive than the ASTM criteria, and geometric distortions in
excess of 0.10 inch would most likely be readily noticeable as slippage (discussed later in this
report).
Table 4. Geometric Distortion Acceptance Criteria
Measurement
Direction Markers
Acceptance
Criteria
(inches)
long 1-2 (or 3-4) 15.5+/-0.25
diagonal 1-4 (or 2-3) 19.9+/-0.25
14
4.4 Laser Jitter (ASTM E2445, para 6.2.2)
Purpose: The laser jitter test evaluates the image to determine if a lack of smooth
movement of the imaging plate and laser scanning device occurs. According to manufacturers’
technical experts, not all scanners are susceptible to laser jitter.
Typical causes for loss of parameter: Timing error or laser beam modulation problem.
Test target: ASTM E2445 utilizes a brass T-target to evaluate jitter (Figure 1). Jitter
occurs as the laser rasters and will be evident only in the leg of the T-target that is aligned in the
“slow” scan or long direction of the imaging plate. During field evaluations an instance of jitter
occurred on one of the CR systems evaluated (Figures 8 and 9) with the USAF prototype
CRPCS. Although it was evident on a small portion of the T-target, it was more distinct on a
small portion of the thin lead foil line pair gauge in the same CR image. This incident drove
redesign of the USAF jitter target to a thin lead foil strip that extended the entire length of the
“slow” scan or long direction of the CRPCS. This design allows for the evaluation of jitter along
the entire length of the image, in case it only occurs locally, and will be more visually obvious on
the thin lead foil material. Unfortunately, the thin lead foil strip with straight edges could not be
consistently produced. As a result, the final design of the jitter target uses the original material,
width and thickness of the ASTM E2445 brass T-target, but is modified to extend the entire
length of the CRPCS (Figure 3). To optimally view the instance of jitter observed during field
evaluations, the jitter target was magnified such that the jitter target width on the viewing
monitor measured 0.5 inch. (Note: Since the various manufacturers’ systems did not produce
the same size image for a given magnification value, the target width during viewing was
standardized, and the corresponding magnification was determined for each manufacturer and
stated in the final procedures.)
Figure 8. Computed radiography image of jitter observed on T-target (highlighted with yellow
outlines) during field evaluations
15
Figure 9. Computed radiography image of jitter (highlighted with yellow outlines) observed on
foil line pair gauge during field evaluations
Evaluation procedure: ASTM E2445 requires evaluating the edge of the T-target at 10X
magnification for undershoot or overshoot of the scan lines at the light to dark transitions. The
USAF procedure is similar; however, because of differences between manufacturer’s system
specific software tools, the magnification is specified for each manufacturer’s system.
Acceptance criteria: ASTM and USAF use the similar acceptance criteria which state
that target edges should be straight and continuous, and “stair-stepping” is an acceptable artifact
of digitization (e.g., pixilation). The USAF procedure is slightly more specific, explaining that
jagged or saw-toothed edges along the jitter target are not acceptable and may occur at one or
more locations (Figure 10).
(a) (b) (c)
Figure 10. Example images of (a) simulated jitter as shown in T.O. 33B-1-2, visible as jagged
edges along light-to-dark transition regions, (b) jitter shown from an actual CR image of the jitter
target, and (c) acceptable “stair-stepping” caused by slight misalignment of test target versus
pixels. (“Stair-stepping” is more noticeable at very high magnifications.)
16
4.5 Scan Line Integrity (ASTM E2445, para. 6.2.2)
Purpose: The scan line integrity test evaluates the image to determine if lines of data in
the image, as scanned by the laser, are uniformly spaced.
Typical causes for loss of performance: Slippage, laser related issues.
Test target: ASTM E2445 does not specify a separate target for scan line integrity. The
USAF CRPCS does not contain a target for scan line integrity.
Evaluation procedure: ASTM E2445 discusses scan line integrity in the same section as
laser jitter. In addition to the jitter evaluation, ASTM requires viewing image scan lines in
“various areas” at 10X or greater to determine if they are uniformly spaced. However, no
examples of scan line integrity anomalies could be provided by any of the CR manufacturers,
and no reports of this issue were found within the USAF. Without a real example of the
anomaly, it was assumed that scan line integrity would be identified by the jitter and/or slippage
tests. Depending on the source of the scan line integrity issue, if scan lines are not uniformly
spaced, the edge of the jitter target should appear discontinuous, and the overall length of the
image in the feed direction may be longer. As a result, the USAF procedure does not require a
separate test for scan line integrity.
Acceptance criteria: ASTM E2445 requires “uniform spacing of scan lines.” The USAF
procedure does not contain acceptance criteria as no specific test is required.
17
4.6 Scan Line Dropout (ASTM E2445, para. 6.2.2)
Purpose: The scan line dropout test evaluates the image for lucent or bright white
straight lines oriented in the long or “slow scan” direction.
Typical causes for loss of performance: Dust and dirt particles on the pickup light guide
or internal obstruction in path of laser
Test target: Neither ASTM or USAF require a test target.
Evaluation procedure: ASTM E2445 and the USAF procedure require visual evaluation
of the “open field” of the test standard (ASTM Phantom or USAF CRPCS) CR image for a
lucent or bright white straight line (Figure 11). Examples of scan line dropout were seen during
the USAF field evaluations. The USAF procedure specifies that the line will be oriented in the
long or “slow scan” direction of the image.
Figure 11. Simulated CR image of scan line dropout on USAF CRPCS (highlighted by arrows).
Acceptance criteria: ASTM E2445 does not specifically call out acceptance criteria. The
USAF procedure states no visible scan line dropout is permitted.
2 4
1 3
AB
18
4.7 Afterglow a.k.a. Blooming or Flare (ASTM E2445, para. 6.2.3)
Purpose: The afterglow test evaluates the CR image for evidence of overshoot4 or
streaking in areas with high density contrast. Overshoot or streaking appears as a dark shadow
of a high density target immediately adjacent to the target (Figure 12).
Typical causes of loss of parameter: Saturation of the light detector or intensity transfer
(i.e., phosphors on imaging plate are still emitting energy from previous sweep of laser and affect
scanner readout of adjacent phosphors).
Test target: ASTM E2445 utilizes a brass T-target (Figure 1). Only the ends of the short
leg of the T-target are used for this test. The long leg of the T-target is used for the jitter test.
Since the USAF CRPCS changed the jitter test target, the original T-target was no longer
necessary. For the afterglow test, the USAF CRPCS uses a target that is similar in orientation
and design to the short leg of the ASTM T-target only (Figure 3).
Evaluation procedure: ASTM E2445 requires evaluating the CR image of the T-target
for evidence of overshoot or streaking in areas with high density contrast. Since the laser rasters
in the short direction of the image, this phenomenon would be seen at the ends of the short legs
of the T-target where the light-to-dark (high density-to-low density) transition is in the same
direction as the laser movement (Figure 12). ASTM provides somewhat vague guidance by
stating the test shall be performed by comparing an exposure with low exposure intensity (high
readout gain) and high exposure intensity (low readout gain) but with no saturation of the
electronic system. According to the CR manufacturers, afterglow only occurs when exposure
parameters are chosen incorrectly and result in high exposure intensity. The only examples of
afterglow demonstrated by the USAF occurred during laboratory tests, where the time between
imaging plate exposure and processing exceeded 48 hours. Based on this information, it was
determined that one exposure intensity would suffice, as long as the evaluation was performed in
an area of the standard with high density contrast. This approach is also favorable because it
reduces the exposures and number of tests for the operator. As a result, the USAF procedure
requires only one exposure intensity, calls out a specific magnification for each manufacturer’s
system software to maximize the area of interest on the viewing monitor, and is performed on the
USAF design of the afterglow target.
19
Figure 12. Computed radiography image of afterglow at short edge of T-target, (highlighted by
yellow outline). Some shading is also evident in this image in the vertical direction.
Acceptance criteria: ASTM does not specify acceptance criteria. The USAF procedure
does not allow visible afterglow.
20
4.8 Slippage (ASTM E2445, para. 6.2.4)
Purpose: The slippage test evaluates the CR image for fluctuation of intensity of
horizontal image lines.
Typical causes for loss of performance: Problems with CR transport through reader, such
as slippage of the imaging plate, typically on the scanner’s internal rollers. Not all
manufacturers’ scanner designs are susceptible to slippage.
Test target: ASTM E2445 utilizes a homogeneous strip (Figure 1). The USAF CRPCS
does not require a specific slippage test target.
Evaluation procedure: ASTM E2445 requires evaluating a target, such as the
homogeneous strip, for deviations between line intensities. Although a method is not specified,
this can be performed using the line profile software available on all manufacturers’ systems.
During the USAF field evaluations, a real incident of slippage occurred and was visually obvious
as striping oriented in the short or “fast scan” direction (Figure 13). The slippage issue was
corrected by replacing an internal roller in the scanner which fed the imaging plates through the
device.
Although it was demonstrated that software tools would identify this type of slippage per
ASTM E2445 acceptance criteria (Figure 14), it was evident the geometric distortion test would
also identify this phenomenon. Although somewhat redundant to the geometric distortion test,
the decision was made to keep a separate slippage test, since it was simple and effective. This
test requires performing a visual evaluation in the open field for light or dark “stripes” or
“bands” oriented in the short dimension of the CR image.
21
Figure 13. Computed radiography image of slippage observed during field evaluations.
Figure 14. Line profile data across slippage indication shown in Figure 13.
Acceptance criteria: ASTM E2445 specifies the deviation between line intensities shall
be less than or equal to the noise. The USAF procedure does not allow visible indications of
slippage.
22
4.9 Shading (ASTM E2445, para. 6.2.5)
Purpose: The shading test evaluates the image for non-uniform intensity across the
scanning width, typically identified as “bands” of shading in the “feed” direction (Figure 15).
Figure 15. Simulated CR image showing vertical banding or “shading.”
Typical causes for loss of performance: Improper image calibration file, scanning laser
intensity variations, or improper alignment of the light guide and photo-multiplier tube.
Test target: ASTM E2445 utilizes a set of three holes (identified as EL, EC, and ER in
figure 1 of ASTM E2445), each 0.75 in dia. x 0.1 in deep, spaced at 3.93 in. (Figure 1). The
USAF CRPCS does not contain a target for shading.
Evaluation procedure: ASTM E2445 measures the pixel values of the holes as a gray
value using measurement software specific to each manufacturer’s system. The USAF
procedure is a visual evaluation of “open areas” of the CRPCS image for visible shading.
Acceptance criteria: ASTM requires the pixel value of the outside circles (EL and ER –
Figure 1) to be within +/-15 percent of the pixel value of the center circle (EC). During RXSA
laboratory evaluations of the ASTM tests, actual cases of shading were created inadvertently
during fading tests and during the evaluation of the alignment tool known as the BAM snail
(BAM stands for Bundesanstalt für Materialforschung und –prüfung, the German Institute for
Materials and Testing). It was demonstrated that shading variations of 10 percent or more were
visually obvious. In addition, it was demonstrated that shading in excess of 15 percent could
occur in areas not measured by the test targets (holes) and, therefore, pass the ASTM acceptance
criteria. As a result, the USAF acceptance criteria require evaluation of all open areas and do not
allow any shading that can be identified visually.
23
4.10 Erasure (ASTM E2445, para. 6.2.6)
Purpose: The erasure test evaluates the system’s ability to completely erase the imaging
plate.
Typical causes for loss of performance: Inadequate erasure light intensity and/or erasure
time.
Test target: Neither ASTM or the USAF require a test target.
Evaluation procedure: Both ASTM and USAF procedures require capturing an image on
an imaging plate, erasing the imaging plate, processing the erased plate through the CR system,
and then evaluating the image to determine the maximum intensity in the image. ASTM does
not specify how to make this determination. The USAF procedure uses a histogram software
tool to determine the maximum pixel intensity over the entire image.
Acceptance criteria: ASTM E2445 and the USAF procedures do not allow a latent image
after the imaging plate has been erased. ASTM requires the maximum intensity of the latent
image to be less than one percent of the maximum intensity. The USAF criteria is similar,
except that it calls out specific pixel values for each manufacturer’s system (Appendix A)
because some systems were demonstrated to have slightly more than one percent latent image
intensity even when functioning properly.
24
4.11 IP Artifacts (ASTM E2445, para 6.2.7)
Purpose: The IP artifact test evaluates the CR image for non-relevant indications
inherent to the imaging plate.
Typical causes for loss of performance: Improper handling and storage of IPs.
Test target: Neither ASTM or the USAF require a test target.
Evaluation procedure: Both ASTM E2445 and USAF procedures require exposing a
blank IP, processing the image, and storing the image. More than one IP can be exposed
simultaneously to save time, so tests were run by the USAF to establish exposure parameter
guidelines for multiple IP exposures. The tests were run by placing a series of IPs in a pattern
such that one IP was in the center of the X-ray beam, and additional IPs were laid in both the
X- and Y-axis extending from the center IP (Figure 16). A test exposure was taken at a distance
of 15 feet, the maximum practical distance for most USAF NDI facilities. The resultant images
were evaluated to confirm the maximum intensity on any IP was below saturation and did not
vary by more than 10 percent over an individual IP image. The first image to exhibit a larger
variation than 10 percent was considered an unacceptable exposure for the artifact test. Using
this process, the “radiation cone” was defined for a typical Lorad X-ray tube used by the USAF
(Figure 17). A test on a single IP was also performed to determine exposure parameters to avoid
saturation. Using the data obtained in these tests, standard radiography calculations were
performed to determine exposure parameters depending on how many IPs were to be exposed
(Table 2).
Figure 16. Layout pattern used to approximate number of IPs that can be evaluated for IP
artifacts in one exposure. Each rectangle represents one 11 inch x 14 inch IP.
25
Figure 17. Computed Radiography images of horizontal row of IPs showing effective cone of
radiation. Image highlighted on far right is unacceptable because of the large variation of image
intensity.
Acceptance criteria: ASTM E2445 does not define acceptance criteria for IP artifacts.
The USAF acceptance criteria simply state that artifacts are not permitted in regions that affect
image interpretation. This allows the user to use a damaged IP if the damage is restricted to a
portion of the IP that does not contain critical image information, and permits the user to cut the
IP to remove the damaged regions, assuming the user’s CR reader has the capability to process
“cut” IPs.
26
4.12 Signal-to-Noise Ratio (SNR) (ASTM E2445, para 6.2.8)
Purpose: Signal-to-noise ratio (SNR) compares the level of a desired signal to the level
of background noise. The higher the ratio, the less obtrusive the background noise.
Typical causes for loss of performance: Incorrect kV, excessive scatter, improper dose,
erroneous detector response.
Test target: No test target is required.
Evaluation procedure: The ASTM E2445 procedure is complex and entails taking
intensity measurements over a specific area of an exposed imaging plate, and calculating the
quotient of the mean value of the linearized signal intensity and standard deviation of the noise
(ref 5). In practice, the CR equipment manufacturer provides software for the SNR
measurement. However, since some earlier CR systems do not include software for this
measurement, and the contrast sensitivity test provides a direct measure of system SNR, the
USAF procedure does not include this additional evaluation.
Acceptance criteria: ASTM E2445 criteria are provided by the CR manufacturer. The
USAF does not require this test.
27
5. ADDITIONAL TESTS
5.1 BAM-Snail
Purpose: Although not a “test” in ASTM E2445, the BAM snail is included in the ASTM
E2445 CR phantom (Figure 1) to ensure shot alignment.
Typical causes for loss of performance: Misalignment of X-ray tube with area of interest,
misalignment of X-ray tube window.
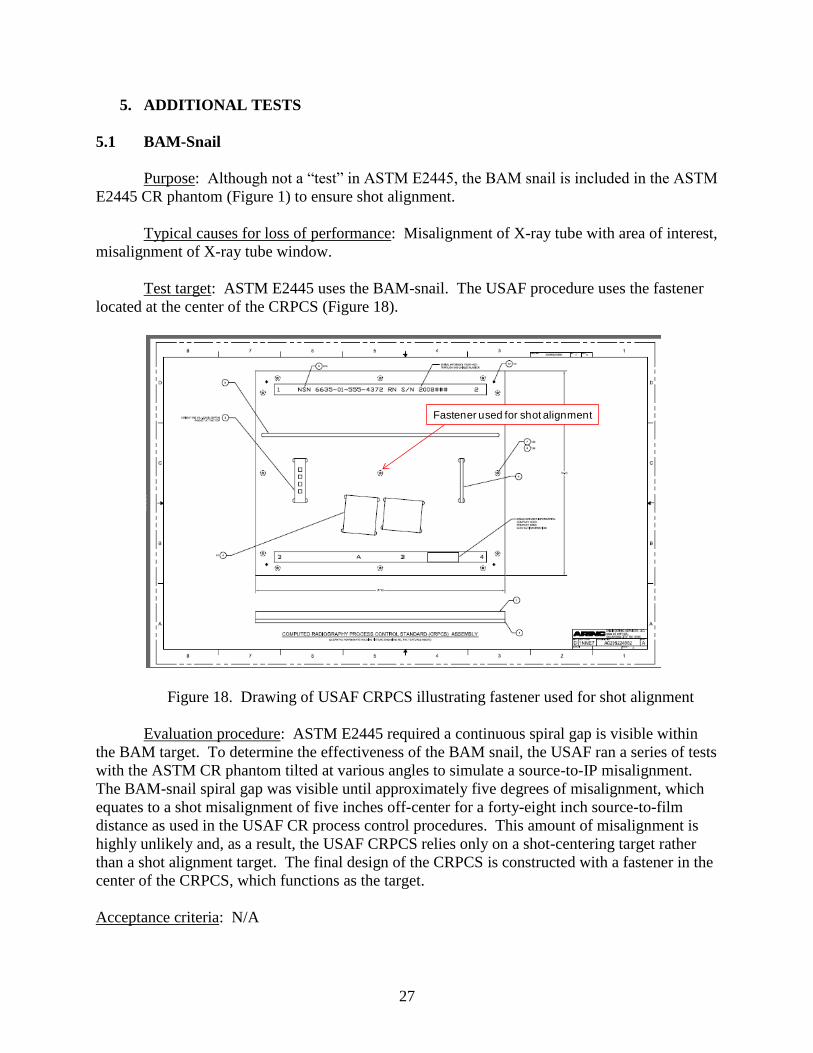
Test target: ASTM E2445 uses the BAM-snail. The USAF procedure uses the fastener
located at the center of the CRPCS (Figure 18).
Figure 18. Drawing of USAF CRPCS illustrating fastener used for shot alignment
Evaluation procedure: ASTM E2445 required a continuous spiral gap is visible within
the BAM target. To determine the effectiveness of the BAM snail, the USAF ran a series of tests
with the ASTM CR phantom tilted at various angles to simulate a source-to-IP misalignment.
The BAM-snail spiral gap was visible until approximately five degrees of misalignment, which
equates to a shot misalignment of five inches off-center for a forty-eight inch source-to-film
distance as used in the USAF CR process control procedures. This amount of misalignment is
highly unlikely and, as a result, the USAF CRPCS relies only on a shot-centering target rather
than a shot alignment target. The final design of the CRPCS is constructed with a fastener in the
center of the CRPCS, which functions as the target.
Acceptance criteria: N/A
Fastener used for shot alignment
28
5.2 IP Fading
Purpose: Although not a recurring test in ASTM E2445, fading is addressed in ASTM
E2445 as an issue to consider. Fading is the loss of stored energy in an exposed IP over time.
Typical causes for loss of performance: Excessive wait time between exposure of an IP
and processing.
Test target: ASTM E2445 uses a blank IP. The USAF evaluates this parameter using the
CRPCS contrast sensitivity and spatial resolution targets.
Evaluation procedure: ASTM E2445 exposes an IP using typical exposure conditions
and requires the image intensity between 70 and 90 percent of the maximum possible intensity.
Time between exposure and readout is varied from five minutes to four days or as required.
Intensity data are plotted and evaluated and results are used to determine if fading needs to be
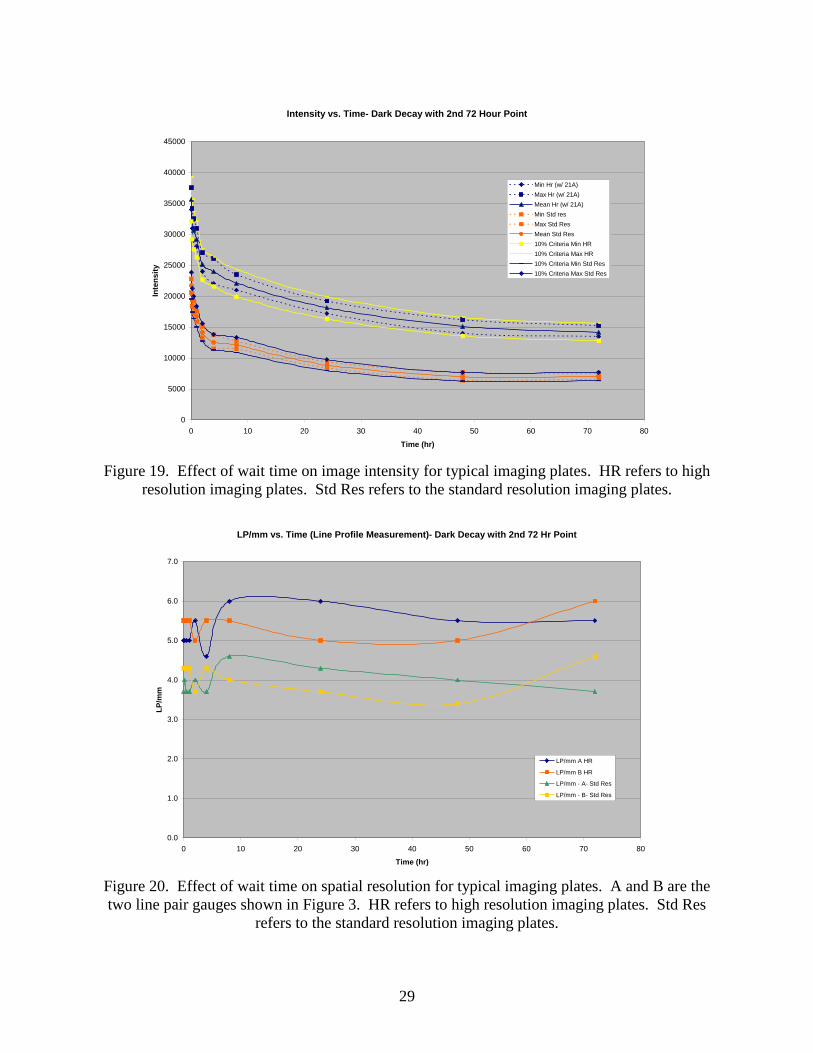
considered for specific applications. The USAF conducted a series of tests to evaluate the effect
of wait time on the CR image of the USAF CRPCS. These tests were conducted by measuring
the image background intensity (with no targets), as well as by evaluating the contrast sensitivity
and spatial resolution over time. Wait times varied from near-zero (10 seconds) to 72 hours.
The results indicated that, in general, intensity values decreased with wait time, but contrast
sensitivity and spatial resolution remained fairly constant. Figures 19, 20, and 21 plot the image
intensity, spatial resolution, and contrast sensitivity results, respectively. Although effects on
contrast sensitivity and spatial resolution were not significant, discussions with CR
manufacturers concluded that maximum wait times must be imposed during standard inspection
operations, as some IPs will exhibit a drastic drop off in intensity in the first few minutes (as
verified by these tests). As a result, the USAF CR process control procedures require all process
control tests be processed within 60 minutes from exposure to ensure repeatable data.
29
Figure 19. Effect of wait time on image intensity for typical imaging plates. HR refers to high
resolution imaging plates. Std Res refers to the standard resolution imaging plates.
Figure 20. Effect of wait time on spatial resolution for typical imaging plates. A and B are the
two line pair gauges shown in Figure 3. HR refers to high resolution imaging plates. Std Res
refers to the standard resolution imaging plates.
Intensity vs. Time- Dark Decay with 2nd 72 Hour Point
0
5000
10000
15000
20000
25000
30000
35000
40000
45000
0 10 20 30 40 50 60 70 80
Time (hr)
Inte
nsit
y
Min Hr (w/ 21A)
Max Hr (w/ 21A)
Mean Hr (w/ 21A)
Min Std res
Max Std Res
Mean Std Res
10% Criteria Min HR
10% Criteria Max HR
10% Criteria Min Std Res
10% Criteria Max Std Res
LP/mm vs. Time (Line Profile Measurement)- Dark Decay with 2nd 72 Hr Point
0.0
1.0
2.0
3.0
4.0
5.0
6.0
7.0
0 10 20 30 40 50 60 70 80
Time (hr)
LP
/mm
LP/mm A HR
LP/mm B HR
LP/mm - A- Std Res
LP/mm - B- Std Res
30
Figure 21. Effect of wait time on contrast sensitivity for typical imaging plates. B represents the
intensity measurement on the contrast gauge between steps. C represents the intensity
measurement on the two percent step.
Acceptance criteria: N/A
Percent Delta B vs C with Respect to Time
0.00%
0.50%
1.00%
1.50%
2.00%
2.50%
0 10 20 30 40 50 60 70 80
Time (hr)
% d
elt
a B
vs C
percent delta B vs C for HR
percent delta B vs C for Std Res
31
6. CONCLUSIONS
The USAF CR process control tests have captured all relevant ASTM E2445 tests to
ensure CR system performance stability for USAF inspection applications. Laboratory
and field testing have ensured the test targets and procedures perform the necessary
functions and have been validated and verified.
The following summarizes the USAF CR process control tests and the related ASTM
E2445 reference paragraph:
ASTM E2445 para.# USAF Process Control Test
6.1.1 Contrast sensitivity
6.1.2/3 Spatial resolution and unsharpness
6.2.1 Geometric distortion
6.2.2 Laser beam function - laser jitter, scan line integrity, and scan line
dropout – required for laser jitter and scan line dropout only. Not
required for scan line integrity.
6.2.3 Blooming or flare (referred to as “afterglow”)
6.2.4 Slippage
6.2.5 Shading
6.2.6 Erasure
6.2.7 IP artifacts - optional
6.2.8 Signal-to-Noise Ratio (SNR) – not required
The CRPCS was designed with cost as a primary driver. Materials and test targets were
selected such that cost for the CRPCS standard was kept below $2500.
Computed radiography systems will continue to evolve, both in capability and
mechanical design. As a result, the types of tests and/or test criteria may need to be
revised as technology matures.
32
7. RECOMMENDATIONS
The USAF CRPCS and associated procedures (Appendix A) should be incorporated into
the USAF T.O. 33B-1-2, WP 106 01, WORK PACKAGE, TECHNICAL PROCEDURE,
COMPUTED RADIOGRAPHY PROCESS CONTROL.
As new CR equipment or systems are introduced to the USAF, the USAF CR process
controls must be reviewed and updated as necessary.
The USAF should remain engaged with ASTM to ensure USAF CR procedures remain
current with ASTM CR related documents.
Additional T.O. 33B-1-2 guidance needs to be developed to address monitor process
control; IP cleaning, handling, and storage; and general equivalency guidelines for converting
film techniques to CR techniques.
Future testing is recommended to evaluate the performance of CR for welder
certification, crack detection, and acceptance inspections of aerospace castings.
33
8. REFERENCES
1. ASTM E2007-00 “Standard Guide for Computed Radiology” (Tutorial)
2. ASTM E2033-99 “Standard Practice for Computed Radiology”
3. ASTM E2339-04 “Standard Practice for Digital Imaging and Communication in NDE
(DICONDE)”
4. ASTM E2445-05 “Standard Practice for Qualification and Long Term Stability of CR
Systems”
5. ASTM E2446 -05“Standard Practice for Classification of Computed Radiology
Systems”
6. Mr. Sam Bullard, NAVAIR, NATEC NDI Specialist
34
APPENDIX Draft TO 33B1-2 CR Process Control Section
T. O. 33B-1-2 WP 106 01
WORK PACKAGE
TECHNICAL PROCEDURE
COMPUTED RADIOGRAPHY PROCESS CONTROL
EFFECTIVITY: ALL WEAPONS SYSTEMS AND SUPPORT EQUIPMENT
35
REFERENCE MATERIAL REQUIRED Title Number Nondestructive Inspection Methods, Basic Theory T.O. 33B-1-1 Air Force Consolidated Occupational Safety Standard AFOSH 91-501 (Air
Force Only)Nondestructive Inspection General Procedures And Process Controls T.O. 33B-1-2 Radiography, General Procedure WP 106 00
36
APPLICABLE TIME COMPLIANCE TECHNICAL ORDERS None
CONSUMABLE MATERIALS
None
37
EXPENDABLE ITEMS None
APPLICABLE SUPPORT EQUIPMENT Paragraph Function – Tool Nomenclature Tool Number
Computed Radiography Reader Computed Radiography Eraser (if not integral to Reader) Computed Radiography Imaging Plates Computed Radiography Workstation USAF Computed Radiography Process Control Standard
ILLUSTRATED SUPPORT EQUIPMENT
Figure A-1. USAF Computed Radiography (CR) Process Control Standard (PCS)
38
1. Introduction.
a. General Description. 1. Like traditional film radiography, the entire computed radiography (CR) process
must be closely controlled with process control tests to produce expected results. In the case of CR, the primary concerns are: 1) operating performance of the CR system, which includes the imaging plate (IP) reader, eraser, and monitor, and 2) degradation of the IPs.
2. Most of the process control tests require some type of test target to establish an initial level of performance which is then used as a baseline measurement so that subsequent tests can identify performance degradation. Test targets are provided in the USAF Process Control Standard (PCS) as illustrated in Figure A-1. Good record keeping of process controls is also important in maintaining reliability.
NOTE:
All CR system manufacturers’ recommended Preventative Maintenance, Quality Assurance, and Testing shall be followed in addition to this document’s requirements.
Weapon system specific process control documents shall take precedence over this
document. b. General Requirements.
1. The CR Process Control tests are split into two types: 1) System tests and 2) IP tests. See table A-1 for a summary of the tests.
2. The System tests consist of two exposures of the CR process control standard followed by a series of tests which evaluate the CR images, both visually and with software tools. (In some instances, all tests can be performed with one exposure.)
i. System tests are laid out with an initial test setup/data capture procedure that applies to all tests, followed by individual evaluation procedures so that any one test can be performed individually if necessary.
ii. System specific software procedures are detailed for each manufacturer’s system (i.e. Fuji, GE, and VMI) CR systems in appendices. If procedures for a manufacturer’s latest software are not listed in an appendix, consult with the manufacturer for guidance.
3. The IP tests evaluate the IPs only, by providing a method to document IP artifacts which may be useful for determining if a CR image contains non-relevant indications. IP tests are optional and are discussed in Appendix AD.
4. Serialization of Imaging Plates. i. All IPs and cassettes in inventory should be serialized. Consult the
system manufacturer or representative for means of serializing as a first choice.
ii. Recommended marking methods include notation along the edge of the unexposed side of the IP and the backside of cassettes using a permanent marker. Recommended serialization format is “BASE-CR MFG-0001” (i.e. WHITEMAN-FUJI-0001; SEYMOUR-VMI-0001).
NOTE:
IPs used for crack detection shall be tracked separately from other IPs due to different test interval requirements.
39
Table A-1. Summary of CR Process Control Tests
NOTE: Exposure Parameters are guidelines and may be adjusted as necessary. Actual values used shall be documented
and subsequent tests shall use the same values.
2. Procedures.
a. System Tests – To be performed on any one IP and cassette in order to baseline the CR
system, then again at 90 day intervals (or prior to use if CR system is not used for over 90 days), and after any CR system component is replaced, repaired, or serviced.
NOTE:
The time elapsed between exposure and processing of the IP for process control tests shall be less than 60 minutes to ensure repeatable data.
1. Initial Test Setup/Data Capture Procedure for System Tests:
a. Record the date of the test, and model and serial number(s) of CR reader and CR eraser if applicable.
b. Select a 14in x 17in IP and cassette. (Any IP can be used, but it is recommended that a high resolution IP be used.) Record model and serial number of the IP, and the hard or soft cassette.
NOTE:
If a baseline process control test was performed previously on this CR system, use the same type of IP and cassette for this testing.
c. Record the model and serial number of the PCS. The PCS shall be centered on
a 14 in x 17 in IP, and oriented such that it covers the entire IP. A minimum of 1/8 inch thick back screen of lead is required for all exposures.
IP 25 1.5A 20A 48A IP Artifacts n/a - Blank IP n/a
50
Process Control Evaluation
Image/Target Evaluated Acceptance Criteria
A) If exposing multiple IPs, exposure parameters are listed in Appendix D
System
Test Type
20 483
Exposure Parameters
AD
40
d. Expose the PCS to X-rays. Recommended test parameters: 50kV, 3mA, 20 second exposure, 48 inches source-to-IP distance. Record all exposure parameters.
NOTE:
If a baseline process control test was performed previously on this CR system, use the same test parameters so that test results can be compared to identify
changes in system performance. e. Select the CR reader settings (i.e. sensitivity, pixel pitch, speed, etc.), per the
appropriate system specific appendix, and record.
NOTE: If a baseline process control test was performed previously on this CR system,
use the same CR reader settings.
f. Scan the IP and display the CR image on the viewing monitor. g. Archive the raw CR image. Record image file name.
NOTE:
The following evaluation procedures assume the operator has had adequate training on their specific CR software to be able to perform common post-processing functions such
as image optimization using contrast/brightness or equivalent, and magnification. Additional software functions that may not be used often by the operator are referred to as
“special” software tools, and guidance is provided in the appropriate system specific appendices where necessary.
NOTE:
Evaluation of all images shall be performed using the raw data (no software filters).
2. System Test Evaluations a. Geometric Distortion: Evaluation of image for overall distortion using special
software measurement tools. i. Procedure.
1. Adjust the magnification, if necessary, so that the CR image of the entire PCS fits within the viewable area of the viewing monitor and all geometric distortion markers in the PCS are visible. See Figure A-2.
41
Figure A-2. Simulated CR image of PCS for geometric distortion evaluation, magnified to fill viewing area of viewing monitor. Note that the four geometric distortion markers, identified by the white arrows, are visible in the image.
2. Using the CR image processing software, calibrate the software
measurement tool on the known distance (12.5 inches) between two of the geometric distortion markers across the short direction of the IP (markers 1-3 or 2-4). See Appendices for system specific software procedures.
3. Measure the distance between the geometric distortion markers along one long side and one diagonal on the CR image. See Table A-2 for markers to be measured. See Appendices for system specific software procedures.
ii. Acceptance Criteria/Corrective Action. Acceptance criteria are listed in table A-2. Measurements outside of the acceptance criteria are an indication of geometric distortion that shall be evaluated and corrective action taken before further use. Possible causes include a CR transport system problem (feed direction) or a laser beam modulation or timing error (laser scan direction).
iii. Documentation. Document pass/fail of the test and any corrective actions
taken IAW T.O. 33B-1-1. b. Slippage, Scan Line Dropout, Shading and Afterglow: A visual evaluation of the
CR image for multiple irregularities. i. Procedure.
long 1-2 (or 3-4) 15.5+/-0.25
diagonal 1-4 (or 2-3) 19.9+/-0.25
measurement direction markers
acceptance criteria
42
1. Adjust the magnification, if necessary, so that the CR image of the entire process control standard fits within the viewable area of the viewing monitor.
2. Visually evaluate the image for linear “striping” or “banding” in the short and/or long directions of the CR image. Contrast and brightness, or equivalent, shall be adjusted during this evaluation to optimize image. See figure A-3 for examples and descriptions of each irregularity.
a) Slippage b) Scan line dropout
c) Shading d) Afterglow (magnified image)
Figure A-3. Simulated CR images illustrating various irregularities. a) Slippage indications (e.g. indications highlighted by white outline) are evident as a light or dark “stripes” or “bands” oriented in the short dimension of the CR image. Slippage can occur in more than one location in the image, and may occur as wide or narrow indications depending on the amount of slip. Not all CR readers are susceptible to slip. b) Scan line dropout (e.g. white line on left side of image highlighted with two arrows) is evident as a bright white line spanning the entire long dimension of the CR image. Scan line dropout can occur in multiple places within the same image and may occur as wide or narrow indications. c) Shading is evident as light and dark “bands” oriented in the long direction of the CR image. d) Afterglow is evident as “streaking” or “overshoot” at light to dark transition regions in the short dimension of the IP and is most noticeable at the edges of the afterglow target.
43
ii. Acceptance Criteria/Corrective Action.
1. If any of the irregularities discussed in figure A-3 are visible, the CR system shall be evaluated and corrective action taken before further use.
a. Slippage indications are typically caused by a problem with IP transport through the CR reader and can distort the dimensions of the CR image.
b. Scan line dropout is often an indication of dirt or particles in the CR reader optics or obstructions in the path of the laser within the CR reader, and can obscure relevant indications.
c. Shading is an indication of scanning laser intensity variations and/or improper alignment of the light guide/photo-multiplier tube, creating excessive background noise that affects proper interpretation of the CR image. In some cases, scanner calibration will resolve the issue.
d. Afterglow is caused by IP phosphors which are continuing to emit energy after they are read, affecting the intensity of adjacent phosphors and affecting proper interpretation of the CR image. Often, afterglow can be corrected with filtration at the x-ray tube port.
iii. Documentation. Document pass/fail of each test and any corrective
actions taken IAW T.O. 33B-1-1.
c. Laser Beam Jitter Evaluation: Visually evaluate image of jitter target for straight
and continuous edges. i. Procedure.
1. Adjust the magnification per the appropriate System Specific Appendix. See Figure A-4.
(a) (b)
Figure A-4. a) Simulated CR image of PCS with portion of jitter target highlighted by white dashed outline. b) Magnified image of jitter target.
2. Visually evaluate the edges of the entire length of the jitter target in the CR image. Contrast and brightness, or equivalent, may be adjusted during this evaluation. Edges should appear straight and continuous. See figure A-5.
44
(a) (b)
Figure A-5. Sample image of (a) jitter visible as jagged edges along light-to-dark transition regions, and (b) acceptable “stair-stepping” caused by slight misalignment of test target vs pixels. (“stair-stepping” is more noticeable at very high magnifications.)
ii. Acceptance Criteria/Corrective Action. Jagged or saw-toothed edges
along the jitter target (see figure A-5a), which may occur at one or more locations, are indications of laser jitter often caused by a timing error or laser beam modulation problem which shall be evaluated and corrective action taken before further use.
iii. Documentation. Document pass/fail of the test and any corrective actions taken IAW T.O. 33B-1-1.
d. Spatial Resolution Evaluation: Visually evaluate image for ability to resolve small
details or features. i. Procedure.
1. Adjust the magnification so that the CR image of one line pair gauge fills the viewable area of the viewing monitor. See Figure A-6.
NOTE:
During evaluation of the CR image of the line pair gauges, the operator shall be positioned 12-18 inches from the viewing monitor.
45
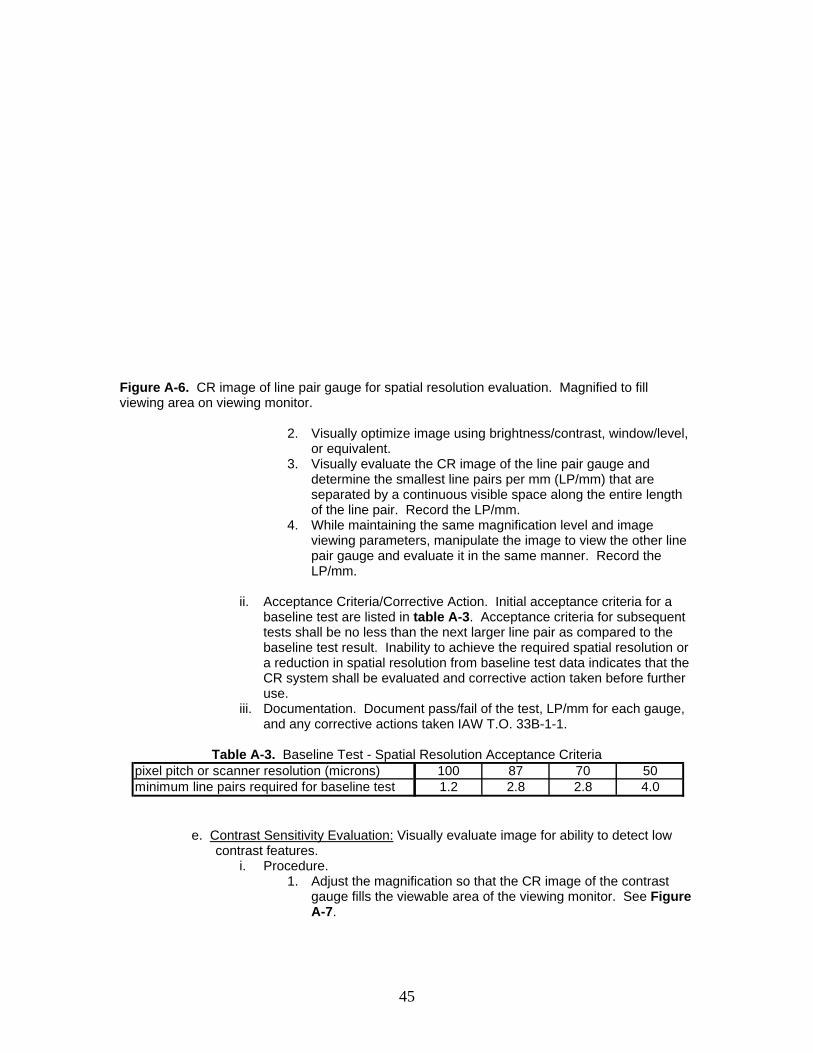
Figure A-6. CR image of line pair gauge for spatial resolution evaluation. Magnified to fill viewing area on viewing monitor.
2. Visually optimize image using brightness/contrast, window/level,
or equivalent. 3. Visually evaluate the CR image of the line pair gauge and
determine the smallest line pairs per mm (LP/mm) that are separated by a continuous visible space along the entire length of the line pair. Record the LP/mm.
4. While maintaining the same magnification level and image viewing parameters, manipulate the image to view the other line pair gauge and evaluate it in the same manner. Record the LP/mm.
ii. Acceptance Criteria/Corrective Action. Initial acceptance criteria for a
baseline test are listed in table A-3. Acceptance criteria for subsequent tests shall be no less than the next larger line pair as compared to the baseline test result. Inability to achieve the required spatial resolution or a reduction in spatial resolution from baseline test data indicates that the CR system shall be evaluated and corrective action taken before further use.
iii. Documentation. Document pass/fail of the test, LP/mm for each gauge, and any corrective actions taken IAW T.O. 33B-1-1.
Table A-3. Baseline Test - Spatial Resolution Acceptance Criteria
e. Contrast Sensitivity Evaluation: Visually evaluate image for ability to detect low contrast features.
i. Procedure. 1. Adjust the magnification so that the CR image of the contrast
gauge fills the viewable area of the viewing monitor. See Figure A-7.
pixel pitch or scanner resolution (microns) 100 87 70 50minimum line pairs required for baseline test 1.2 2.8 2.8 4.0
46
Figure A-7. CR image of contrast sensitivity gauge for contrast sensitivity evaluation. Magnified to fill viewing area on viewing monitor. 2% step highlighted with white arrow.
2. Visually optimize image using brightness/contrast, window/level,
or equivalent. 3. Visually evaluate the CR image of the contrast gauge and record
the number of steps that can be visually identified.
NOTE: If the steps in the contrast gauge are not visible, in the baseline test, it may be necessary to repeat the exposure for this test with different exposure parameters and record the parameters specifically for this
test. Recommended “alternate” exposure parameters for the contrast gauge are 60kV, 5mA, 36sec, at 48 inches.
ii. Acceptance Criteria/Corrective Action. Three steps must be visually
identified on the contrast sensitivity gauge, which equates to 2% contrast sensitivity. Inability to achieve the required contrast sensitivity or a reduction in contrast sensitivity from the baseline test data indicates that the CR system shall be evaluated and corrective action taken before further use.
iii. Documentation. Document pass/fail of the test and any corrective actions taken IAW T.O. 33B-1-1.
f. Latent Image Evaluation: Evaluate image for proper erasure using special software tools.
i. Procedure. 1. Erase the IP by processing it through the CR eraser.
NOTE:
Some CR systems automatically erase the IP after reading. If so, the erasure step is not required.
2. Scan the erased IP and display the CR image on the monitor. 3. Evaluate the CR image of the erased IP by measuring the pixel
digital value and/or intensity over the entire image using the imaging software tools. See Appendices for system specific software procedures.
47
ii. Acceptance Criteria/Corrective Action. If the maximum intensity is greater than the value specified, the CR eraser shall be evaluated and corrective action taken before further use.
iii. Documentation. Document pass/fail of the test and any corrective actions taken IAW T.O. 33B-1-1.
48
APPENDIX AA – System Specific Software Procedures (Fuji VF-C1 version V1.0)
Initial Test Setup/Data Capture Procedure for System Tests:
Use predefined CR reader settings AVE 2.0. Select MENU TEST AVE 2.0 1) Geometric Distortion Evaluation: Evaluates image for overall distortion using special software measurement tools.
a. Measurement Calibration i. Select “Length” tool ii. Place cursor on one linear distortion marker, left click and release. Place cursor
on marker on opposite corner of short side of CR image, left click and release. iii. Right-click on measurement line and select “scale setup”. iv. Enter known value for distance (12.5 inches).
b. Measurement i. Select “Length” tool ii. Place cursor on one linear distortion marker, left click and release. Place cursor
on marker on opposite corner of long side of CR image, left click and release to obtain measurement. (measurement annotations can be removed by right clicking and selecting delete)
iii. Repeat for one diagonal measurement between linear distortion markers.
2) Slippage, Scan Line Dropout, Shading and Afterglow: Visual evaluation of the CR image for multiple irregularities. No special software tools required for evaluation. 3) Laser Beam Jitter Evaluation: Adjust the magnification to 400%. Visually evaluate image of jitter target for straight and continuous edges. No special software tools required for evaluation. 4) Spatial Resolution Evaluation: Visually evaluate image for ability to resolve small details or features. No special software tools required for evaluation. 5) Contrast Sensitivity Evaluation: Visually evaluate image for ability to detect low contrast features. No special software tools required for evaluation. 6) Latent Image Evaluation: Evaluate image for proper erasure using special software tools.
a. Measurement of the pixel digital value and/or intensity. i. Select the “statistics” tool ii. Place the cursor on one corner of the CR image of the IP, left click and release.
Place the cursor at the opposite side and corner such that the majority of the CR image of the IP is covered by the ROI, left click and release. Place the cursor on the border of the ROI, right click and select “statistics”.
iii. The maximum digital value shall be less than 40.
49
APPENDIX AB – System Specific Software Procedures (General Electric Rhythm 2.0)
Initial Test Setup/Data Capture Procedure for System Tests:
Use CR reader settings typically used with the selected IP and cassette. CR reader settings shall be recorded and include: a. Scanner resolution or pixel pitch (CR100) b. Scanner speed, i.e. M1, M2. (CR Tower) Ensure “No filter” is selected when evaluating CR image.
NOTE: DO NOT ROTATE image during evaluations. Rotating images may change magnification.
1) Geometric Distortion Evaluation: Evaluates image for overall distortion using special software measurement tools.
a. Measurement Calibration i. Select Image Annotation Create Calibrate ii. Center cursor on one linear distortion marker, left click and drag cursor to nearest
marker along short side of CR image and release mouse. iii. Enter known value for distance (12.5 in).
b. Measurement i. Select Image Annotation Create Distance ii. Center cursor on one linear distortion marker, left click and drag cursor to marker on
opposite corner of the long side of the CR image and release mouse to obtain measurement. (Measurement annotations can be removed by right-clicking on the measurement annotation and selecting “delete”.)
iii. Repeat for one diagonal measurement between linear distortion markers.
2) Slippage, Scan Line Dropout, Shading and Afterglow: Visual evaluation of the CR image for multiple irregularities. No special software tools required for evaluation. 3) Laser Beam Jitter Evaluation: Adjust the magnification to 18X (3X zoom plus magnifying glass tool at 6X). Visually evaluate image of jitter target for straight and continuous edges. No special software tools required for evaluation. 4) Spatial Resolution Evaluation: Visually evaluate image for ability to resolve small details or features. No special software tools required for evaluation. 5) Contrast Sensitivity Evaluation: Visually evaluate image for ability to detect low contrast features. No special software tools required for evaluation. 6) Latent Image Evaluation: Evaluate image for proper erasure using special software tools.
a. Measurement of the pixel digital value and/or intensity.
i. Select the Graphs tab ii. Select the Histogram ROI tool iii. Place the cursor on one corner of the CR image of the IP, left click and drag the
cursor to the opposite side and corner such that the majority of the CR image of the IP is covered by the ROI, and release the mouse.
iv. The maximum digital value, displayed in the lower left corner of the histogram, shall be less than 640.
50
APPENDIX AC – System Specific Software Procedures (VMI StarrView 6.0)
Initial Test Setup/Data Capture Procedure for System Tests:
Use CR reader settings typically used with the selected IP and cassette. CR reader settings shall be recorded and include scanner resolution or pixel pitch. Ensure “filter” selection is “none” when displaying CR image.
1) Geometric Distortion Evaluation: Evaluates image for overall distortion using special software measurement tools.
a. Measurement Calibration i. Select Tools Calibrate ii. Click “yes”, place cursor on a linear distortion marker, left click and drag to
nearest marker along short side of the CR image and release mouse. iii. Enter “12.5” as the length and click “Apply”
b. Measurement i. Select Tools Ruler ii. Center cursor on one linear distortion marker, left click and drag cursor to marker
on opposite corner of the long side of the CR image and release mouse to obtain measurement. (Measurement annotations can be removed by selecting Tools Ruler, right-clicking on the measurement annotation and selecting “delete”.)
iii. Repeat for one diagonal measurement between linear distortion markers.
2) Slippage, Scan Line Dropout, Shading and Afterglow: Visual evaluation of the CR image for multiple irregularities. No special software tools required for evaluation. 3) Laser Beam Jitter Evaluation: Adjust magnification to 3. Visually evaluate image of jitter target for straight and continuous edges. No special software tools required for evaluation. 4) Spatial Resolution Evaluation: Visually evaluate image for ability to resolve small details or features. No special software tools required for evaluation. 5) Contrast Sensitivity Evaluation: Visually evaluate image for ability to detect low contrast features. No special software tools required for evaluation. 6) Latent Image Evaluation: Evaluate image for proper erasure using special software tools.
a. Measurement of the pixel digital value and/or intensity. i. Select Graphs Tracker ii. Set radius to 5 iii. Determine max intensity by placing cursor on CR image and manually
manipulating cursor to lightest and darkest regions of image. iv. Max pixel intensity shall be less than 100.
51
APPENDIX AD – IP Tests (Artifacts) Artifacts are non-relevant indications in the CR image typically caused by scratches, chips, etc. in the IP and/or cassette. The artifact test is an optional test that evaluates the IP and cassette only. The intent of the test is to document non-relevant artifacts that appear in the CR image so that they can be discriminated from relevant indications. This may be especially useful when evaluating archived CR images. The user may choose to perform the artifact test on an “as needed” basis, or periodically to document artifacts. The test should be performed on an IP with its dedicated cassette, if applicable. Serial numbers of both the IP and cassette should be recorded along with the archived CR image and date. Procedures are presented for exposure of one IP and cassette, as well as multiple IPs and cassettes. Initial Test Setup/Data Capture Procedure for IP Tests for Artifacts:
a. Record the date of the test, and model and serial number(s) of CR reader and CR eraser if applicable.
b. Select a 14in x 17in IP and cassette. Record model and serial number of the IP, and the hard or soft cassette.
c. Expose the PCS to X-rays. A minimum of 1/8 inch thick back screen of lead is required for all exposures. Recommended test parameters: 25kV, 1.5mA, 20 second exposure, 48 inches source-to-IP distance.
i. Multiple IPs can be exposed at one time by placing the IPs side-by-side and centering the shot as shown in figure AD-1. See Table AD-1 for recommended test parameters for multiple IPs.
Figure AD-1. Layout pattern for exposing 25 IPs simultaneously for artifact test. Exposure parameters are listed in table AD-1. Circle target denotes center of shot.
14”
17”
14”
17”
14”
17”
14”
17”
14”
17”
14”
17”
14”
17”
14”
17”
14”
17”
14”
17”
14”
17”
14”
17”
14”
17”
14”
17”
14”
17”
14”
17”
14”
17”
14”
17”
14”
17”
14”
17”
14”
17”
14”
17”
14”
17”
14”
17”
14”
17”
14”
17”
14”
17”
14”
17”
14”
17”
14”
17”
14”
17”
14”
17”
14”
17”
14”
17”
14”
17”
14”
17”
14”
17”
14”
17”
14”
17”
14”
17”
14”
17”
14”
17”
14”
17”
14”
17”
14”
17”
14”
17”
14”
17”
14”
17”
14”
17”
14”
17”
14”
17”
14”
17”
14”
17”
14”
17”
14”
17”
14”
17”
14”
17”
14”
17”
14”
17”
14”
17”
14”
17”
14”
17”
14”
17”
14”
17”
14”
17”
14”
17”
14”
17”
14”
17”
14”
17”
14”
17”
14”
17”
14”
17”
14”
17”
14”
17”
14”
17”
52
Table AD-1. Process Control Test Parameters for exposure of multiple IPs for IP artifact test
d. Select the CR reader settings typically used for the IP and cassette of interest. (i.e.
sensitivity, pixel pitch, speed, etc.)
NOTE: Some CR systems automatically set scanner sensitivity and speed by selecting the
proper hard cassette required to process the IP.
e. Scan the IP and display the CR image on the monitor. f. Enlarge the CR image of the IP of interest so that it fills the viewable area of the viewing
monitor. g. Confirm the intensity value of the CR image is in an acceptable range.
i. GE Rhythm 2.0:
a. Select the Graphs tab b. Select the Histogram ROI tool c. Place the cursor on one corner of the CR image of the IP, left click and drag
the cursor to the opposite side and corner such that the majority of the CR image of the IP is covered by the ROI, being careful to stay within the boundaries of the CR image of the IP. Release the mouse.
d. Pixel digital values or intensity shall be between 1000 and 63999. ii. Fuji VF-C1 version V1.0
a. Select the “statistics” tool b. Place the cursor on one corner of the CR image of the IP, left click and
release. Place the cursor at the opposite side and corner such that the majority of the CR image of the IP is covered by the ROI, being careful to stay within the boundaries of the CR image of the IP, left click and release.
c. Place the cursor on the border of the ROI, right click and select “statistics”. d. Pixel digital values or intensity shall be between 100 and 1023.
iii. VMI StarrView 6.0 a. Select Graphs Histogram b. Determine minimum intensity by placing cursor at the left edge of histogram
and reading the image data from the top left corner of the histogram. The first value in parenthesis is the intensity value.
c. Determine maximum intensity by placing cursor at the right edge of histogram.
d. Pixel digital values or intensity shall be between 200 and 4095. h. If the intensity range is confirmed to be in the acceptable range as described above,