AFRL-RY-WP-TR-2017-0124 SCALAR MULTI-PASS ATOMIC MAGNETOMETER Prof. Michael V. Romalis Princeton University Dr. Thomas Kornack Twinleaf LLC AUGUST 2017 Final Report Approved for public release; distribution is unlimited. See additional restrictions described on inside pages STINFO COPY AIR FORCE RESEARCH LABORATORY SENSORS DIRECTORATE WRIGHT-PATTERSON AIR FORCE BASE, OH 45433-7320 AIR FORCE MATERIEL COMMAND UNITED STATES AIR FORCE
Transcript
AFRL-RY-WP-TR-2017-0124
SCALAR MULTI-PASS ATOMIC MAGNETOMETER Prof. Michael V. Romalis
Princeton University Dr. Thomas Kornack
Twinleaf LLC AUGUST 2017 Final Report
Approved for public release; distribution is unlimited.
See additional restrictions described on inside pages
STINFO COPY
AIR FORCE RESEARCH LABORATORY SENSORS DIRECTORATE
WRIGHT-PATTERSON AIR FORCE BASE, OH 45433-7320 AIR FORCE MATERIEL COMMAND
UNITED STATES AIR FORCE
NOTICE AND SIGNATURE PAGE
Using Government drawings, specifications, or other data included in this document for any purpose other than Government procurement does not in any way obligate the U.S. Government. The fact that the Government formulated or supplied the drawings, specifications, or other data does not license the holder or any other person or corporation; or convey any rights or permission to manufacture, use, or sell any patented invention that may relate to them. This report is the result of contracted fundamental research deemed exempt from public affairs security and policy review in accordance with SAF/AQR memorandum dated 10 Dec 08 and AFRL/CA policy clarification memorandum dated 16 Jan 09. This report is available to the general public, including foreign nationals. Copies may be obtained from the Defense Technical Information Center (DTIC) (http://www.dtic.mil). AFRL-RY-WP-TR-2017-0124 HAS BEEN REVIEWED AND IS APPROVED FOR PUBLICATION IN ACCORDANCE WITH ASSIGNED DISTRIBUTION STATEMENT. // Signature// // Signature// JOUNG C. HA, Program Manager JEFFREY M. HEBERT, DR-4 Navigation and Communication Branch Chief, Navigation and Communication Branch Spectrum Warfare Division Spectrum Warfare Division // Signature// JOHN F. CARR, DR-4 Chief, Spectrum Warfare Division Sensors Directorate This report is published in the interest of scientific and technical information exchange, and its publication does not constitute the Government’s approval or disapproval of its ideas or findings. *Disseminated copies will show “//Signature//” stamped or typed above the signature blocks.
REPORT DOCUMENTATION PAGE Form Approved OMB No. 0704-0188
The public reporting burden for this collection of information is estimated to average 1 hour per response, including the time for reviewing instructions, searching existing data sources, gathering and maintaining the data needed, and completing and reviewing the collection of information. Send comments regarding this burden estimate or any other aspect of this collection of information, including suggestions for reducing this burden, to Department of Defense, Washington Headquarters Services, Directorate for Information Operations and Reports (0704-0188), 1215 Jefferson Davis Highway, Suite 1204, Arlington, VA 22202-4302. Respondents should be aware that notwithstanding any other provision of law, no person shall be subject to any penalty for failing to comply with a collection of information if it does not display a currently valid OMB control number. PLEASE DO NOT RETURN YOUR FORM TO THE ABOVE ADDRESS.
1. REPORT DATE (DD-MM-YY) 2. REPORT TYPE 3. DATES COVERED (From - To)
August 2017 Final 14 October 2015 – 9 April 2017 4. TITLE AND SUBTITLE
SCALAR MULTI-PASS ATOMIC MAGNETOMETER 5a. CONTRACT NUMBER
FA8650-16-1-7673 5b. GRANT NUMBER
5c. PROGRAM ELEMENT NUMBER 62716E
6. AUTHOR(S) Prof. Michael Romalis (Princeton University) Dr. Thomas Kornack (Twinleaf LLC)
5d. PROJECT NUMBER DARPA
5e. TASK NUMBER N/A
5f. WORK UNIT NUMBER Y1E5
7. PERFORMING ORGANIZATION NAME(S) AND ADDRESS(ES) 8. PERFORMING ORGANIZATION REPORT NUMBER
Princeton University Princeton, NJ 08544
Twinleaf LLC 848 Alexander Rd, Princeton, NJ 08540
9. SPONSORING/MONITORING AGENCY NAME(S) AND ADDRESS(ES) 10. SPONSORING/MONITORING AGENCY ACRONYM(S)
Air Force Research Laboratory Sensors Directorate Wright-Patterson Air Force Base, OH 45433-7320 Air Force Materiel Command United States Air Force
Defense Advanced Research Projects AgencyDARPA/MTO 675 North Randolph Street Arlington, VA 22203
AFRL/RYWN 11. SPONSORING/MONITORING AGENCY
REPORT NUMBER(S) AFRL-RY-WP-TR-2017-0124
12. DISTRIBUTION/AVAILABILITY STATEMENT Approved for public release; distribution is unlimited.
13. SUPPLEMENTARY NOTES This report is the result of contracted fundamental research deemed exempt from public affairs security and policy review in accordance with SAF/AQR memorandum dated 10 Dec 08 and AFRL/CA policy clarification memorandum dated 16 Jan 09. This material is based on research sponsored by Air Force Research laboratory (AFRL) and the Defense Advanced Research Agency (DARPA) under agreement number FA8650-16-1-7673. The U.S. Government is authorized to reproduce and distribute reprints for Governmental purposes notwithstanding any copyright notation herein. The views and conclusions contained herein are those of the authors and should not be interpreted as necessarily representing the official policies of endorsements, either expressed or implied, of Air Force Research Laboratory (AFRL) and the Defense Advanced Research Agency (DARPA) or the U.S. Government. Report contains color.
14. ABSTRACT
We investigated the feasibility of a femto-Tesla level scalar atomic magnetometer operating in Earth’s field. Our approach is unique in using multi-pass alkali-metal cells, quantum-non-demolition measurements, and suppression of spin-exchange relaxation to achieve the highest sensitivity per unit volume. We developed a new multi-pass cell geometry with a small internal volume and experimentally verified the predictions of our model for quantum spin noise. We also investigated the availability of pulsed pump and probe lasers to operate a high-sensitivity atomic magnetometer
15. SUBJECT TERMS atomic magnetometers, optical pumping, magnetic fields
16. SECURITY CLASSIFICATION OF: 17. LIMITATION OF ABSTRACT:
SAR
18. NUMBER OF PAGES
21
19a. NAME OF RESPONSIBLE PERSON (Monitor) a. REPORT Unclassified
b. ABSTRACT Unclassified
c. THIS PAGE Unclassified
Joung Ha 19b. TELEPHONE NUMBER (Include Area Code)
N/A Standard Form 298 (Rev. 8-98)
Prescribed by ANSI Std. Z39-18
i Approved for public release; distribution is unlimited.
TABLE OF CONTENTS
Section Page
LIST OF FIGURES………………………………………………………………………..…….ii LIST OF TABLES……………………………………………………………………………….ii
1 SUMMARY ........................................................................................................................... 6 2 INTRODUCTION................................................................................................................. 1 3 DEVELOPMENT OF NEW MULTI-PASS CELLS ......................................................... 2 4 IMPROVED MULTI-PASS CELL DESIGN ..................................................................... 3 5 MEASUREMENT OF QUANTUM NOISE SPECTRA ................................................... 4 6 OPTICAL PUMPING AND SPIN PRECESSION IN EARTH’S FIELD ....................... 6 7 TESTING OF OPTICAL PUMPING IN MAGNETIC SHIELDS .................................. 9 8 PROBE LASER CHARACTERIZATION....................................................................... 10 9 PUMP LASERS .................................................................................................................. 13 10 SENSOR DESIGN .............................................................................................................. 14 11 CONCLUSIONS ................................................................................................................. 16 12 REFERENCES .................................................................................................................... 16
ii Approved for public release; distribution is unlimited.
LIST OF FIGURES
Figure 1. Basic Optical Design For A Multi-Pass Cell……………………………………….…...2 Figure 2. Fabrication Of Multi-Pass Cells With Spherical Mirrors……………………………….2 Figure 3. Predicted Total Probe Light Intensity Distribution In The Cell…………………..…….3 Figure 4. Predicted Diffusion Correlation Function………………………………………….…...3 Figure 5. Photo Of Multi-Pass Cell With Barrier…………………………………………………4 Figure 6. Interference Effects In Light Transmission Through The Cell………………….……...4 Figure 7. Photo Of Final Cell Design With Tilted Barrier……………………………….……….4 Figure 8. Measurements Of Spin Quantum Noise Spectrum And Correlation Functions…….…..5 Figure 9. Comparison To Measurement Of Spin Correlation Function In Previus Cell Design….5 Figure 10. Comparison Of Measured And Calculated Total Noise For Various Conditions……..6 Figure 11. Large Optical Rotation Signal After A Single Pulse From Twinleaf Pump Laser…. 6
Figure 12. Measurements Of Magnetic Fields Outside Of The Shields With Two Cells……..….7 Figure 13. Differences In The Spin Precession Signals From Two Cells………………………...7 Figure 14. Output Of The Phase Detector In Ambient Magnetic Field………………………..….8 Figure 15. Output Of The Phase Detector In Comparison To Phase Fits………………………. 8
Figure 16. Large Optical Rotation Signals Recorded Inside Magnetic Shields………………..…9 Figure 17. Envelope Of Large Optical Rotation Signal As A Function Of Magnetic Field……. 9
Figure 18. Preliminary Measurements Of Magnetic Noise Spectrum………………………….…9 Figure 19. Amplitude Noise Of Several VCSEL Lasers………………………………………...10 Figure 20. Polarization Noise Of Several VCSEL Lasers…………………………………….…10 Figure 21. Frequency Noise Of Several VCSEL Lasers………………………………………. 11
Figure 22. Comparison Of Newer And Older Generation VCSEL Lasers…………………..…..12 Figure 23. Polarizaiton Variation Of Princeton Optronics Lasers………………………….……12 Figure 24. Average Output Power Of Twinleaf Pulsed Laser……………………………….…..13 Figure 25. Schematic Of Multi-Pass Sensor Assembly With Flat Mirrors…………………...….14 Figure 26. Schematic Of Wedged Multi-Pass Cell………………………………………….…...15
LIST OF TABLES
Table 1. Summary Of Investigated Pulsed Laser Technology ..................................................... 13
1 Approved for public release; distribution is unlimited.
1. Summary The goal of the project was to investigate the feasibility of a femto-Tesla level scalar atomic magnetometer operating in Earth’s field with a small SWaP (Size, Weight and Power). Our approach is unique in using multi-pass alkali-metal cells, quantum-non-demolition measurements, and suppression of spin-exchange relaxation to achieve the highest sensitivity per unit volume. During the project we developed a new multi-pass cell geometry with a small internal volume. The geometry was optimized to obtain maximum spin correlation between successive measurements and enable spin squeezing using quantum-non-demolition measurements. We verified that the predictions of our model agree with the measurements of quantum spin noise.
We also investigated the availability of pulsed pump and probe lasers to operate a high- sensitivity atomic magnetometer. We found that commercial VCSEL (Vertical-cavity surface- emitting laser) are adequate for probe lasers and we developed a pulsed pump laser with external VBG (Volume Bragg Grating) feedback that generates sufficient optical pumping to polarize atoms in less than 1 µsec.
We briefly operated a two-cell gradiometer in unshielded Earth’s field magnetic environment to understand the sources of ambient magnetic field noise and identify challenges for future improvements.
2. Introduction
We are investigating the feasibility of a femto-Tesla scalar atomic magnetometer operating in Earth’s field with a small SWaP. Our work is based on previous demonstration of sub-femtotesla sensitivity in a scalar magnetometer using multi-pass cells [1]. That experiment used relatively large vapor cell approximately 5x4x2 cm in size with two multi-pass cavities inside the cell. It also used MOPA (Master Oscillator-Power Amplifier) lasers for optical pumping and fiber-coupled DBR (Distributed Bragg Reflector) lasers for probing.
One of the goals of this project is to find an efficient multi-pass cell geometry to reduce the sensor volume and to improve quantum-non-demolition measurements in order to realize the highest sensitivity per unit cell volume.
Another goal is to identify low-power lasers that can be used for optical pumping and probing and incorporated directly into the sensor package.
2 Approved for public release; distribution is unlimited.
c)
3. Development of new multi-pass cells
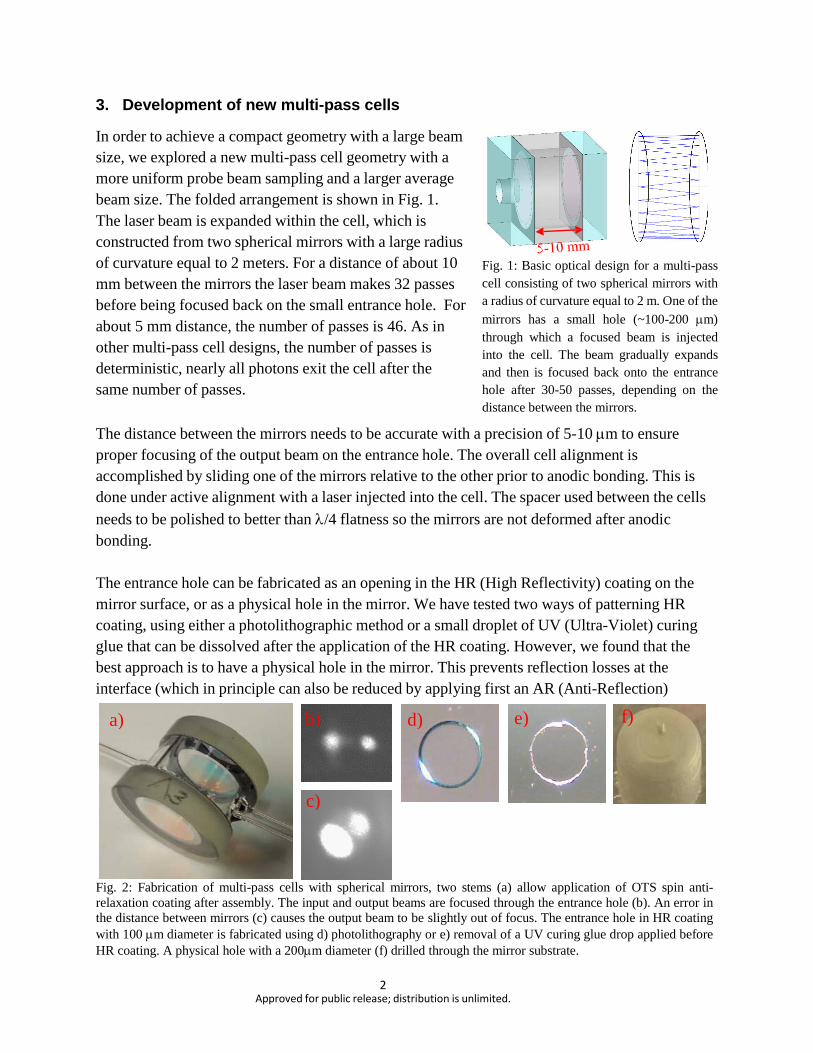
In order to achieve a compact geometry with a large beam size, we explored a new multi-pass cell geometry with a more uniform probe beam sampling and a larger average beam size. The folded arrangement is shown in Fig. 1. The laser beam is expanded within the cell, which is constructed from two spherical mirrors with a large radius of curvature equal to 2 meters. For a distance of about 10 mm between the mirrors the laser beam makes 32 passes before being focused back on the small entrance hole. For about 5 mm distance, the number of passes is 46. As in other multi-pass cell designs, the number of passes is deterministic, nearly all photons exit the cell after the same number of passes.
Fig. 1: Basic optical design for a multi-pass cell consisting of two spherical mirrors with a radius of curvature equal to 2 m. One of the mirrors has a small hole (~100-200 µm) through which a focused beam is injected into the cell. The beam gradually expands and then is focused back onto the entrance hole after 30-50 passes, depending on the distance between the mirrors.
The distance between the mirrors needs to be accurate with a precision of 5-10 µm to ensure proper focusing of the output beam on the entrance hole. The overall cell alignment is accomplished by sliding one of the mirrors relative to the other prior to anodic bonding. This is done under active alignment with a laser injected into the cell. The spacer used between the cells needs to be polished to better than λ/4 flatness so the mirrors are not deformed after anodic bonding.
The entrance hole can be fabricated as an opening in the HR (High Reflectivity) coating on the mirror surface, or as a physical hole in the mirror. We have tested two ways of patterning HR coating, using either a photolithographic method or a small droplet of UV (Ultra-Violet) curing glue that can be dissolved after the application of the HR coating. However, we found that the best approach is to have a physical hole in the mirror. This prevents reflection losses at the interface (which in principle can also be reduced by applying first an AR (Anti-Reflection)
Fig. 2: Fabrication of multi-pass cells with spherical mirrors, two stems (a) allow application of OTS spin anti- relaxation coating after assembly. The input and output beams are focused through the entrance hole (b). An error in the distance between mirrors (c) causes the output beam to be slightly out of focus. The entrance hole in HR coating with 100 µm diameter is fabricated using d) photolithography or e) removal of a UV curing glue drop applied before HR coating. A physical hole with a 200µm diameter (f) drilled through the mirror substrate.
f) e) d) a) b)
3 Approved for public release; distribution is unlimited.
coating but would require a multi-step process). The steps of the cell fabrication and alignment process are shown in Fig. 2.
4. Improved multi-pass cell design.
To evaluate the performance of the new cell design we studied the spectrum of quantum spin noise from unpolarized atoms in the multi-pass cells. The ability to observe optical rotation from quantum spin noise above photon shot noise and any technical noise background demonstrates that the sensor sensitivity is limited primarily by atomic shot noise. Furthermore, the spectrum of quantum spin noise provides information on the time correlation between the spins and one’s ability to benefit from spin-squeezing techniques. In these investigations we have encountered two problems that we have been able to successfully solve.
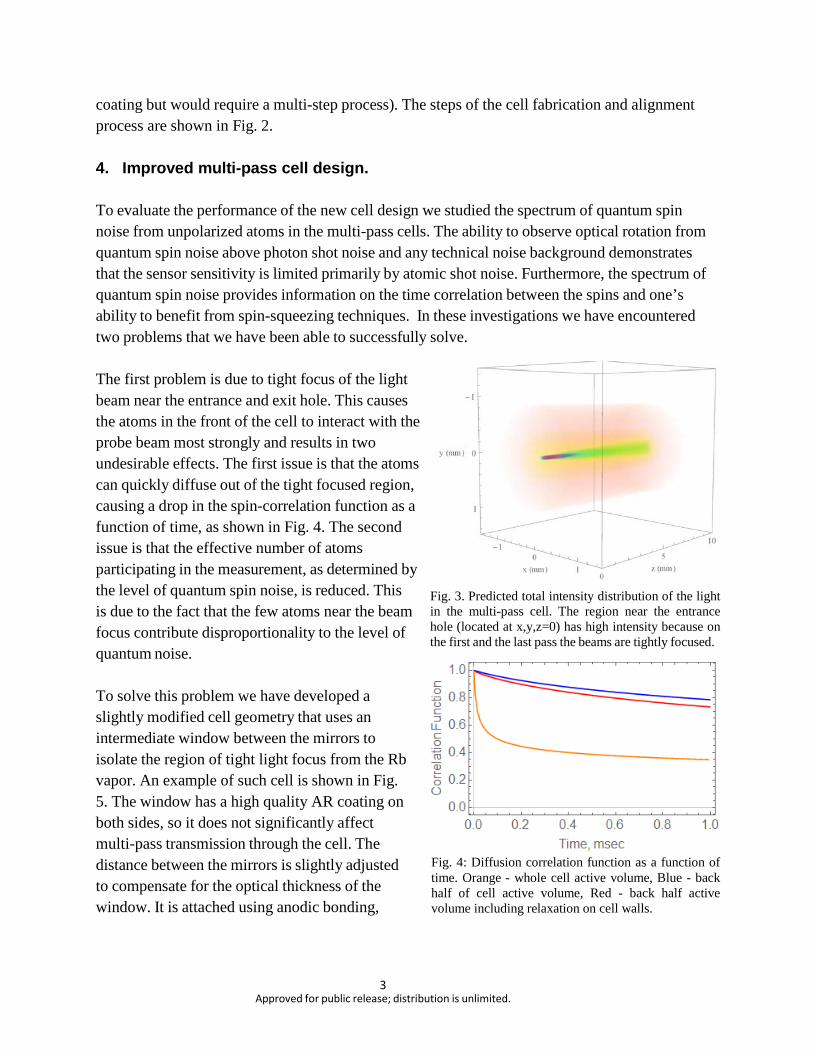
The first problem is due to tight focus of the light beam near the entrance and exit hole. This causes the atoms in the front of the cell to interact with the probe beam most strongly and results in two undesirable effects. The first issue is that the atoms can quickly diffuse out of the tight focused region, causing a drop in the spin-correlation function as a function of time, as shown in Fig. 4. The second issue is that the effective number of atoms participating in the measurement, as determined by the level of quantum spin noise, is reduced. This is due to the fact that the few atoms near the beam focus contribute disproportionality to the level of quantum noise.
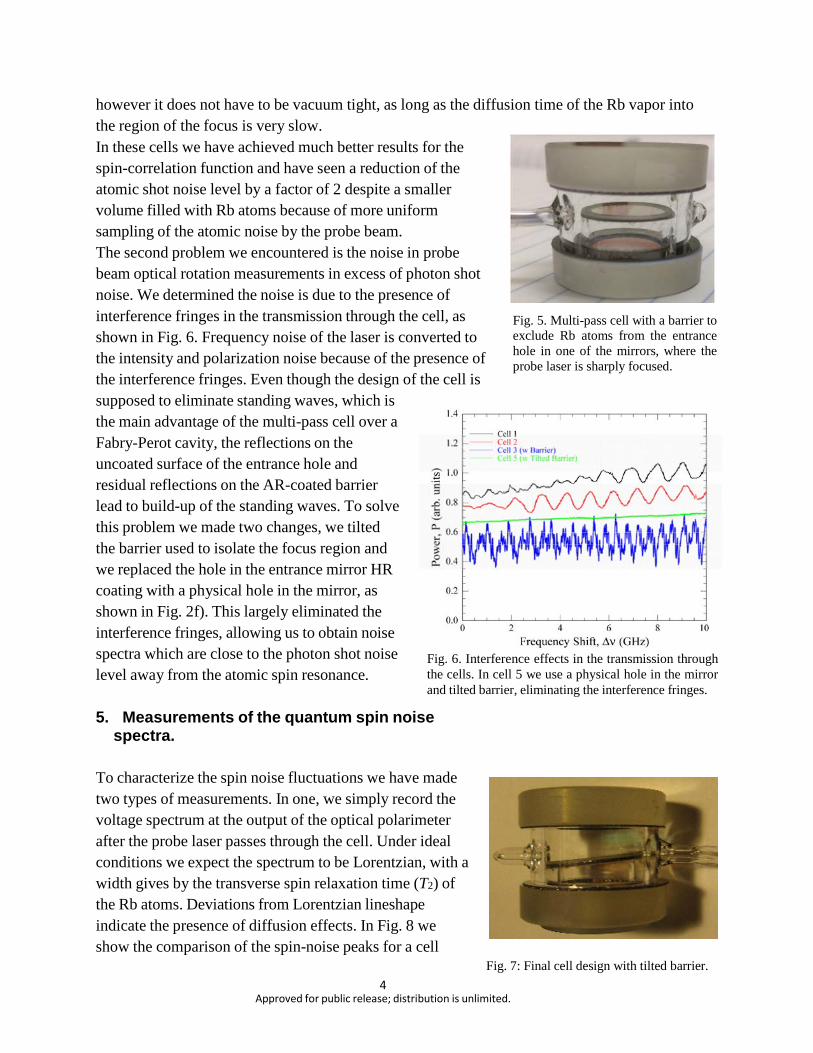
To solve this problem we have developed a slightly modified cell geometry that uses an intermediate window between the mirrors to isolate the region of tight light focus from the Rb vapor. An example of such cell is shown in Fig. 5. The window has a high quality AR coating on both sides, so it does not significantly affect multi-pass transmission through the cell. The distance between the mirrors is slightly adjusted to compensate for the optical thickness of the window. It is attached using anodic bonding,
Fig. 3. Predicted total intensity distribution of the light in the multi-pass cell. The region near the entrance hole (located at x,y,z=0) has high intensity because on the first and the last pass the beams are tightly focused.
Fig. 4: Diffusion correlation function as a function of time. Orange - whole cell active volume, Blue - back half of cell active volume, Red - back half active volume including relaxation on cell walls.
4 Approved for public release; distribution is unlimited.
Fig. 6. Interference effects in the transmission through the cells. In cell 5 we use a physical hole in the mirror and tilted barrier, eliminating the interference fringes.
however it does not have to be vacuum tight, as long as the diffusion time of the Rb vapor into the region of the focus is very slow. In these cells we have achieved much better results for the spin-correlation function and have seen a reduction of the atomic shot noise level by a factor of 2 despite a smaller volume filled with Rb atoms because of more uniform sampling of the atomic noise by the probe beam. The second problem we encountered is the noise in probe beam optical rotation measurements in excess of photon shot noise. We determined the noise is due to the presence of interference fringes in the transmission through the cell, as shown in Fig. 6. Frequency noise of the laser is converted to the intensity and polarization noise because of the presence of the interference fringes. Even though the design of the cell is supposed to eliminate standing waves, which is the main advantage of the multi-pass cell over a Fabry-Perot cavity, the reflections on the uncoated surface of the entrance hole and residual reflections on the AR-coated barrier lead to build-up of the standing waves. To solve this problem we made two changes, we tilted the barrier used to isolate the focus region and we replaced the hole in the entrance mirror HR coating with a physical hole in the mirror, as shown in Fig. 2f). This largely eliminated the interference fringes, allowing us to obtain noise spectra which are close to the photon shot noise level away from the atomic spin resonance.
5. Measurements of the quantum spin noise
spectra.
Fig. 5. Multi-pass cell with a barrier to exclude Rb atoms from the entrance hole in one of the mirrors, where the probe laser is sharply focused.
To characterize the spin noise fluctuations we have made two types of measurements. In one, we simply record the voltage spectrum at the output of the optical polarimeter after the probe laser passes through the cell. Under ideal conditions we expect the spectrum to be Lorentzian, with a width gives by the transverse spin relaxation time (T2) of the Rb atoms. Deviations from Lorentzian lineshape indicate the presence of diffusion effects. In Fig. 8 we show the comparison of the spin-noise peaks for a cell
Fig. 7: Final cell design with tilted barrier.
5 Approved for public release; distribution is unlimited.
without barrier and a cell with barrier. One can see that for the cell with barrier the lineshape is much closer to a Lorentzian, indicating the success in eliminating broadening effects due to diffusion in the new cell design.
Another type of spin noise measurement that we performed is a direct measure of the spin- correlation function. In this approach the spin precession signal is measured for 20-50 µsec, there is a delay of several hundreds of µsec and the spin precession signal is measured again. In practice, the probe beam is always on, we simply analyze different sections of the continuously recorded data. The data are analyzed in the rotating frame, taking into account the precession of the spins at the known Larmor frequency. To analyze the spin-correlation function just due to diffusion we remove the exponential decay due to spin relaxation caused by spin- exchange collisions.
The diffusion spin correlation function decays to about 0.7-0.8 after 1 msec, indicating that about 75% of the atoms remain in the active region after 1 msec without diffusing out of the beam. This is consistent with predictions shown in Fig. 4. This level of spin correlation will allow us to reduce the quantum spin noise voltage or magnetic field noise by a factor of 2 and obtain 6 dB of spin sqeezing. It is also useful to compare to the results we obtained in the orginal multi- pass cell [1], which are reproduced in Fig. 9. In that case, the correlation function decayed to 20% at 1 msec. Note that even though the transverse
Fig. 9: Measurements of the diffusion correlation function in the previous generation of multi-pass cell [1], shown here for comparison.
a) b)
c) d)
Fig. 8: Spin quantum noise fluctuations in the two types of multi-pass cells studied in this project. Spectrum of optical rotation signal (a,b) with a fit to a Lorentzian (red line). Time correlation of the spin expectation values (c,d) after subtraction of coherent T2
relaxation. The cell with a barrier (b,d) has a very nearly Lorentzian lineshape and slow decay of the spin correlation function, in agreement with predictions.
6 Approved for public release; distribution is unlimited.
Fig. 10: Comparison of measured and calculated total φrms noise in 3 cells for various experimental conditions.
size of the overall beam pattern was about 10×12 mm in the old multi-pass cell, there were many regions where the probe beam came to a focus inside the cell, as shown in the inset of Fig. 9. In our new design, the transverse size of the beam pattern is about 2 mm (see Fig. 3) and the Rb vapor is excluded from the only location of the beam focus at the entrance of the cell.
Another aspect of the spin noise properties that we studied is the integral under the curve in Fig. 8 a,b) which is related to the total Faraday rotation angle noise φrms. It can also be calculated from first principles without any adjustable parameters. φrms determines the effective number of atoms participating in the measurement, in general <prms~1/√N.
We have obtained good agreement between theory and experiment (generally within ±20%) for the total Faraday rotation angle noise. For this comparison we made measurements at different cell temperatures (120-150°C), buffer gas pressures (70 and 223 Torr), incident probe laser intensities (0.5-10mW), and probe laser detunings (40-160 GHz). The results of the comparison are shown in Fig. 10. It indicates that our model for calculating the effective number of atoms participating in the measurement works well. Based on this model, the overall level of magnetometer noise can be accurately calculated.
6. Optical pumping and spin precession measurements in Earth’s magnetic field.
Using the multi-pass cells developed under this project at Princeton and pulsed pump lasers developed at Twinleaf, we tested optical pumping of Rb atoms in the multi-pass cell. Fig. 11 shows the spin rotation signal with a large optical rotation obtained using Twinleaf’s pulsed pump laser with a 1 µsec pumping time. Initial analysis indicates that the power is sufficient to obtain more than 90% Rb spin polarization. The pump laser in injected into the multi-pass cell through the same hole as the probe beam. The pump light can reflect in the cell many times, ensuring uniform Rb spin polarization.
We then setup an atomic gradiometer using two identical multi-pass cells outside of the magnetic shields. The gradiometer is mounted on a non-magnetic stainless steel optical table, as shown in Fig. 12 and is operated in a continuously pulsed regime, with the pump pulse repetition frequency set to 720 Hz. We choose a frequency which is a multiple of 60Hz to more easily distinguish noise sources associated with power line interference.
Fig. 11: Large optical rotation signal obtained following a 1 µsec optical pumping pulse from Twinleaf’s laser.
7 Approved for public release; distribution is unlimited.
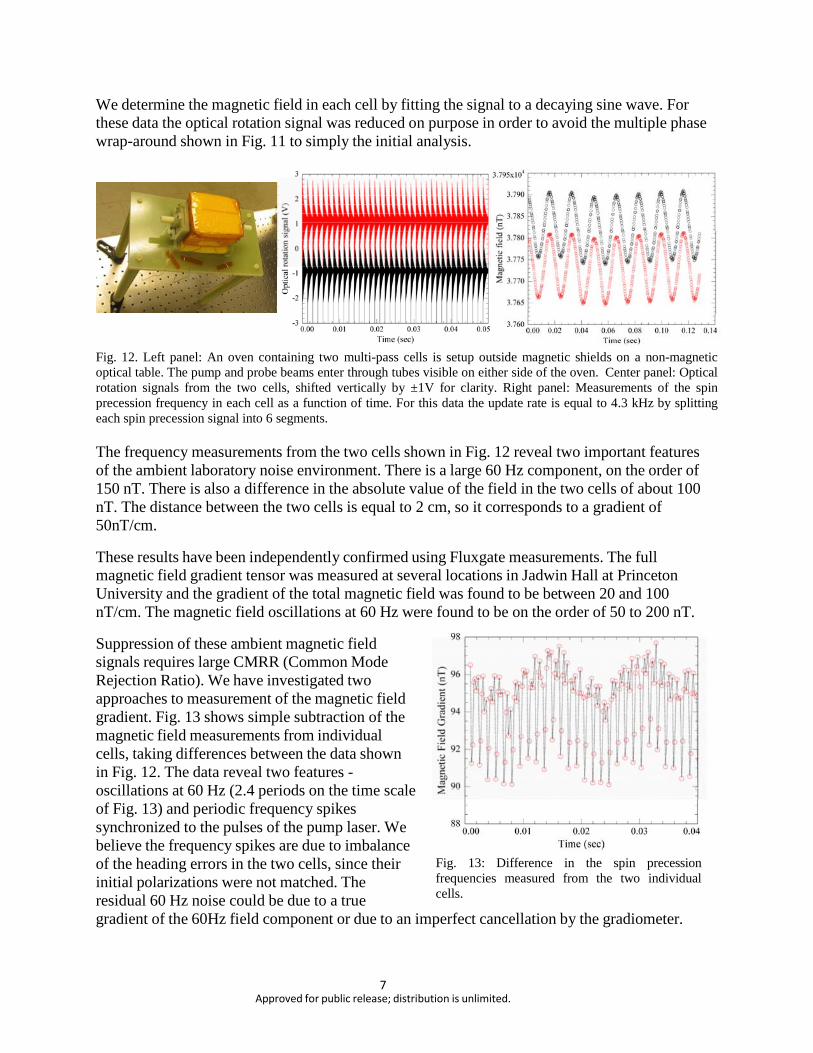
We determine the magnetic field in each cell by fitting the signal to a decaying sine wave. For these data the optical rotation signal was reduced on purpose in order to avoid the multiple phase wrap-around shown in Fig. 11 to simply the initial analysis.
Fig. 12. Left panel: An oven containing two multi-pass cells is setup outside magnetic shields on a non-magnetic optical table. The pump and probe beams enter through tubes visible on either side of the oven. Center panel: Optical rotation signals from the two cells, shifted vertically by ±1V for clarity. Right panel: Measurements of the spin precession frequency in each cell as a function of time. For this data the update rate is equal to 4.3 kHz by splitting each spin precession signal into 6 segments.
The frequency measurements from the two cells shown in Fig. 12 reveal two important features of the ambient laboratory noise environment. There is a large 60 Hz component, on the order of 150 nT. There is also a difference in the absolute value of the field in the two cells of about 100 nT. The distance between the two cells is equal to 2 cm, so it corresponds to a gradient of 50nT/cm.
These results have been independently confirmed using Fluxgate measurements. The full magnetic field gradient tensor was measured at several locations in Jadwin Hall at Princeton University and the gradient of the total magnetic field was found to be between 20 and 100 nT/cm. The magnetic field oscillations at 60 Hz were found to be on the order of 50 to 200 nT.
Suppression of these ambient magnetic field signals requires large CMRR (Common Mode Rejection Ratio). We have investigated two approaches to measurement of the magnetic field gradient. Fig. 13 shows simple subtraction of the magnetic field measurements from individual cells, taking differences between the data shown in Fig. 12. The data reveal two features - oscillations at 60 Hz (2.4 periods on the time scale of Fig. 13) and periodic frequency spikes synchronized to the pulses of the pump laser. We believe the frequency spikes are due to imbalance of the heading errors in the two cells, since their initial polarizations were not matched. The residual 60 Hz noise could be due to a true
Fig. 13: Difference in the spin precession frequencies measured from the two individual cells.
gradient of the 60Hz field component or due to an imperfect cancellation by the gradiometer.
8 Approved for public release; distribution is unlimited.
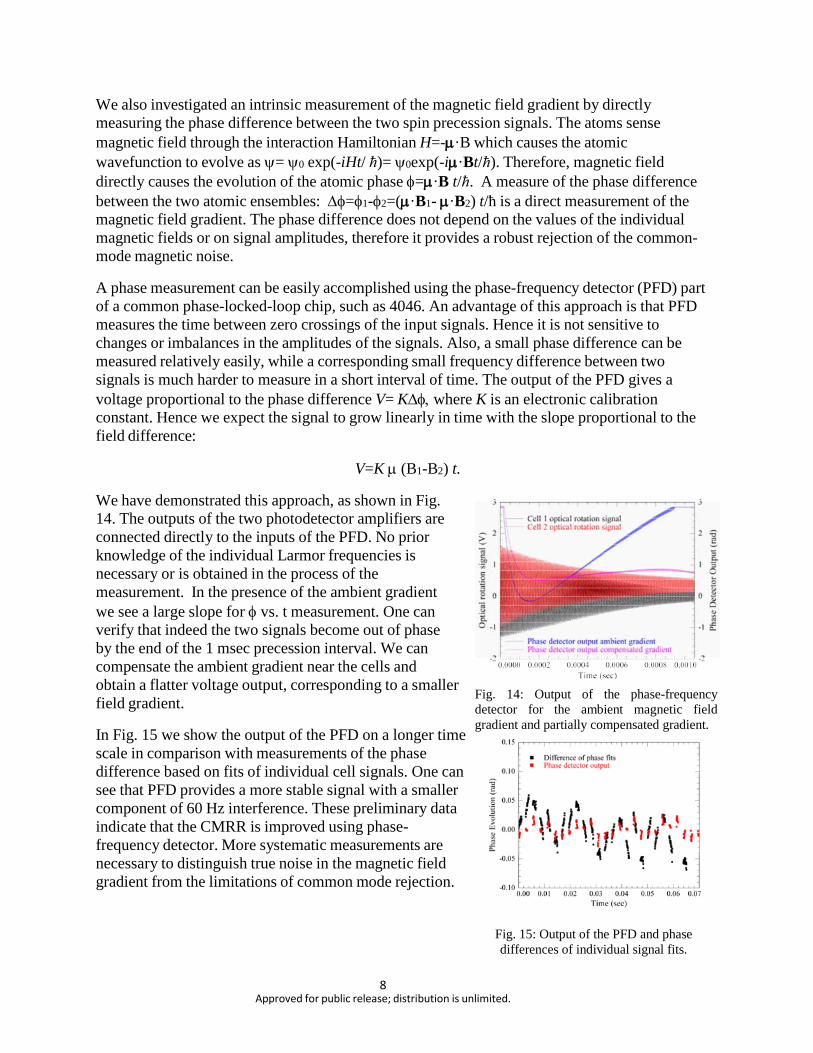
We also investigated an intrinsic measurement of the magnetic field gradient by directly measuring the phase difference between the two spin precession signals. The atoms sense magnetic field through the interaction Hamiltonian H=-µ·B which causes the atomic wavefunction to evolve as ψ= ψ0 exp(-iHt/ ħ)= ψ0exp(-iµ·Bt/ħ). Therefore, magnetic field directly causes the evolution of the atomic phase φ=µ·B t/ħ. A measure of the phase difference between the two atomic ensembles: ∆φ=φ1-φ2=(µ·B1- µ·B2) t/ħ is a direct measurement of the magnetic field gradient. The phase difference does not depend on the values of the individual magnetic fields or on signal amplitudes, therefore it provides a robust rejection of the common- mode magnetic noise.
A phase measurement can be easily accomplished using the phase-frequency detector (PFD) part of a common phase-locked-loop chip, such as 4046. An advantage of this approach is that PFD measures the time between zero crossings of the input signals. Hence it is not sensitive to changes or imbalances in the amplitudes of the signals. Also, a small phase difference can be measured relatively easily, while a corresponding small frequency difference between two signals is much harder to measure in a short interval of time. The output of the PFD gives a voltage proportional to the phase difference V= K∆φ, where K is an electronic calibration constant. Hence we expect the signal to grow linearly in time with the slope proportional to the field difference:
V=K µ (B1-B2) t.
We have demonstrated this approach, as shown in Fig. 14. The outputs of the two photodetector amplifiers are connected directly to the inputs of the PFD. No prior knowledge of the individual Larmor frequencies is necessary or is obtained in the process of the measurement. In the presence of the ambient gradient we see a large slope for φ vs. t measurement. One can verify that indeed the two signals become out of phase by the end of the 1 msec precession interval. We can compensate the ambient gradient near the cells and obtain a flatter voltage output, corresponding to a smaller field gradient.
In Fig. 15 we show the output of the PFD on a longer time scale in comparison with measurements of the phase difference based on fits of individual cell signals. One can see that PFD provides a more stable signal with a smaller component of 60 Hz interference. These preliminary data indicate that the CMRR is improved using phase- frequency detector. More systematic measurements are necessary to distinguish true noise in the magnetic field gradient from the limitations of common mode rejection.
Fig. 14: Output of the phase-frequency detector for the ambient magnetic field gradient and partially compensated gradient.
Fig. 15: Output of the PFD and phase differences of individual signal fits.
9 Approved for public release; distribution is unlimited.
Next we plan to install the two-cell magnetometer back inside the magnetic shields. This will allow us to evaluate intrinsic magnetic field noise and measure the CMRR under controlled conditions.
7. Testing of optical pumping in magnetic shields.
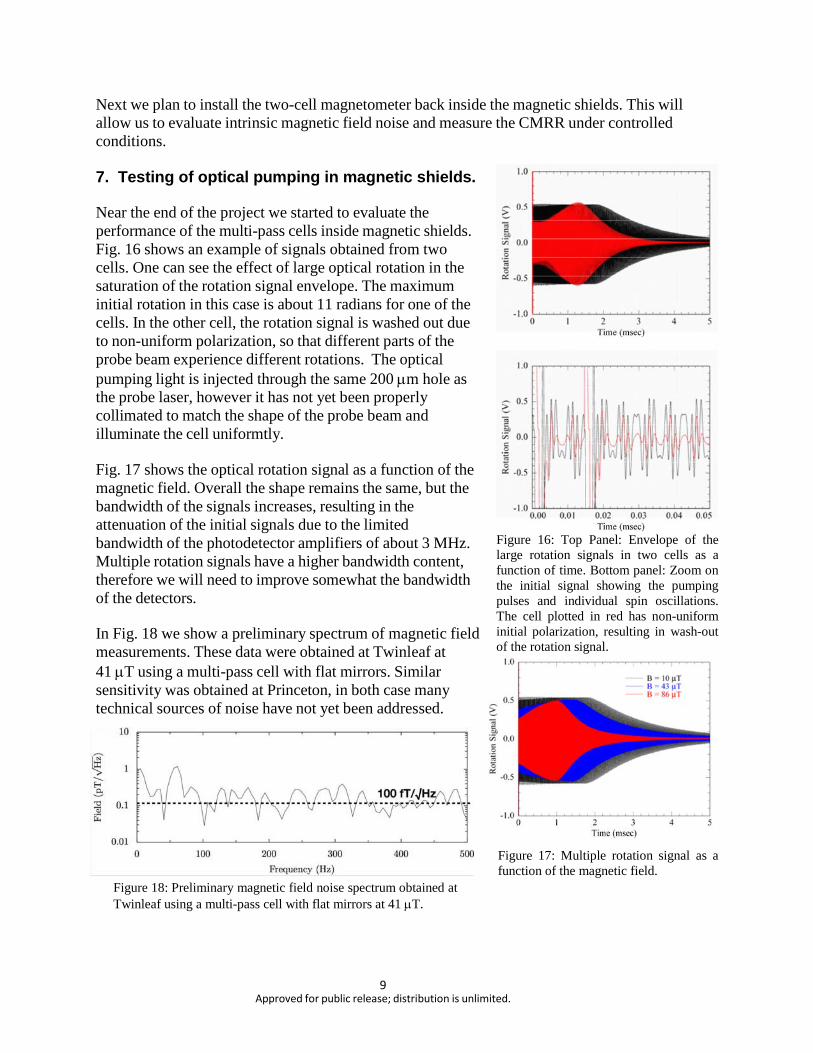
Near the end of the project we started to evaluate the performance of the multi-pass cells inside magnetic shields. Fig. 16 shows an example of signals obtained from two cells. One can see the effect of large optical rotation in the saturation of the rotation signal envelope. The maximum initial rotation in this case is about 11 radians for one of the cells. In the other cell, the rotation signal is washed out due to non-uniform polarization, so that different parts of the probe beam experience different rotations. The optical pumping light is injected through the same 200 µm hole as the probe laser, however it has not yet been properly collimated to match the shape of the probe beam and illuminate the cell uniformtly.
Fig. 17 shows the optical rotation signal as a function of the magnetic field. Overall the shape remains the same, but the bandwidth of the signals increases, resulting in the attenuation of the initial signals due to the limited bandwidth of the photodetector amplifiers of about 3 MHz. Multiple rotation signals have a higher bandwidth content, therefore we will need to improve somewhat the bandwidth of the detectors.
In Fig. 18 we show a preliminary spectrum of magnetic field measurements. These data were obtained at Twinleaf at 41 µT using a multi-pass cell with flat mirrors. Similar sensitivity was obtained at Princeton, in both case many technical sources of noise have not yet been addressed.
Figure 18: Preliminary magnetic field noise spectrum obtained at Twinleaf using a multi-pass cell with flat mirrors at 41 µT.
Figure 16: Top Panel: Envelope of the large rotation signals in two cells as a function of time. Bottom panel: Zoom on the initial signal showing the pumping pulses and individual spin oscillations. The cell plotted in red has non-uniform initial polarization, resulting in wash-out of the rotation signal.
Figure 17: Multiple rotation signal as a function of the magnetic field.
10 Approved for public release; distribution is unlimited.
As part of the project, Twinleaf has evaluated pump and probe lasers in the context of a pressure- broadened atomic vapor cell that is relevant for high performance magnetometry. We have also selected a sensor geometry that balances performance and manufacturability. A simple arrangement using the selected geometry was experimentally tested near the end of the program, with an noise initial spectrum shown in Fig. 18.
8. Probe laser characterization
The VCSEL laser characterization is broken into separate noise analysis for amplitude, polarization, and frequency. We restrict our analysis to wideband noise at 10 kHz and above because that covers typical Larmor precession frequencies for alkali metals in the geomagnetic field.
Although absolute light levels varied over a wide range due to varying laser type and current, we find that virtually all sources are consistent with shot-noise-limited amplitude
Fig. 19: Amplitude noise measured for VCSEL from several vendors.
noise performance, as shown in Fig. 19. We verified our system with a known-good DBR laser (shown at 10 mW) of light. We have previously found various points in the operating current range of 1–3 mA where the lasers can be bistable or multimode, but these points are not readily reproducible and we focus on the regions of stability.
Polarization noise was evaluated by placing a polarizer between the emitter and the photodetector, see Fig. 20. If the photons were both amplitude and polarization stable, we expect the resulting light to be shot-noise-limited both with and without the polarizer in place. Newer Vixar VCSELs with internal gratings on output couples achieve shot-noise-limited polarization stability at 1 mA and 3 mA. It is interesting to note that in the case of the Vixar 795 nm VCSEL mode competion at 2 mA generates excess
Fig. 20: Polarization noise measured for VCSEL from several vendors.
polarization noise while the amplitude noise remains shot-noise-limited. VCSELs without internal gratings, including all devices from Princeton Optronics and older-generation Vixar parts, exhibit significantly increased polarization noise. For these, we generally find polarization noise 2–3 times higher than shot noise. The Princeton Optronics 795 nm VCSEL, in particular, showed that polarization noise increased linearly with output power. As a result, there is no
11 Approved for public release; distribution is unlimited.
Fig. 21: Frequency noise measured for VCSEL from several vendors.
advantage to operating a polarimeter with this laser because higher signal from higher power comes with proportionally higher noise. While it is generally possible to clean up the polarization using an initial polarizer, it requires careful alignment of the polarizer and stable initial polarization of the light from the VCSEL.
We are cautiously optimistic about the operation of the Vixar 795 nm VCSEL at its island of stability around 3 mA because it provides 500 uW of output power that is both polarization and amplitude stable. These results indicate that a high quality polarimeter can be obtained using only the VCSEL and a final polarizer before a photodiode. It is not necessary to use an initial polarizer to clean up the polarization or a balanced polarimeter to eliminate amplitude noise with two photodiodes.
A measure of frequency noise was obtained by tuning the VCSELs to the side (half maximum) of an atomic absorption line, see Fig. 21. Although spectroscopy cells were available, we chose to use cells with similar contents, temperature (125 C for rubidium), and pressure broadening used in the anticipated magnetometer design because it was both easier to operate the VCSELs open loop on a broad line and because it reflects the real-world impact on noise floor of a detuned probe beam.
In the frequency noise measurements, we find striking deviation from shot-noise-limited performance for virtually all VCSELs tested. We verified that the light passing through the cell achieves shot-noise-limited performance when detuned from the line. We were concerned to note that the DBR laser noise saw a 20% rise above shot noise when tuned to resonance. It was nonetheless significantly less than the noise found with the VCSELs tuned to resonance.
Although more than eight different VCSELs were evaluated, we only seriously consider the two modern 795 nm components from Princeton Optronics and Vixar. Of these, the Princeton Optronics laser shows some of the best frequency noise performance yet has high polarization noise. Unfortunately, the Vixar 795 nm laser that has excellent polarization noise exhibits frequency noise comparable to the polarization noise levels found in the Princeton Optronics VCSELs. As a result, there is no clear winner. We have not resolved to our satisfaction all the potential systematic sources of error such as current noise in the current supply.
The Vixar 895 nm VCSEL is an existence proof that nearly 1 mW of power with shot-noise- limited performance is possible. In several repeated tests of these measurements over several weeks, we found that the 895 nm VCSEL had become badly multimode and later results showed much higher noise. We plan to build new VCSEL setups for both Vixar and Princeont Optronics and repeat the tests in case some damage or variation in the samples is strongly affecting these measurements.
12 Approved for public release; distribution is unlimited.
We note with interest the progress in VCSEL performance over the past several years, see Fig. 22. The older generation of VCSELs shows significantly higher amplitude and polarization noise.
Fig. 22: Age comparison of amplitude (left panel) and polarization (right panel) noise measured in VCSELs from Princeton Optronics and Vixar.
The Princeton Optronics VCSEL was found to have particularly poor initial polarization stability, see Fig. 23. The polarization is unstable as the device is heated above room temperature. It is clear that as the temperature is increased, the output power degrades significantly (by a factor of 2–3) while the polarization varies significantly. At low current, it was even seen to flip in a bistable manner. We found that it is possible to tune the VCSEL to resonance by operating at much higher current with no added heat. This seems to result in a more stable polarization output.
Fig. 23: Variation of polarization angle and output power with heat (left panel) and current (right panel) for Princeton Optronics VCSEL.
In conclusion, performance flaws have been identified in both of the two 795 nm laser candidates from Vixar and Princeton Optronics. If only 100 µW of output power is required, the Vixar components offer superior polarization stability and frequency noise but with twice the photon shot noise for relevant system parameters. If more power is needed, it is possible to obtain up to 500 µW with frequency noise at a level three times higher than photon shot noise in the Vixar
13 Approved for public release; distribution is unlimited.
emitter. In some configurations such as side-locked optical rotation probe beams, the increased power may be substantially negated by the added frequency noise. It should also be noted that the elevated frequency noise is due to multimode emission and as a result the noise properties may be variable over time and conditions. Princeton Optronics offers higher, 1 mW output power but suffers from both elevated frequency noise and potentially serious polarization instability. If it is possible to operate the Princeton Optronics VCSEL at higher current and lower ambient temperature (added heat), we found that it may be possible to avoid the polarization stability issues.
9. Pump Lasers
There are three major types of high power multimode laser available for pulsed magnetometry: standard multimode lasers with external feedback, multimode lasers with chip-scale grating feedback, and short cavity lasers specifically designed for pulsed operation. We have tested a representative sample of each type.
Type Wavelength Peak Power Linewidth
Internal grating 795 nm 1 W 0.2 nm
External grating 795 nm 9 W 0.06 nm
External grating short cavity
895 nm 14 W 0.04 nm
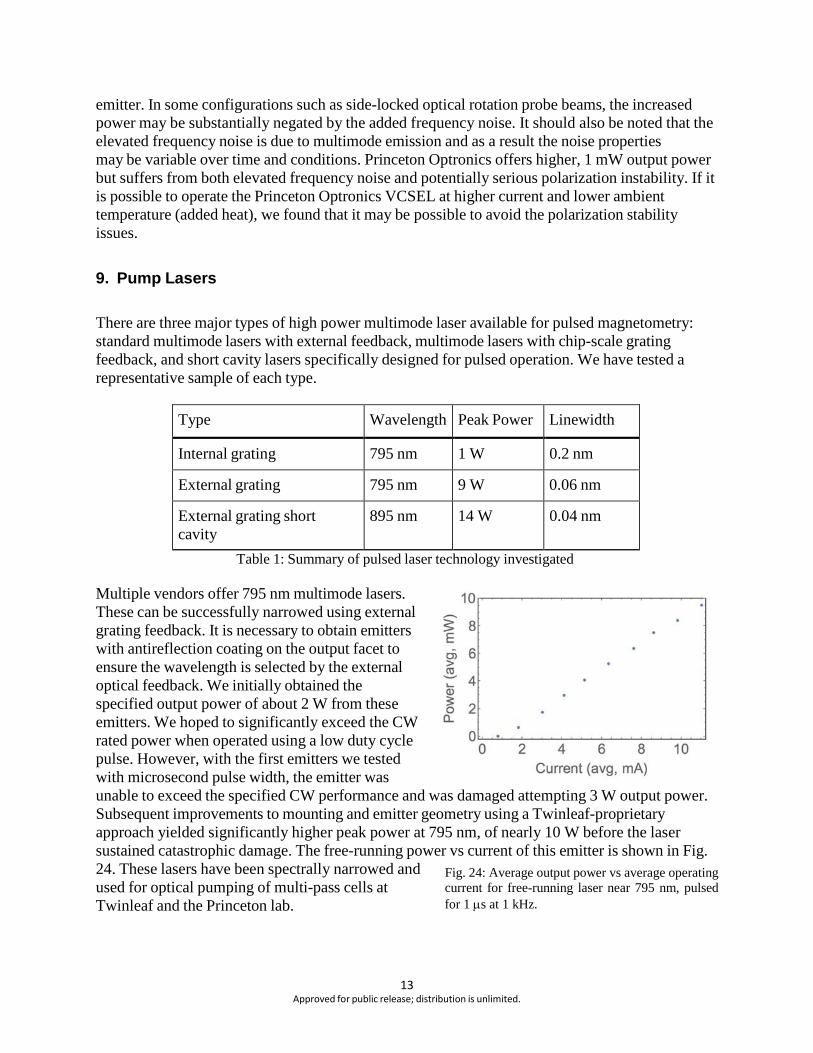
Table 1: Summary of pulsed laser technology investigated Multiple vendors offer 795 nm multimode lasers. These can be successfully narrowed using external grating feedback. It is necessary to obtain emitters with antireflection coating on the output facet to ensure the wavelength is selected by the external optical feedback. We initially obtained the specified output power of about 2 W from these emitters. We hoped to significantly exceed the CW rated power when operated using a low duty cycle pulse. However, with the first emitters we tested with microsecond pulse width, the emitter was unable to exceed the specified CW performance and was damaged attempting 3 W output power. Subsequent improvements to mounting and emitter geometry using a Twinleaf-proprietary approach yielded significantly higher peak power at 795 nm, of nearly 10 W before the laser sustained catastrophic damage. The free-running power vs current of this emitter is shown in Fig. 24. These lasers have been spectrally narrowed and used for optical pumping of multi-pass cells at Twinleaf and the Princeton lab.
Fig. 24: Average output power vs average operating current for free-running laser near 795 nm, pulsed for 1 µs at 1 kHz.
14 Approved for public release; distribution is unlimited.
We obtained a 795 nm multimode laser that employed a wafer-scale grating, apparently written directly on the laser, although more details on construction were not available. The internal grating makes the pump laser module more robust to shock and vibration. At CW, this emitter is specified to produce 3 W of output power. Although CW operation achieved the specified power level, we were surprised to find that the pulsed peak power did not significantly exceed 1 W. Despite this result, this emitter is nonetheless useful for applications that do not demand the highest possible output power. A notable result is that the internal grating laser performed worse than the CW power specification for short pulse current.
Finally, we studied a laser at 895 nm that was specifically designed for pulsed operation. We successfully employed external grating feedback and were able to tune the laser to a cesium resonance. The peak power achieved in mode was an extraordinary 14 W, but we did not yet perform extensive destructive testing to find the performance limits. We anticipate the ideal laser would employ the same pulsed laser design principles at the 795 nm target wavelength.
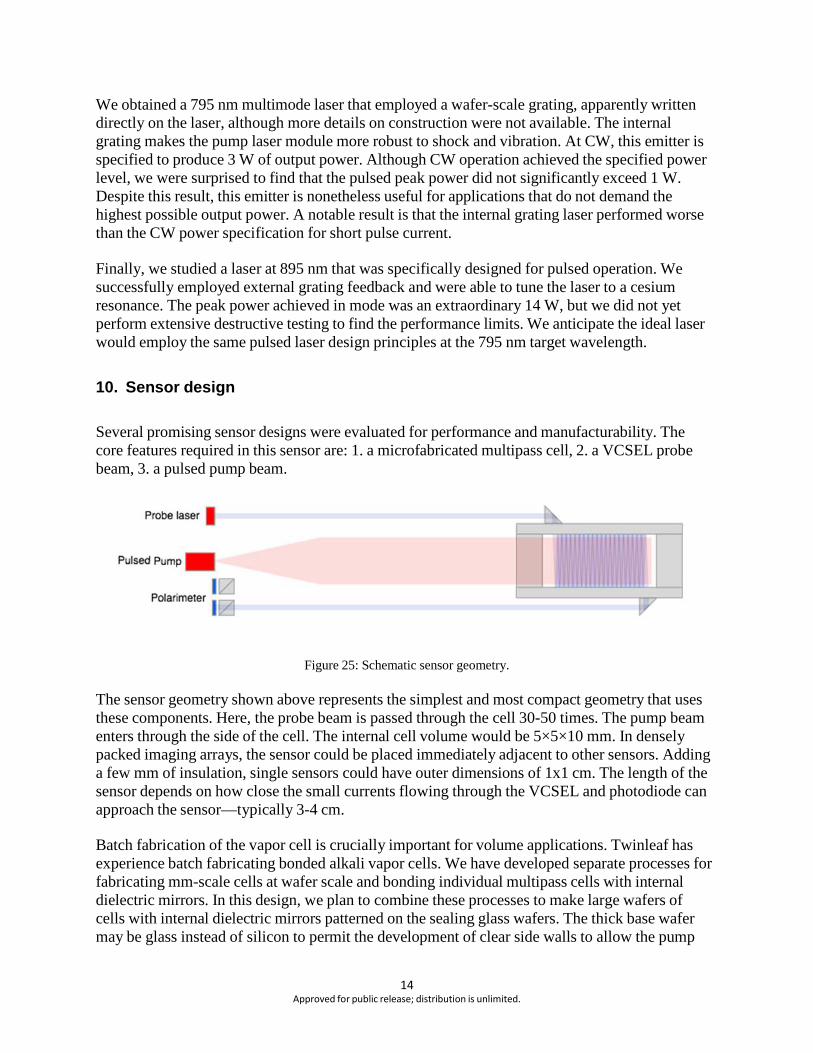
10. Sensor design
Several promising sensor designs were evaluated for performance and manufacturability. The core features required in this sensor are: 1. a microfabricated multipass cell, 2. a VCSEL probe beam, 3. a pulsed pump beam.
Figure 25: Schematic sensor geometry. The sensor geometry shown above represents the simplest and most compact geometry that uses these components. Here, the probe beam is passed through the cell 30-50 times. The pump beam enters through the side of the cell. The internal cell volume would be 5×5×10 mm. In densely packed imaging arrays, the sensor could be placed immediately adjacent to other sensors. Adding a few mm of insulation, single sensors could have outer dimensions of 1x1 cm. The length of the sensor depends on how close the small currents flowing through the VCSEL and photodiode can approach the sensor—typically 3-4 cm.
Batch fabrication of the vapor cell is crucially important for volume applications. Twinleaf has experience batch fabricating bonded alkali vapor cells. We have developed separate processes for fabricating mm-scale cells at wafer scale and bonding individual multipass cells with internal dielectric mirrors. In this design, we plan to combine these processes to make large wafers of cells with internal dielectric mirrors patterned on the sealing glass wafers. The thick base wafer may be glass instead of silicon to permit the development of clear side walls to allow the pump
15 Approved for public release; distribution is unlimited.
laser in. Thick glass wafers are also much less expensive than comparable size FZ silicon. The internal walls may be rendered clear using fire polishing or by using certain deep KOH etch processes before final surface polishing. Alternatively, it may be possible to inject the pump laser along a similar path to the probe laser, as tested for multi-pass cells used by Princeton, without requiring side optical access. Thin silicon bonding wafers may be used to attach the cover glass.
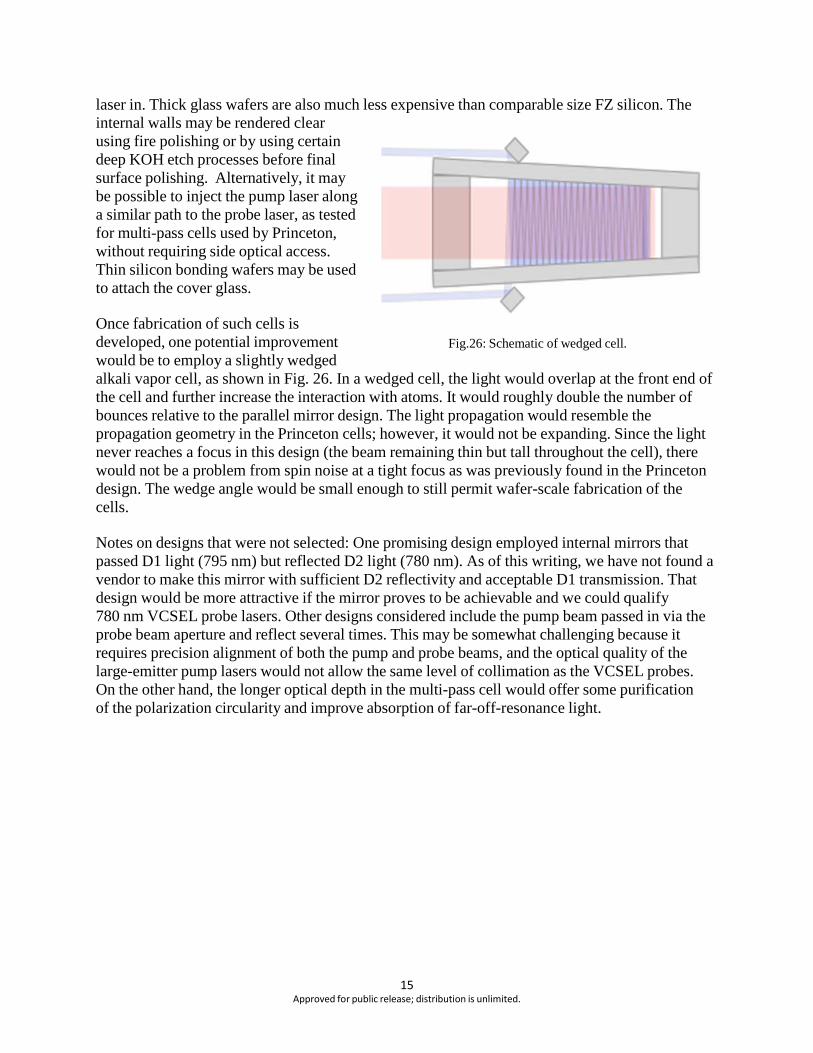
Once fabrication of such cells is developed, one potential improvement would be to employ a slightly wedged
Fig.26: Schematic of wedged cell.
alkali vapor cell, as shown in Fig. 26. In a wedged cell, the light would overlap at the front end of the cell and further increase the interaction with atoms. It would roughly double the number of bounces relative to the parallel mirror design. The light propagation would resemble the propagation geometry in the Princeton cells; however, it would not be expanding. Since the light never reaches a focus in this design (the beam remaining thin but tall throughout the cell), there would not be a problem from spin noise at a tight focus as was previously found in the Princeton design. The wedge angle would be small enough to still permit wafer-scale fabrication of the cells.
Notes on designs that were not selected: One promising design employed internal mirrors that passed D1 light (795 nm) but reflected D2 light (780 nm). As of this writing, we have not found a vendor to make this mirror with sufficient D2 reflectivity and acceptable D1 transmission. That design would be more attractive if the mirror proves to be achievable and we could qualify 780 nm VCSEL probe lasers. Other designs considered include the pump beam passed in via the probe beam aperture and reflect several times. This may be somewhat challenging because it requires precision alignment of both the pump and probe beams, and the optical quality of the large-emitter pump lasers would not allow the same level of collimation as the VCSEL probes. On the other hand, the longer optical depth in the multi-pass cell would offer some purification of the polarization circularity and improve absorption of far-off-resonance light.
11. Conclusions
Over the course of this seedling project we have demonstrated a number of components necessary for development of a practical high-sensitivity magnetometer. We constructed multi-pass cells that utilize the alkali-metal vapor more efficiently than previous designs, we verified the existence of the pump and probe lasers which are mostly sufficient for operation of the magnetometer and we explored the practical challenges of operating a high-performance sensor in the ambient laboratory environment.
12. References [1] D. Sheng, S. Li, N. Dural, and M. V. Romalis, Phys. Rev. Lett. 110, 160802 (2013).
LIST OF ACRONYMS, ABBREVIATIONS, AND SYMBOLS
ACRONYM DESCRIPTION AR Anti-reflective HR High reflectitivity SWAP Size,Weight and Power UV Ultra-violet VBG Volume Bragg Grating VCSEL Vertical Cavity Surface Emitting Diode
16 Approved for public release; distribution is unlimited.