+ All Categories
Home > Documents > After continents divide: comparative ARTICLE phylogeography of

After continents divide: comparative ARTICLE phylogeography of

Date post: 03-Feb-2022
Category:
Upload: others
View: 3 times
Download: 0 times
Share this document with a friend
12
ORIGINAL ARTICLE After continents divide: comparative phylogeography of reef fishes from the Red Sea and Indian Ocean Joseph D. DiBattista 1 *, Michael L. Berumen 2,3 , Michelle R. Gaither 4 , Luiz A. Rocha 4 , Jeff A. Eble 5 , J. Howard Choat 6 , Matthew T. Craig 7 , Derek J. Skillings 1 and Brian W. Bowen 1 1 Hawai’i Institute of Marine Biology, K ane’ohe, HI, 96744, USA, 2 Red Sea Research Center, King Abdullah University of Science and Technology, Thuwal, Saudi Arabia, 3 Biology Department, Woods Hole Oceanographic Institution, Woods Hole, MA, 02543, USA, 4 Section of Ichthyology, California Academy of Sciences, San Francisco, CA, 94118, USA, 5 Department of Biology, University of West Florida, Pensacola, FL, 32514, USA, 6 School of Marine and Tropical Biology, James Cook University, Townsville, QLD, 4811, Australia, 7 Department of Marine Sciences and Environmental Studies, University of San Diego, San Diego, CA, 92110, USA *Correspondence: Joseph D. DiBattista, Hawai’i Institute of Marine Biology, PO Box 1346, K ane’ohe, HI, 96744, USA. E-mail: [email protected] ABSTRACT Aim The Red Sea is a biodiversity hotspot characterized by a unique marine fauna and high endemism. This sea began forming c. 24 million years ago with the separation of the African and Arabian plates, and has been characterized by periods of desiccation, hypersalinity and intermittent connection to the Indian Ocean. We aim to evaluate the impact of these events on the genetic architec- ture of the Red Sea reef fish fauna. Location Red Sea and Western Indian Ocean. Methods We surveyed seven reef fish species from the Red Sea and adjacent Indian Ocean using mitochondrial DNA cytochrome c oxidase subunit I and cytochrome b sequences. To assess genetic variation and evolutionary connec- tivity within and between these regions, we estimated haplotype diversity (h) and nucleotide diversity (p), reconstructed phylogenetic relationships among haplotypes, and estimated gene flow and time of population separation using Bayesian coalescent-based methodology. Results Our analyses revealed a range of scenarios from shallow population structure to diagnostic differences that indicate evolutionary partitions and possible cryptic species. Conventional molecular clocks and coalescence analy- ses indicated time-frames for divergence between these bodies of water ranging from 830,000 years to contemporary exchange or recent range expansion. Col- onization routes were bidirectional, with some species moving from the Indian Ocean to the Red Sea compared with expansion out of the Red Sea for other species. Main conclusions We conclude that: (1) at least some Red Sea reef fauna survived multiple salinity crises; (2) endemism is higher in the Red Sea than previously reported; and (3) the Red Sea is an evolutionary incubator, occa- sionally contributing species to the adjacent Indian Ocean. The latter two con- clusions elevated endemism and species export indicate a need for enhanced conservation priorities for the Red Sea. Keywords Coalescent, cryptic speciation, dispersal, genealogical concordance, gene flow, mitochondrial DNA, vicariance. INTRODUCTION The Red Sea is a deep (maximum depth: 2920 m) and nar- row (maximum width: 350 km) body of water extending 2270 km from 30° N in the Gulf of Suez to 13° N in the Gulf of Aden. Although the sea began forming c. 24 million years ago (Ma) (i.e. late-Oligocene period) by the separation of the African and Arabian plates, the ocean environment that supports coral reefs originated in the early Pleistocene (c. 5 Ma; Siddall et al., 2003; Bosworth et al., 2005). The Red Sea, which now experiences minimal freshwater inflow and high rates of evaporation, is characterized by ª 2013 Blackwell Publishing Ltd http://wileyonlinelibrary.com/journal/jbi 1 doi:10.1111/jbi.12068 Journal of Biogeography (J. Biogeogr.) (2013)
Transcript

ORIGINALARTICLE

After continents divide: comparativephylogeography of reef fishes from theRed Sea and Indian OceanJoseph D. DiBattista1*, Michael L. Berumen2,3, Michelle R. Gaither4,

Luiz A. Rocha4, Jeff A. Eble5, J. Howard Choat6, Matthew T. Craig7,

Derek J. Skillings1 and Brian W. Bowen1

1Hawai’i Institute of Marine Biology,

K�ane’ohe, HI, 96744, USA, 2Red Sea

Research Center, King Abdullah University of

Science and Technology, Thuwal, Saudi

Arabia, 3Biology Department, Woods Hole

Oceanographic Institution, Woods Hole, MA,

02543, USA, 4Section of Ichthyology,

California Academy of Sciences,

San Francisco, CA, 94118, USA, 5Department

of Biology, University of West Florida,

Pensacola, FL, 32514, USA, 6School of

Marine and Tropical Biology, James Cook

University, Townsville, QLD, 4811, Australia,7Department of Marine Sciences and

Environmental Studies, University of San

Diego, San Diego, CA, 92110, USA

*Correspondence: Joseph D. DiBattista,

Hawai’i Institute of Marine Biology, PO Box

1346, K�ane’ohe, HI, 96744, USA.

E-mail: [email protected]

ABSTRACT

Aim The Red Sea is a biodiversity hotspot characterized by a unique marine

fauna and high endemism. This sea began forming c. 24 million years ago with

the separation of the African and Arabian plates, and has been characterized by

periods of desiccation, hypersalinity and intermittent connection to the Indian

Ocean. We aim to evaluate the impact of these events on the genetic architec-

ture of the Red Sea reef fish fauna.

Location Red Sea and Western Indian Ocean.

Methods We surveyed seven reef fish species from the Red Sea and adjacent

Indian Ocean using mitochondrial DNA cytochrome c oxidase subunit I and

cytochrome b sequences. To assess genetic variation and evolutionary connec-

tivity within and between these regions, we estimated haplotype diversity (h)

and nucleotide diversity (p), reconstructed phylogenetic relationships among

haplotypes, and estimated gene flow and time of population separation using

Bayesian coalescent-based methodology.

Results Our analyses revealed a range of scenarios from shallow population

structure to diagnostic differences that indicate evolutionary partitions and

possible cryptic species. Conventional molecular clocks and coalescence analy-

ses indicated time-frames for divergence between these bodies of water ranging

from 830,000 years to contemporary exchange or recent range expansion. Col-

onization routes were bidirectional, with some species moving from the Indian

Ocean to the Red Sea compared with expansion out of the Red Sea for other

species.

Main conclusions We conclude that: (1) at least some Red Sea reef fauna

survived multiple salinity crises; (2) endemism is higher in the Red Sea than

previously reported; and (3) the Red Sea is an evolutionary incubator, occa-

sionally contributing species to the adjacent Indian Ocean. The latter two con-

clusions – elevated endemism and species export – indicate a need for

enhanced conservation priorities for the Red Sea.

Keywords

Coalescent, cryptic speciation, dispersal, genealogical concordance, gene flow,

mitochondrial DNA, vicariance.

INTRODUCTION

The Red Sea is a deep (maximum depth: 2920 m) and nar-

row (maximum width: 350 km) body of water extending

2270 km from 30° N in the Gulf of Suez to 13° N in the

Gulf of Aden. Although the sea began forming c. 24 million

years ago (Ma) (i.e. late-Oligocene period) by the separation

of the African and Arabian plates, the ocean environment

that supports coral reefs originated in the early Pleistocene

(c. 5 Ma; Siddall et al., 2003; Bosworth et al., 2005). The

Red Sea, which now experiences minimal freshwater inflow

and high rates of evaporation, is characterized by

ª 2013 Blackwell Publishing Ltd http://wileyonlinelibrary.com/journal/jbi 1doi:10.1111/jbi.12068

Journal of Biogeography (J. Biogeogr.) (2013)

pronounced north-to-south gradients in salinity (42& to

37&), sea surface temperature (winter, 20–28 °C; summer,

26–32 °C), and nutrient concentration (low to high) (Raitsos

et al., 2011; Ngugi et al., 2012). Oceanographic current pat-

terns and climate in the southern Red Sea (and Gulf of

Aden) are heavily influenced by the northern Indian Ocean

monsoon system (Smeed, 1997, 2004; Biton et al., 2010),

which reverses wind circulation patterns in the boreal sum-

mer (Southwest Monsoon, April to October) compared to

those in the winter (Northeast Monsoon, December to

March; see Fig. 1).

Despite its peripheral location relative to the Indo-Pacific,

the Red Sea is characterized by high biodiversity, including

c. 300 reef-building corals (mostly species of Acropora and

Porites; Sheppard & Sheppard, 1991; Riegl & Velimirov,

1994) and 1078 fish species (Golani & Bogorodsky, 2010),

which represent key resources for coastal communities. Spe-

cies richness appears to be highest in the central Red Sea,

with marked decreases in species abundance and changes in

species composition away from this area (DeVantier et al.,

2000). The Red Sea also harbours one of the highest degrees

of endemism for marine organisms, making up 14% of fishes

(Randall, 1994), 33% of crustaceans, 15% of echinoderms,

and up to 25% of corals (Cox & Moore, 2000). Endemism

can be even higher for some taxa, reaching 50% in the but-

terflyfishes (Roberts et al., 1992).

Although the evolutionary processes driving high rates of

endemism are unclear, the narrow (18 km) and shallow

(137 m) strait of the Bab al Mandab, the only connection

with the Indian Ocean, is likely to have played a key role

(Klausewitz, 1989). The Red Sea was repeatedly isolated dur-

ing Pleistocene glacial cycles when the sea level lowered as

much as 120 m; whether this was achieved through physical

isolation or the restriction of oceanic flow associated with

elevated salinity and temperature remains contentious (Sid-

dall et al., 2003; Bailey, 2009). Moreover, cold-water welling

up off Somalia, which precludes reef formation on the

north-east African and southern Arabian coasts, is likely to

reinforce this isolation (Smeed, 1997; Kemp, 1998, 2000).

Some authors believe that the Bab al Mandab no longer acts

as a physical barrier to dispersal but that an ecological bar-

rier lies within the Red Sea (Ormond & Edwards, 1987).

Roberts et al. (1992) suggested that a turbid-water region

south of 20° N in the Red Sea may limit larval dispersal, a

Thuwal (a-g)Al Lith (a-g) Oman (b)

Seychelles (a-f )Diego Garcia (a-g)

Sodwana Bay (e)

SEC

SECC

NECSMC

SC

EACC

WICC

23.5ºN

23.5ºS

(a) (b)

(c)

(d)

(e)

(g)(f)

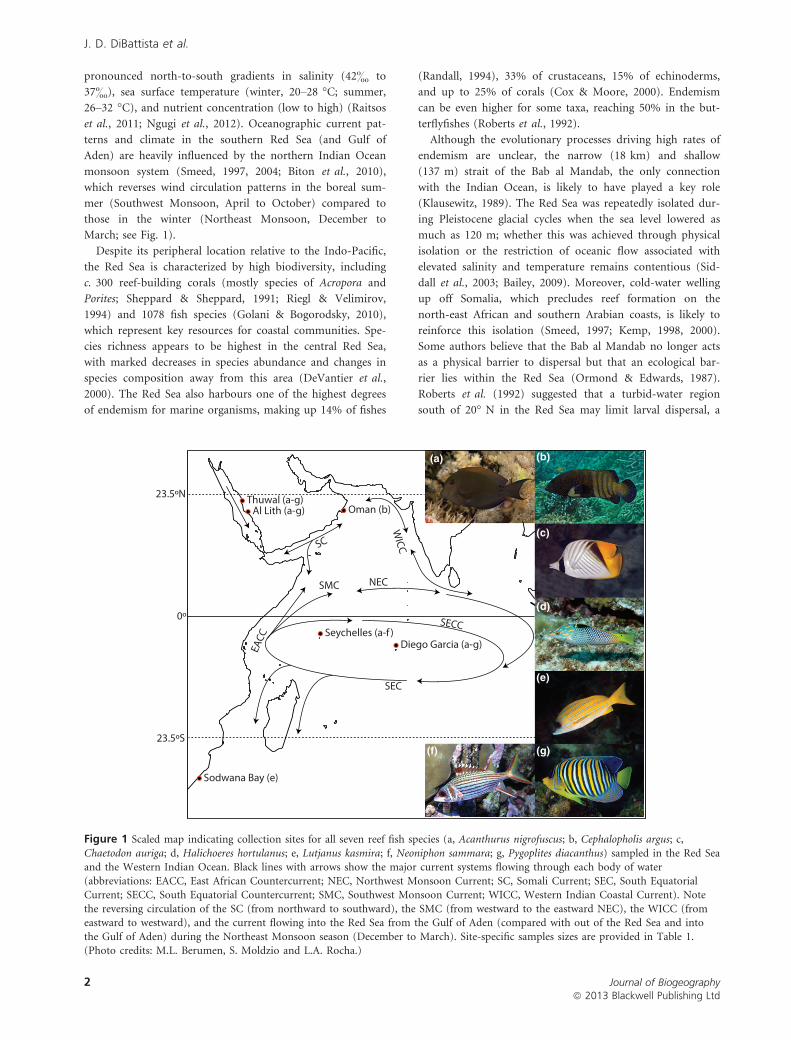
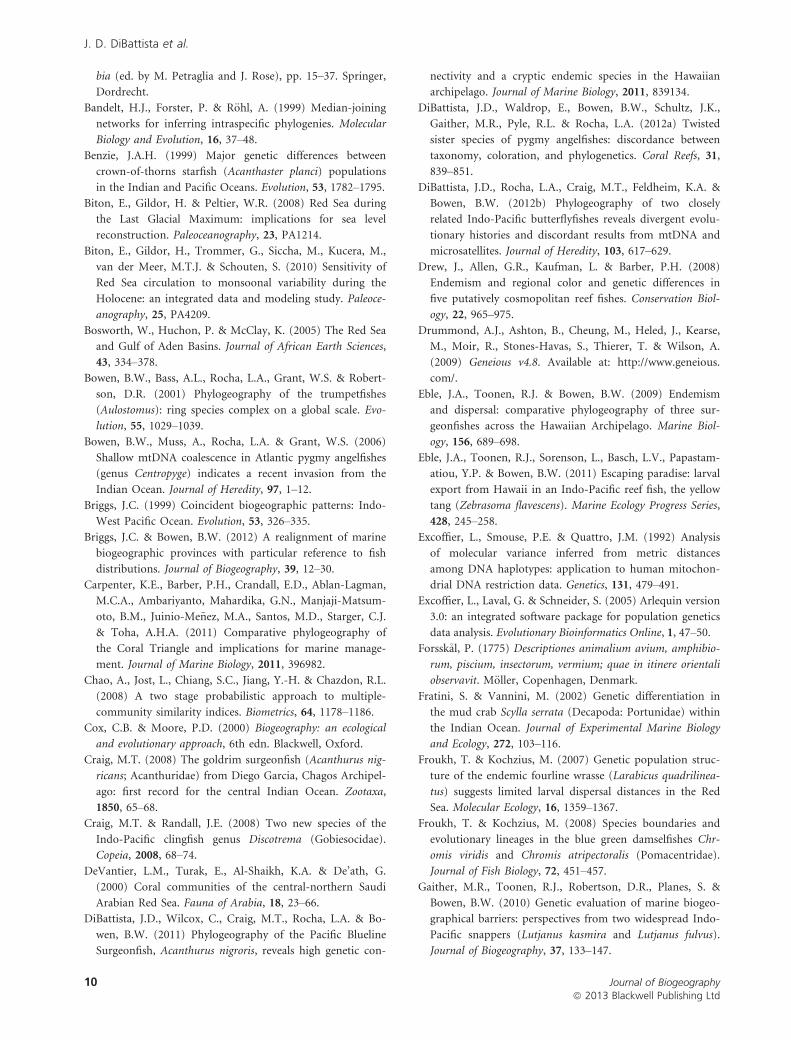
Figure 1 Scaled map indicating collection sites for all seven reef fish species (a, Acanthurus nigrofuscus; b, Cephalopholis argus; c,

Chaetodon auriga; d, Halichoeres hortulanus; e, Lutjanus kasmira; f, Neoniphon sammara; g, Pygoplites diacanthus) sampled in the Red Seaand the Western Indian Ocean. Black lines with arrows show the major current systems flowing through each body of water

(abbreviations: EACC, East African Countercurrent; NEC, Northwest Monsoon Current; SC, Somali Current; SEC, South EquatorialCurrent; SECC, South Equatorial Countercurrent; SMC, Southwest Monsoon Current; WICC, Western Indian Coastal Current). Note

the reversing circulation of the SC (from northward to southward), the SMC (from westward to the eastward NEC), the WICC (fromeastward to westward), and the current flowing into the Red Sea from the Gulf of Aden (compared with out of the Red Sea and into

the Gulf of Aden) during the Northeast Monsoon season (December to March). Site-specific samples sizes are provided in Table 1.(Photo credits: M.L. Berumen, S. Moldzio and L.A. Rocha.)

Journal of Biogeographyª 2013 Blackwell Publishing Ltd

2

J. D. DiBattista et al.

hypothesis which is supported by the presence of a number

of species in the northern/central Red Sea and the Gulf of

Aden (just outside the Red Sea) that are absent from the

southern Red Sea.

Despite being acknowledged as a biodiversity hotspot for

coral reef fishes based on research dating back more than

200 years (e.g. Forssk�al, 1775), little work has been con-

ducted in the Red Sea using modern genetic techniques.

Studies in this region tend to focus on the biogeography and

community structure of the more iconic (and endemic)

shore fish fauna (e.g. family Chaetodontidae; Righton et al.,

1996). The majority of genetic studies on reef fishes have

been restricted to the Gulf of Aqaba and northern Red Sea

(Hassan et al., 2003; Kochzius & Blohm, 2005; but see

Froukh & Kochzius, 2007), and few of these considered the

connections between widespread taxa and other biogeograph-

ical provinces, particularly the Indian Ocean (Froukh &

Kochzius, 2008).

Peripheral reef habitats such as the Red Sea, which forms

the north-westernmost extension of the Indian Ocean, are

typically considered to be biodiversity sinks that receive spe-

cies from elsewhere but rarely export them (Briggs, 1999).

The accepted paradigm is therefore that biogeographical

sinks are ‘evolutionary graveyards’ that do not contribute to

biodiversity at neighbouring sites. Recent research on reef

fish and invertebrates, however, demonstrate that peripheral

regions, such as the Hawaiian Archipelago and the Marque-

sas Islands, may act as both a sink and a source, contributing

unique genetic lineages to other regions of the Indo-Pacific

(Gaither et al., 2010, 2011; DiBattista et al., 2011; Eble et al.,

2011; Skillings et al., 2011).

Our first aim is to assess connections between fauna in

the Red Sea and the adjacent Western Indian Ocean

(WIO) using a molecular genetic approach. The WIO

forms a biogeographical subdivision of the tropical Indo-

Pacific stretching from East Africa to the Chagos Ridge in

the centre of the Indian Ocean (Sheppard, 2000; Briggs &

Bowen, 2012). Phylogeographical inferences are strength-

ened by congruence among multiple species and genes, and

so our study considers seven species of reef fish with wide-

spread distributions, using two mitochondrial DNA

(mtDNA) markers.

Our second aim is to assess whether sea level changes

have influenced extant biodiversity by estimating migration

rates and divergence times of reef fishes in the Red Sea and

WIO. Such analyses will allow us to discriminate between

the following scenarios: (1) Red Sea populations represent

long-isolated relicts derived from the WIO, which implies

gene flow was absent over the last 5 Myr; (2) Red Sea pop-

ulations have been isolated from the WIO over evolutionary

intervals but with recurrent gene flow; or (3) Red Sea pop-

ulations are the result of recent colonization from the

WIO, since the Last Glacial Maximum c. 20,000 years ago

(Siddall et al., 2003; Bailey, 2009). This dataset provides an

unprecedented opportunity to assess the relationships

between two Indian Ocean biogeographical provinces, and

thereby illuminate evolutionary processes that are the well-

spring of Red Sea biodiversity.

MATERIALS AND METHODS

Sample collection

Reef fish were collected while SCUBA diving or snorkelling

at depths of 1–40 m between 2002 and 2011 (Fig. 1,

Table 1). Seven reef fish species were targeted: the brown

surgeonfish, Acanthurus nigrofuscus (Forssk�al, 1775); the pea-

cock hind, Cephalopholis argus Schneider, 1801; the threadfin

butterflyfish, Chaetodon auriga Forssk�al, 1775; the checker-

board wrasse, Halichoeres hortulanus (Lacep�ede, 1801); the

bluestripe snapper, Lutjanus kasmira (Forssk�al, 1775); the

Sammara squirrelfish, Neoniphon sammara (Forssk�al, 1775);

and the regal angelfish, Pygoplites diacanthus (Boddaert,

1772). These species were chosen because they have wide

Indo-Pacific distributions, are abundant, represent a diversity

of taxonomic families, and can be unequivocally identified

in the field. Each species was sampled at two locations (Thu-

wal and Al Lith) off the coast of the Kingdom of Saudi Ara-

bia (KSA) in the central Red Sea, and at one to three sites

in the WIO (oceanic sites: Diego Garcia in the Chagos

Archipelago and the Republic of Seychelles; coastal sites:

Sodwana Bay, South Africa and Al Hallaniyat, Sultanate of

Oman). Because some of the collections were opportunistic,

not every species could be sampled at every location (Fig. 1,

Table 1).

Mitochondrial DNA sequencing

Tissue samples were preserved in salt-saturated DMSO (Seu-

tin et al., 1991). Total genomic DNA was extracted using the

‘HotSHOT’ protocol (Meeker et al., 2007) and subsequently

stored at �20 °C. Fragments of mtDNA from the cyto-

chrome c oxidase subunit I (COI) and cytochrome b (cyt b)

genes were amplified using either previously published prim-

ers or modified primers designed for individual species

(Table 1). These two markers were chosen because they: (1)

are easy to amplify in most fish; (2) are generally variable at

the population level; (3) facilitate comparisons with pub-

lished sequences; and (4) have had molecular clock rates esti-

mated based on reef fishes (Bowen et al., 2001; Lessios, 2008;

Reece et al., 2010). Polymerase chain reaction (PCR) was

carried out for all species as described in DiBattista et al.

(2012a), with optimal annealing temperatures listed in

Table 1. All samples were sequenced in the forward direction

(and reverse direction for unique or questionable haplotypes)

with fluorescently labelled dye terminators (BigDye version

3.1, Applied Biosystems, Foster City, CA, USA) and analysed

using an ABI 3130xl Genetic Analyzer (Applied Biosystems).

The sequences were aligned, edited and trimmed to a uni-

form length using Geneious Pro 4.8.4 (Drummond et al.,

2009); unique mtDNA haplotypes were deposited in Gen-

Bank (accession numbers: KC187734–KC188056).

Journal of Biogeographyª 2013 Blackwell Publishing Ltd

3

Phylogeography of Red Sea reef fishes

Genetic diversity and population structure

Arlequin 3.5 (Excoffier et al., 2005) was used to calculate

haplotype and nucleotide diversity (h and p, respectively),

and to test for population structure among sampling sites

for each species and molecular marker (i.e. 14 total datasets).

These analyses were repeated with all Red Sea or WIO sam-

ples pooled into two separate regions. Despite the difference

in the geographical scale of sampling (Red Sea sites,

c. 300 km; WIO sites, c. 1000s of km), preliminary work

suggests that the Red Sea haplotypes at Thuwal and Al Lith

are consistent with those sampled up to 1200 km north

(J.D.D., unpublished data), indicating unbiased estimates of

genetic diversity within our study range. Because jModel-

Test 0.1.1 (Posada, 2008) converged on different models of

nucleotide sequence evolution among datasets, we calculated

global and pairwise ΦST values based on a HKY model of

mutation (Hasegawa et al., 1985). We also ran conventional

frequency-based FST, but the absolute values changed little

and relative values did not change at all; we have therefore

elected to report pairwise ΦST. Global ΦST was estimated

using analysis of molecular variance (AMOVA; Excoffier

et al., 1992); deviations from null distributions were tested

with nonparametric permutation procedures (n = 99,999).

We controlled for false discovery rate with the method of

Narum (2006), and negative pairwise ΦST values were con-

verted to zeros. To facilitate comparisons among species, an

additional diversity measure – Jost’s D (Jost, 2008) – was

estimated using spade 1.0 (Chao et al., 2008).

The evolutionary relationship among COI or cyt b haplo-

types was resolved for each species with unrooted networks

constructed with the program network 4.5.1.0 (http://www.

fluxus-engineering.com/network_terms.htm) using a median-

joining algorithm and default settings (as per Bandelt et al.,

1999).

IMA2 analysis

We calculated the effects of time and gene flow on genetic

divergence between populations using Bayesian coalescent-

based estimation with IMa2 8.26.11 (Hey & Nielsen, 2007;

Hey, 2010). Using F-statistics we determined that samples

within regions were not significantly different for all seven

species after correction for multiple comparisons. We there-

fore pooled the Red Sea sites together and the WIO sites

together, for comparisons between regions for each species

and molecular marker.

The isolation-with-migration model implemented in IMa2

assumes that two populations of effective size N1 and N2

diverged from an ancestral population (of effective size Na)

Table 1 Study species, number of specimens, fragment length, primers used, and annealing temperatures for mitochondrial DNA

cytochrome c oxidase subunit I (COI) and cytochrome b (cyt b) genes. DNA sequences from each primary collection location (Al Lith,Thuwal, Diego Garcia, and the Republic of Seychelles; see text) are described, along with collections made opportunistically at additional

locations in the Western Indian Ocean (WIO). All haplotypes are available online in GenBank (accession numbers: KC187734–KC188056).

Species

Molecular sequence data

DNA

fragment

Fragment

length (bp)

Red Sea WIO

Other

sites (n) Primer set

Annealing

temp. (°C)Al

Lith Thuwal

Diego

Garcia Seychelles

Acanthurus nigrofuscus

(brown surgeonfish)

COI 634 22 27 31 31 – Fish F2–Fish R2 (1) 50

cyt b 683 22 28 31 30 – Cyb9–Cyb7 (2,3) 58

Cephalopholis argus

(peacock hind)

COI 537 26 19 24 10 Oman (8) Fish F2–Fish R2 (1) 56

cyt b 618 27 22 32 13 Oman (9) CB6F–CB6R (4) 54

Chaetodon auriga

(threadfin butterflyfish)

COI 625 27 20 33 30 – Fish F2–Fish R2 (1) 52

cyt b 670 27 20 33 30 – Cyb9–Cyb7 (2,3) 56

Halichoeres hortulanus

(checkerboard wrasse)

COI 589 25 27 20 28 – Fish F2–Fish R2 (1) 50

cyt b 692 25 27 27 22 – Cyb9–Cyb7 (2,3) 50

Lutjanus kasmira

(bluestripe snapper)

COI 606 21 22 33 20 Sodwana

Bay (34)

Fish F2–Fish R2 (1) 56

cyt b 475 23 23 34 19 Sodwana

Bay (34)

H15020–Cyb5 (5,3) 48

Neoniphon sammara

(Sammara squirrelfish)

COI 611 20 31 30 28 – Fish F2–Fish R2 (1) 50

cyt b 508 20 31 29 38 – NSAFOR4–NSAREV4* 60

Pygoplites diacanthus

(regal angelfish)

COI 634 24 23 33 – – Fish F2–Fish R2 (1) 50

cyt b 640 24 23 32 – – PydCytbF3–PydCytbR4* 50

*We designed two novel primer sets to amplify and sequence cyt b for Neoniphon sammara and Pygoplites diacanthus. Their sequences were as

follows:

NSAFOR4: 5′-TGC CGT GAC GTA AAC TAT GG-3′; NSAREV4: 5′-TGA AGT TGT CGG GAT CTC CT-3′; PydCytbF3: 5′-ATG GCA AAC TTA

CGC AAA ACC-3′; PydCytbR4: 5′-GGC TGG TGT GAA GTT GTC-3′.

References: (1) Ward et al., 2005; (2) Song et al., 1998; (3) Taberlet et al., 1992; (4) Gaither et al., 2010; (5) Meyer, 1994.

Journal of Biogeographyª 2013 Blackwell Publishing Ltd

4

J. D. DiBattista et al.

at time t, and then exchanged migrants at rates m1 and m2.

We therefore estimated the time since initial separation or

last major colonization event (t), effective population size

(Ne), and the proportion of migrants arriving into a popula-

tion per generation (m); all demographic parameters were

scaled by mutation rate.

Mutation rates calibrated in other reef fish based on the

closure of the Isthmus of Panama range from 1% to 2%

per million years for COI and cyt b (Bowen et al., 2001;

Lessios, 2008; Reece et al., 2010). We used a conservative

estimate of 1.3 9 10�8 mutations per site per year for both

markers (see Lessios, 2008) under a HKY model and a 0.25

inheritance scalar appropriate for mtDNA. An MCMC chain

with a length of 1,000,000 sampled every 100 generations

with 10% burn-in was used to estimate parameters for each

species–gene combination. Five independent runs were com-

puted to ensure convergence. The independent runs were

subsampled and combined using the ‘L’ mode of IMa2, and

the median values of the parameter distributions for the

combined runs are presented here. For N. sammara (COI)

and P. diacanthus (COI and cyt b), which shared almost no

haplotypes between regions, prior values of m in both direc-

tions were set to zero. Although we regard all absolute

parameter estimates with caution given that our data consist

of two linked loci, and we apply mutation rates calibrated

in other reef fishes, relative comparisons among species are

likely to be robust to such approximations (Karl et al.,

2012).

RESULTS

Genetic diversity and population structure

COI and cyt b sequence data revealed divergent patterns of

genetic diversity and population structure among the seven

sampled reef fish species. Haplotype (h) and nucleotide (p)diversity was higher in four out of the seven species in the

WIO than in the Red Sea for COI, and in five out of the

seven species for cyt b when populations within each region

were pooled (Fig. 2, and see Appendix S1 in Supporting

Information). This trend cannot be explained by a greater

sampling effort in the WIO, given that species with compara-

ble sample sizes for each region, such as Cephalopholis argus

and P. diacanthus, still had lower genetic diversity in the Red

Sea.

AMOVA supported the geographical grouping of sites into

Red Sea and WIO regions (Table 2). Although there was

some variability in genetic differentiation among sampling

sites between regions (Appendix S2), six out of the seven

species showed significant genetic structure for at least one

of the molecular markers (Table 2).

Population pairwise tests were significantly different in 22

(for COI) or 16 (for cyt b) out of 47 comparisons (all

P < 0.01); all significant comparisons were between regions

rather than between sites within regions, and ranged from

0.07 to 0.67 for ΦST and 0.05 to 1.00 for Jost’s D (Fig. 3,

Appendix S2). Estimates of genetic differentiation across all

species were correlated between molecular markers

(nonparametric Spearman’s rank correlation: ΦST, r = 0.77,

P < 0.001, n = 47; Jost’s D, r = 0.57, P < 0.001, n = 47),

although the larger spread of Jost’s D values than ΦST values

is probably related to the former not being constrained by

within-site heterozygosity. Pairwise genetic differentiation-

based ΦST and Jost’s D were also significantly correlated

across all datasets (nonparametric Spearman’s rank correla-

tion coefficient: COI, r = 0.67, P < 0.001; cyt b, r = 0.83,

P < 0.001).

As expected from the ΦST values, the median-joining

networks show more shared COI or cyt b haplotypes

between collection sites within the Red Sea and WIO than

between these regions (Fig. 4). The only exception to this

pattern was the high proportion of haplotypes shared

between Al Lith or Thuwal (Red Sea) and Oman (WIO)

for Cephalopholis argus. Even though our comparisons

between Oman and other sites should be viewed with cau-

tion, given that these are based on data from only a single

species (C. argus) with a low sample size (n = 8 or 9),

0.00

0.20

0.40

0.60

0.80

1.00

0.00 0.20 0.40 0.60 0.80 1.00

Red

Sea

hap

loty

pe d

iver

sity

(h)

WIO haplotype diversity (h)

(a)

0.000

0.002

0.004

0.006

0.008

0.010

0.000 0.002 0.004 0.006 0.008 0.010WIO nucleotide diversity (π)

Red

Sea

nuc

leot

ide

dive

rsity

(π) (b)

COIcyt b

COIcyt b

Figure 2 The relationship between (a) haplotype diversity (h)

or (b) nucleotide diversity (p) estimated for mitochondrial DNAcytochrome c oxidase subunit I (COI; black filled circles) and

cytochrome b (cyt b; open circles) genes in the Red Sea versus

Western Indian Ocean (WIO) populations of species consideredin this study. The black dashed line represents a line of unity,

which is the point at which genetic diversity estimates in theRed Sea and WIO are equal within a species. Data points above

the line of unity indicate greater genetic diversity in the Red Sea,whereas points falling below the line indicate greater genetic

diversity in the WIO.

Journal of Biogeographyª 2013 Blackwell Publishing Ltd

5

Phylogeography of Red Sea reef fishes

some endemic Red Sea fauna do extend to the Omani

coast (e.g. Cirrhitus spilotoceps, M.R.G. & J.E. Randall,

Bishop Museum, unpublished data).

IMA2 analysis

The estimated times since initial separation between the Red

Sea and WIO populations for the seven reef fish species ran-

ged from c. 21,000 to 830,000 years (Table 3). Recent separa-

tions of < 100,000 years were apparent for Chaetodon auriga

and H. hortulanus, older separations of 100,000–

300,000 years were apparent for A. nigrofuscus, Cephalopholis

argus, L. kasmira and N. sammara, and finally P. diacanthus

populations have been isolated for 660,000–830,000 years. Of

the older separations, L. kasmira was characterized by high

subsequent gene flow, whereas gene flow was restricted for

N. sammara (and P. diacanthus); these two species also have

the highest level of divergence between the Red Sea and

WIO based on ΦST (Table 2). Differences among species in

both the timing of initial divergence and subsequent migra-

tion rates reveal considerable variation in the link between

Red Sea and WIO populations.

The direction of migration varied among species. For

example, a higher proportion of migrants moved from the

WIO into the Red Sea for H. hortulanus, whereas L. kasmira

moved predominantly out of the Red Sea (Table 3). For the

remaining species, gene flow was low in both directions, or

driven by differences in effective population size, indicating

no bias in effective migration between regions.

DISCUSSION

This study demonstrates barriers to gene flow between the

Red Sea and WIO for some reef fish species, but an

apparent lack of phylogeographical breaks for others, which

may reflect the volatile geological history of the Red Sea

region.

The Red Sea is a marginal water mass whose movement in

the upper layers is driven by the summer and winter

Table 2 Analysis of molecular variance (AMOVA; Excoffier et al., 1992) comparing variation between the Red Sea and Western Indian

Ocean populations of reef fish based on mitochondrial DNA cytochrome c oxidase subunit I (COI) and cytochrome b (cyt b) genes.Site-specific samples sizes are shown in Table 1.

Species

DNA

fragment

Percentage variation

Overall ΦST P Jost’s D (SE)

Within

populations

Between

populations Between regions

Acanthurus nigrofuscus

(brown surgeonfish)

COI 76.58 0.25 23.18 0.23 < 0.001 0.59 (0.051)

cyt b 87.96 �0.64 12.68 0.12 < 0.001 0.21 (0.087)

Cephalopholis argus

(peacock hind)

COI 72.45 �0.31 27.86 0.28 < 0.001 0.13 (0.088)

cyt b 77.59 1.02 21.39 0.22 < 0.001 0.13 (0.060)

Chaetodon auriga

(threadfin butterflyfish)

COI 80.35 �1.80 21.45 0.20 < 0.001 0.087 (0.041)

cyt b 98.48 �0.44 1.96 0.015 0.12 0.021 (0.022)

Halichoeres hortulanus

(checkerboard wrasse)

COI 97.30 2.60 0.10 0.027 0.071 0.041 (0.019)

cyt b 95.44 1.08 3.48 0.046 0.045 0.078 (0.088)

Lutjanus kasmira

(bluestripe snapper)

COI 100.11 �1.30 1.20 0 0.83 0.006 (0.023)

cyt b 98.88 �0.46 1.58 0.011 0.23 0.090 (0.059)

Neoniphon sammara

(Sammara squirrelfish)

COI 66.03 �0.33 34.30 0.34 < 0.001 0.68 (0.038)

cyt b 70.28 �0.69 30.41 0.30 < 0.001 0.59 (0.060)

Pygoplites diacanthus

(regal angelfish)

COI 30.61 �1.17 70.57 0.69 < 0.001 0.61 (0.015)

cyt b 65.00 �2.30 37.30 0.35 < 0.001 0.60 (0.027)

-0.2

0.0

0.2

0.4

0.6

0.8

1.0

1.2

-0.2 0.0 0.2 0.4 0.6 0.8 1.0 1.2

Pairwise genetic differentiation (COI)

tyc(noitaitnereffid

citenegesi

wriaPb) RS versus RS FST

RS versus WIO FST

WIO versus WIO FST

RS versus RS Jost’s D

RS versus WIO Jost’s D

WIO versus WIO Jost’s D

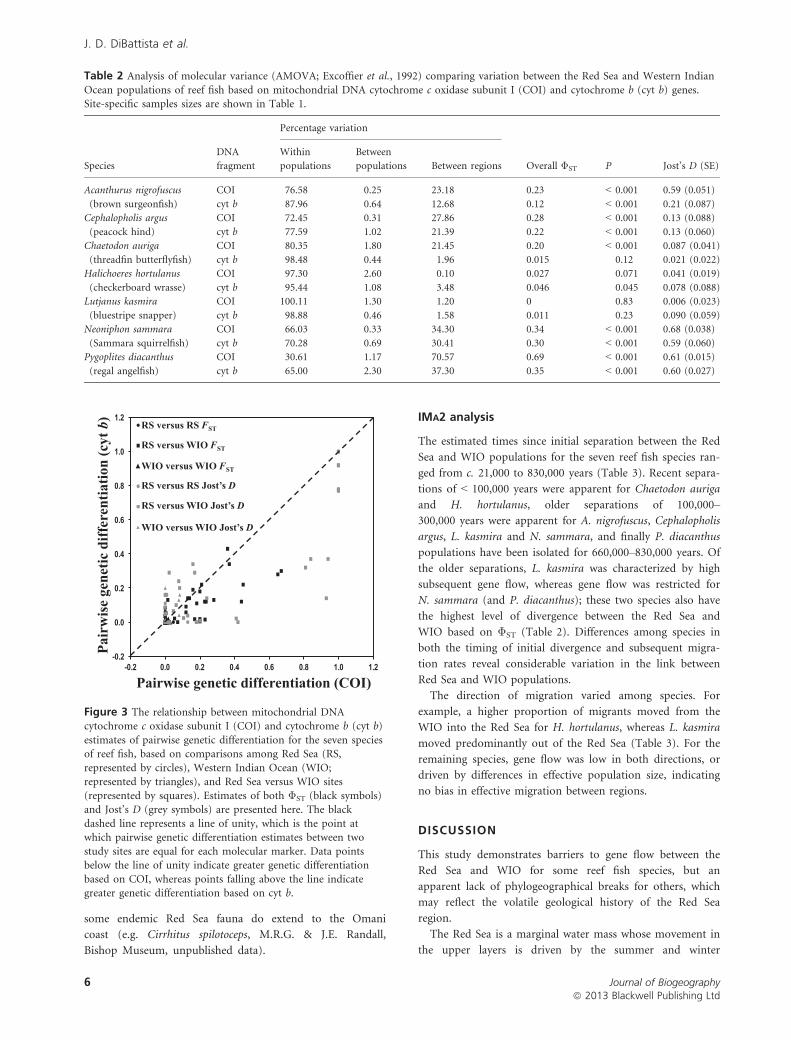
Figure 3 The relationship between mitochondrial DNAcytochrome c oxidase subunit I (COI) and cytochrome b (cyt b)

estimates of pairwise genetic differentiation for the seven speciesof reef fish, based on comparisons among Red Sea (RS,

represented by circles), Western Indian Ocean (WIO;represented by triangles), and Red Sea versus WIO sites

(represented by squares). Estimates of both ΦST (black symbols)and Jost’s D (grey symbols) are presented here. The black

dashed line represents a line of unity, which is the point atwhich pairwise genetic differentiation estimates between two

study sites are equal for each molecular marker. Data pointsbelow the line of unity indicate greater genetic differentiation

based on COI, whereas points falling above the line indicategreater genetic differentiation based on cyt b.

Journal of Biogeographyª 2013 Blackwell Publishing Ltd

6

J. D. DiBattista et al.

monsoons acting through a restricted connection with the

adjacent Gulf of Aden (Siddall et al., 2004; Biton et al.,

2008). During each glacial maximum of the Pleistocene, the

last characterized by a 120-m drop in sea level only

20,000 years ago, the inflow pattern and exchange of surface

water was limited, owing to the shallow sill at the Bab al

Mandab – the only natural gateway into the Red Sea (Siddall

et al., 2003). As a result, throughout these periods of isola-

tion, increased evaporation may have raised temperature and

salinity levels higher than most reef fishes can tolerate (e.g.

> 50&; Biton et al., 2008), resulting in periods of reduced

planktonic (i.e. larval) development (Hemleben et al., 1996),

and causing mass extirpation within the Red Sea (Sheppard

et al., 1992; but see Klausewitz, 1989).

In addition to intermittent historical barriers created by

Pleistocene glacial cycles, contemporary barriers exist. The

lack of coral habitat along the 2200-km coastline from Dji-

bouti to southern Somalia may inhibit gene flow between

the Red Sea and WIO by limiting opportunities for stepping-

stone dispersal (Kemp, 1998). Within the Red Sea, the exten-

sive turbid-water region south of 20° N may also inhibit

larval dispersal or settlement (Ormond & Edwards, 1987;

Roberts et al., 1992). The long-term persistence and age of

these contemporary barriers, however, is uncertain.

Most genetic work on reef fishes within the Red Sea has

focused on the differentiation of fauna between the Gulf of

Aqaba and northern Red Sea, with some notable exceptions.

Froukh & Kochzius (2008) identified a damselfish in the Red

Sea (Chromis viridis) as being distinct from conspecifics in

Indonesia and the Philippines based on mtDNA sequences.

Similar research on marine invertebrates (Acanthaster planci:

Benzie, 1999; Scylla serrata: Fratini & Vannini, 2002) support

a genetic distinction of the Red Sea populations. In contrast,

Kochzius & Blohm (2005) found no mtDNA differentiation

between lionfish (Pterois miles) populations in the Red Sea

and Indian Ocean.

Five of the seven species we examined were genetically dif-

ferentiated between the Red Sea and WIO based on AMOVA

and median-joining networks. Halichoeres hortulanus and

L. kasmira had minimal or inconsistent genetic differentia-

tion, as well as extensive mixing of haplotypes within and

between regions. Acanthurus nigrofuscus, Cephalopholis argus

and Chaetodon auriga had modest differentiation between

regions with pronounced separation of peripheral haplotypes,

but shared a common haplotype among all sampling sites.

Neoniphon sammara and Pygoplites diacanthus had fixed dif-

ferences between regions.

Variability in genetic signatures can occur even among

closely related species (Rocha et al., 2002; Gaither et al.,

2010; DiBattista et al., 2012b) and may be related to innate

differences in life history or ecological preferences, although

these widely distributed species are all presumably capable of

long-distance dispersal (e.g. Eble et al., 2009, 2011; Gaither

et al., 2010, 2011) based on available estimates of pelagic lar-

val duration (range: 24–48 days; Thresher & Brothers, 1985;

Victor, 1986; Wilson & McCormick, 1999) and longitudinal

range size (range: 20,063–21,689 km; Randall, 1999, 2005).

Indeed, our study species cover a wide spectrum of dietary

modes ranging from herbivory (A. nigrofuscus) to specialist

feeding on sessile or mobile invertebrates (Chaetodon auriga,

Acanthurus nigrofuscus

Cephalopholis argus

Chaetodon auriga

Halichoeres hortulanus

Lutjanus kasmira

Neoniphon sammara

Pygoplites diacanthus

Al LithThuwal

Oman

Diego GarciaSeychelles

Sodwana Bay

COI cyt b

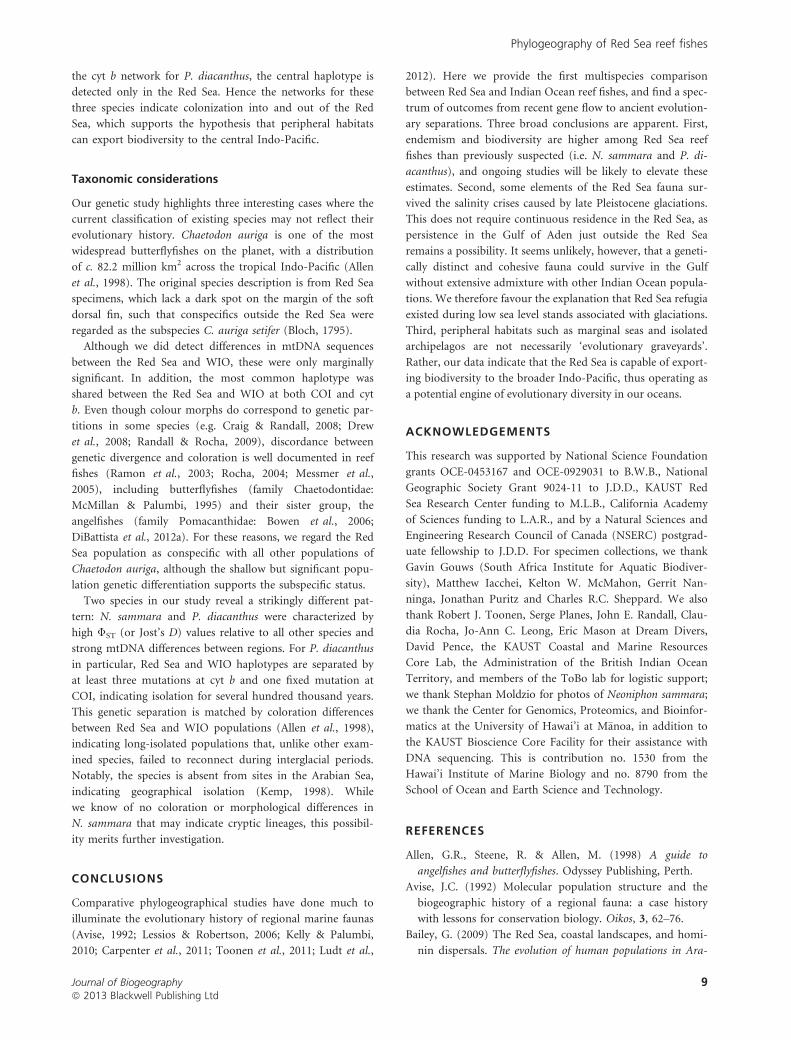
Figure 4 Median-joining networks showing relationshipsamong mitochondrial DNA cytochrome c oxidase subunit I

(COI) and cytochrome b (cyt b) haplotypes for each studyspecies (Acanthurus nigrofuscus; Cephalopholis argus; Chaetodon

auriga; Halichoeres hortulanus; Lutjanus kasmira; Neoniphonsammara; Pygoplites diacanthus) collected in the Red Sea (Al

Lith and Thuwal) and the Western Indian Ocean (Diego Garcia,Oman, Seychelles and Sodwana Bay). Each circle represents a

unique haplotype and its size is proportional to its totalfrequency. Branches or black cross-bars represent a single

nucleotide change, small black circles represent missinghaplotypes, and colours denote collection location as indicated

by the embedded key.

Journal of Biogeographyª 2013 Blackwell Publishing Ltd

7

Phylogeography of Red Sea reef fishes

H. hortulanus and P. diacanthus) to piscivory (Cephalopholis

argus, L. kasmira and N. sammara). These species also display

a variety of reproductive behaviours, ranging from dioecism

(L. kasmira, N. sammara) with mate-pairing (Chaetodon aur-

iga) or spawning aggregations (A. nigrofuscus) to protogyny

(Cephalopholis argus and H. hortulanus). Given that there are

no real unifying life-history features for this diverse group, we

suspect that differences in ecological resilience to geological

disturbance may have contributed to the range of colonization

histories, although this will require further testing.

Considering the prevailing currents in the Indian Ocean, it

is not surprising that sampling sites in the WIO were geneti-

cally similar to each other. The Chagos and Seychelles archi-

pelagos are located in the South Equatorial Current, which

flows from east to west. Both archipelagos are also heavily

influenced by seasonal or permanent countercurrents (South

Equatorial Countercurrent and East African Countercurrent,

respectively; Fig. 1). The strong and variable water movement

of the region has resulted in Diego Garcia, which is located at

the southern end of the Chagos Archipelago, having faunal

affinities with both the Indo-Polynesian and WIO provinces

(Winterbottom & Anderson, 1997; Craig, 2008; Gaither et al.,

2011; Briggs & Bowen, 2012). The South African coastline is

similarly well connected to the central Indian Ocean, being

influenced by the warm Mozambique/Agulhas current (Lut-

jeharms, 2006), which facilitates unidirectional (north to

south) transport of tropical fauna from other sites in the WIO.

There are several records of long-distance dispersal of

tropical reef fish (e.g. Chaetodon zanzibarensis and Ecsenius

lineatus) to the Arabian coastline during periods of upwell-

ing, which indicate that larval transport from the WIO to

this region and subsequent settlement are not precluded

(Kemp, 2000). Although we only sampled a few specimens

(n = 9) of a single species off the coast of Oman (Cephalop-

holis argus), these fish were not genetically distinct from con-

specifics sampled at Diego Garcia (COI: ΦST = 0.029,

P = 0.25; cyt b: ΦST < 0.001, P = 0.50) or the Seychelles

(COI: ΦST < 0.001, P = 0.80; cyt b: ΦST = 0.039, P = 0.20).

Vicariance events and colonization history

Our mtDNA data provide evidence for three separate periods

of colonization or export of propagules between the Red Sea

and WIO (Table 3). First, Red Sea populations of Chaetodon

auriga and H. hortulanus appear to derive from the WIO

during or soon after the most recent glacial maximum

(c. 21,000–31,000 years ago; but see Karl et al., 2012). Sec-

ond, population separations in A. nigrofuscus, Cephalopholis

argus and L. kasmira pre-date the Last Glacial Maximum but

include recurrent gene flow in most cases. Third, N. sammara

and P. diacanthus represent long-isolated evolutionary lin-

eages in the Red Sea. These final cases in particular indicate

that some Red Sea residents survived the major temperature

and salinity crises recorded 19,000, 30,000 and 450,000 years

ago (Siddall et al., 2003).

IMa2 analyses indicate bidirectional gene flow between the

Red Sea and WIO, which is also apparent in the older his-

tory inscribed in haplotype networks (Fig. 4). Three cases

provide especially strong inference: (1) in the COI and cyt b

network for A. nigrofuscus, the central (ancestral) haplotype

is observed primarily in the Indian Ocean, whereas the Red

Sea haplotypes are peripheral; (2) in the COI network for N.

sammara, the central haplotype is detected only in the Red

Sea, with the Indian Ocean haplotypes peripheral; and (3) in

Table 3 Estimates of time in years (t) since initial separation, effective migration rate (2Nem), effective population sizes (Ne), and

mutation-scaled migrations rates (m) between Red Sea (RS) and Western Indian Ocean (WIO) populations of seven reef fish speciesbased on mitochondrial DNA cytochrome c oxidase subunit I (COI) and cytochrome b (cyt b) runs in IMa2 (Hey & Nielsen, 2007).

Abbreviations: NC, no convergence. Inequalities: posterior probability densities rise to a plateau, so that all estimates larger than theshown value have the same approximate posterior probability.

Species

DNA

fragment

Initial

separation

in years (t)

Effective migration rate

(2Nem)

Effective population

size (Ne) Migration (m)

WIO to RS RS to WIO WIO RS

WIO to

RS

RS to

WIO

Acanthurus nigrofuscus (brown surgeonfish) COI 105,000 1.21 0.09 25.10 50.70 0.03 0.01

cyt b 79,000 3.92 0.11 52.75 85.25 0.02 0.001

Cephalopholis argus (peacock bind) COI > 121,000 NC 0.73 0.25 NC 21.05 1.45

cyt b > 212,000 0.01 NC NC 0.60 0.01 6.27

Chaetodon auriga (threadfin butterflyfish) COI 26,800 0.08 0.13 6.60 3.80 0.01 0.01

cyt b 30,700 0.03 4.85 34.65 1.65 0.01 0.07

Halichoeres hortulanus (checkerboard wrasse) COI 26,500 1491.11 0.08 7.50 115.50 6.46 0.01

cyt b 21,600 > 199.50 > 163.50 > 272.50 > 262.50 1.22 0.02

Lutjanus kasmira (bluestripe snapper) COI 41,000 0.23 1282.22 104.50 7.50 0.02 6.14

cyt b 155,000 15.01 104.61 88.10 3.10 2.82 0.50

Neoniphon sammara (Sammara squirrelfish) COI 169,000 0.79 0.03 14.85 20.75 0.02 0.001

cyt b 190,000 0.09 0.24 47.48 17.77 0.0025 0.0025

Pygoplites diacanthus (regal angelfish) COI 831,000 0.01 0.04 4.20 1.40 0.01 0.01

cyt b > 662,000 0.06 0.04 8.88 11.63 0.0025 0.0025

Journal of Biogeographyª 2013 Blackwell Publishing Ltd

8

J. D. DiBattista et al.

the cyt b network for P. diacanthus, the central haplotype is

detected only in the Red Sea. Hence the networks for these

three species indicate colonization into and out of the Red

Sea, which supports the hypothesis that peripheral habitats

can export biodiversity to the central Indo-Pacific.

Taxonomic considerations

Our genetic study highlights three interesting cases where the

current classification of existing species may not reflect their

evolutionary history. Chaetodon auriga is one of the most

widespread butterflyfishes on the planet, with a distribution

of c. 82.2 million km2 across the tropical Indo-Pacific (Allen

et al., 1998). The original species description is from Red Sea

specimens, which lack a dark spot on the margin of the soft

dorsal fin, such that conspecifics outside the Red Sea were

regarded as the subspecies C. auriga setifer (Bloch, 1795).

Although we did detect differences in mtDNA sequences

between the Red Sea and WIO, these were only marginally

significant. In addition, the most common haplotype was

shared between the Red Sea and WIO at both COI and cyt

b. Even though colour morphs do correspond to genetic par-

titions in some species (e.g. Craig & Randall, 2008; Drew

et al., 2008; Randall & Rocha, 2009), discordance between

genetic divergence and coloration is well documented in reef

fishes (Ramon et al., 2003; Rocha, 2004; Messmer et al.,

2005), including butterflyfishes (family Chaetodontidae:

McMillan & Palumbi, 1995) and their sister group, the

angelfishes (family Pomacanthidae: Bowen et al., 2006;

DiBattista et al., 2012a). For these reasons, we regard the Red

Sea population as conspecific with all other populations of

Chaetodon auriga, although the shallow but significant popu-

lation genetic differentiation supports the subspecific status.

Two species in our study reveal a strikingly different pat-

tern: N. sammara and P. diacanthus were characterized by

high ΦST (or Jost’s D) values relative to all other species and

strong mtDNA differences between regions. For P. diacanthus

in particular, Red Sea and WIO haplotypes are separated by

at least three mutations at cyt b and one fixed mutation at

COI, indicating isolation for several hundred thousand years.

This genetic separation is matched by coloration differences

between Red Sea and WIO populations (Allen et al., 1998),

indicating long-isolated populations that, unlike other exam-

ined species, failed to reconnect during interglacial periods.

Notably, the species is absent from sites in the Arabian Sea,

indicating geographical isolation (Kemp, 1998). While

we know of no coloration or morphological differences in

N. sammara that may indicate cryptic lineages, this possibil-

ity merits further investigation.

CONCLUSIONS

Comparative phylogeographical studies have done much to

illuminate the evolutionary history of regional marine faunas

(Avise, 1992; Lessios & Robertson, 2006; Kelly & Palumbi,

2010; Carpenter et al., 2011; Toonen et al., 2011; Ludt et al.,

2012). Here we provide the first multispecies comparison

between Red Sea and Indian Ocean reef fishes, and find a spec-

trum of outcomes from recent gene flow to ancient evolution-

ary separations. Three broad conclusions are apparent. First,

endemism and biodiversity are higher among Red Sea reef

fishes than previously suspected (i.e. N. sammara and P. di-

acanthus), and ongoing studies will be likely to elevate these

estimates. Second, some elements of the Red Sea fauna sur-

vived the salinity crises caused by late Pleistocene glaciations.

This does not require continuous residence in the Red Sea, as

persistence in the Gulf of Aden just outside the Red Sea

remains a possibility. It seems unlikely, however, that a geneti-

cally distinct and cohesive fauna could survive in the Gulf

without extensive admixture with other Indian Ocean popula-

tions. We therefore favour the explanation that Red Sea refugia

existed during low sea level stands associated with glaciations.

Third, peripheral habitats such as marginal seas and isolated

archipelagos are not necessarily ‘evolutionary graveyards’.

Rather, our data indicate that the Red Sea is capable of export-

ing biodiversity to the broader Indo-Pacific, thus operating as

a potential engine of evolutionary diversity in our oceans.

ACKNOWLEDGEMENTS

This research was supported by National Science Foundation

grants OCE-0453167 and OCE-0929031 to B.W.B., National

Geographic Society Grant 9024-11 to J.D.D., KAUST Red

Sea Research Center funding to M.L.B., California Academy

of Sciences funding to L.A.R., and by a Natural Sciences and

Engineering Research Council of Canada (NSERC) postgrad-

uate fellowship to J.D.D. For specimen collections, we thank

Gavin Gouws (South Africa Institute for Aquatic Biodiver-

sity), Matthew Iacchei, Kelton W. McMahon, Gerrit Nan-

ninga, Jonathan Puritz and Charles R.C. Sheppard. We also

thank Robert J. Toonen, Serge Planes, John E. Randall, Clau-

dia Rocha, Jo-Ann C. Leong, Eric Mason at Dream Divers,

David Pence, the KAUST Coastal and Marine Resources

Core Lab, the Administration of the British Indian Ocean

Territory, and members of the ToBo lab for logistic support;

we thank Stephan Moldzio for photos of Neoniphon sammara;

we thank the Center for Genomics, Proteomics, and Bioinfor-

matics at the University of Hawai’i at M�anoa, in addition to

the KAUST Bioscience Core Facility for their assistance with

DNA sequencing. This is contribution no. 1530 from the

Hawai’i Institute of Marine Biology and no. 8790 from the

School of Ocean and Earth Science and Technology.

REFERENCES

Allen, G.R., Steene, R. & Allen, M. (1998) A guide to

angelfishes and butterflyfishes. Odyssey Publishing, Perth.

Avise, J.C. (1992) Molecular population structure and the

biogeographic history of a regional fauna: a case history

with lessons for conservation biology. Oikos, 3, 62–76.

Bailey, G. (2009) The Red Sea, coastal landscapes, and homi-

nin dispersals. The evolution of human populations in Ara-

Journal of Biogeographyª 2013 Blackwell Publishing Ltd

9

Phylogeography of Red Sea reef fishes

bia (ed. by M. Petraglia and J. Rose), pp. 15–37. Springer,

Dordrecht.

Bandelt, H.J., Forster, P. & R€ohl, A. (1999) Median-joining

networks for inferring intraspecific phylogenies. Molecular

Biology and Evolution, 16, 37–48.

Benzie, J.A.H. (1999) Major genetic differences between

crown-of-thorns starfish (Acanthaster planci) populations

in the Indian and Pacific Oceans. Evolution, 53, 1782–1795.

Biton, E., Gildor, H. & Peltier, W.R. (2008) Red Sea during

the Last Glacial Maximum: implications for sea level

reconstruction. Paleoceanography, 23, PA1214.

Biton, E., Gildor, H., Trommer, G., Siccha, M., Kucera, M.,

van der Meer, M.T.J. & Schouten, S. (2010) Sensitivity of

Red Sea circulation to monsoonal variability during the

Holocene: an integrated data and modeling study. Paleoce-

anography, 25, PA4209.

Bosworth, W., Huchon, P. & McClay, K. (2005) The Red Sea

and Gulf of Aden Basins. Journal of African Earth Sciences,

43, 334–378.

Bowen, B.W., Bass, A.L., Rocha, L.A., Grant, W.S. & Robert-

son, D.R. (2001) Phylogeography of the trumpetfishes

(Aulostomus): ring species complex on a global scale. Evo-

lution, 55, 1029–1039.

Bowen, B.W., Muss, A., Rocha, L.A. & Grant, W.S. (2006)

Shallow mtDNA coalescence in Atlantic pygmy angelfishes

(genus Centropyge) indicates a recent invasion from the

Indian Ocean. Journal of Heredity, 97, 1–12.

Briggs, J.C. (1999) Coincident biogeographic patterns: Indo-

West Pacific Ocean. Evolution, 53, 326–335.

Briggs, J.C. & Bowen, B.W. (2012) A realignment of marine

biogeographic provinces with particular reference to fish

distributions. Journal of Biogeography, 39, 12–30.

Carpenter, K.E., Barber, P.H., Crandall, E.D., Ablan-Lagman,

M.C.A., Ambariyanto, Mahardika, G.N., Manjaji-Matsum-

oto, B.M., Juinio-Me~nez, M.A., Santos, M.D., Starger, C.J.

& Toha, A.H.A. (2011) Comparative phylogeography of

the Coral Triangle and implications for marine manage-

ment. Journal of Marine Biology, 2011, 396982.

Chao, A., Jost, L., Chiang, S.C., Jiang, Y.-H. & Chazdon, R.L.

(2008) A two stage probabilistic approach to multiple-

community similarity indices. Biometrics, 64, 1178–1186.

Cox, C.B. & Moore, P.D. (2000) Biogeography: an ecological

and evolutionary approach, 6th edn. Blackwell, Oxford.

Craig, M.T. (2008) The goldrim surgeonfish (Acanthurus nig-

ricans; Acanthuridae) from Diego Garcia, Chagos Archipel-

ago: first record for the central Indian Ocean. Zootaxa,

1850, 65–68.

Craig, M.T. & Randall, J.E. (2008) Two new species of the

Indo-Pacific clingfish genus Discotrema (Gobiesocidae).

Copeia, 2008, 68–74.

DeVantier, L.M., Turak, E., Al-Shaikh, K.A. & De’ath, G.

(2000) Coral communities of the central-northern Saudi

Arabian Red Sea. Fauna of Arabia, 18, 23–66.

DiBattista, J.D., Wilcox, C., Craig, M.T., Rocha, L.A. & Bo-

wen, B.W. (2011) Phylogeography of the Pacific Blueline

Surgeonfish, Acanthurus nigroris, reveals high genetic con-

nectivity and a cryptic endemic species in the Hawaiian

archipelago. Journal of Marine Biology, 2011, 839134.

DiBattista, J.D., Waldrop, E., Bowen, B.W., Schultz, J.K.,

Gaither, M.R., Pyle, R.L. & Rocha, L.A. (2012a) Twisted

sister species of pygmy angelfishes: discordance between

taxonomy, coloration, and phylogenetics. Coral Reefs, 31,

839–851.

DiBattista, J.D., Rocha, L.A., Craig, M.T., Feldheim, K.A. &

Bowen, B.W. (2012b) Phylogeography of two closely

related Indo-Pacific butterflyfishes reveals divergent evolu-

tionary histories and discordant results from mtDNA and

microsatellites. Journal of Heredity, 103, 617–629.

Drew, J., Allen, G.R., Kaufman, L. & Barber, P.H. (2008)

Endemism and regional color and genetic differences in

five putatively cosmopolitan reef fishes. Conservation Biol-

ogy, 22, 965–975.

Drummond, A.J., Ashton, B., Cheung, M., Heled, J., Kearse,

M., Moir, R., Stones-Havas, S., Thierer, T. & Wilson, A.

(2009) Geneious v4.8. Available at: http://www.geneious.

com/.

Eble, J.A., Toonen, R.J. & Bowen, B.W. (2009) Endemism

and dispersal: comparative phylogeography of three sur-

geonfishes across the Hawaiian Archipelago. Marine Biol-

ogy, 156, 689–698.

Eble, J.A., Toonen, R.J., Sorenson, L., Basch, L.V., Papastam-

atiou, Y.P. & Bowen, B.W. (2011) Escaping paradise: larval

export from Hawaii in an Indo-Pacific reef fish, the yellow

tang (Zebrasoma flavescens). Marine Ecology Progress Series,

428, 245–258.

Excoffier, L., Smouse, P.E. & Quattro, J.M. (1992) Analysis

of molecular variance inferred from metric distances

among DNA haplotypes: application to human mitochon-

drial DNA restriction data. Genetics, 131, 479–491.

Excoffier, L., Laval, G. & Schneider, S. (2005) Arlequin version

3.0: an integrated software package for population genetics

data analysis. Evolutionary Bioinformatics Online, 1, 47–50.

Forssk�al, P. (1775) Descriptiones animalium avium, amphibio-

rum, piscium, insectorum, vermium; quae in itinere orientali

observavit. M€oller, Copenhagen, Denmark.

Fratini, S. & Vannini, M. (2002) Genetic differentiation in

the mud crab Scylla serrata (Decapoda: Portunidae) within

the Indian Ocean. Journal of Experimental Marine Biology

and Ecology, 272, 103–116.

Froukh, T. & Kochzius, M. (2007) Genetic population struc-

ture of the endemic fourline wrasse (Larabicus quadrilinea-

tus) suggests limited larval dispersal distances in the Red

Sea. Molecular Ecology, 16, 1359–1367.

Froukh, T. & Kochzius, M. (2008) Species boundaries and

evolutionary lineages in the blue green damselfishes Chr-

omis viridis and Chromis atripectoralis (Pomacentridae).

Journal of Fish Biology, 72, 451–457.

Gaither, M.R., Toonen, R.J., Robertson, D.R., Planes, S. &

Bowen, B.W. (2010) Genetic evaluation of marine biogeo-

graphical barriers: perspectives from two widespread Indo-

Pacific snappers (Lutjanus kasmira and Lutjanus fulvus).

Journal of Biogeography, 37, 133–147.

Journal of Biogeographyª 2013 Blackwell Publishing Ltd

10

J. D. DiBattista et al.

Gaither, M.R., Bowen, B.W., Bordenave, T.-R., Rocha, L.A.,

Newman, S.J., Gomez, J.A., van Herwerden, L. & Craig,

M.T. (2011) Phylogeography of the reef fish Cephalopholis

argus (Epinephelidae) indicates Pleistocene isolation across

the Indo-Pacific barrier with contemporary overlap in the

Coral Triangle. BMC Evolutionary Biology, 11, 189.

Golani, D. & Bogorodsky, S.V. (2010) The fishes of the Red

Sea – reappraisal and updated checklist. Zootaxa, 2463, 1–

135.

Hasegawa, M., Kishino, H. & Yano, T.-A. (1985) Dating of

the human-ape splitting by a molecular clock of mitochon-

drial DNA. Journal of Molecular Evolution, 22, 160–174.

Hassan, M., Harmelin-Vivien, M. & Bonhomme, F. (2003)

Lessepsian invasion without bottleneck: example of two

rabbitfish species (Siganus rivulatus and S. luridus). Journal

of Experimental Marine Biology and Ecology, 291, 219–232.

Hemleben, C., Meishchner, D., Zahn, R., Almogi-Labin, A.,

Erlenkeuser, H. & Hiller, B. (1996) Three hundred eighty

thousand year long stable isotope and faunal records from

the Red Sea: influence of global sea level change on

hydrography. Paleoceanography, 11, 147–156.

Hey, J. (2010) Isolation with migration models for more

than two populations. Molecular Biology and Evolution, 27,

905–920.

Hey, J. & Nielsen, R. (2007) Integration within the Felsen-

stein equation for improved Markov chain Monte Carlo

methods in population genetics. Proceedings of the

National Academy of Sciences USA, 104, 2785–2790.

Jost, L. (2008) GST and its relatives do not measure differen-

tiation. Molecular Ecology, 17, 4015–4026.

Karl, S.A., Toonen, R.J., Grant, W.S. & Bowen, B.W. (2012)

Common misconceptions in molecular ecology: echoes of

the modern synthesis. Molecular Ecology, 21, 4171–4189.

Kelly, R.P. & Palumbi, S.R. (2010) Genetic structure among

50 species of the northeastern Pacific rocky intertidal com-

munity. PLoS ONE, 5, e8594.

Kemp, J. (1998) Zoogeography of the coral reef fishes of the

Socotra Archipelago. Journal of Biogeography, 25, 919–933.

Kemp, J. (2000) Zoogeography of the coral reef fishes of the

northeastern Gulf of Aden, with eight new records of coral

reef fishes from Arabia. Fauna of Arabia, 18, 293–321.

Klausewitz, W. (1989) Evolutionary history and zoogeogra-

phy of the Red Sea ichthyofauna. Fauna of Saudi Arabia,

10, 310–337.

Kochzius, M. & Blohm, D. (2005) Genetic population struc-

ture of the lionfish Pterois miles (Scorpaenidae, Pteroinae)

in the Gulf of Aqaba and northern Red Sea. Gene, 347,

295–301.

Lessios, H.A. (2008) The Great American Schism: divergence

of marine organisms after the rise of the Central American

isthmus. Annual Review of Ecology, Evolution, and System-

atics, 39, 63–91.

Lessios, H.A. & Robertson, D.R. (2006) Crossing the impassi-

ble: genetic connections in 20 reef fishes across the eastern

Pacific barrier. Proceedings of the Royal Society B: Biological

Sciences, 273, 2201–2208.

Ludt, W.B., Bernal, M., Bowen, B.W. & Rocha, L.A. (2012)

Living in the past: phylogeography and population histories

of Indo-Pacific wrasses (genus Halichoeres) in shallow

lagoons versus outer reef slopes. PLoS ONE, 7, e38042.

Lutjeharms, J.R.E. (2006) The Agulhas Current. Springer,

New York, NY.

McMillan, W.O. & Palumbi, S.R. (1995) Concordant evolution-

ary patterns among Indo-West Pacific butterflyfishes. Proceed-

ings of the Royal Society B: Biological Sciences, 260, 229–236.

Meeker, N.D., Hutchinson, S.A., Ho, L. & Trede, N.S. (2007)

Method for isolation of PCR-ready genomic DNA from

zebrafish tissues. BioTechniques, 43, 610–614.

Messmer, V., van Herwerden, L., Munday, P.L. & Jones, G.P.

(2005) Phylogeography of colour polymorphism in the

coral reef fish Pseudochromis fuscus, from Papua New Gui-

nea and the Great Barrier Reef. Coral Reefs, 24, 392–402.

Meyer, A. (1994) Shortcomings of the cytochrome b gene as

a molecular marker. Trends in Ecology and Evolution, 9,

278–280.

Narum, S.R. (2006) Beyond Bonferroni: less conservative

analyses for conservation genetics. Conservation Genetics,

7, 783–787.

Ngugi, D.K., Antunes, A., Brune, A. & Stingl, U. (2012) Bio-

geography of pelagic bacterioplankton across an antagonis-

tic temperature–salinity gradient in the Red Sea. Molecular

Ecology, 21, 388–405.

Ormond, R. & Edwards, A. (1987) Red Sea fishes. Key envi-

ronments – Red Sea (ed. by A.J. Edwards and S.M. Head),

pp. 251–287. Pergamon Press, Oxford.

Posada, D. (2008) jModelTest: phylogenetic model averaging.

Molecular Biology and Evolution, 25, 1253–1256.

Raitsos, D.E., Hoteit, I., Prihartato, P.K., Chronis, T., Trian-

tafyllou, G. & Abualnaja, Y. (2011) Abrupt warming of the

Red Sea. Geophysical Research Letters, 38, L14601.

Ramon, M.L., Lobel, P.S. & Sorenson, M.D. (2003) Lack of

mitochondrial genetic structure in hamlets (Hypoplectrus

spp.): recent speciation or ongoing hybridization? Molecu-

lar Ecology, 12, 2975–2980.

Randall, J.E. (1994) Twenty-two new records of fishes from

the Red Sea. Fauna of Saudi Arabia, 14, 259–275.

Randall, J.E. (1999) Report on fish collections from the Pit-

cairn Islands. Atoll Research Bulletin, 461, 1–53.

Randall, J.E. (2005) Reef and shore fishes of the South Pacific:

New Caledonia to Tahiti and the Pitcairn Islands. Univer-

sity of Hawai’i Press, Honolulu, HI.

Randall, J.E. & Rocha, L.A. (2009) Chaetodontoplus poliourus, a

new angelfish (Perciformes: Pomacanthidae) from the tropical

western Pacific. The Raffles Bulletin of Zoology, 57, 511–520.

Reece, J.S., Bowen, B.W., Smith, D.G. & Larson, A. (2010)

Molecular phylogenetics of moray eels (Muraenidae) dem-

onstrates multiple origins of a shell-crushing jaw (Gymnom-

uraena, Echidna) and multiple colonizations of the Atlantic

Ocean. Molecular Phylogenetics and Evolution, 57, 829–835.

Riegl, B. & Velimirov, B. (1994) The structure of coral com-

munities at Hurghada in the Northern Red Sea. Marine

Ecology, 15, 213–231.

Journal of Biogeographyª 2013 Blackwell Publishing Ltd

11

Phylogeography of Red Sea reef fishes

Righton, D., Kemp, J. & Ormond, R. (1996) Biogeography,

community structure and diversity of Red Sea and western

Indian Ocean butterflyfishes. Journal of the Marine Biologi-

cal Association of the UK, 76, 223–228.

Roberts, C.M., Shepherd, A.R.D. & Ormond, R.F.G. (1992)

Large-scale variation in assemblage structure of Red Sea

butterflyfishes and angelfishes. Journal of Biogeography, 19,

239–250.

Rocha, L.A. (2004) Mitochondrial DNA and color pattern var-

iation in three western Atlantic Halichoeres (Labridae), with

the revalidation of two species. Copeia, 2004, 770–782.

Rocha, L.A., Bass, A.L., Robertson, D.R. & Bowen, B.W.

(2002) Adult habitat preferences, larval dispersal, and the

comparative phylogeography of three Atlantic surgeonfish-

es (Teleostei: Acanthuridae). Molecular Ecology, 11, 243–

251.

Seutin, G., White, B.N. & Boag, P.T. (1991) Preservation of

avian blood and tissue samples for DNA analyses. Cana-

dian Journal of Zoology, 69, 82–90.

Sheppard, C.R.C. (2000) Coral reefs of the western Indian

Ocean: an overview. Coral reefs of the Indian Ocean: their

ecology and conservation (ed. by T.R. McClanahan, C.R.C.

Sheppard and D.O. Obura), pp. 3–38. Oxford University

Press, Oxford.

Sheppard, C.R.C. & Sheppard, A.L.S. (1991) Corals and coral

communities of Arabia. Fauna of Saudi Arabia, 12, 3–170.

Sheppard, C.R.C., Price, A.R.G. & Roberts, C.M. (1992) Mar-

ine ecology of the Arabian region: patterns and processes in

extreme tropical environments. Academic Press, London.

Siddall, M., Rohling, E.J., Almogi-Labin, A., Hemleben, C.,

Meischner, D., Schmelzer, I. & Smeed, D.A. (2003) Sea-

level fluctuations during the last glacial cycle. Nature, 423,

853–858.

Siddall, M., Smeed, D.A., Hemleben, C., Rohling, E.J., Sch-

melzer, I. & Peltier, W.R. (2004) Understanding the Red

Sea response to sea level. Earth and Planetary Science Let-

ters, 225, 421–434.

Skillings, D.J., Bird, C.E. & Toonen, R.J. (2011) Gateways to

Hawai’i: genetic population structure of the tropical sea

cucumber Holothuria atra. Journal of Marine Biology, 2011,

783030.

Smeed, D. (2004) Exchange through the Bab el Mandab.

Deep-Sea Research Part II: Tropical Studies in Oceanogra-

phy, 51, 455–474.

Smeed, D.A. (1997) Seasonal variation of the flow in the

strait of Bab al Mandab. Oceanologica Acta, 20, 773–781.

Song, C.B., Near, T.J. & Page, L.M. (1998) Phylogenetic rela-

tions among percid fishes as inferred from mitochondrial

cytochrome b DNA sequence data. Molecular Phylogenetics

and Evolution, 10, 343–353.

Taberlet, P., Meyer, A. & Bouvet, J. (1992) Unusual mito-

chondrial variation in two local populations of blue tit

Parus caeruleus. Molecular Ecology, 1, 27–36.

Thresher, R.E. & Brothers, E.B. (1985) Reproductive ecology

and biogeography of Indo-West Pacific angelfish (Pisces:

Pomacanthidae). Evolution, 39, 878–887.

Toonen, R.J., Andrews, K.R., Baums, I.B., Bird, C.E., Con-

cepcion, G.T., Daly-Engel, T.S., Eble, J.A., Faucci, A., Gai-

ther, M.R., Iacchei, M., Puritz, J.B., Schultz, J.K., Skillings,

D.J., Timmers, M.A. & Bowen, B.W. (2011) Defining

boundaries for ecosystem-based management: a multispe-

cies case study of marine connectivity across the Hawaiian

archipelago. Journal of Marine Biology, 2011, 460173.

Victor, B.C. (1986) Duration of the planktonic larval stage of

one hundred species of Pacific and Atlantic wrasses (family

Labridae). Marine Biology, 90, 317–326.

Ward, R.D., Zemlak, T.S., Innes, B.H., Last, P.R. & Hebert,

P.D.N. (2005) DNA barcoding Australia’s fish species.

Philosophical Transactions of the Royal Society B: Biological

Sciences, 360, 1847–1857.

Wilson, D.T. & McCormick, M.I. (1999) Microstructure of

settlement-marks in the otoliths of tropical reef fish. Mar-

ine Biology, 134, 29–41.

Winterbottom, R. & Anderson, R.C. (1997) A revised check-

list of the epipelagic and shore fishes of the Chagos Archi-

pelago, Central Indian Ocean. Ichthyological Bulletin, 66,

1–28.

SUPPORTING INFORMATION

Additional Supporting Information may be found in the

online version of this article:

Appendix S1 Mitochondrial DNA haplotype (h) and nucle-

otide diversity (p) for each species from each collection loca-

tion.

Appendix S2 Population pairwise ΦST and Jost’s D values

for each species based on mitochondrial DNA sequences.

BIOSKETCH

The authors’ interests are focused on illuminating the evolu-

tionary processes that generate marine biodiversity. They

have carried out phylogeographical surveys of over 20 reef

fish species in the greater Indo-Pacific to test existing evolu-

tionary models, resolve the life-history traits that influence

dispersal and population separations in reef organisms, and

inform marine conservation (e.g. defining the boundaries of

marine protected areas).

Author contributions: J.D.D. conceived the ideas for this

study, collected tissue samples and produced DNA sequences,

analysed the data, and led the writing. In addition to con-

tributing to writing, M.L.B., B.W.B., J.H.C. and M.T.C. col-

lected tissue samples, M.R.G. and L.A.R. collected tissue

samples and produced DNA sequences, J.A.E. produced

DNA sequences, and D.J.S. implemented and interpreted

coalescent analyses.

Editor: Craig McClain

Journal of Biogeographyª 2013 Blackwell Publishing Ltd

12

J. D. DiBattista et al.


Recommended