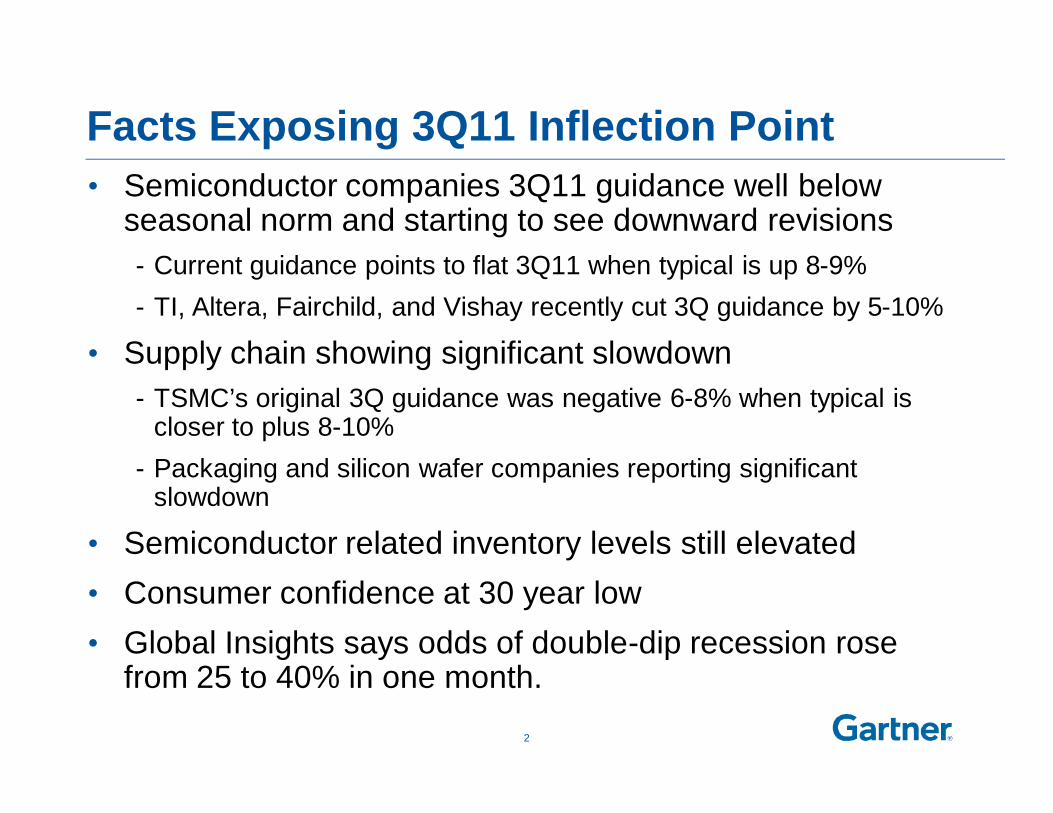
seasonal norm and starting to see downward revisions- Current guidance points to flat 3Q11 when typical is up 8-9%- TI, Altera, Fairchild, and Vishay recently cut 3Q guidance by 5-10%
• Supply chain showing significant slowdown- TSMC’s original 3Q guidance was negative 6-8% when typical is
closer to plus 8-10%- Packaging and silicon wafer companies reporting significant
slowdown
• Semiconductor related inventory levels still elevated• Consumer confidence at 30 year low• Global Insights says odds of double-dip recession rose
from 25 to 40% in one month.
2
-6
2 3
-23-16
1720
9
1
95
-5
0
-1
0
0 -2
47
1
-30
-25
-20
-15
-10
-5
0
5
10
15
20
25
0
10
20
30
40
50
60
70
80
90
1Q08 3Q08 1Q09 3Q09 1Q10 3Q10 1Q11 3Q11 1Q12 3Q12
Revenue ($B)
Revenue Quarterly Sequential Growth
Quarterly Sequential Growth (%)
Semiconductor Quarterly Revenue Profile, 3Q11 Update: Correction and Brief Respite
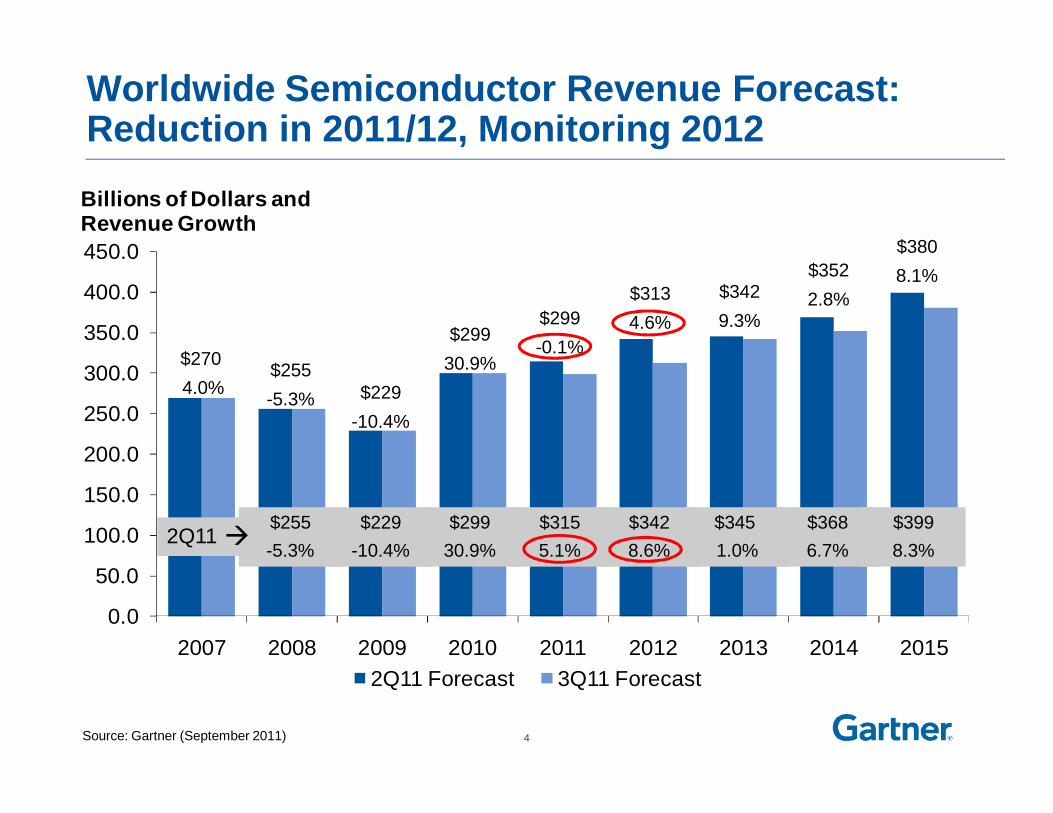
Worldwide Semiconductor Revenue Forecast: Reduction in 2011/12, Monitoring 2012
$2704.0% $229
-10.4%
$255-5.3%
$29930.9%
$299-0.1%
$3134.6%
$3429.3%
$3522.8%
$229-10.4%
$29930.9%
$3155.1%
$3428.6%
$345 1.0%
$3686.7%
$255-5.3%
2Q11
$3808.1%
4
$3998.3%
Source: Gartner (September 2011)
Key Semiconductor Assumptions• PC 2011 production unit growth in 3Q11 forecast was
significantly decreased from 9.5% to 3.4%.• Mobile phone 2011 production unit growth decreased
slightly from 12.9% to 11.5%.• Media tablet production forecast decreased from 71.6M to
67.1M in 2011, still growing 266% over 2010.• DRAM impacted hard by reduced PC demand and falling
prices, worst performing device in 2011 with 26.6% decline• NAND flash and data processing ASIC fastest growing
devices areas in 2011 with about 20% growth in part due to strong growth in smartphones and iPads
• Foundry overcapacity, inventory correction, and slowing demand hitting all at once reducing growth expectations for 2011 and 2012.
5
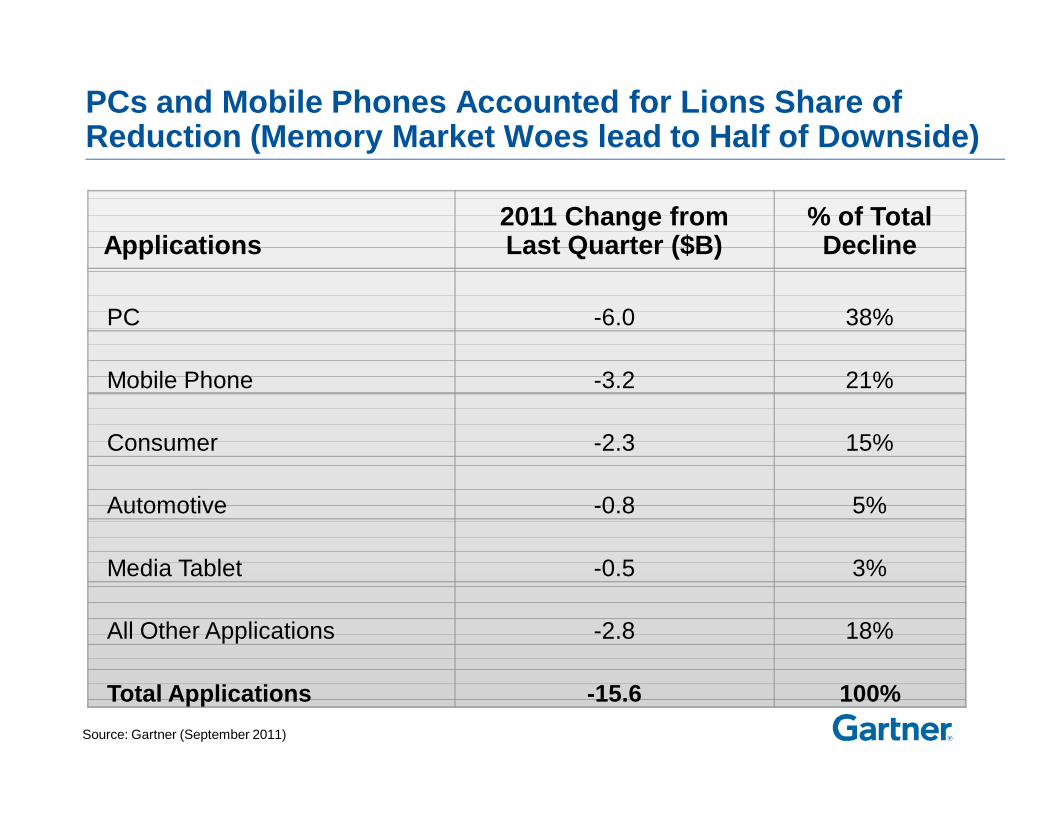
PCs and Mobile Phones Accounted for Lions Share of Reduction (Memory Market Woes lead to Half of Downside)
Applications2011 Change from Last Quarter ($B)
% of Total Decline
PC -6.0 38%
Mobile Phone -3.2 21%
Consumer -2.3 15%
Automotive -0.8 5%
Media Tablet -0.5 3%
All Other Applications -2.8 18%
Total Applications -15.6 100%Source: Gartner (September 2011)
0.40
0.60
0.80
1.00
1.20
1.40
1.60
1.80
1Q07
2Q07
3Q07
4Q07
1Q08
2Q08
3Q08
4Q08
1Q09
2Q09
3Q09
4Q09
1Q10
2Q10
3Q10
4Q10
1Q11
2Q11
3Q11
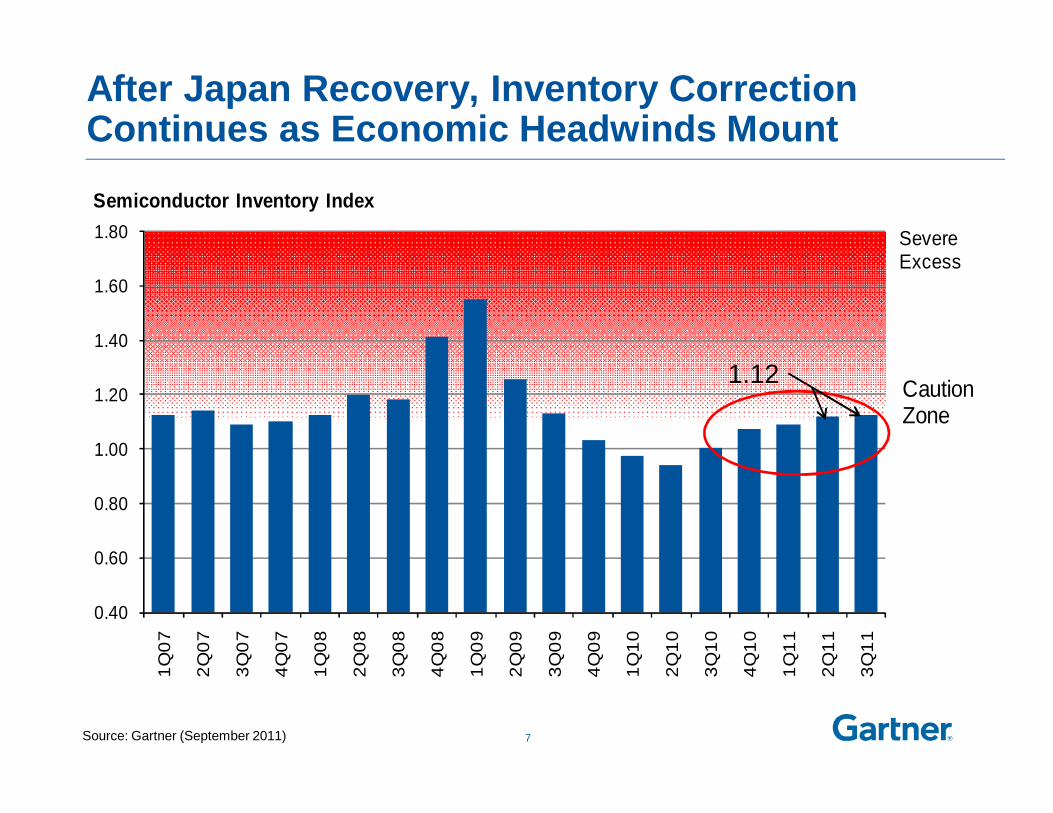
SevereExcess
CautionZone
Semiconductor Inventory Index
After Japan Recovery, Inventory Correction Continues as Economic Headwinds Mount
7
1.12
Source: Gartner (September 2011)
-5 0 5 10
Other
LCD TV
Automotive
Comm Infra/Broadband
PC
Server
SSD
Media Tablet
SmartPhone
2012 Growth ($B)
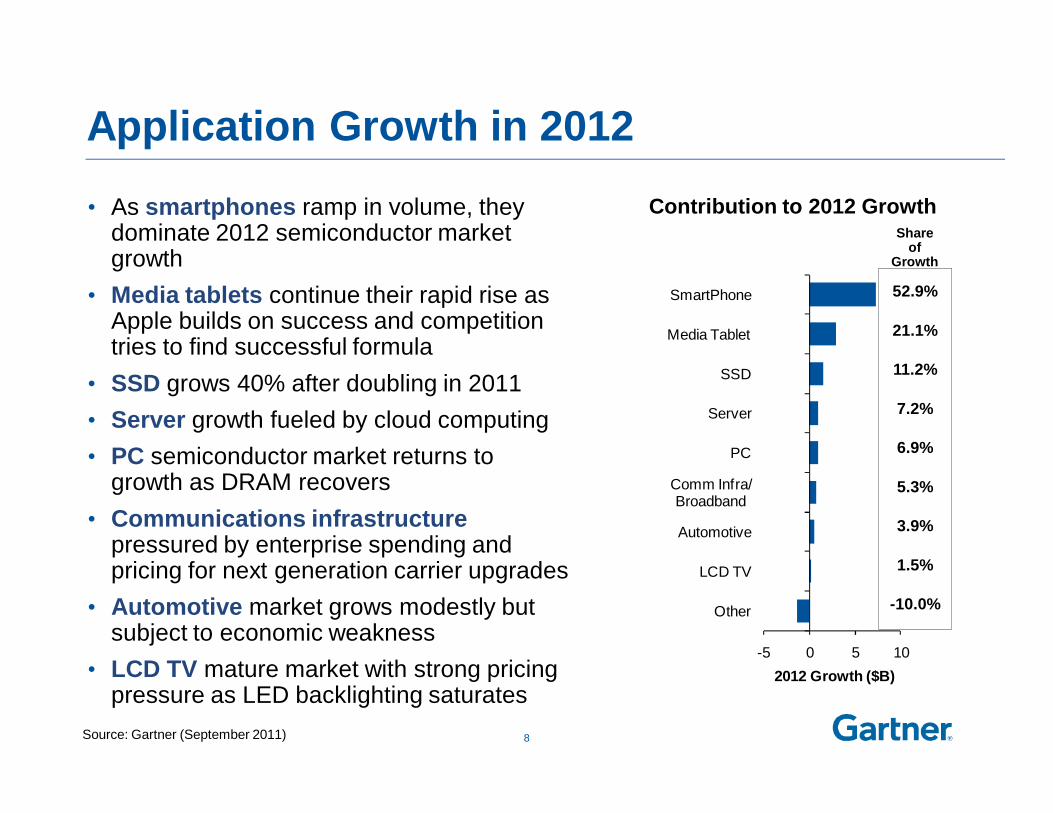
Application Growth in 2012
• As smartphones ramp in volume, they dominate 2012 semiconductor market growth
• Media tablets continue their rapid rise as Apple builds on success and competition tries to find successful formula
• SSD grows 40% after doubling in 2011• Server growth fueled by cloud computing• PC semiconductor market returns to
growth as DRAM recovers• Communications infrastructure
pressured by enterprise spending and pricing for next generation carrier upgrades
• Automotive market grows modestly but subject to economic weakness
• LCD TV mature market with strong pricing pressure as LED backlighting saturates
Contribution to 2012 GrowthShare
of Growth
8
52.9%
21.1%
11.2%
7.2%
6.9%
5.3%
3.9%
1.5%
-10.0%
Source: Gartner (September 2011)
0
50
100
150
200
250
300
350
2010 2011 2012 2013 2014 2015
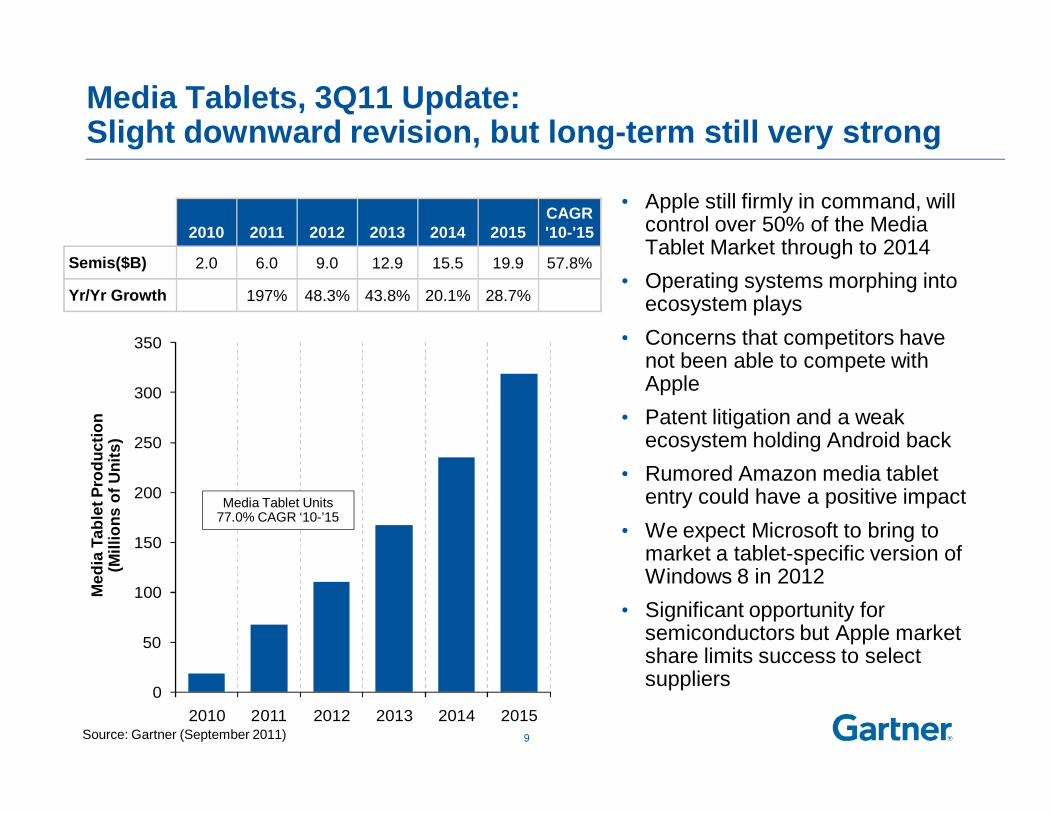
Media Tablets, 3Q11 Update: Slight downward revision, but long-term still very strong
• Apple still firmly in command, will control over 50% of the Media Tablet Market through to 2014
• Operating systems morphing into ecosystem plays
• Concerns that competitors have not been able to compete with Apple
• Patent litigation and a weak ecosystem holding Android back
• Rumored Amazon media tablet entry could have a positive impact
• We expect Microsoft to bring to market a tablet-specific version of Windows 8 in 2012
• Significant opportunity for semiconductors but Apple market share limits success to select suppliers
2010 2011 2012 2013 2014 2015 CAGR'10-'15
Semis($B) 2.0 6.0 9.0 12.9 15.5 19.9 57.8%
Yr/Yr Growth 197% 48.3% 43.8% 20.1% 28.7%
Media Tablet Units77.0% CAGR ‘10-’15
Med
ia T
able
t Pro
duct
ion
(Mill
ions
of U
nits
)
9Source: Gartner (September 2011)
Application Summary• Consumer spending focused on computing but attention is moving away from
PCs to alternatives including media tablets and smartphones• Large ecosystems will continue dominate the consumer and enterprise
mobile markets• As Apple’s market share in electronics increases, it reduces the growth
opportunity for semiconductor vendors without Apple design wins• As users adopt more devices, they are using them in a complementary
fashion across similar content or applications. These distinctions will keep substitution between devices to a minimum.
• Weakness in the PC market led to almost 40% of the reduction in 2011 semiconductor forecast
• With weakening economy enterprises will continue to find ways to extend the life of aging PCs and delay upgrading to Windows 7
• Nearly 85% of 2012 semiconductor growth will come from just 3 applications – out of over 100 applications tracked; big 3 represent 70% of growth through 2015
10
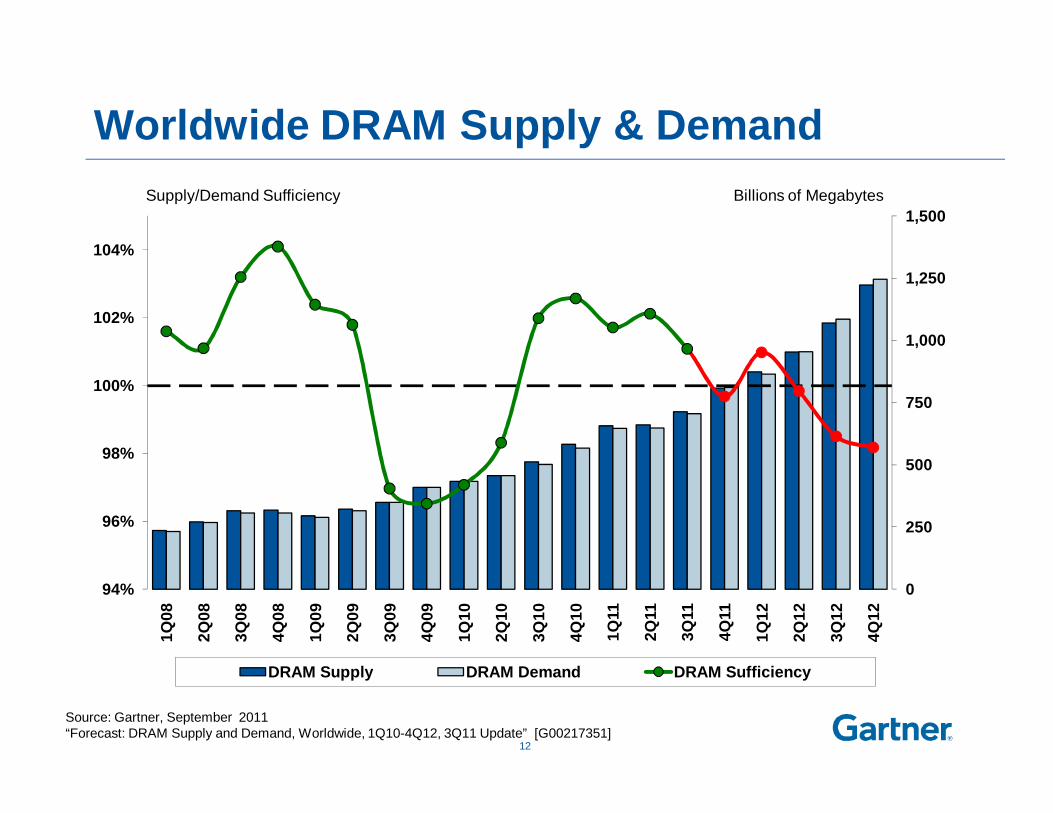
3Q11 DRAM Forecast • Significant changes to DRAM forecast over the next couple of years
• Faltering economy and slowdown in demand, especially in PCs, once again tipped the market into oversupply and pricing collapse
• Mainstream device pricing now close to or below variable cost for least efficient manufacturers
• We expect pricing to bottom-out and even increase slightly before year end due to mild seasonal demand & channel inventory correction
• Higher DRAM content growth in PCs and stronger production growth though 2012 will move the market back into undersupply
• Further mild increase in pricing in 2012 will move the vendors back into profitability
• Capacity expansion decisions will be delayed until mid 2012 with little or no new capacity coming online before 2014
11
Worldwide DRAM Supply & Demand
0
250
500
750
1,000
1,250
1,500
94%
96%
98%
100%
102%
104%
1Q08
2Q08
3Q08
4Q08
1Q09
2Q09
3Q09
4Q09
1Q10
2Q10
3Q10
4Q10
1Q11
2Q11
3Q11
4Q11
1Q12
2Q12
3Q12
4Q12
DRAM Supply DRAM Demand DRAM Sufficiency
Billions of MegabytesSupply/Demand Sufficiency
12
Source: Gartner, September 2011“Forecast: DRAM Supply and Demand, Worldwide, 1Q10-4Q12, 3Q11 Update” [G00217351]
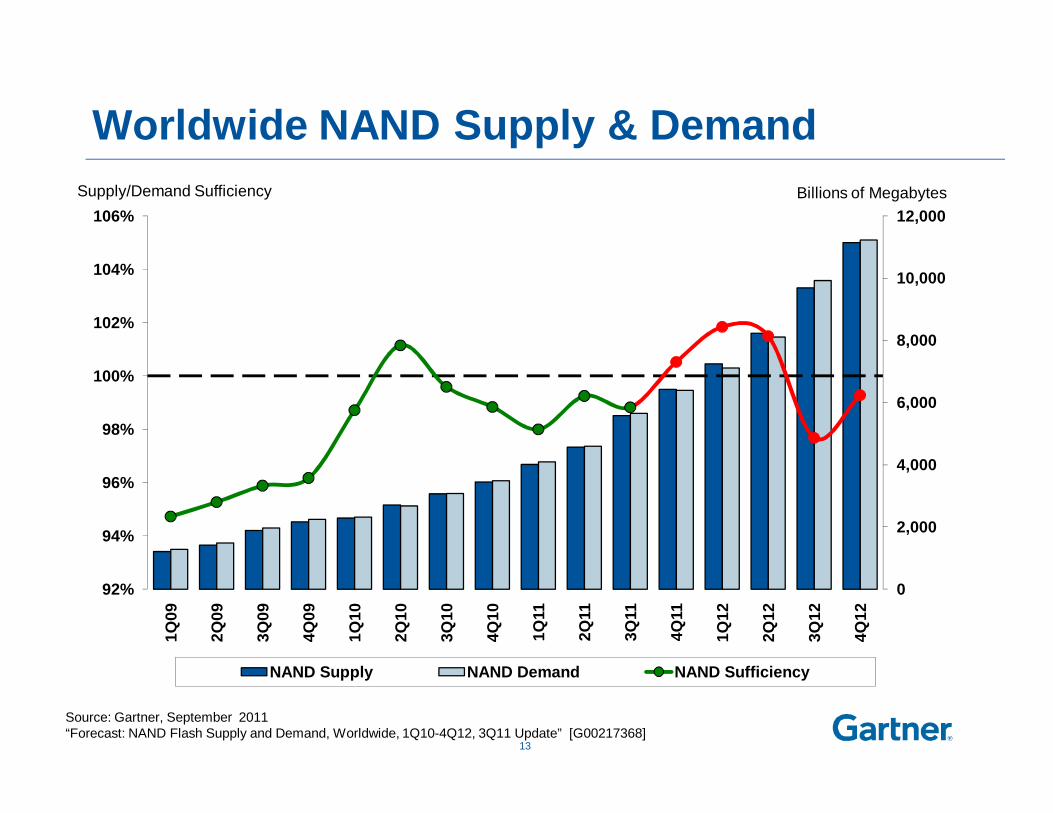
Worldwide NAND Supply & Demand
0
2,000
4,000
6,000
8,000
10,000
12,000
92%
94%
96%
98%
100%
102%
104%
106%
1Q09
2Q09
3Q09
4Q09
1Q10
2Q10
3Q10
4Q10
1Q11
2Q11
3Q11
4Q11
1Q12
2Q12
3Q12
4Q12
NAND Supply NAND Demand NAND Sufficiency
Billions of MegabytesSupply/Demand Sufficiency
13
Source: Gartner, September 2011“Forecast: NAND Flash Supply and Demand, Worldwide, 1Q10-4Q12, 3Q11 Update” [G00217368]
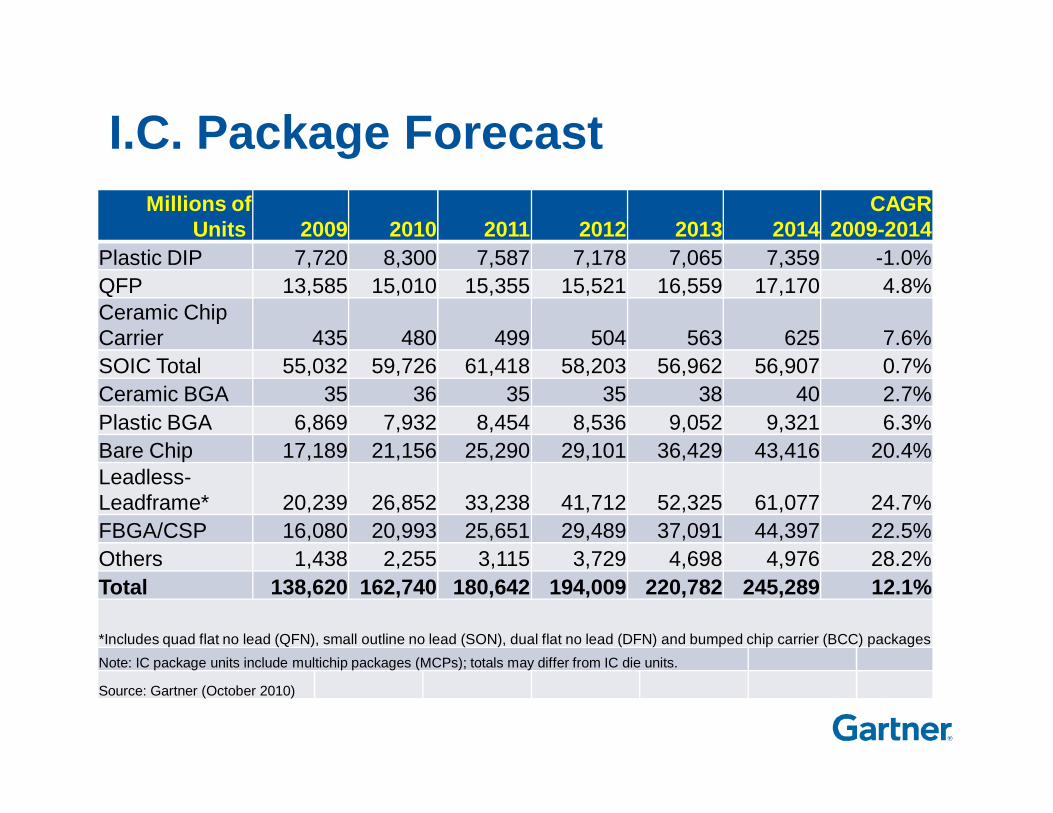
*Includes quad flat no lead (QFN), small outline no lead (SON), dual flat no lead (DFN) and bumped chip carrier (BCC) packagesNote: IC package units include multichip packages (MCPs); totals may differ from IC die units.
Source: Gartner (October 2010)
Source for GDP data: IHS Global Insight
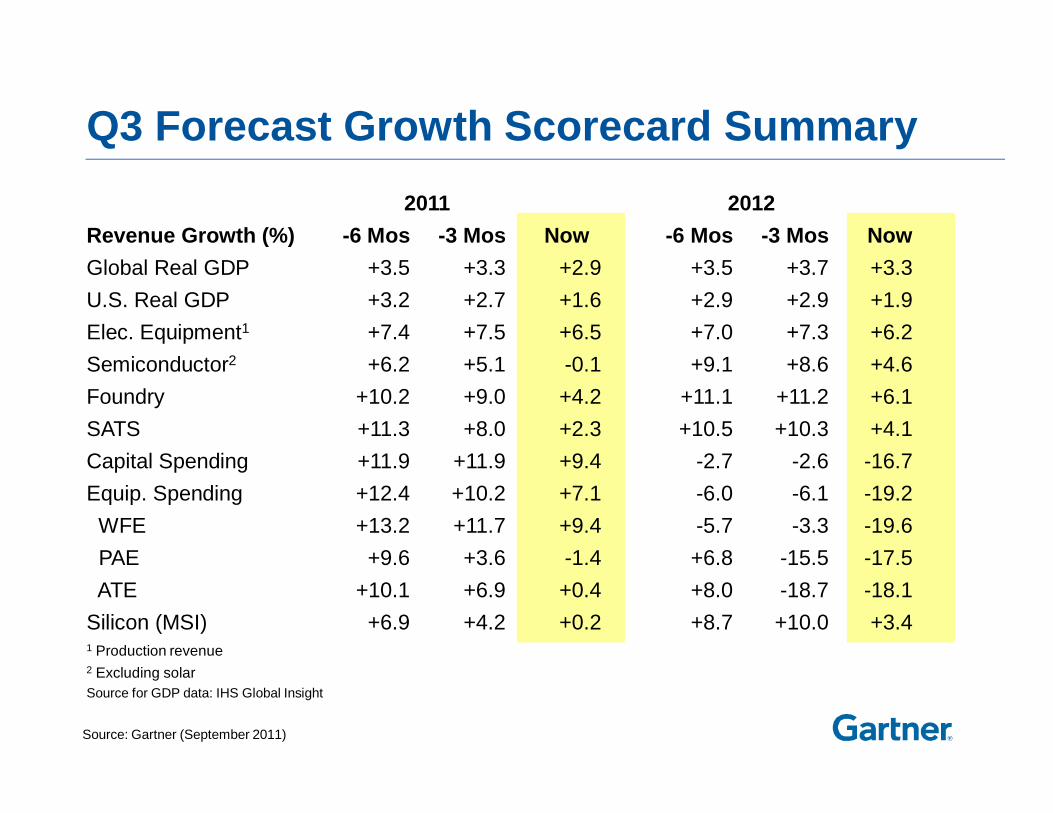
Q3 Forecast Growth Scorecard Summary 2011 2012
Revenue Growth (%) -6 Mos -3 Mos Now -6 Mos -3 Mos NowGlobal Real GDP +3.5 +3.3 +2.9 +3.5 +3.7 +3.3U.S. Real GDP +3.2 +2.7 +1.6 +2.9 +2.9 +1.9Elec. Equipment1 +7.4 +7.5 +6.5 +7.0 +7.3 +6.2Semiconductor2 +6.2 +5.1 -0.1 +9.1 +8.6 +4.6Foundry +10.2 +9.0 +4.2 +11.1 +11.2 +6.1SATS +11.3 +8.0 +2.3 +10.5 +10.3 +4.1Capital Spending +11.9 +11.9 +9.4 -2.7 -2.6 -16.7Equip. Spending +12.4 +10.2 +7.1 -6.0 -6.1 -19.2WFE +13.2 +11.7 +9.4 -5.7 -3.3 -19.6PAE +9.6 +3.6 -1.4 +6.8 -15.5 -17.5ATE +10.1 +6.9 +0.4 +8.0 -18.7 -18.1
Silicon (MSI) +6.9 +4.2 +0.2 +8.7 +10.0 +3.41 Production revenue2 Excluding solar
Source: Gartner (September 2011)
Conclusions• Inventory correction and reduced holiday build having
major impact in 3Q11• Short-term growth impacted as all three major events are
hitting at once (inventory correction, overcapacity, and slowing demand)
• Macroeconomic picture will need to be watched closely to rebalance 2012 supply with demand
• Most-likely semiconductor growth for 2011 and 2012 to negative 0.1% and 4.6%, respectively
• Risk in 2011/2012 if economy takes a turn for the worse –negative case is -2.2% for 2011 and -4.9% for 2012
• 2013 rebounds as ASPs recover
29
Upcoming Gartner Semiconductor Events
Semiconductor Asia Pacific Roadshow • Singapore – 3 October 2011• Taipei – 6 October 2011 • Seoul – 11 October 2011For more information and to register, please visit