0 Leakage Evaluated and Controlled from Industrial Process Pipeline by Optimum Gasket Assembly Stress Jer-Pei Fang, Chi-Min Shu and Yu-Ching Chen Process Safety and Disaster Prevention Laboratory, Department of Environmental and Safety Engineering, National Yunlin and University of Science and Technology, Touliu, Yunlin, Taiwan 640, R.O.C. Shu-Ching Chen Distributed Multimedia Information System Laboratory, School of Computer Science, Florida International University, Miami, FL 33199, U.S.A. Mei-Ling Shyu Department of Electrical and Computer Engineering, University of Miami, Coral Gables, FL 33124-0640, U.S.A. Abstract Air pollution studies for hazardous gases in Taiwan generally consider the impact on the human body, and always put the emphasis on large immobile and mobile pollution sources (like chimneys and vehicles), but they have ignore the leakage between pipelines in process industries. When hazardous materials leak imperceptibly, they increase the pathogenic risk to the workers at the workplace. Since 1937, traditional designers of gasket bolted joints have always utilized the “y” factor for seating yield, and the “m” factor for maintaining the gasket load under operating conditions as per ASME Boiler and Pressure Vessel Code. If industries still continue to utilize these simple and obsolete methods to seal flanges and attempt to reduce emission, how can they correctly select the right gasket materials and determine optimal loading as well as operating conditions to ensure required gasket sealing performance? During the last 30 years, more new gasket materials have been introduced to achieve required emission performance. The old factors are not appropriate for the new gasket materials, because there are no comparable test methods for “m” and “y”, and claims for reduced emission based on “m” and “y” cannot be verified. This study will ultimately result in a complete proposal to prevent any hazardous gas leaks in the process industries, to protect workers involved at the source of the hazardous gases, and to analyze the risk for workers. Keywords: leakage, gasket, flange, risk
Transcript
0
Leakage Evaluated and Controlled from Industrial Process Pipeline by
Optimum Gasket Assembly Stress
Jer-Pei Fang, Chi-Min Shu and Yu-Ching Chen Process Safety and Disaster Prevention Laboratory,
Department of Environmental and Safety Engineering,
National Yunlin and University of Science and Technology,
Touliu, Yunlin, Taiwan 640, R.O.C.
Shu-Ching Chen
Distributed Multimedia Information System Laboratory, School of Computer Science,
Florida International University, Miami, FL 33199, U.S.A.
Mei-Ling Shyu
Department of Electrical and Computer Engineering, University of Miami,
Coral Gables, FL 33124-0640, U.S.A.
Abstract Air pollution studies for hazardous gases in Taiwan generally consider the impact on
the human body, and always put the emphasis on large immobile and mobile
pollution sources (like chimneys and vehicles), but they have ignore the leakage
between pipelines in process industries. When hazardous materials leak
imperceptibly, they increase the pathogenic risk to the workers at the workplace.
Since 1937, traditional designers of gasket bolted joints have always utilized the “y”
factor for seating yield, and the “m” factor for maintaining the gasket load under
operating conditions as per ASME Boiler and Pressure Vessel Code. If industries still
continue to utilize these simple and obsolete methods to seal flanges and attempt to
reduce emission, how can they correctly select the right gasket materials and
determine optimal loading as well as operating conditions to ensure required gasket
sealing performance? During the last 30 years, more new gasket materials have been
introduced to achieve required emission performance. The old factors are not
appropriate for the new gasket materials, because there are no comparable test
methods for “m” and “y”, and claims for reduced emission based on “m” and “y”
cannot be verified. This study will ultimately result in a complete proposal to prevent
any hazardous gas leaks in the process industries, to protect workers involved at the
source of the hazardous gases, and to analyze the risk for workers.
Keywords: leakage, gasket, flange, risk
1
1. Introduction In the past few decades, evaluation of tightness property in gaskets has been
considerably poor. , Visual observation is usually the way to determine whether
leakage occurs. If on-scene workers determine the happening of leakage through
eye-seeing, then leakage should not have occurred in gasket being tightly locked in
flange. In long-term practical applications, a large amount of liquid leakage, however,
still takes place, and these leaking fluids can hardly be seen simply by eyes or sensed
by their odor. In practice, the occurrence of these leakage incidents has something to
do with false selection of gaskets, inappropriate setting and repair, as well as poor
maintenance.
In the traditional gasket design, obtaining the stress of a setting is based on a
simple calculation. Since the 1950s, the “m” and “y” factors have been the most vital
and widely accepted, designed and used by persons who set the gaskets [1][2]. In the
present design and model, the “m” and “y” factors have played a crucial role because
they can be used to realize some traits of closeness in the gasket. In practical
applications, the real meaning, however, lies in the fact that liquid cannot leak out.
Unfortunately, the standard on leakage has not yet been clearly defined. “To see is to
believe” and “to smell is to know” are merely the ways to evaluate the leakage. Such
methods lack the idea of measuring leakage by quantity, that is, the meanings that “m”
and “y” stand for. Under such circumstances, they are only concerned if pipelines
have leakages or not in normal operating conditions. Since leakage is judged by the
senses, for low odor threshold and highly toxic materials, workers near pipelines have
taken in poisonous material unconsciously. By the time that these toxin materials are
sensed and leakage is seen, the concentration in the surroundings has long already
reached the degree of damage to workers’ health. Judging from the design scale of
gaskets by the American Society of Mechanical Engineers (ASME), these documents
of design models do not over-demand the tightness property of tightness joints, and
they only require tightness that will not lead to large amount of leakage due to the
influence of manufacturing conditions, damage of gasket or crushing by too high
2
process pressure and so on [3].
In general, an industrial manufacturing process is made up of many pipelines
with different materials and operating conditions. In view of real situations, flanges
used to connect pipelines likely have liquid leaks between pipelines without proper
ways to set gaskets. Taking 1.3-Butadiene (BD) for an example, the earliest
TWA-PELs is required to be 1,000 ppm. However, many animal tests have shown that
it causes cancer to rats and mice[4][5]. Thus, the Occupational Safety and Health
Administration (OSHA) lowered TWA-PELs to 2 ppm and to 1 ppm in 1992 and 1997,
respectively. Even under well-controlled situations, in the manufacturing
environment of Taiwan it is hard to meet the stringent standard of 1 ppm for BD.
From a practical standpoint currently in Taiwan, TWA-PELs of 13-BD can only be
restricted to 10 ppm.
In the early 1990s, based on the Clean Air Act Amendment (CAAA), the USA
put forth the flange, which has potentially a large amount of liquid leakage by regular
control. In practice, it mainly targets dangerous air-polluting materials. In the long
term, “m” and “y” factors have not yet satisfied the accuracy and applicability that the
closeness property demands. Thus, they have been questioned and discussed since
then. After the mid-1970s, with a view to the above-mentioned problem, ASME
developed various technologies to predict seal performance for proper evaluation of
gaskets so as to propose a more exact and efficient measurement standard of closeness
property in gaskets and operating limits of asbestos-free gasket material. Since the
1970s, some new seal researches have been developed by industrial groups including
the Pressure Vessel Research Council (PVRC) and the Materials Technology Institute
of the Chemical Process Industries (MTI), that have started to work on the
development of testing research in the gaskets. Accordingly, ROTT testing was
developed in this period [6].
From a practical viewpoint, through a flange joint, it is technically impossible to
stop completely the leakage between flanges. Since flange joints cannot seal a fine
surface seam, the design of the gasket actually allows a minute amount of leakage to
occur. Leakage scale and rate in different gasket materials will be discussed as to the
tightness because they are directly related to the amount of leakage.
PVRC and other American industrial organizations have come up with a series of
closeness evaluation techniques that can replace the old “m” and “y” factors. These
measurement techniques can more effectively and accurately describe the closeness
property of gaskets and the differences in application. Based on the testing analysis of
ROTT, seal parameters are developed to assist in more accurate gasket design.
These newly developed parameters are “Gs”, “Gb”, and factor “a”. “Gb” and factor
“a” mainly reflect the closeness property of the gaskets during the setting, and “Gb” is
the degree of sensitivity. While inner pressure decreases, Tp (tightness parameter) and
3
Sg (gasket stresses) would monotonically go down. In particular, three parameters are
based on the analysis of ROTT and testing and evaluated by engineering calculations.
Processed by standard linear recycling, every parameter differs with the material,
thickness, density and processing ways of the tested gaskets, to name a few. These
parameters, however, do not directly reflect the closeness property of gaskets but will
be used in the mathematical operation induced by ROTT testing. As a result, these
new parameters differ greatly with the old “m” and “y” factors [7][8].
4
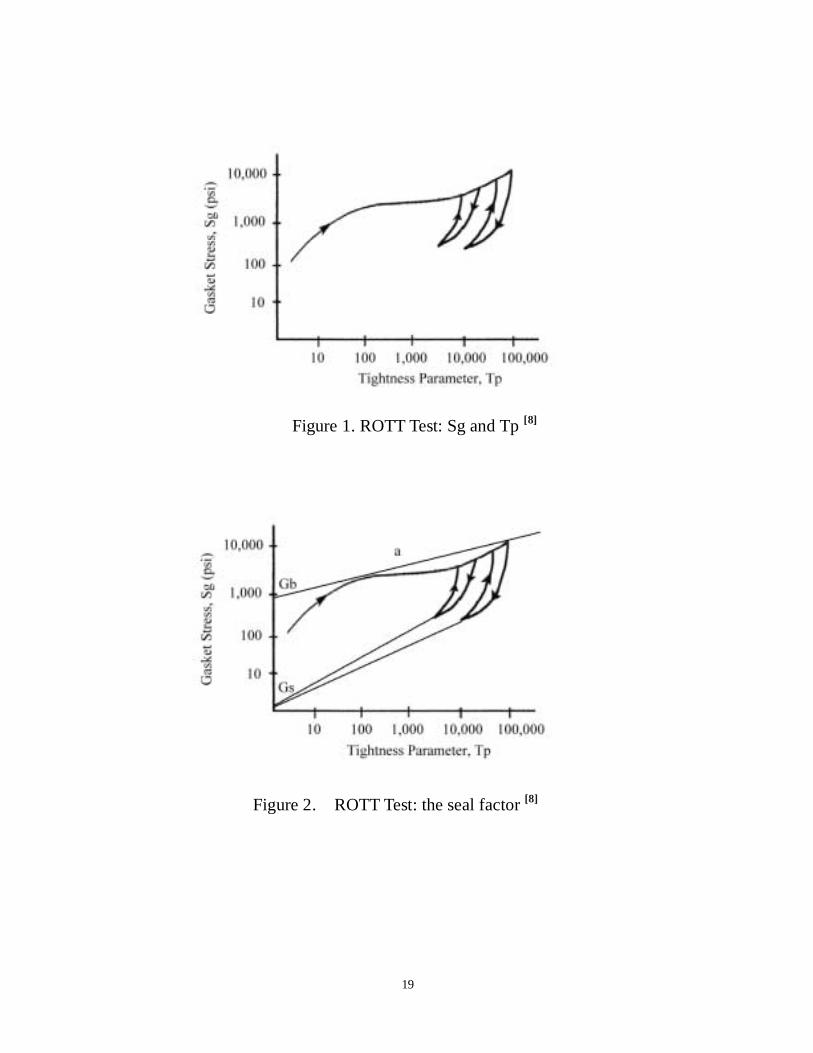
2. Room Temperature Tightness (ROTT) ROTT mainly has pressurized nitrogen, 400 psig and 800 psig, as the testing
condition. In practice, testing results will illustrate the seal performance of gaskets
and reflect the circular stress-varying situation of the gaskets. Essentially, ROTT tests
are mainly divided into two parts. The first part can be obtained from ROTT testing,
as shown in Fig. 1. Gaskets under testing take a stress rating, 1,000~10,000 psi, to
observe the changes in seal parameters. Normally, gaskets of better seal properties
get higher Tp(max). On the other hand, they also help to classify the seal properties and
serve as a reference for the choice of material. In the second part, after the fluid
pressure goes through repeated switch-on and switch-off, and most gaskets under
testing undergo three thorough cyclings; gasket stresses (Sg) vary between 1,000 ~
10,000 psi. These two parts of data are shown in Fig. 2, and seal properties of
gaskets are to follow the fixed-amount analysis of leakage rate and mathematical
deduction. Therefore, the main purpose in analyzing Fig. 2 is to obtain the values
“Gb” and “a” which both indicate characteristics of tightness, along with “Gs” of seal
traits [9][10].
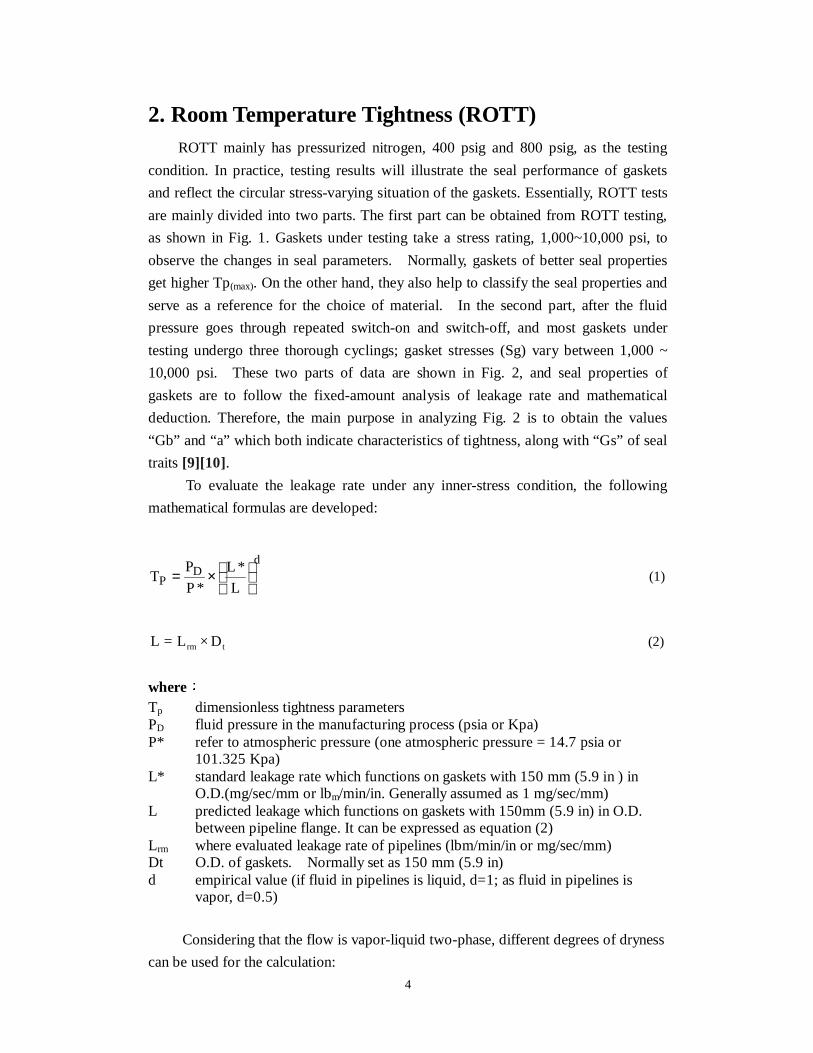
To evaluate the leakage rate under any inner-stress condition, the following
mathematical formulas are developed:
dD
P L
*L
*P
PT
×= (1)
trm D×L=L (2)
where Tp dimensionless tightness parameters PD fluid pressure in the manufacturing process (psia or Kpa) P* refer to atmospheric pressure (one atmospheric pressure = 14.7 psia or
101.325 Kpa) L* standard leakage rate which functions on gaskets with 150 mm (5.9 in ) in
O.D.(mg/sec/mm or lbm/min/in. Generally assumed as 1 mg/sec/mm) L predicted leakage which functions on gaskets with 150mm (5.9 in) in O.D.
between pipeline flange. It can be expressed as equation (2) Lrm where evaluated leakage rate of pipelines (lbm/min/in or mg/sec/mm) Dt O.D. of gaskets. Normally set as 150 mm (5.9 in) d empirical value (if fluid in pipelines is liquid, d=1; as fluid in pipelines is
vapor, d=0.5)
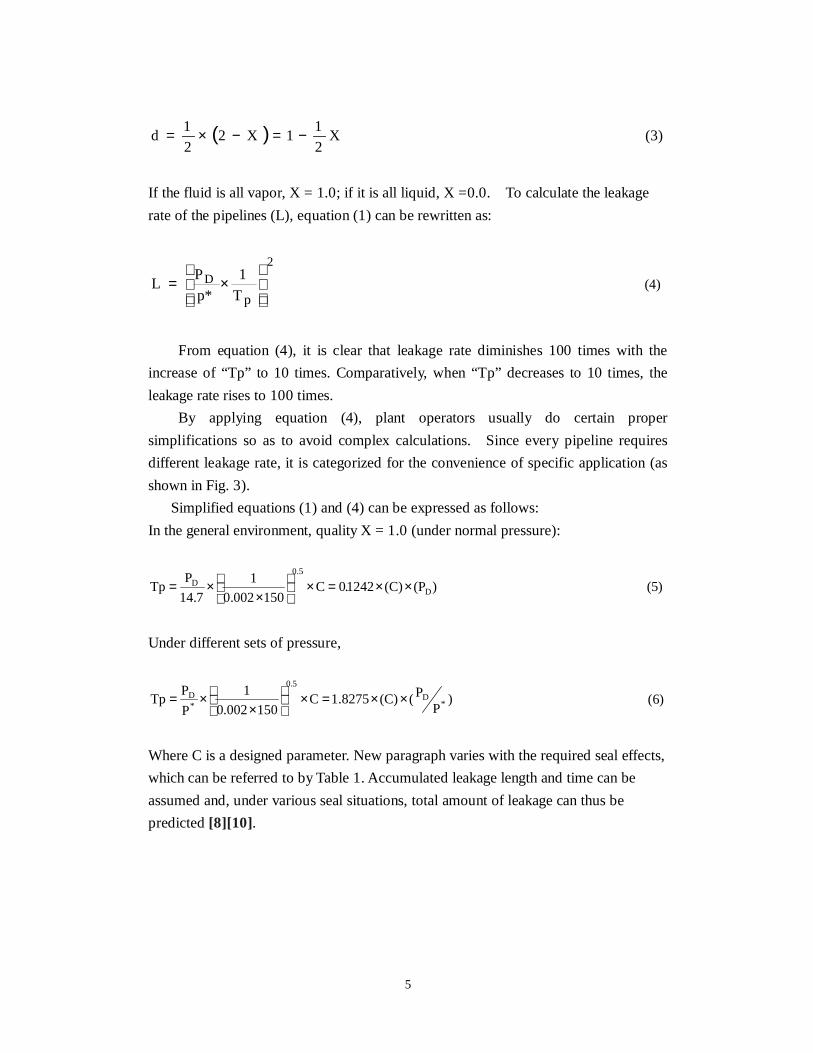
Considering that the flow is vapor-liquid two-phase, different degrees of dryness
can be used for the calculation:
5
( ) X21
1X221
d −=−×= (3)
If the fluid is all vapor, X = 1.0; if it is all liquid, X =0.0. To calculate the leakage
rate of the pipelines (L), equation (1) can be rewritten as:
×=
pT
1
p*
PL D
2
(4)
From equation (4), it is clear that leakage rate diminishes 100 times with the
increase of “Tp” to 10 times. Comparatively, when “Tp” decreases to 10 times, the
leakage rate rises to 100 times.
By applying equation (4), plant operators usually do certain proper
simplifications so as to avoid complex calculations. Since every pipeline requires
different leakage rate, it is categorized for the convenience of specific application (as
shown in Fig. 3).
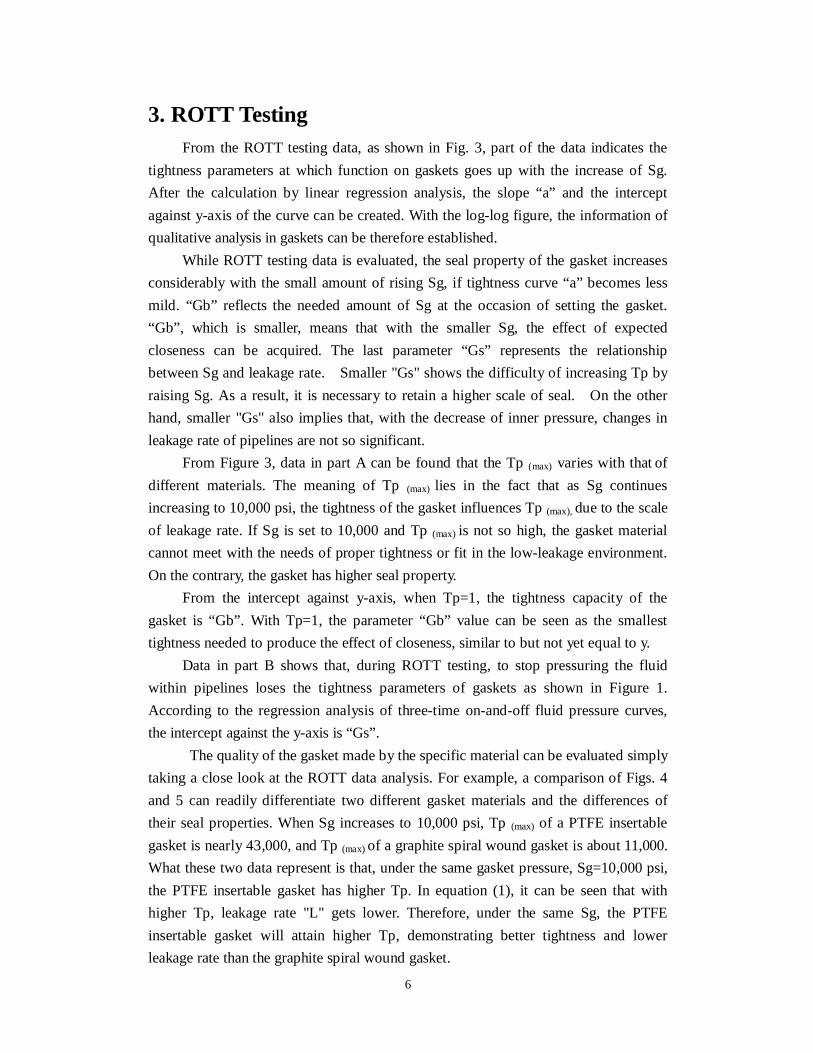
Simplified equations (1) and (4) can be expressed as follows:
In the general environment, quality X = 1.0 (under normal pressure):
)(P(C)1242.0C150002.0
1
7.14
PTp D
5.0D ××=×
××= (5)
Under different sets of pressure,
)P
P((C)8275.1C150002.0
1
P
PTp *
D
5.0
*D ××=×
××= (6)
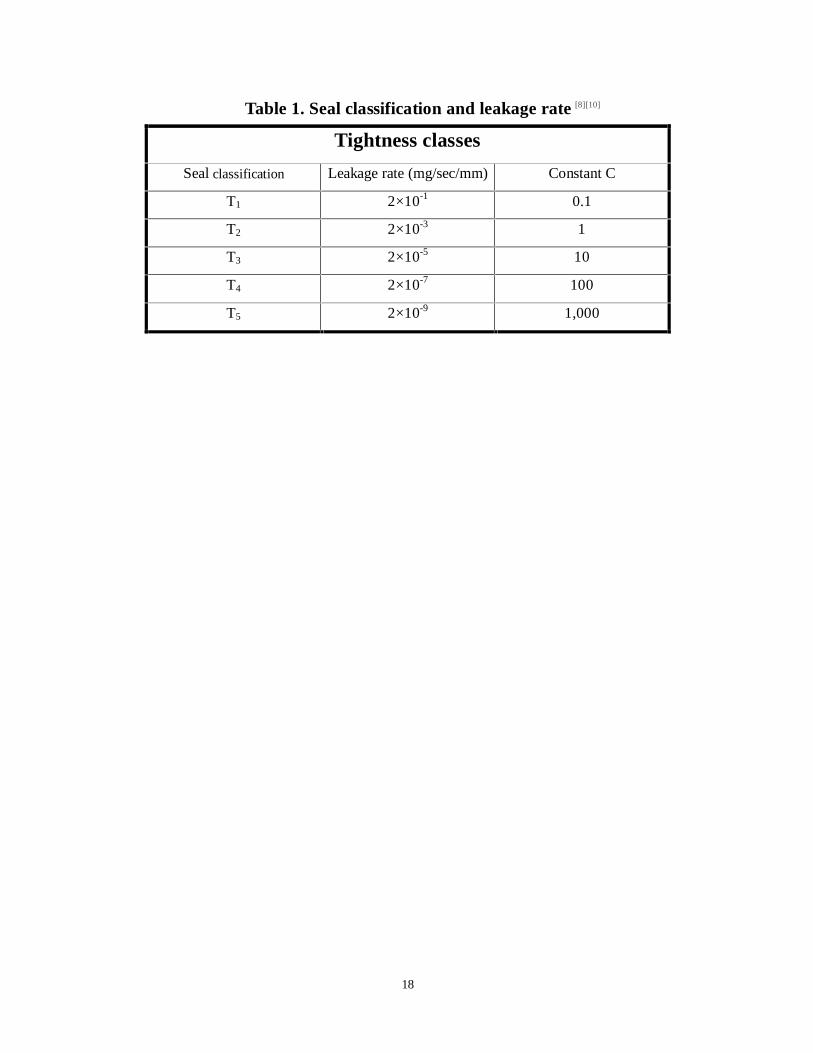
Where C is a designed parameter. New paragraph varies with the required seal effects,
which can be referred to by Table 1. Accumulated leakage length and time can be
assumed and, under various seal situations, total amount of leakage can thus be
predicted [8][10].
6
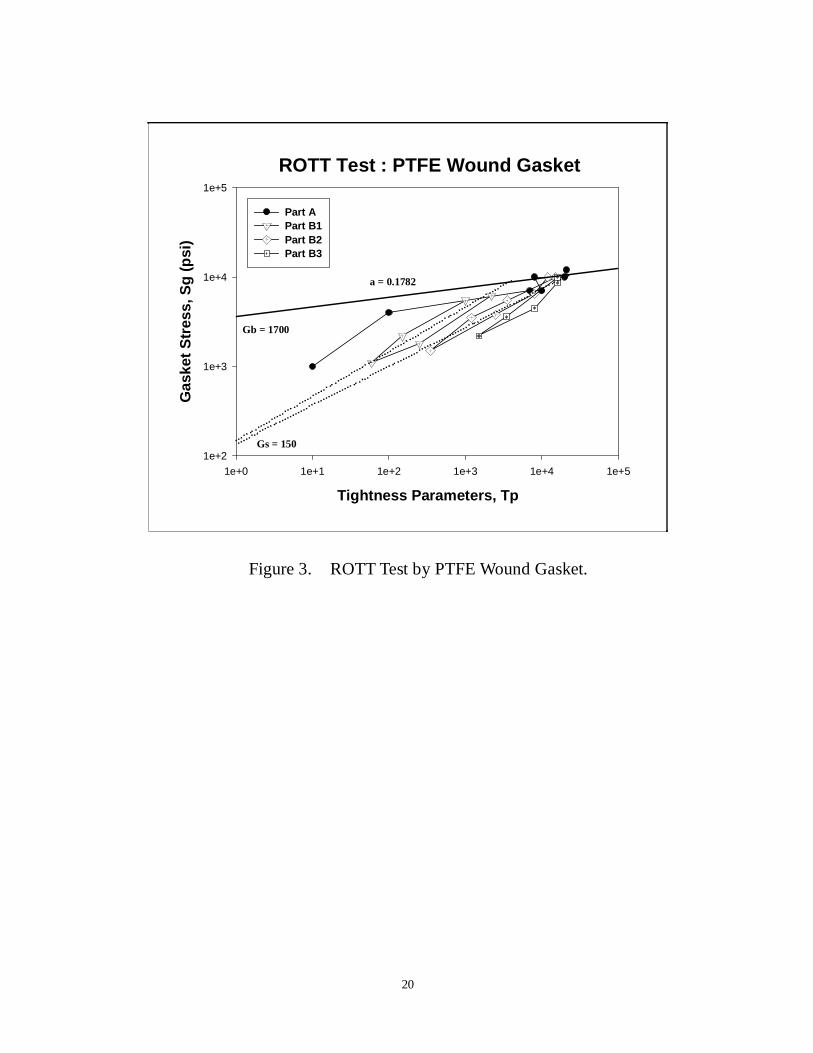
3. ROTT Testing From the ROTT testing data, as shown in Fig. 3, part of the data indicates the
tightness parameters at which function on gaskets goes up with the increase of Sg.
After the calculation by linear regression analysis, the slope “a” and the intercept
against y-axis of the curve can be created. With the log-log figure, the information of
qualitative analysis in gaskets can be therefore established.
While ROTT testing data is evaluated, the seal property of the gasket increases
considerably with the small amount of rising Sg, if tightness curve “a” becomes less
mild. “Gb” reflects the needed amount of Sg at the occasion of setting the gasket.
“Gb”, which is smaller, means that with the smaller Sg, the effect of expected
closeness can be acquired. The last parameter “Gs” represents the relationship
between Sg and leakage rate. Smaller "Gs" shows the difficulty of increasing Tp by
raising Sg. As a result, it is necessary to retain a higher scale of seal. On the other
hand, smaller "Gs" also implies that, with the decrease of inner pressure, changes in
leakage rate of pipelines are not so significant.
From Figure 3, data in part A can be found that the Tp (max) varies with that of
different materials. The meaning of Tp (max) lies in the fact that as Sg continues
increasing to 10,000 psi, the tightness of the gasket influences Tp (max), due to the scale
of leakage rate. If Sg is set to 10,000 and Tp (max) is not so high, the gasket material
cannot meet with the needs of proper tightness or fit in the low-leakage environment.
On the contrary, the gasket has higher seal property.
From the intercept against y-axis, when Tp=1, the tightness capacity of the
gasket is “Gb”. With Tp=1, the parameter “Gb” value can be seen as the smallest
tightness needed to produce the effect of closeness, similar to but not yet equal to y.
Data in part B shows that, during ROTT testing, to stop pressuring the fluid
within pipelines loses the tightness parameters of gaskets as shown in Figure 1.
According to the regression analysis of three-time on-and-off fluid pressure curves,
the intercept against the y-axis is “Gs”.
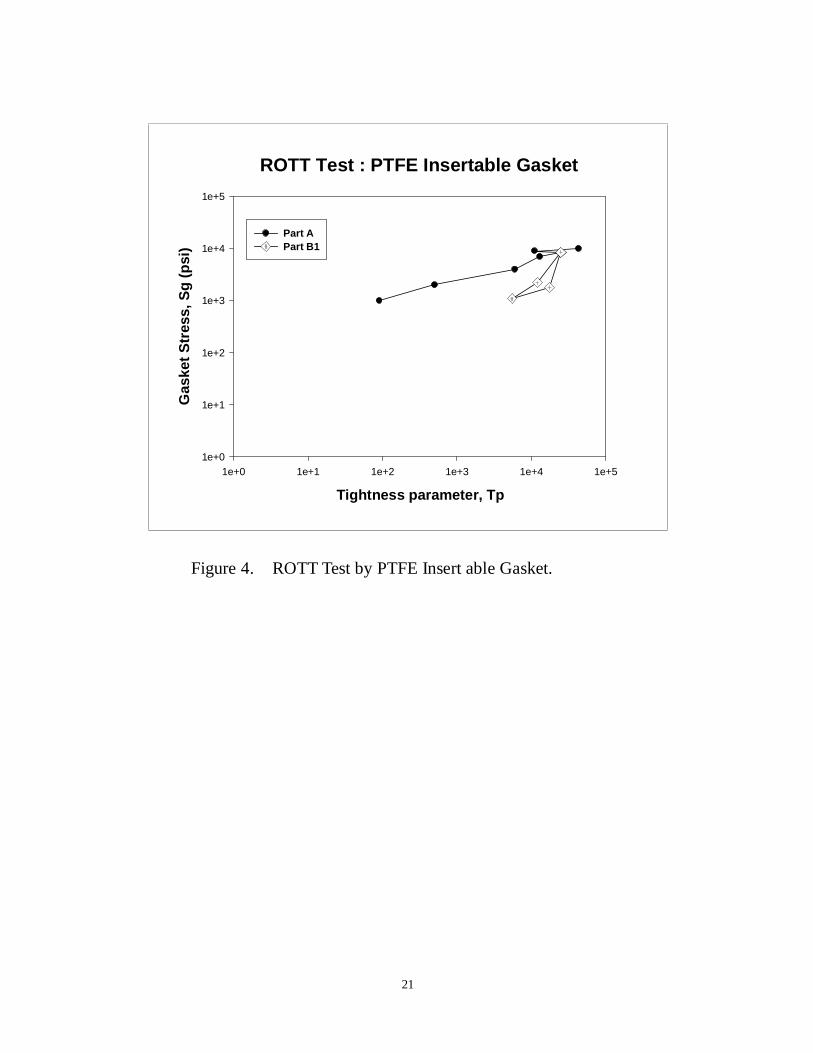
The quality of the gasket made by the specific material can be evaluated simply
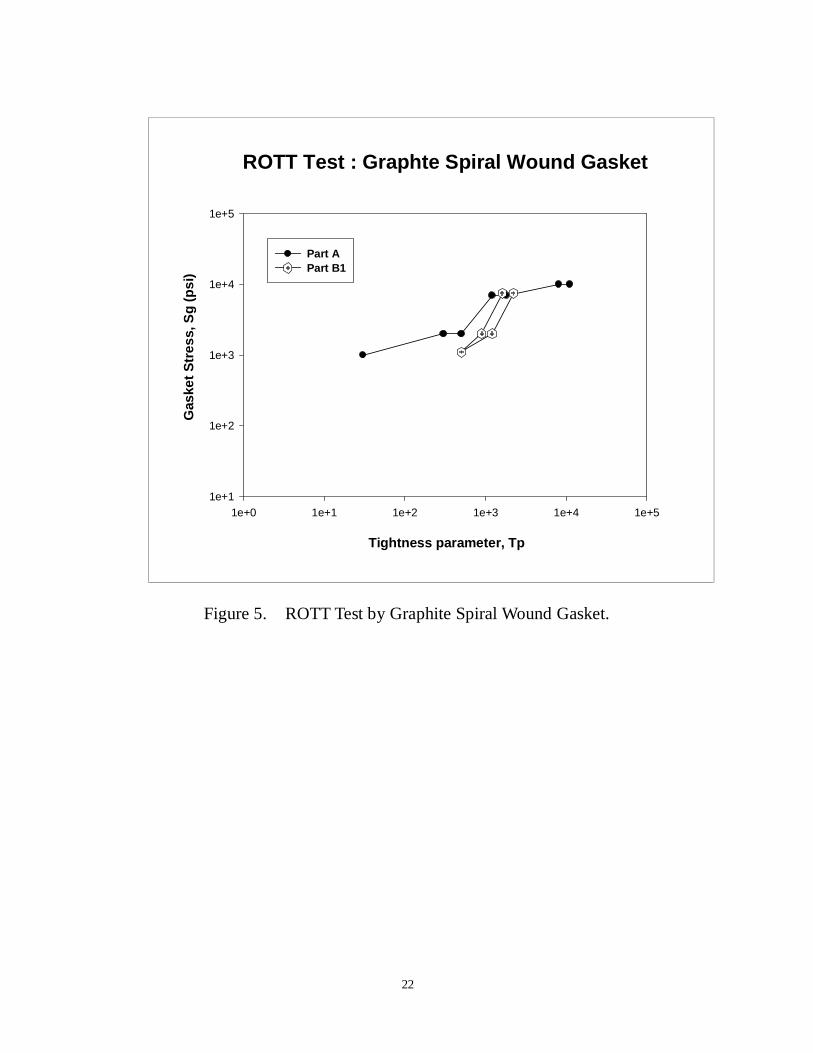
taking a close look at the ROTT data analysis. For example, a comparison of Figs. 4
and 5 can readily differentiate two different gasket materials and the differences of
their seal properties. When Sg increases to 10,000 psi, Tp (max) of a PTFE insertable
gasket is nearly 43,000, and Tp (max) of a graphite spiral wound gasket is about 11,000.
What these two data represent is that, under the same gasket pressure, Sg=10,000 psi,
the PTFE insertable gasket has higher Tp. In equation (1), it can be seen that with
higher Tp, leakage rate "L" gets lower. Therefore, under the same Sg, the PTFE
insertable gasket will attain higher Tp, demonstrating better tightness and lower
leakage rate than the graphite spiral wound gasket.
7
Comparing the relatively linear parts of curves in Figs. 4 and 5, it can be found
that, as the PTFE insertable gasket is between 1,000 and 7,000 psi, Tp increases 278
times in total (Tp=90~25,000). In contrast, while the Sg of graphite spiral wound
gasket is between 1,000 and 7,000 psi, it increases only 60 times (Tp=30~1,800).
From the loss of Tp, while Sg decreases to 1,000 psi from 10,000 with the fluid
pressure decrease within pipelines, the loss of PTFE insertable gasket is not
significant. Compared with the graphite spiral wound gasket, Tp decreases
considerably. From another perspective, as the inner pressure stops functioning, the
PTFE insertable gasket can maintain higher Tp than the graphite spiral wound gasket.
8
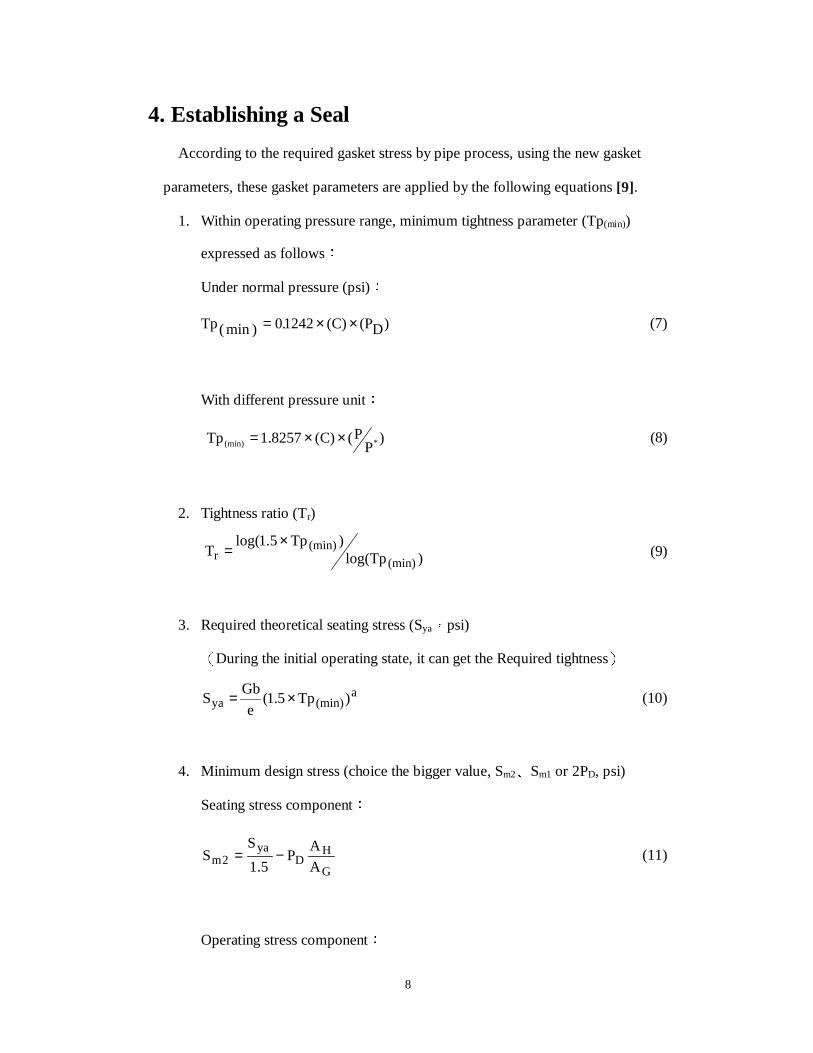
4. Establishing a Seal
According to the required gasket stress by pipe process, using the new gasket
parameters, these gasket parameters are applied by the following equations [9].
1. Within operating pressure range, minimum tightness parameter (Tp(min))
expressed as follows
Under normal pressure (psi)
)D(P(C)1242.0)min(Tp ××= (7)
With different pressure unit
)P
P()C(8257.1Tp *(min) ××= (8)
2. Tightness ratio (Tr)
)Tplog()Tp5.1log(
T(min)
(min)r
×= (9)
3. Required theoretical seating stress (Sya psi)
During the initial operating state, it can get the Required tightness
a(min)ya )Tp5.1(
e
GbS ×= (10)
4. Minimum design stress (choice the bigger value, Sm2 Sm1 or 2PD, psi)
Seating stress component
G
HD
ya2m A
AP
5.1
SS −= (11)
Operating stress component
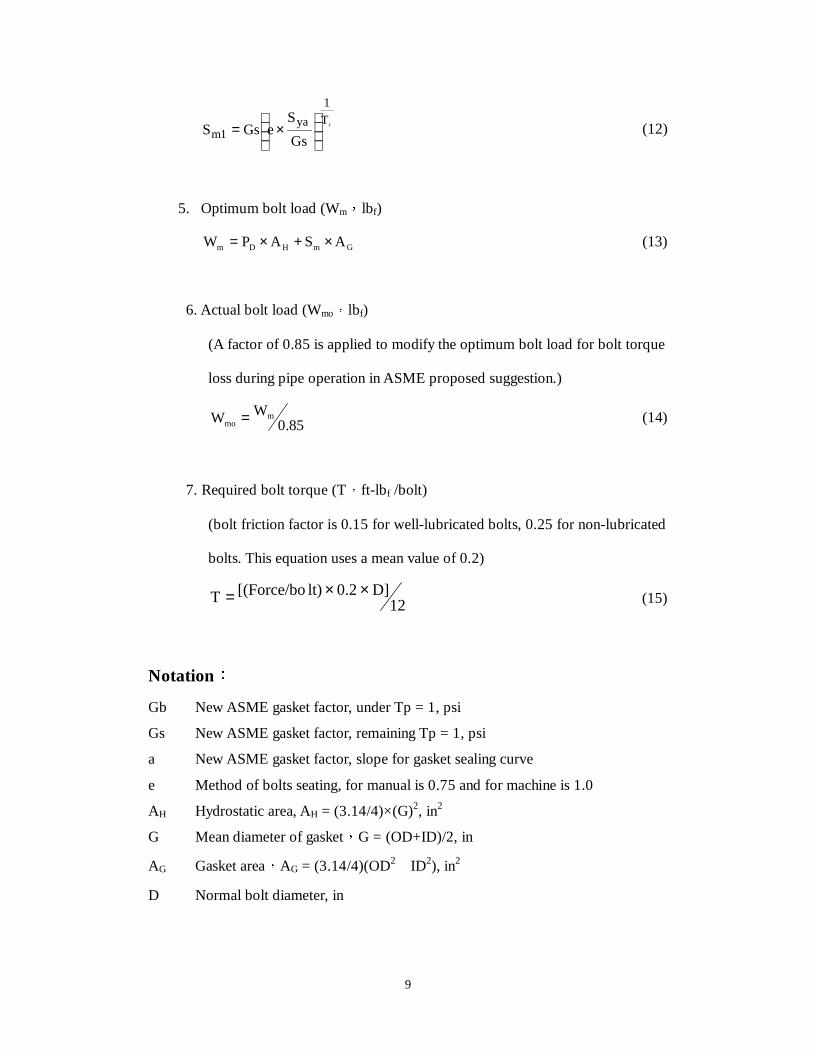
9
rT
1
ya1m Gs
SeGsS
×= (12)
5. Optimum bolt load (Wm lbf)
GmHDm ASAPW ×+×= (13)
6. Actual bolt load (Wmo lbf)
(A factor of 0.85 is applied to modify the optimum bolt load for bolt torque
loss during pipe operation in ASME proposed suggestion.)
85.0WW m
mo = (14)
7. Required bolt torque (T ft-lbf /bolt)
(bolt friction factor is 0.15 for well-lubricated bolts, 0.25 for non-lubricated
bolts. This equation uses a mean value of 0.2)
12D]0.2lt)[(Force/boT ××= (15)
Notation
Gb New ASME gasket factor, under Tp = 1, psi
Gs New ASME gasket factor, remaining Tp = 1, psi
a New ASME gasket factor, slope for gasket sealing curve
e Method of bolts seating, for manual is 0.75 and for machine is 1.0
AH Hydrostatic area, AH = (3.14/4)×(G)2, in2
G Mean diameter of gasket G = (OD+ID)/2, in
AG Gasket area AG = (3.14/4)(OD2 ID2), in2
D Normal bolt diameter, in
10
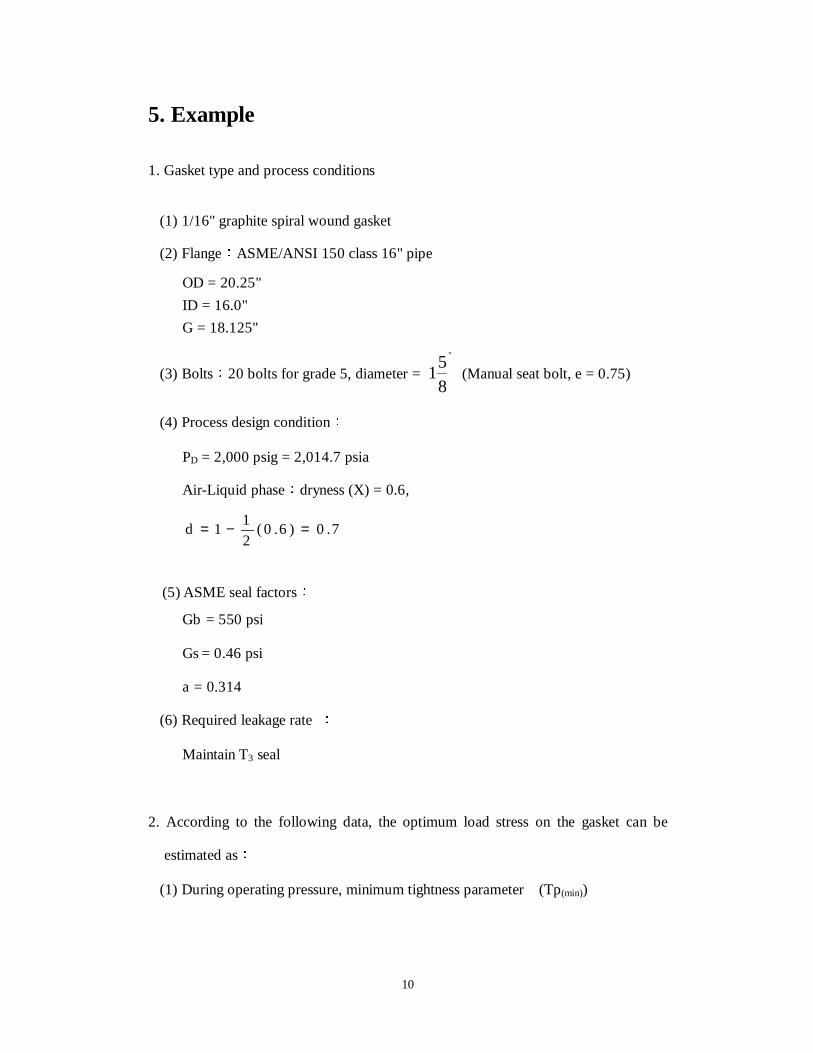
5. Example
1. Gasket type and process conditions
(1) 1/16" graphite spiral wound gasket
(2) Flange ASME/ANSI 150 class 16" pipe
OD = 20.25"
ID = 16.0"
G = 18.125"
(3) Bolts 20 bolts for grade 5, diameter = "
8
51 (Manual seat bolt, e = 0.75)
(4) Process design condition
PD = 2,000 psig = 2,014.7 psia
Air-Liquid phase dryness (X) = 0.6,
7.0)6.0(21
1d =−=
(5) ASME seal factors
Gb0= 550 psi
Gs = 0.46 psi
a0= 0.314
(6) Required leakage rate
Maintain T3 seal
2. According to the following data, the optimum load stress on the gasket can be
estimated as
(1) During operating pressure, minimum tightness parameter (Tp(min))
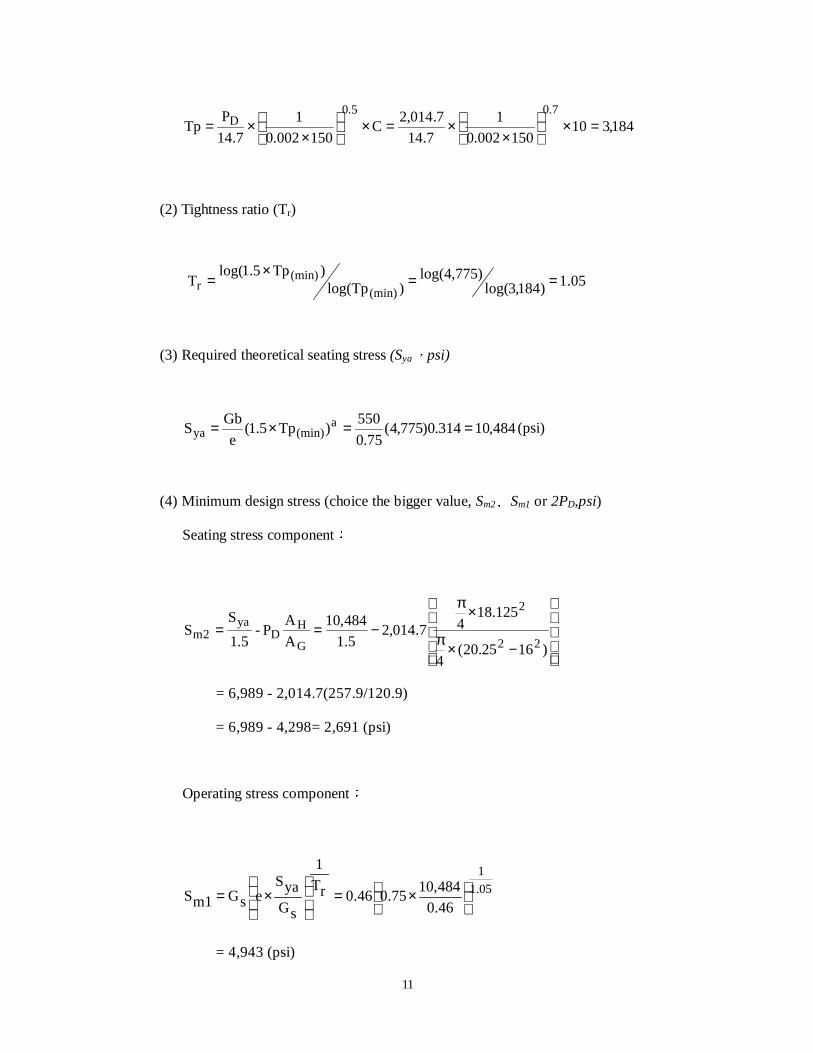
11
184,310150002.0
1
7.14
7.014,2C
150002.0
1
7.14
PTp
7.05.0D =×
××=×
××=
(2) Tightness ratio (Tr)
05.1)184,3log()775,4log(
)Tplog()Tp5.1log(
T(min)
(min)r ==
×=
(3) Required theoretical seating stress (Sya psi)
484,10314.0)775,4(75.0
550)Tp5.1(
e
GbS a
(min)ya ==×= (psi)
(4) Minimum design stress (choice the bigger value, Sm2 Sm1 or 2PD,psi)
Seating stress component
−×π
×π
−==)1625.20(
4
125.1847.014,2
5.1
484,10
A
AP-
5.1
SS
22
2
G
HD
ya2m
= 6,989 - 2,014.7(257.9/120.9)
= 6,989 - 4,298= 2,691 (psi)
Operating stress component
05.1
1
46.0
484,1075.046.0rT
1
sGyaS
esGm1S
×=
×=
= 4,943 (psi)
12
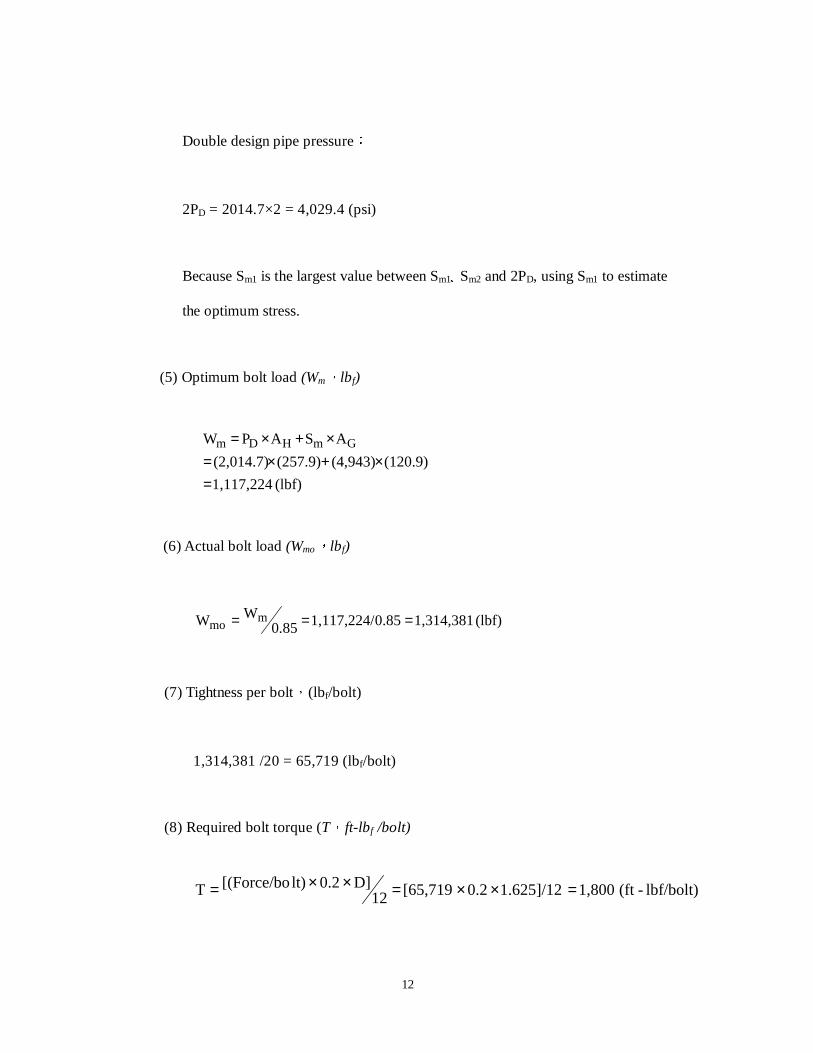
Double design pipe pressure
2PD = 2014.7×2 = 4,029.4 (psi)
Because Sm1 is the largest value between Sm1 Sm2 and 2PD, using Sm1 to estimate