Ag Credit Agricultural Credit Association 1 Ag Credit Agricultural Credit Association THIRD QUARTER 2014 TABLE OF CONTENTS Report on Internal Control Over Financial Reporting.................................................................... 2 Management’s Discussion and Analysis of Financial Condition and Results of Operations.................................................................... 3 Consolidated Financial Statements Consolidated Balance Sheets ................................................................................................ 6 Consolidated Statements of Comprehensive Income........................................................... 7 Consolidated Statements of Changes in Members’ Equity.................................................. 8 Notes to the Consolidated Financial Statements ............................................................................ 9 CERTIFICATION The undersigned certify that we have reviewed the September 30, 2014 quarterly report of Ag Credit Agricultural Credit Association, that the report has been prepared under the oversight of the Audit Committee of the Board of Directors and in accordance with all applicable statutory or regulatory requirements, and that the information contained herein is true, accurate, and complete to the best of our knowledge and belief. Brian J. Ricker Chief Executive Officer Daniel E. Ebert Chief Financial Officer S. Jerry Layman Chairman of the Board November 7, 2014
Transcript
Ag Credit Agricultural Credit Association 1
Ag Credit Agricultural Credit Association
THIRD QUARTER 2014
TABLE OF CONTENTS
Report on Internal Control Over Financial Reporting .................................................................... 2
Management’s Discussion and Analysis of
Financial Condition and Results of Operations .................................................................... 3
Consolidated Statements of Comprehensive Income ........................................................... 7
Consolidated Statements of Changes in Members’ Equity .................................................. 8
Notes to the Consolidated Financial Statements ............................................................................ 9
CERTIFICATION
The undersigned certify that we have reviewed the September 30, 2014 quarterly report of Ag
Credit Agricultural Credit Association, that the report has been prepared under the oversight of
the Audit Committee of the Board of Directors and in accordance with all applicable statutory or
regulatory requirements, and that the information contained herein is true, accurate, and complete
to the best of our knowledge and belief. Brian J. Ricker Chief Executive Officer Daniel E. Ebert Chief Financial Officer S. Jerry Layman Chairman of the Board November 7, 2014
Ag Credit Agricultural Credit Association 2
Ag Credit Agricultural Credit Association
Report on Internal Control Over Financial Reporting
The Association’s principal executives and principal financial
officers, or persons performing similar functions, are
responsible for establishing and maintaining adequate internal
control over financial reporting for the Association’s
Consolidated Financial Statements. For purposes of this report,
“internal control over financial reporting” is defined as a
process designed by, or under the supervision of the
Association’s principal executives and principal financial
officers, or persons performing similar functions, and effected
by its Board of Directors, management and other personnel, to
provide reasonable assurance regarding the reliability of
financial reporting information and the preparation of the
Consolidated Financial Statements for external purposes in
accordance with accounting principles generally accepted in the
United States of America and includes those policies and
procedures that:
1) Pertain to the maintenance of records that in
reasonable detail accurately and fairly reflect the
transactions and dispositions of the assets of the
Association,
2) Provide reasonable assurance that transactions are
recorded as necessary to permit preparation of
financial information in accordance with accounting
principles generally accepted in the United States of
America, and that receipts and expenditures are being
made only in accordance with authorizations of
management and directors of the Association, and
3) Provide reasonable assurance regarding prevention or
timely detection of unauthorized acquisition, use or
disposition of the Association’s assets that could have
a material effect on its Consolidated Financial
Statements.
The Association’s management has completed an assessment of
the effectiveness of internal control over financial reporting as
of September 30, 2014. In making the assessment, management
used the framework in Internal Control — Integrated
Framework, promulgated by the Committee of Sponsoring
Organizations of the Treadway Commission, commonly
referred to as the “COSO” criteria.
Based on the assessment performed, the Association concluded
that as of September 30, 2014, the internal control over
financial reporting was effective based upon the COSO (1992)
criteria. Additionally, based on this assessment, the Association
determined that there were no material weaknesses in the
internal control over financial reporting as of September 30,
2014.
Brian J. Ricker
Chief Executive Officer
Daniel E. Ebert
Chief Financial Officer
November 7, 2014
Ag Credit Agricultural Credit Association 3
Ag Credit Agricultural Credit Association
Management’s Discussion and Analysis
of Financial Condition and Results of Operations
The following commentary reviews the financial condition and results of operations of Ag Credit Agricultural Credit Association (Association) for the nine months ended September 30, 2014. These comments should be read in conjunction with the accompanying consolidated financial statements, notes to the consolidated financial statements, the Association’s September 30, 2013 quarterly report and the 2013 Annual Report of the Association. The accompanying consolidated financial statements (financial statements) were prepared under the oversight of the Audit Committee of the Board of Directors, which includes Michael W. Stump, David M. Stott, Ph.D., CPA and Gary L. Baldosser. The results for the first nine months of 2014 are not necessarily indicative of results to be expected for the year. LOAN PORTFOLIO The Association provides funds to farmers, rural homeowners, and farm-related businesses for financing of short and intermediate-term loans and long-term real estate mortgage loans through numerous product types. The Association’s loan portfolio consists predominantly of general cash grains (primarily soybeans, corn and wheat) which constitute about 62 percent of the entire portfolio as of September 30, 2014. The Association recognizes the commodity concentration risk exceeds normally accepted industry standards. This risk, along with the risk associated with large loans, is reduced by members’ off-farm income, utilization of crop insurance, and the use of FSA, USDA, Business and Industry and Farmer Mac loan guarantees. As of September 30, 2014 the Association had $477,556 of guaranteed loan volume, which is 32.29 percent of loans as compared to $439,791 of guaranteed volume or 32.04 percent of the portfolio at September 30, 2013. Loan guarantees reduce the potential of loss in the Association’s loan portfolio and help to leverage the Association’s capital.
Gross loan volume of the Association as of September 30, 2014 was $1,478,936, an increase of $5,477 or 0.37 percent as compared to $1,473,459 at December 31, 2013. The increase in loan volume primarily relates to an increase in real estate mortgage and rural residential real estate volume, offset partially by a decrease in production and intermediate-term (IT) volume. The reduction in production and IT loans relates to the normal seasonal pay-downs on lines of credit during the first half of the year from grain sales. From September 30, 2013 to September 30, 2014 volume increased by $106,453 or 7.76 percent. The increase in loan volume primarily relates to an increase in production and IT, real estate mortgage and rural residential real estate volume.
Net loans outstanding at September 30, 2014 were $1,463,523 as compared to $1,458,025 at December 31, 2013. Net loans accounted for 95.05 percent of total assets at September 30, 2014 as compared to 94.39 percent at December 31, 2013. The following table summarizes the Association’s risk assets (accruing volume includes accrued interest receivable):
9/30/14 12/31/13
Nonaccrual loans $ 11,344 $ 15,015 Accruing restructured loans – – Accruing loans 90 days or more past due – – Total high risk loans 11,344 15,015 Other property owned 18 763
Total high-risk assets $ 11,362 $ 15,778
Ratios: Nonaccrual loans to total loans 0.77% 1.02%High-risk assets to total assets 0.74% 1.02%
High risk assets decreased during the first nine months of 2014 primarily as a result of payments from a large commercial entity in nonaccrual status and due to a reduction of nonaccrual loans. Other property owned (OPO) decreased as a result of the sale of an OPO and partial settlement of another OPO. There is an inherent risk in the extension of any type of credit, and accordingly, the Association maintains an allowance for loan losses consistent with the risk measured in the portfolio. General portfolio credit quality improved during the first nine months of 2014 and remains strong. Credit administration is satisfactory.
During the first nine months of 2014 the Association recorded $21 of charge-offs and no recoveries or provision for loan losses. For the same period of 2013, the Association recorded charge-offs of $7,633, no recoveries and $431 provision for loan losses. The allowance for loan losses represented 1.04 percent and 1.05 percent of loans at September 30, 2014 and December 31, 2013, respectively. RESULTS OF OPERATIONS
For the three months ending September 30, 2014
Net income for the three months ended September 30, 2014 (Q3 2014) was $8,420 an increase of $608 or 7.78 percent when compared to the net income of $7,812 for the same period in 2013 (Q3 2013). Major changes in the components of net income when comparing Q3 2014 to Q3 2013 are identified as follows:
Ag Credit Agricultural Credit Association 4
Net interest income increased by $459 or 4.87 percent. The increase resulted primarily from earnings on increased loan volume and an increase in earnings on the Association’s own funds in loans.
Provision for loan losses decreased by $431 as a result of the Q3
2013 provision with no provision in Q3 2014. Noninterest income increased by $255 or 10.38 percent for the
following reasons:
Patronage dividends from AgFirst Farm Credit Bank (the Bank) increased by $199 as a result of higher regular and participation sold patronage related to higher loan volume previously discussed and increased participation sold volume.
Loan fees increased by $45 primarily due to increased fees related to secondary mortgage market loans, bond investment fees, and new loan fees. Fees for financially related services (FRS) increased by $10 due to higher multi-peril crop insurance and life insurance income.
Noninterest expense increased by $584 or 16.27 percent
primarily due to:
Salary and benefits expense increased by $157 or 6.44 percent due to increased expenses related to scheduled salary increases, additional employees, salary related benefits, decreased deferred loan origination costs, higher incentive accrual, and increased healthcare costs. Farm Credit System Insurance Corporation (FCSIC) premium expenses increased by $52 or 25.62 percent due to increased premium rates and increased loan volume.
Guarantee fees increased by $185 or 272.06 percent due to timing of guarantee fee payments.
Other operating expenses increased by $145 or 20.42 percent due to higher purchased services, public member relations, advertising and travel.
The provision for income taxes decreased by $47 due to the Q3
2013 accrued Franchise state tax liability but no provision in Q3 2014 due to the State of Ohio repealing the Franchise tax, which the Association previously paid. The Association is now paying under the Commercial Activity Tax (CAT).
For the nine months ending September 30, 2014
Net income for the nine months ended September 30, 2014 (YTD 2014) was $25,745, which is an increase of $1,892 or 7.93 percent when compared to the net income of $23,853 for the same period in 2013 (YTD 2013). Major changes in the components of net income when comparing YTD 2014 to YTD 2013 are identified as follows:
Net interest income increased by $2,559 or 9.30 percent. The increase is a result of the same reasons previously discussed.
The risks identified in the portfolio at September 30, 2014 and
September 30, 2013 resulted in no provision for loan losses for YTD 2014 and $431 for YTD 2013, for a reduction of $431 for reasons previously discussed.
Noninterest income decreased by $91 or 1.14 percent primarily
due to:
Patronage dividends from the Bank decreased by $201 primarily as a result of a $779 reduction in Bank special patronage. The Bank made a special patronage distribution during Q2 2013 but no distribution in Q2 2014. This reduction was offset partially by higher regular and participation sold patronage related to higher loan volume previously discussed and increased participation sold volume.
Gains (losses) on sales of premises and equipment increased by $76 primarily due to the sale of the former Tiffin office building.
Noninterest expense increased by $1,288 or 11.64 percent
primarily due to:
Salary and benefits expense increased by $767, FCSIC insurance premium expenses increased by $157 and other operating expenses increased by $152 for the reasons previously discussed.
Guarantee fees increased by $437 due to higher FSA guarantee fees as a result of federal loan guarantee commitments being funded in YTD 2014 after the lack of funding for most of 2013.
Net losses on other property owned (OPO) decreased by $282 primarily due to the gain on the sale of an OPO during Q1 2014.
The provision for income taxes decreased by $281 for reasons
previously discussed and due to the reversal of previously accrued Franchise state tax liability.
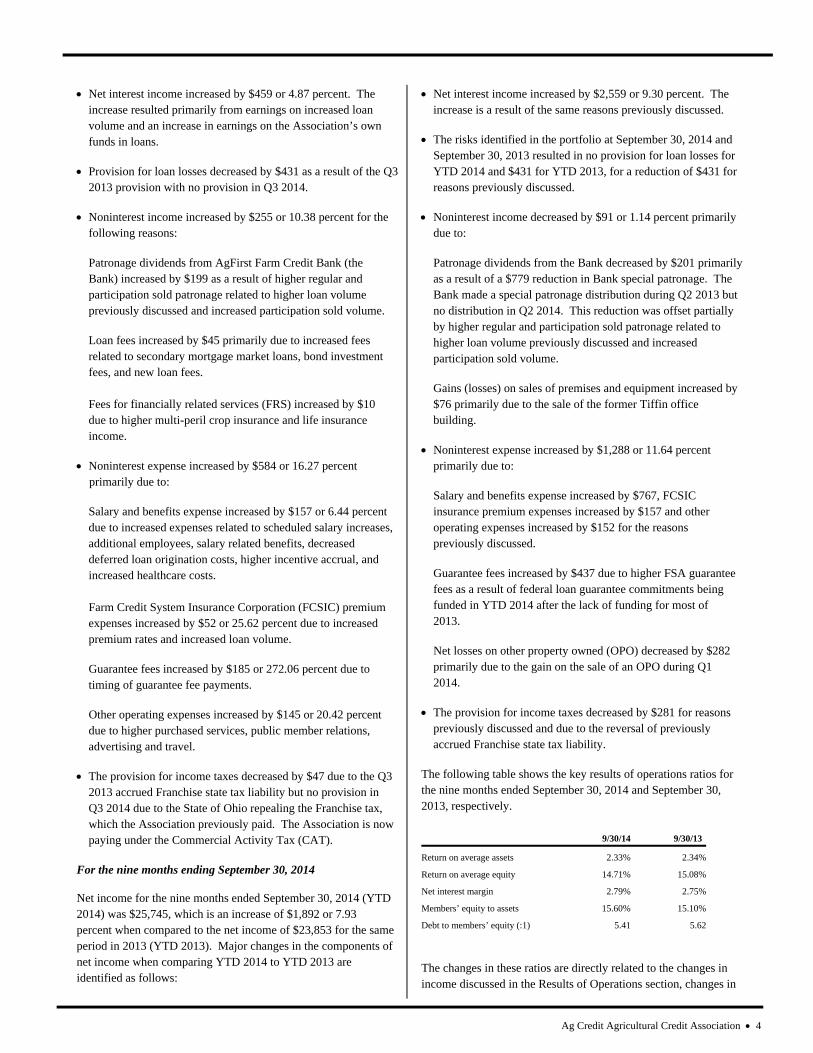
The following table shows the key results of operations ratios for the nine months ended September 30, 2014 and September 30, 2013, respectively.
9/30/14 9/30/13
Return on average assets 2.33% 2.34%
Return on average equity 14.71% 15.08%
Net interest margin 2.79% 2.75%
Members’ equity to assets 15.60% 15.10%
Debt to members’ equity (:1) 5.41 5.62
The changes in these ratios are directly related to the changes in income discussed in the Results of Operations section, changes in
Ag Credit Agricultural Credit Association 5
assets discussed in the Loan Portfolio section and changes in capital discussed in the Capital Resources section.
CAPITAL RESOURCES
Total members’ equity was $240,132 at September 30, 2014 as compared to $221,292 at December 31, 2013 for an increase of $18,840 or 8.51 percent. The increase is due primarily to year-to-date earnings, the issuance of additional Class A Preferred Stock, Class C Stock and Participation Certificates, offset partially by the patronage distribution of nonqualified allocated surplus.
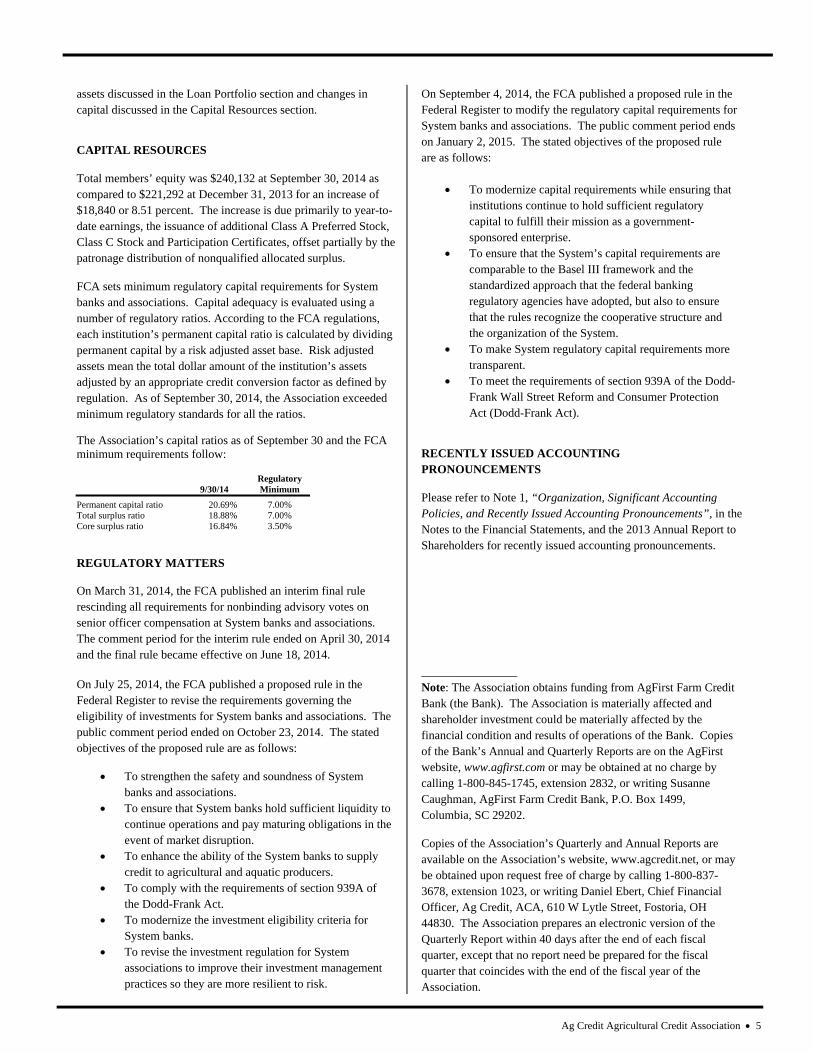
FCA sets minimum regulatory capital requirements for System banks and associations. Capital adequacy is evaluated using a number of regulatory ratios. According to the FCA regulations, each institution’s permanent capital ratio is calculated by dividing permanent capital by a risk adjusted asset base. Risk adjusted assets mean the total dollar amount of the institution’s assets adjusted by an appropriate credit conversion factor as defined by regulation. As of September 30, 2014, the Association exceeded minimum regulatory standards for all the ratios. The Association’s capital ratios as of September 30 and the FCA minimum requirements follow:
9/30/14 Regulatory Minimum
Permanent capital ratio 20.69% 7.00% Total surplus ratio 18.88% 7.00% Core surplus ratio 16.84% 3.50% REGULATORY MATTERS
On March 31, 2014, the FCA published an interim final rule rescinding all requirements for nonbinding advisory votes on senior officer compensation at System banks and associations. The comment period for the interim rule ended on April 30, 2014 and the final rule became effective on June 18, 2014. On July 25, 2014, the FCA published a proposed rule in the Federal Register to revise the requirements governing the eligibility of investments for System banks and associations. The public comment period ended on October 23, 2014. The stated objectives of the proposed rule are as follows:
To strengthen the safety and soundness of System banks and associations.
To ensure that System banks hold sufficient liquidity to continue operations and pay maturing obligations in the event of market disruption.
To enhance the ability of the System banks to supply credit to agricultural and aquatic producers.
To comply with the requirements of section 939A of the Dodd-Frank Act.
To modernize the investment eligibility criteria for System banks.
To revise the investment regulation for System associations to improve their investment management practices so they are more resilient to risk.
On September 4, 2014, the FCA published a proposed rule in the Federal Register to modify the regulatory capital requirements for System banks and associations. The public comment period ends on January 2, 2015. The stated objectives of the proposed rule are as follows:
To modernize capital requirements while ensuring that institutions continue to hold sufficient regulatory capital to fulfill their mission as a government-sponsored enterprise.
To ensure that the System’s capital requirements are comparable to the Basel III framework and the standardized approach that the federal banking regulatory agencies have adopted, but also to ensure that the rules recognize the cooperative structure and the organization of the System.
To make System regulatory capital requirements more transparent.
To meet the requirements of section 939A of the Dodd-Frank Wall Street Reform and Consumer Protection Act (Dodd-Frank Act).
RECENTLY ISSUED ACCOUNTING PRONOUNCEMENTS
Please refer to Note 1, “Organization, Significant Accounting Policies, and Recently Issued Accounting Pronouncements”, in the Notes to the Financial Statements, and the 2013 Annual Report to Shareholders for recently issued accounting pronouncements.
________________ Note: The Association obtains funding from AgFirst Farm Credit Bank (the Bank). The Association is materially affected and shareholder investment could be materially affected by the financial condition and results of operations of the Bank. Copies of the Bank’s Annual and Quarterly Reports are on the AgFirst website, www.agfirst.com or may be obtained at no charge by calling 1-800-845-1745, extension 2832, or writing Susanne Caughman, AgFirst Farm Credit Bank, P.O. Box 1499, Columbia, SC 29202.
Copies of the Association’s Quarterly and Annual Reports are available on the Association’s website, www.agcredit.net, or may be obtained upon request free of charge by calling 1-800-837-3678, extension 1023, or writing Daniel Ebert, Chief Financial Officer, Ag Credit, ACA, 610 W Lytle Street, Fostoria, OH 44830. The Association prepares an electronic version of the Quarterly Report within 40 days after the end of each fiscal quarter, except that no report need be prepared for the fiscal quarter that coincides with the end of the fiscal year of the Association.
Ag Credit Agricultural Credit Association
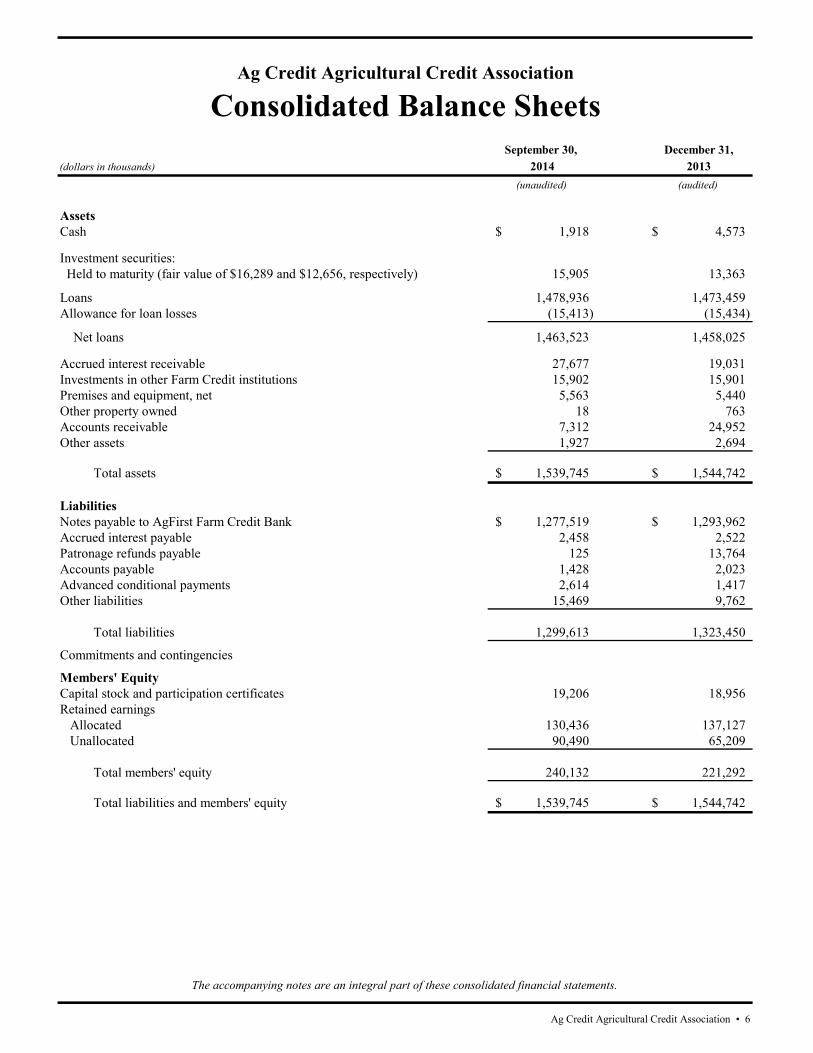
Consolidated Balance SheetsSeptember 30, December 31,
(dollars in thousands) 2014 2013(unaudited) (audited)
AssetsCash 1,918$ 4,573$
Investment securities: Held to maturity (fair value of $16,289 and $12,656, respectively) 15,905 13,363
Loans 1,478,936 1,473,459 Allowance for loan losses (15,413) (15,434)
Net loans 1,463,523 1,458,025
Accrued interest receivable 27,677 19,031 Investments in other Farm Credit institutions 15,902 15,901 Premises and equipment, net 5,563 5,440 Other property owned 18 763 Accounts receivable 7,312 24,952 Other assets 1,927 2,694
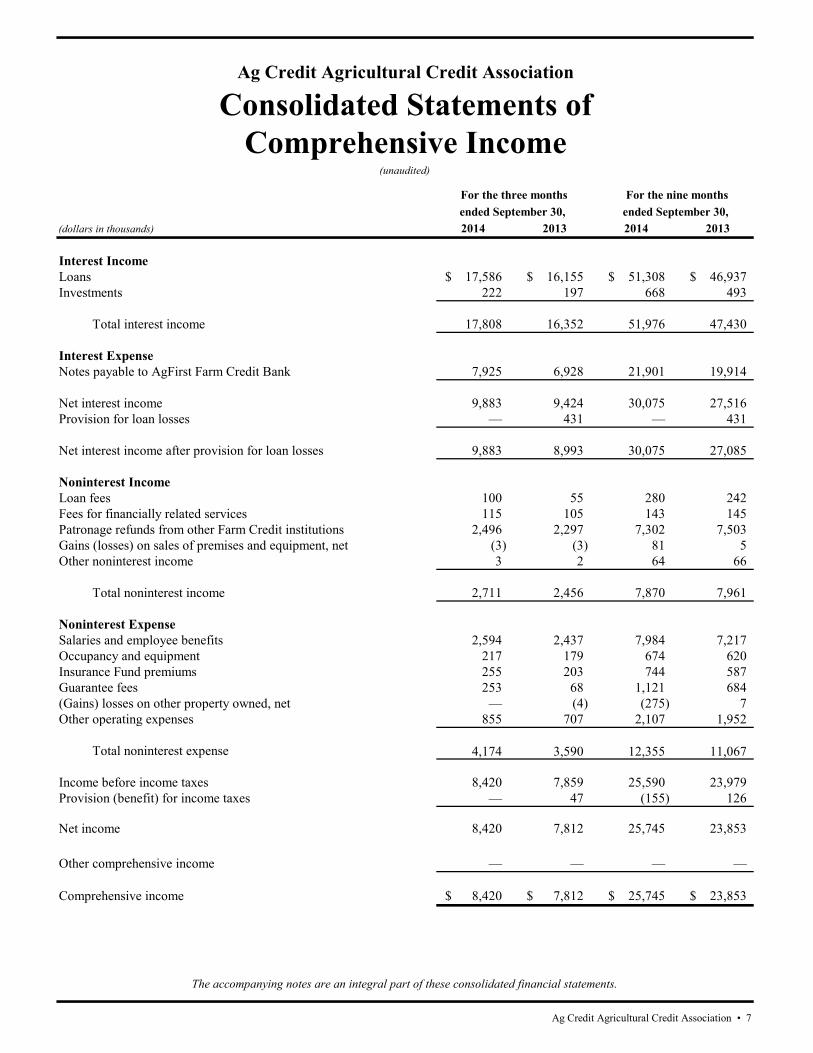
Interest ExpenseNotes payable to AgFirst Farm Credit Bank 7,925 6,928 21,901 19,914
Net interest income 9,883 9,424 30,075 27,516 Provision for loan losses — 431 — 431
Net interest income after provision for loan losses 9,883 8,993 30,075 27,085
Noninterest IncomeLoan fees 100 55 280 242 Fees for financially related services 115 105 143 145 Patronage refunds from other Farm Credit institutions 2,496 2,297 7,302 7,503 Gains (losses) on sales of premises and equipment, net (3) (3) 81 5 Other noninterest income 3 2 64 66
Total noninterest income 2,711 2,456 7,870 7,961
Noninterest ExpenseSalaries and employee benefits 2,594 2,437 7,984 7,217 Occupancy and equipment 217 179 674 620 Insurance Fund premiums 255 203 744 587 Guarantee fees 253 68 1,121 684 (Gains) losses on other property owned, net — (4) (275) 7 Other operating expenses 855 707 2,107 1,952
Total noninterest expense 4,174 3,590 12,355 11,067
Income before income taxes 8,420 7,859 25,590 23,979 Provision (benefit) for income taxes — 47 (155) 126
Net income 8,420 7,812 25,745 23,853
Other comprehensive income — — — —
Comprehensive income 8,420$ 7,812$ 25,745$ 23,853$
ended September 30, ended September 30, For the nine months For the three months
The accompanying notes are an integral part of these consolidated financial statements.
Ag Credit Agricultural Credit Association • 7
Ag Credit Agricultural Credit Association
Consolidated Statements ofComprehensive Income
(unaudited)
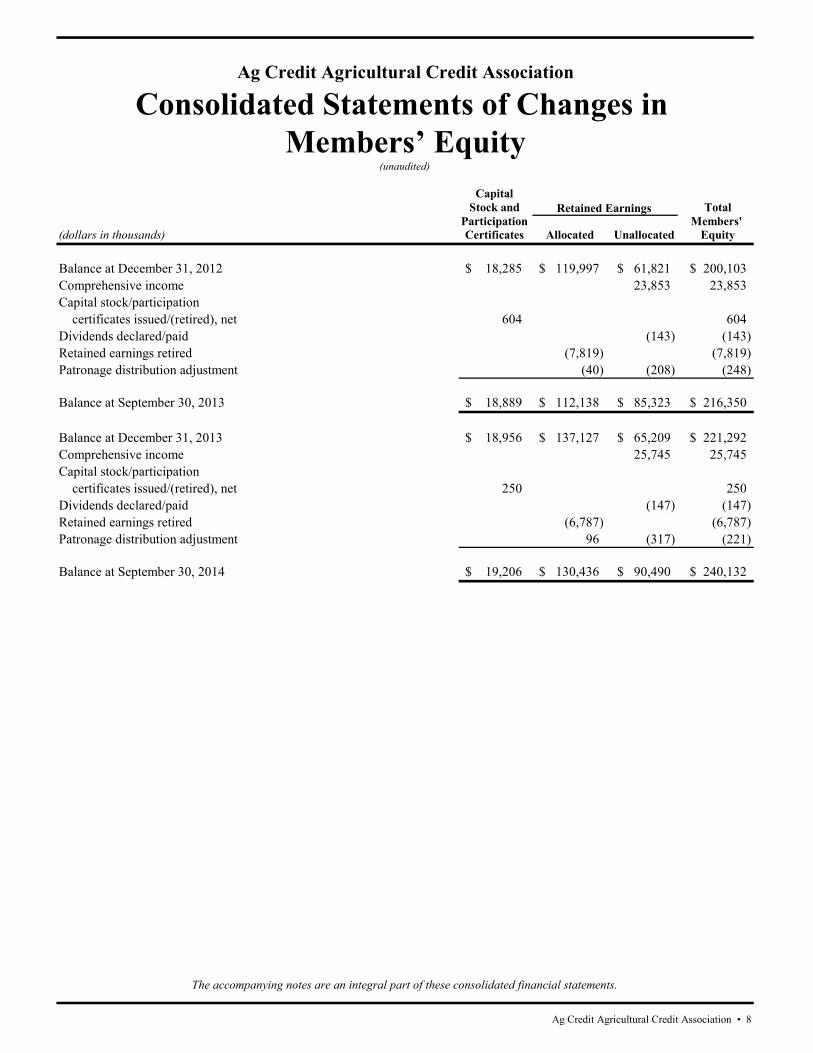
CapitalStock and Total
Participation Members' (dollars in thousands) Certificates Allocated Unallocated Equity
Balance at December 31, 2012 18,285$ 119,997$ 61,821$ 200,103$ Comprehensive income 23,853 23,853 Capital stock/participation certificates issued/(retired), net 604 604 Dividends declared/paid (143) (143) Retained earnings retired (7,819) (7,819) Patronage distribution adjustment (40) (208) (248)
Balance at September 30, 2013 18,889$ 112,138$ 85,323$ 216,350$
Balance at December 31, 2013 18,956$ 137,127$ 65,209$ 221,292$ Comprehensive income 25,745 25,745 Capital stock/participation certificates issued/(retired), net 250 250 Dividends declared/paid (147) (147) Retained earnings retired (6,787) (6,787) Patronage distribution adjustment 96 (317) (221)
Balance at September 30, 2014 19,206$ 130,436$ 90,490$ 240,132$
(unaudited)
Consolidated Statements of Changes in Ag Credit Agricultural Credit Association
The accompanying notes are an integral part of these consolidated financial statements.
Retained Earnings
Members’ Equity
Ag Credit Agricultural Credit Association • 8
Ag Credit Agricultural Credit Association 9
Ag Credit Agricultural Credit Association
Notes to the Consolidated Financial Statements (dollars in thousands, except as noted)
(unaudited)
Note 1 — Organization, Significant Accounting Policies, and Recently Issued Accounting Pronouncements Organization The accompanying financial statements include the accounts of Ag Credit Agricultural Credit Association (the Association). A description of the organization and operations, the significant accounting policies followed, and the financial condition and results of operations for the Association as of and for the year ended December 31, 2013, are contained in the 2013 Annual Report to Shareholders. These unaudited interim consolidated financial statements should be read in conjunction with the latest Annual Report to Shareholders. Basis of Presentation In the opinion of management, the accompanying consolidated financial statements contain all adjustments necessary for a fair presentation of the interim financial condition and results of operations and conform with Generally Accepted Accounting Principles (GAAP) and prevailing practices within the banking industry. Certain amounts in the prior period’s consolidated financial statements may have been reclassified to conform to the current period presentation. Such reclassifications had no effect on the prior period net income or total capital as previously reported. The results of any interim period are not necessarily indicative of the results to be expected for a full year. Significant Accounting Policies The Association maintains an allowance for loan losses at a level considered adequate by management to provide for probable and estimable losses inherent in the loan portfolio as of the report date. The allowance for loan losses is increased through provisions for loan losses and loan recoveries and is decreased through loan charge-offs and allowance reversals. A review of individual loans in each respective portfolio is performed periodically to determine the appropriateness of risk ratings and to ensure loss exposure to the Association has been identified. Recently Issued Accounting Pronouncements In August 2014, the Financial Accounting Standards Board (FASB) issued Accounting Standards Update (ASU) 2014-15, “Presentation of Financial Statements—Going Concern (Subtopic 205-40): Disclosure of Uncertainties about an Entity’s Ability to Continue as a Going Concern.” The Update is intended to define management’s responsibility to evaluate
whether there is substantial doubt about an organization’s ability to continue as a going concern and to provide related footnote disclosures. Under Generally Accepted Accounting Principles (GAAP), financial statements are prepared under the presumption that the reporting organization will continue to operate as a going concern, except in limited circumstances. Financial reporting under this presumption is commonly referred to as the going concern basis of accounting. The going concern basis of accounting is critical to financial reporting because it establishes the fundamental basis for measuring and classifying assets and liabilities. Currently, GAAP lacks guidance about management’s responsibility to evaluate whether there is substantial doubt about the organization’s ability to continue as a going concern or to provide related footnote disclosures. The Update provides guidance to an organization’s management, with principles and definitions that are intended to reduce diversity in the timing and content of disclosures that are commonly provided by organizations today in the financial statement footnotes. The amendments in this Update apply to all companies and not-for-profit organizations and become effective in the annual period ending after December 15, 2016, with early application permitted. In August 2014, the FASB issued ASU 2014-14, “Receivables—Troubled Debt Restructurings by Creditors (Subtopic 310-40): Classification of Certain Government-Guaranteed Mortgage Loans upon Foreclosure.” Currently, there is diversity in practice related to how creditors classify certain government-guaranteed mortgage loans upon foreclosure. The amendments in this Update require that a mortgage loan be derecognized and that a separate other receivable be recognized upon foreclosure if the following conditions are met: 1. The loan has a government guarantee that is not separable from the loan before foreclosure; 2. At the time of foreclosure, the creditor has the intent to convey the real estate property to the guarantor and make a claim on the guarantee, and the creditor has the ability to recover under that claim; 3. At the time of foreclosure, any amount of the claim that is determined on the basis of the fair value of the real estate is fixed. Upon foreclosure, the separate other receivable should be measured based on the amount of the loan balance (principal and interest) expected to be recovered from the guarantor. The amendments in this Update are effective for public business entities for annual periods, and interim periods within those annual periods, beginning after December 15, 2014. For all other entities, the amendments in this Update are effective for annual periods ending after December 15, 2015, and interim periods beginning after December 15, 2015.
Ag Credit Agricultural Credit Association 10
In June 2014, the FASB issued ASU 2014-11, “Transfers and Servicing (Topic 860): Repurchase-to-Maturity Transactions, Repurchase Financings, and Disclosures,” which changes the accounting for repurchase-to-maturity transactions and repurchase financing arrangements. It also requires enhanced disclosures about repurchase agreements and other similar transactions. The new guidance aligns the accounting for repurchase-to-maturity transactions and repurchase agreements executed as a repurchase financing with the accounting for other typical repurchase agreements such that, these transactions would all be accounted for as secured borrowings. The accounting changes in this Update are effective for public companies for the first interim or annual period beginning after December 15, 2014. In addition, for public companies, the disclosure for certain transactions accounted for as a sale is effective for the first interim or annual period beginning on or after December 15, 2014, and the disclosure for transactions accounted for as secured borrowings is required to be presented for annual periods beginning after December 15, 2014, and interim periods beginning after March 15, 2015. For all other entities, all changes are effective for annual periods beginning after December 15, 2014, and interim periods beginning after December 15, 2015. Earlier application for a public company is prohibited, but all other companies and organizations may elect to apply the requirements for interim periods beginning after December 15, 2014. In May 2014, the FASB, responsible for U.S. Generally Accepted Accounting Principles (U.S. GAAP), and the International Accounting Standards Board (IASB), responsible for International Financial Reporting Standards (IFRS), jointly issued converged standards on the recognition of revenue from contracts with customers. ASU 2014-09, “Revenue from Contracts with Customers (Topic 606)” and IFRS 15 “Revenue from Contracts with Customers” are intended to improve the financial reporting of revenue and comparability of the top line in financial statements globally and supersede substantially all previous revenue recognition guidance. The core principle of the new standards is for companies to recognize revenue to depict the transfer of goods or services to customers in amounts that reflect the consideration (that is, payment) to which the company expects to be entitled in exchange for those goods or services. The new standard also will result in enhanced disclosures about revenue, provide guidance for transactions that were not previously addressed comprehensively (for example, service revenue and contract modifications) and improve guidance for multiple-element arrangements. Because of the pervasive nature of the new guidance, the boards have established a joint transition resource group in order to aid transition to the new standard. For public entities reporting under U.S. GAAP, the amendments in the Update are effective for annual reporting periods beginning after December 15, 2016, including interim periods within that reporting period. Early application is not permitted. For nonpublic entities, the amendments are effective for annual reporting periods beginning after December 15, 2017, and interim periods within annual periods beginning after December 15, 2018. A nonpublic entity
may elect to adopt this guidance earlier under certain circumstances. The amendments are to be applied retrospectively. The Association has identified ancillary revenues that will be subject to this guidance. However, because financial instruments are not within the scope of the guidance, it is expected that adoption will not have a material impact on the Association’s financial condition or results of operations, but may result in additional disclosures.
In April 2014, the FASB issued ASU 2014-08, “Presentation of Financial Statements (Topic 205) and Property, Plant, and Equipment (Topic 360): Reporting Discontinued Operations and Disclosures of Disposals of Components of an Entity.” The amendments in this Update change the requirements for reporting discontinued operations in Subtopic 205-20. A discontinued operation may include a component of an entity or a group of components of an entity, or a business or nonprofit activity. A disposal of a component of an entity or a group of components of an entity is required to be reported in discontinued operations only if the disposal represents a strategic shift that has (or will have) a major effect on an entity’s operations and financial results. A public business entity and a not-for-profit entity that has issued, or is a conduit bond obligor for, securities that are traded, listed, or quoted on an exchange or an over-the-counter market should apply the amendments in this Update prospectively to both of the following: (1) All disposals (or classifications as held for sale) of components of an entity that occur within annual periods beginning on or after December 15, 2014, and interim periods within those years and (2) All businesses or nonprofit activities that, on acquisition, are classified as held for sale that occur within annual periods beginning on or after December 15, 2014, and interim periods within those years.
In March 2014, the FASB issued ASU 2014-06, “Technical Corrections and Improvements Related to Glossary Terms (Master Glossary).” The amendments in this Update relate to glossary terms, cover a wide range of Topics in the Codification and are presented in four sections: Deletion of Master Glossary Terms, Addition of Master Glossary Term Links, Duplicate Master Glossary Terms, and Other Technical Corrections Related to Glossary Terms. These amendments did not have transition guidance and were effective upon issuance for both public entities and nonpublic entities.
In January 2014, the FASB issued ASU 2014-04, “Receivables—Troubled Debt Restructurings by Creditors (Subtopic 310-40) - Reclassification of Residential Real Estate Collateralized Consumer Mortgage Loans upon Foreclosure.” The objective of the amendments in this Update is to reduce diversity by clarifying when an in substance repossession or foreclosure occurs, that is, when a creditor should be considered to have received physical possession of residential real estate property collateralizing a consumer mortgage loan such that the loan receivable should be derecognized and the real estate property recognized. The amendments are effective for public business entities for annual periods, and interim periods within those annual periods, beginning after December 15, 2014. For entities other than public business entities, the amendments in
Ag Credit Agricultural Credit Association 11
this Update are effective for annual periods beginning after December 15, 2014, and interim periods within annual periods beginning after December 15, 2015. An entity can elect to adopt the amendments in this Update using either a modified retrospective transition method or a prospective transition method. Early adoption is permitted. Other recently issued accounting pronouncements are discussed in the 2013 Annual Report to Shareholders.
Note 2 — Loans and Allowance for Loan Losses For a complete description of the Association’s accounting for loans (including impaired loans and the allowance for loan losses) and definitions of loan types, see the 2013 Annual Report to Shareholders. Credit risk arises from the potential inability of an obligor to meet its repayment obligation. The Association manages credit risk associated with lending activities through an assessment of the credit risk profile of an individual obligor. The Association sets its own underwriting standards and lending policies that provide direction to loan officers and are approved by the board of directors.
A summary of loans outstanding at period end follows:
September 30, 2014 December 31, 2013
Real estate mortgage $ 709,193 $ 693,477 Production and intermediate-term 499,952 525,533 Processing and marketing 17,804 13,923 Farm-related business 15,437 16,742 Rural residential real estate 234,186 220,937 Lease receivables 2,364 2,847
Total loans $ 1,478,936 $ 1,473,459
A substantial portion of the Association’s lending activities is collateralized, and exposure to credit loss associated with lending activities is reduced accordingly. The Association may purchase or sell participation interests with other parties in order to diversify risk, manage loan volume, and comply with Farm Credit Administration (FCA) regulations. The following tables present participation loan balances at periods ended:
September 30, 2014 Within AgFirst District Within Farm Credit System Outside Farm Credit System Total
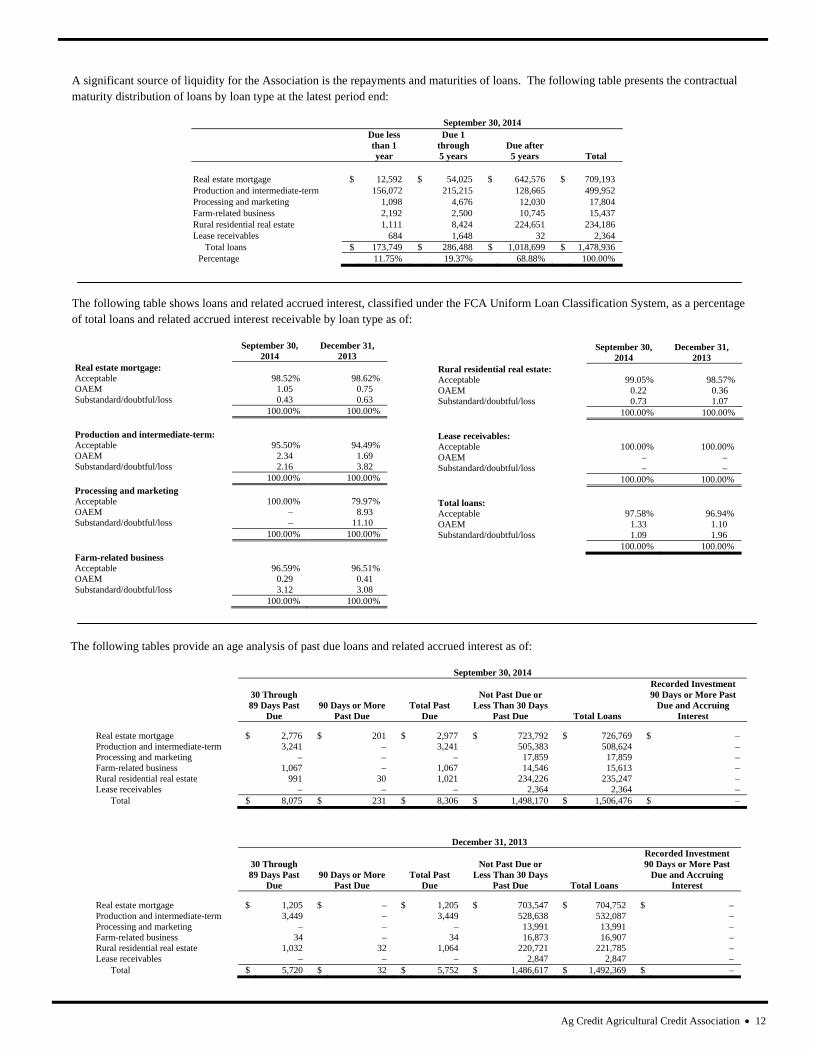
A significant source of liquidity for the Association is the repayments and maturities of loans. The following table presents the contractual maturity distribution of loans by loan type at the latest period end:
September 30, 2014
Due less than 1 year
Due 1 through 5 years
Due after 5 years Total
Real estate mortgage $ 12,592 $ 54,025 $ 642,576 $ 709,193 Production and intermediate-term 156,072 215,215 128,665 499,952 Processing and marketing 1,098 4,676 12,030 17,804 Farm-related business 2,192 2,500 10,745 15,437 Rural residential real estate 1,111 8,424 224,651 234,186 Lease receivables 684 1,648 32 2,364
The following table shows loans and related accrued interest, classified under the FCA Uniform Loan Classification System, as a percentage of total loans and related accrued interest receivable by loan type as of:
The recorded investment in a receivable is the face amount increased or decreased by applicable accrued interest, unamortized premium, discount, finance charges, or acquisition costs and may also reflect a previous direct write-down of the investment. Nonperforming assets (including related accrued interest) and related credit quality statistics at period end were as follows:
September 30, 2014 December 31, 2013 Nonaccrual loans: Real estate mortgage $ 1,317 $ 1,676 Production and intermediate-term 9,271 12,241 Farm-related business 349 380 Rural residential real estate 407 718
Total $ 11,344 $ 15,015
Accruing restructured loans: Total $ – $ –
Accruing loans 90 days or more past due: Total $ – $ –
Total nonperforming loans $ 11,344 $ 15,015 Other property owned 18 763 Total nonperforming assets $ 11,362 $ 15,778
Nonaccrual loans as a percentage of total loans 0.77% 1.02% Nonperforming assets as a percentage of total
loans and other property owned 0.77% 1.07% Nonperforming assets as a percentage of capital 4.73% 7.13%
The following table presents information relating to impaired loans (including accrued interest) at period end. Impaired loans are loans for which it is probable that all principal and interest will not be collected according to the contractual terms of the loan.
September 30, 2014 December 31, 2013 Impaired nonaccrual loans: Current as to principal and interest $ 10,678 $ 14,888 Past due 666 127
Total 11,344 15,015
Impaired accrual loans: Restructured – – 90 days or more past due – –
Total – –
Total impaired loans $ 11,344 $ 15,015
Ag Credit Agricultural Credit Association 14
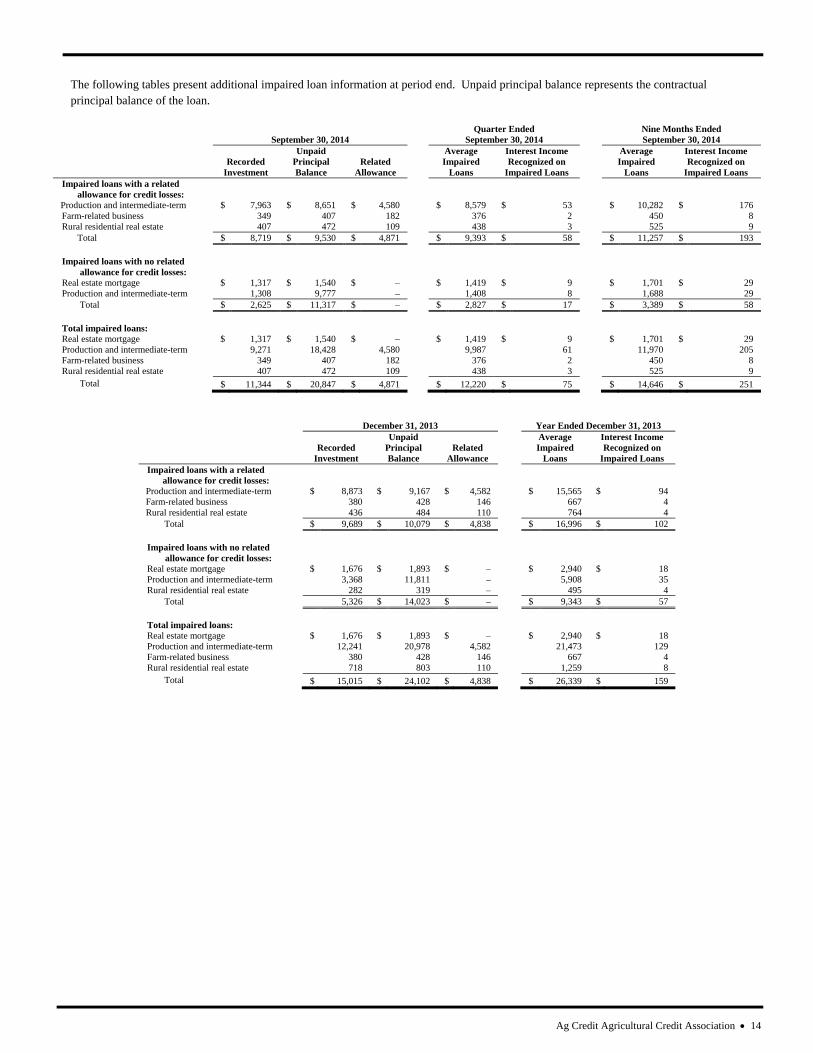
The following tables present additional impaired loan information at period end. Unpaid principal balance represents the contractual principal balance of the loan.
September 30, 2014
Quarter Ended September 30, 2014
Nine Months Ended September 30, 2014
Recorded
Investment
Unpaid Principal Balance
Related Allowance
Average Impaired
Loans
Interest Income Recognized on
Impaired Loans
Average Impaired
Loans
Interest Income Recognized on
Impaired Loans Impaired loans with a related
allowance for credit losses:
Production and intermediate-term $ 7,963 $ 8,651 $ 4,580 $ 8,579 $ 53 $ 10,282 $ 176 Farm-related business 349 407 182 376 2 450 8 Rural residential real estate 407 472 109 438 3 525 9
*Includes the loan types; Loans to cooperatives, Processing and marketing, and Farm-related business.
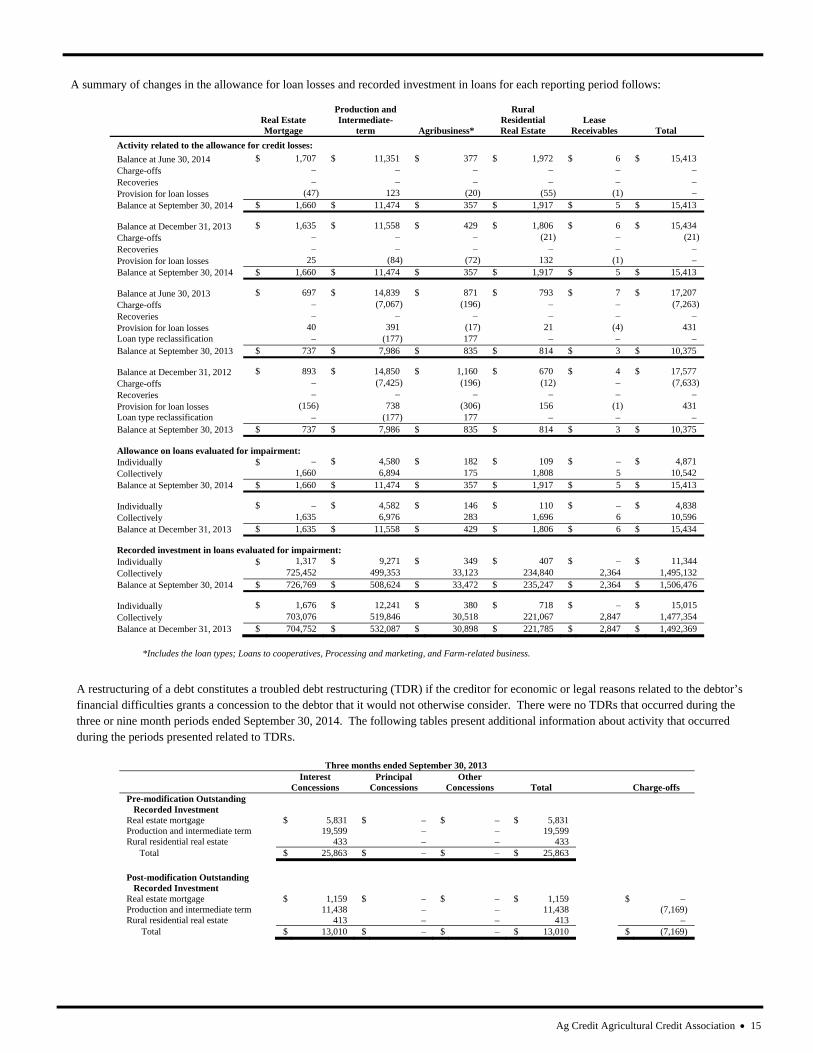
A restructuring of a debt constitutes a troubled debt restructuring (TDR) if the creditor for economic or legal reasons related to the debtor’s financial difficulties grants a concession to the debtor that it would not otherwise consider. There were no TDRs that occurred during the three or nine month periods ended September 30, 2014. The following tables present additional information about activity that occurred during the periods presented related to TDRs.
Three months ended September 30, 2013
Interest
Concessions Principal
Concessions Other
Concessions Total
Charge-offs Pre-modification Outstanding
Recorded Investment
Real estate mortgage $ 5,831 $ – $ – $ 5,831 Production and intermediate term 19,599 – – 19,599 Rural residential real estate 433 – – 433
Total $ 25,863 $ – $ – $ 25,863
Post-modification Outstanding
Recorded Investment
Real estate mortgage $ 1,159 $ – $ – $ 1,159 $ – Production and intermediate term 11,438 – – 11,438 (7,169) Rural residential real estate 413 – – 413 –
Total $ 13,010 $ – $ – $ 13,010 $ (7,169)
Ag Credit Agricultural Credit Association 16
Nine months ended September 30, 2013
Interest
Concessions Principal
Concessions Other
Concessions Total
Charge-offs Pre-modification Outstanding
Recorded Investment
Real estate mortgage $ 5,831 $ – $ – $ 5,831 Production and intermediate term 19,599 – – 19,599 Rural residential real estate 433 – – 433
Total $ 25,863 $ – $ – $ 25,863
Post-modification Outstanding
Recorded Investment
Real estate mortgage $ 1,159 $ – $ – $ 1,159 $ – Production and intermediate term 11,438 – – 11,438 (7,169) Rural residential real estate 413 – – 413 –
Total $ 13,010 $ – $ – $ 13,010 $ (7,169)
Interest concessions may include interest forgiveness and interest deferment. Principal concessions may include principal forgiveness, principal deferment, and maturity extension. Other concessions may include additional compensation received which might be in the form of cash or other assets.
There were no TDRs that occurred during the previous twelve months and for which there was a subsequent payment default during periods presented. Payment default is defined as a payment that was thirty days or more past due.
The following table provides information at period end on outstanding loans restructured in troubled debt restructurings. These loans are included as impaired loans in the impaired loan table:
Total TDRs Nonaccrual TDRs
September 30,
2014 December 31,
2013 September 30,
2014 December 31,
2013
Real estate mortgage $ 1,030 $ 1,159 $ 1,030 $ 1,159 Production and intermediate-term 9,260 12,125 9,260 12,125 Rural residential real estate 377 404 377 404
Total Loans $ 10,667 $ 13,688 $ 10,667 $ 13,688 Additional commitments to lend $ 3,113 $ 2,000
Note 3 — Investment Securities
The Association’s investments consist of Rural America Bonds, which are private placement securities purchased under the Mission Related Investment program approved by the FCA. In its Conditions of Approval for the program, the FCA considers a Rural America Bond ineligible if its investment rating, based on the internal 14-point probability of default scale (the scale) used to also grade loans, falls below 9. The FCA requires System institutions to provide notification when a security becomes ineligible. At September 30, 2014, the Association held one Rural America Bond whose credit quality had deteriorated beyond the program limits. On October 31, 2014, the Association received settlement of the Rural America Bond whose credit quality had deteriorated beyond the program limits.
A summary of the amortized cost and fair value of investment securities held-to-maturity follows: September 30, 2014
Amortized Cost
Gross Unrealized
Gains
Gross Unrealized
Losses
Fair
Value
Yield
Mission Related Investments $ 15,905 $ 641
$ (257)
$ 16,289 5.46%
December 31, 2013
Amortized Cost
Gross Unrealized
Gains
Gross Unrealized
Losses
Fair
Value
Yield
Mission Related Investments $ 13,363 $ 185
$ (892)
$ 12,656 5.53%
A summary of the contractual maturity, amortized cost and estimated fair value of investment securities held-to-maturity follows: September 30, 2014
Amortized Cost
Fair
Value
Weighted Average
Yield
In one year or less $ – $ – –% After one year through five years – – – After five years through ten years 2,677 2,727 5.12 After ten years 13,228 13,562 5.53
Total $ 15,905 $ 16,289 5.46%
A portion of these investments has contractual maturities in excess of ten years. However, expected maturities for these types of securities can differ from contractual maturities because borrowers may have the right to prepay obligations with or without prepayment penalties. An investment is considered impaired if its fair value is less than its cost. The following tables show the fair value and gross unrealized losses for investments that were in a continuous unrealized loss position aggregated by investment category at each reporting period. A continuous unrealized loss position for an investment is measured from the date the impairment was first identified.
Ag Credit Agricultural Credit Association 17
September 30, 2014 Less than 12 Months 12 Months or Greater Fair Unrealized Fair Unrealized Value Losses Value Losses
Mission Related Investments $ –
$ –
$ 6,286
$ (257)
December 31, 2013 Less than 12 Months 12 Months or Greater Fair Unrealized Fair Unrealized Value Losses Value Losses
Mission Related Investments $ 5,753
$ (549)
$ 2,734
$ (343)
FASB guidance contemplates numerous factors in determining whether an impairment is other-than-temporary. These factors include: (1) whether or not management intends to sell the security, (2) whether it is more likely than not that management would be required to sell the security before recovering its costs, and (3) whether management expects to recover the security’s entire amortized cost basis (even if there is no intention to sell). If the Association intends to sell the security or it is more likely than not that it would be required to sell the security, the impairment loss equals the full difference between amortized cost and fair value of the security. When the Association does not intend to sell securities in an unrealized loss position and it is not more likely than not that it would be required to sell the securities, other-than-temporary impairment loss is separated into credit loss and non-credit loss. Credit loss is defined as the shortfall of the present value of the cash flows expected to be collected in relation to the amortized cost basis. The Association performs periodic credit reviews, including other-than-temporary impairment analyses, on its investment securities portfolio. The objective is to quantify future possible loss of principal or interest due on securities in the portfolio. Factors considered in determining whether an impairment is other-than-temporary include among others: (1) the length of time and the extent to which the fair value is less than cost, (2) adverse conditions specifically related to the industry, (3) geographic area and the condition of the underlying collateral, (4) payment structure of the security, (5) ratings by rating agencies, (6) the credit worthiness of bond insurers, and (7) volatility of the fair value changes. The Association uses the present value of cash flows expected to be collected from each debt security to determine the amount of credit loss. This technique requires assumptions related to the underlying collateral, including default rates, amount and timing of prepayments, and loss severity. Assumptions can vary widely from security to security and are influenced by such factors as loan interest rate, geographical location of the borrower, borrower characteristics, and collateral type. Significant inputs used to estimate the amount of credit loss include, but are not limited to, performance indicators of the
underlying assets in the security (including default rates, delinquency rates, and percentage of nonperforming assets), loan-to-collateral value ratios, third-party guarantees, current levels of subordination, vintage, geographic concentration, and credit ratings. The Association may obtain assumptions for the default rate, prepayment rate, and loss severity rate from an independent third party, or generate the assumptions internally. The Association has not recognized any credit losses as any impairments were deemed temporary and resulted from non-credit related factors. The Association has the ability and intent to hold these temporarily impaired investments until a recovery of unrealized losses occurs, which may be at maturity, and at this time expects to collect the full principal amount and interest due on these securities, especially after considering credit enhancements. Investments in other Farm Credit Institutions The Association is required to maintain ownership in the Bank of Class B and Class C stock as determined by the Bank. The Bank may require additional capital contributions to maintain its capital requirements. The Association owns 6.37 percent of the issued stock of the Bank as of September 30, 2014 net of any reciprocal investment. As of that date, the Bank’s assets totaled $29.0 billion and shareholders’ equity totaled $2.4 billion. The Bank’s earnings were $282 million for the first nine months of 2014. In addition, the Association has an investment of $10 related to other Farm Credit institutions. Note 4 — Debt Notes Payable to AgFirst Farm Credit Bank The Association’s indebtedness to AgFirst Farm Credit Bank (AgFirst or the Bank) represents borrowings by the Association primarily to fund its loan portfolio. This indebtedness is collateralized by a pledge of substantially all of the Association’s assets. The contractual terms of the revolving line of credit are contained in the General Financing Agreement (GFA). The GFA also defines Association performance criteria for borrowing from the Bank, which includes borrowing base margin, earnings and capital covenants, among others. Note 5— Fair Value Measurement Fair value is defined as the exchange price that would be received for an asset or paid to transfer a liability in an orderly transaction between market participants in the principal or most advantageous market for the asset or liability. Accounting guidance establishes a hierarchy for disclosure of fair value measurements to maximize the use of observable inputs, that is, inputs that reflect the assumptions market participants would use in pricing an asset or liability based on
Ag Credit Agricultural Credit Association 18
market data obtained from sources independent of the reporting entity. The hierarchy is based upon the transparency of inputs to the valuation of an asset or liability as of the measurement date. A financial instrument’s categorization within the hierarchy tiers is based upon the lowest level of input that is significant to the fair value measurement. Estimating the fair value of the Association’s investment in the Bank and Other Farm Credit Institutions is not practicable because the stock is not traded. The net investment is a requirement of borrowing from the Bank and is carried at cost plus allocated equities in the accompanying Consolidated Balance Sheets. The classifications within the fair value hierarchy are as follows: Level 1 inputs to the valuation methodology are unadjusted quoted prices for identical assets or liabilities in active markets. Level 2 inputs include quoted prices for similar assets and liabilities in active markets; quoted prices in markets that are not active; and inputs that are observable, or can be corroborated, for substantially the full term of the asset or liability. The Association had no Level 2 assets or liabilities measured at fair value. Level 3 inputs are unobservable and supported by little or no market activity. Valuation is determined using pricing models, discounted cash flow methodologies, or similar techniques, and could include significant management judgment or estimation. Level 3 assets and liabilities also could include instruments whose price has been adjusted based on dealer quoted pricing that is different than the third-party valuation or internal model pricing. For a complete discussion of the inputs and other assumptions considered in assigning various assets and liabilities to the fair value hierarchy levels, see the latest Annual Report to Shareholders. There were no Level 3 assets and liabilities measured at fair value on a recurring basis for the periods presented. The Association had no transfers of assets or liabilities into or out of Level 1 or Level 2 during the periods presented. SENSITIVITY TO CHANGES IN SIGNIFICANT UNOBSERVABLE INPUTS Discounted cash flow or similar modeling techniques are generally used to determine the recurring fair value measurements for Level 3 assets and liabilities. Use of these techniques requires determination of relevant inputs and assumptions, some of which represent significant unobservable inputs as indicated in the tables that follow. Accordingly, changes in these unobservable inputs may have a significant impact on fair value.
Certain of these unobservable inputs will (in isolation) have a directionally consistent impact on the fair value of the instrument for a given change in that input. Alternatively, the fair value of the instrument may move in an opposite direction for a given change in another input. Where multiple inputs are used within the valuation technique of an asset or liability, a change in one input in a certain direction may be offset by an opposite change in another input having a potentially muted impact to the overall fair value of that particular instrument. Additionally, a change in one unobservable input may result in a change to another unobservable input (that is, changes in certain inputs are interrelated with one another), which may counteract or magnify the fair value impact.
Investment Securities
The fair values of predominantly all Level 3 investment securities have consistent inputs, valuation techniques and correlation to changes in underlying inputs. The models used to determine fair value for these instruments use certain significant unobservable inputs within a discounted cash flow or market comparable pricing valuation technique. Such inputs generally include discount rate components including risk premiums, prepayment estimates, default estimates and loss severities.
These Level 3 assets would decrease (increase) in value based upon an increase (decrease) in discount rates, defaults, or loss severities. Conversely, the fair value of these assets would generally increase (decrease) in value if the prepayment input were to increase (decrease).
Generally, a change in the assumption used for defaults is accompanied by a directionally similar change in the risk premium component of the discount rate (specifically, the portion related to credit risk) and a directionally opposite change in the assumption used for prepayments. Unobservable inputs for loss severities do not normally increase or decrease based on movements in the other significant unobservable inputs for these Level 3 assets.
Inputs to Valuation Techniques
Management determines the Association’s valuation policies and procedures. The Bank performs the majority of the Association’s valuations, and its valuation processes are calibrated annually by an independent consultant. The fair value measurements are analyzed on a quarterly basis. For other valuations, documentation is obtained for third party information, such as pricing, and periodically evaluated alongside internal information and pricing that is available.
Quoted market prices are generally not available for the instruments presented. Accordingly fair values are based on judgments regarding anticipated cash flows, future expected loss experience, current economic conditions, risk characteristics of various financial instruments, and other factors. These estimates involve uncertainties and matters of judgment, and therefore cannot be determined with precision. Changes in assumptions could significantly affect the estimates.
Ag Credit Agricultural Credit Association 19
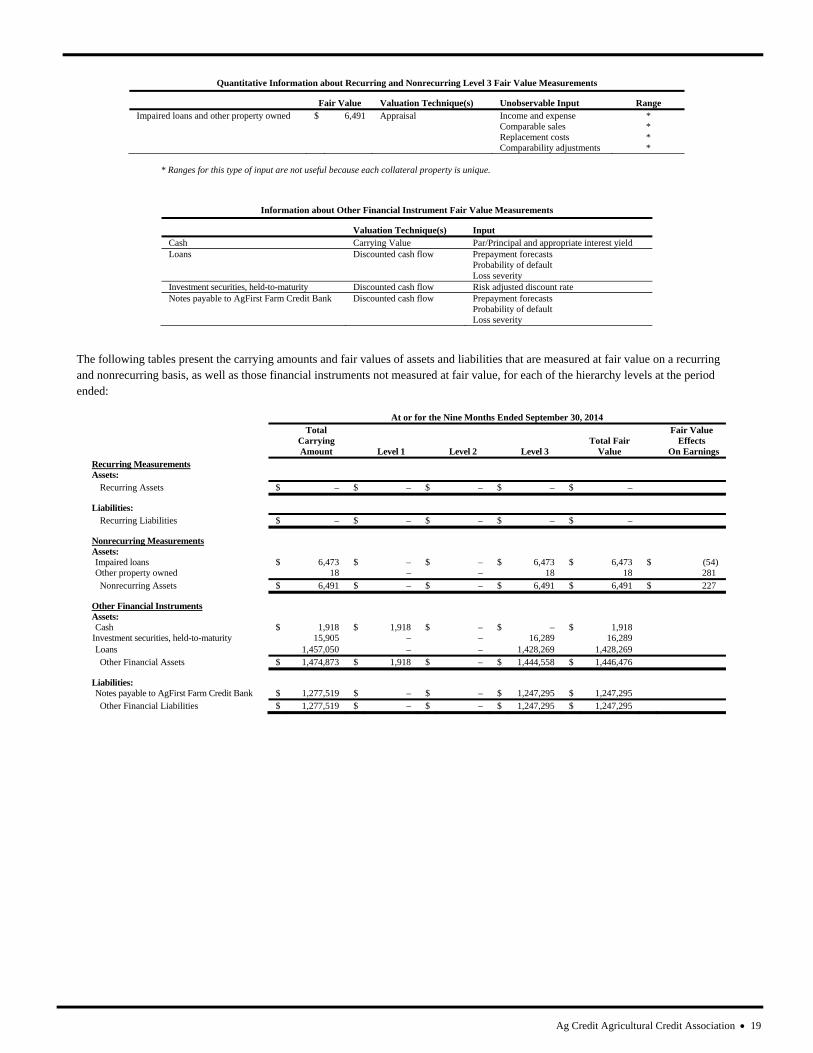
Quantitative Information about Recurring and Nonrecurring Level 3 Fair Value Measurements
Fair Value Valuation Technique(s) Unobservable Input Range Impaired loans and other property owned $ 6,491 Appraisal Income and expense * Comparable sales *
Replacement costs * Comparability adjustments *
* Ranges for this type of input are not useful because each collateral property is unique.
Information about Other Financial Instrument Fair Value Measurements
Valuation Technique(s) Input Cash Carrying Value Par/Principal and appropriate interest yield Loans Discounted cash flow Prepayment forecasts Probability of default Loss severity Investment securities, held-to-maturity Discounted cash flow Risk adjusted discount rate Notes payable to AgFirst Farm Credit Bank Discounted cash flow Prepayment forecasts Probability of default Loss severity
The following tables present the carrying amounts and fair values of assets and liabilities that are measured at fair value on a recurring and nonrecurring basis, as well as those financial instruments not measured at fair value, for each of the hierarchy levels at the period ended:
At or for the Nine Months Ended September 30, 2014
Total
Carrying Total Fair Fair Value
Effects Amount Level 1 Level 2 Level 3 Value On Earnings
Contributions in the above table include allocated estimates of funding for multi-employer plans in which the Association participates. These amounts may change when a total funding amount and allocation is determined by the respective Plan’s Sponsor Committee. Also, market conditions could impact discount rates and return on plan assets which could change contributions necessary before the next plan measurement date of December 31, 2014. Further details regarding employee benefit plans are contained in the 2013 Annual Report to Shareholders.
In May 2014, the AgFirst Plan Sponsor Committee voted to approve changes to certain employee benefit plans as follows:
(1) On January 1, 2015, the AgFirst Farm Credit Cash Balance Retirement Plan (Cash Balance Plan) will be frozen, employer contributions will cease, and the Cash Balance Plan will be closed to new entrants.
(2) In lieu of participation in and contributions to the Cash Balance Plan, additional employer contributions will be made to the Farm Credit Benefits Alliance 401(k) Plan.
The above changes are expected to become officially executed plan amendments in November 2014. The Cash Balance Plan will not be terminated on January 1, 2015, but is expected to be terminated in 2015 or 2016 once all necessary actions have been performed and approvals obtained. Participants in the Cash Balance Plan will continue to receive employer contributions to their hypothetical cash balance accounts through the end of 2014, at which time contributions will cease. Participants will continue receiving interest credits on the same basis as currently being provided until the Cash Balance Plan is terminated. Participants who are not already fully vested in their accounts will automatically become 100 percent vested on December 31, 2014. Following the termination of the Cash Balance Plan, vested benefits will be distributed to participants. Beginning on January 1, 2015, for participants in the Cash Balance Plan and eligible employees hired on or after this date, an additional employer contribution will be made to the Farm Credit Benefits Alliance 401(k) Plan equal to 3 percent of the participants’ eligible compensation. Accounting related to the curtailment of future benefit service under the Cash Balance Plan, as prescribed in ASC 715 “Compensation – Retirement Benefits”, is expected to be
Ag Credit Agricultural Credit Association 21
triggered in November 2014 when the plan amendments are officially executed. This accounting is not expected to have a material impact on the Association’s financial condition or results of operations. Note 7 — Commitments and Contingent Liabilities From time to time, legal actions are pending against the Association in which claims for money damages are asserted. On at least a quarterly basis, the Association assesses its liabilities and contingencies in connection with outstanding legal proceedings utilizing the latest information available. While the outcome of legal proceedings is inherently uncertain, on the basis of information presently available, management, after consultation with legal counsel, is of the opinion that the ultimate liability, if any, from these actions, would not be material in relation to the financial position of the Association. Because it is not probable the Association will incur a loss or the loss is not estimable, no liability has been recorded for any claims that may be pending. Note 8 — Subsequent Events The Association has evaluated subsequent events and has determined that, except as described below and in Note 3, Investment Securities, there were none requiring disclosure through November 7, 2014, which is the date the financial statements were issued. On October 20, 2014, AgFirst’s Board of Directors declared a special patronage distribution to be paid on January 1, 2015. The Association will receive approximately $14,766 which will be recorded in October 2014 as patronage refunds from other Farm Credit institutions.