16
Pharmaceuticals Collected Applications Thermal Analysis Application Handbook

AGC
Book
20%
Cya
n
Pharmaceuticals Collected Applications
Ther
mal
Ana
lysi
s
ApplicationHandbook

Page 2 PHARMACEUTICALS METTLER TOLEDO Collected Applications
Content
Preface ............................................................................................................................................................1
Introduction to Thermal Analysis ..................................................................................................................4
Application Overview Pharmaceuticals .........................................................................................................8
Some Comments on the Pharmaceutical Industry ........................................................................................9
Applications of Thermal Analysis in the Pharmaceutical Industry..............................................................10
Applications and Techniques .......................................................................................................................15
1. Sample Preparation and Method Choice1 DSC Calibration, Temperature and Heat flow .....................................................................................16
2 TGA Calibration, Temperature .............................................................................................................18
3 DSC Calibration, Heating Rate Independence .....................................................................................20
4 The Influence of Heating Rate on the Detection of Polymorphism, Butylated Hydroxyanisole .........22
5 Influences on Crystallization Behavior, Saccharose Solutions ............................................................24
6 Influence of the Heating Rate on Moisture Content Determination, an O/W Cream ..........................26
7 Influence of the Heating Rate on Decomposition, Metolazone ...........................................................27
8 Influence of the Pan on Dehydration, Glucose Monohydrate ..............................................................29
9 Sample Preparation, Butylated Hydroxyanisole ..................................................................................31
10 Influence of the Sample Weight, Butylated Hydroxytoluene ...............................................................32
11 Influence of the Pan on the Determination of Moisture Content, Cellulose ........................................33
12 Sample Storage and Hygroscopic Effects ...........................................................................................35
13 Oxidation Stability of Oils ...................................................................................................................36
14 Influence of Thermal History and the Evaluation of the Glass Transition, Polystyrene ......................38
2. IdentificationandCharacterization15 Melting Point Determination, Vanillin .................................................................................................40
16 Characterization of the Melting Behavior, Vanillin ..............................................................................41
17 Phase Changes, Cholesteryl Myristate .................................................................................................42
18 Identification Based on Melting Behavior, Polyethylene Glycol .........................................................44
19 Melting Point Depression of Water, Sugar Solutions ...........................................................................46
20 DSC 'Fingerprint', O/W Cream ............................................................................................................47
21 Glass Transition, Poly (D,L-lactide)-Co-Glycolide (DLPLGGLU) .....................................................48
22 Glass Transition and Moisture Content, Hydroxypropoxymethylcellulose Phthalate (HPMC-PH) ....49
23 Quality Control, PE Films ....................................................................................................................51

METTLER TOLEDO Collected Applications PHARMACEUTICALS Page 3
3. Stability24 Decomposition, Hydrocortisone ...........................................................................................................53
25 Decomposition at the Melting Point, Dihydroergotamine Mesylate ....................................................54
26 Melting Behavior and Decomposition, Aspartame ..............................................................................56
27 Total Decomposition, Malonic Acid ....................................................................................................58
28 Kinetic Analysis of Decomposition, .....................................................................................................59
29 Hydrate Stability, Theophylline ............................................................................................................61
30 Moisture, Starch/NaCMC (Primojel) ...................................................................................................63
4. Polymorphism31 Polymorphism, Tripalmitin ..................................................................................................................65
32 Polymorphism, Tolbutamide ................................................................................................................66
33 Polymorphic Modifications by Annealing, Butylated Hydroxyanisole ................................................68
34 DSC 'Fingerprint', Magnesium Stearate ...............................................................................................70
35 Polymorphism, L-Polylactide ...............................................................................................................71
36 Polymorphism, Sulfapyridine ...............................................................................................................73
5. Pseudopolymorphism37 Pseudopolymorphism, Glucose Monohydrate .....................................................................................75
6. Enantiomers38 Optical Purity, Ibuprofen ......................................................................................................................77
7. Purity39 Purity using DSC and HPLC, 4-Hydroxybenzoic Acid and its Esters .................................................79
40 Purity Determination, Phenacetin + 4-Aminobenzoic Acid .................................................................81
41 Purity and Recrystallization, Cholesterol .............................................................................................83
8. Phase Diagrams42 Phase Diagram, Tolbutamide and PEG 6000 .......................................................................................84
43 Eutectic Composition, Methyl-4-Hydroxybenzoate and 4-Hydroxybenzoic Acid .............................86
9. Quantification/Detection44 Solvent Detection by means of TG-MS, Pharmaceutically Active Substance .....................................88
45 Quantification, O/W Creams with Different Water Content ................................................................90
46 Quantification,Theophylline Monohydrate ..........................................................................................92
47 Determination of an Active Substance, Alcacyl ...................................................................................94
Literature ......................................................................................................................................................96
Index ............................................................................................................................................................98
Notes ..........................................................................................................................................................100

Page 22 PHARMACEUTICALS METTLER TOLEDO Collected Applications
4 The Influence of Heating Rate on the Detection ofPolymorphism, Butylated Hydroxyanisole
Sample Butylated hydroxyanisole
Application Inactive ingredient (antioxidant)
Conditions Measuring cell: DSC820
Pan: Aluminum 40 µl, hermetically sealed
Sample preparation: As received, no preparation
DSC measurement: Heating from 30 °C to 70 °C at 1, 2.5, 5, 10 und 20 K/min
Atmosphere: Nitrogen, 50 cm3/min
Interpretation The DSC curves show the melting of butylated hydroxyanisole recorded at different heatingrates. As expected the peak increases in size with increasing heating rates, which results indecreasing resolution. A second melting peak, which corresponds to the other modificationof butylated hydroxyanisole, is observed only at lower heating rates. An additional factorof importance in the case of polymorphic transitions is the kinetics for transformation fromone modification to the other. In the case described, the most favorable heating rate for thedetection of the second transition is 2.5 K/min. The heat of fusion of the first crystal mo-dification is best measured at 10 K/min. Further experiments are required to determine theheat of fusion of the second crystal modification.
OHH3CO
C(CH3)3

METTLER TOLEDO Collected Applications PHARMACEUTICALS Page 23
Evaluation Heating rate Onset 1 ∆H Onset 2 ∆H WeightK/min °C J/g °C J/g mg
1 59.2 95.0 62.6 2.7 1.3602.5 59.9 82.1 63.8 17.6 4.9295 59.4 85.5 62.9 2.9 1.607
10 60.2 100.2 — — 4.51620 61.1 99.3 — — 4.398
Conclusion With a suitable choice of the heating rates, it is possible to determine the melting point andthe heat of fusion of the individual modifications of polymorphic substances, even whenthe melting points of the modifications lie close together.

METTLER TOLEDO Collected Applications PHARMACEUTICALS Page 41
16 Characterization of the Melting Behavior, Vanillin
Sample Vanillin
Application Flavoring agent
DSC measurement: Heating from 30 °C to 250 °C at 10 K/min
TGAmeasurement: Heating from 30 °C to 250 °C at 10 K/min, blank curve corrected
Atmosphere: Nitrogen, DSC: 50 cm3/min, TGA: 20 cm3/min
Interpretation The melting curve provides a survey of possible events that can occur during the measure-ment. This information can not be gained from simple melting point determinations withTOA. For instance the DSC curve shows a slight shift of the baseline after the meltingprocess. The TGA curve shows no weight loss in this region, which indicates that the DSCbaseline shift is caused by a change in the specific heat capacity (c
p). The SDTA signal of
the TGA850 allows a qualitative evaluation of the melting behavior along with the TGAmeasurement.
An increasing weight loss occurs at temperatures above 150 °C because the vanillin evapo-rates and decomposes.
Evaluation Onset temperature determination and integration of the melting peak of the DSC curve.
Melting point (onset) 81.8 ° C
Heat of fusion ∆H 133.5 J/g
Conclusion The DSC is suitable for the rapid determination of melting points and heats of fusion. Ad-ditional information can be gained from a TGA measurement.
OCH3
CHO
OH
Conditions Measuring cells: DSC or TGA
Pan: Aluminum 40 µl, with pierced lid or openSample preparation: As received, no preparation

METTLER TOLEDO Collected Applications PHARMACEUTICALS Page 31
9 Sample Preparation, Butylated Hydroxyanisole
Sample Butylated hydroxyanisole
Application Inactive ingredient (antioxidant)
DSC measurement: Heating from 30 °C to 70 °C at 2.5 K/min
Atmosphere: Nitrogen, 50 cm3/min
Interpretation The two curves show the effects that sample preparation can have on the results. In bothcases, two melting peaks can be observed that differ noticeably in temperature range and inthe heats of fusion. The explanation lies in the polymorphic behavior of butylated hydro-xyanisole. The two peaks correspond to the possible crystal modifications.
Evaluation Sample preparation Onset 1, ° C ∆H, J/g Onset 2, ° C ∆H, J/gas received 59.3 78.2 63.3 27.6
ground in a mortar 55.1 96.8 61.7 1.7
Conclusion A difference in sample preparation (especially mechanical treatment) can lead to differentresults. This is particularly the case with substances that exhibit polymorphism.
OHH3CO
C(CH3)3Conditions Measuring cell: DSC
Pan: Aluminum 40 µl, hermetically sealedSample preparation: As received (1) or crystals ground in a mortar (2)
Page 32 PHARMACEUTICALS METTLER TOLEDO Collected Applications
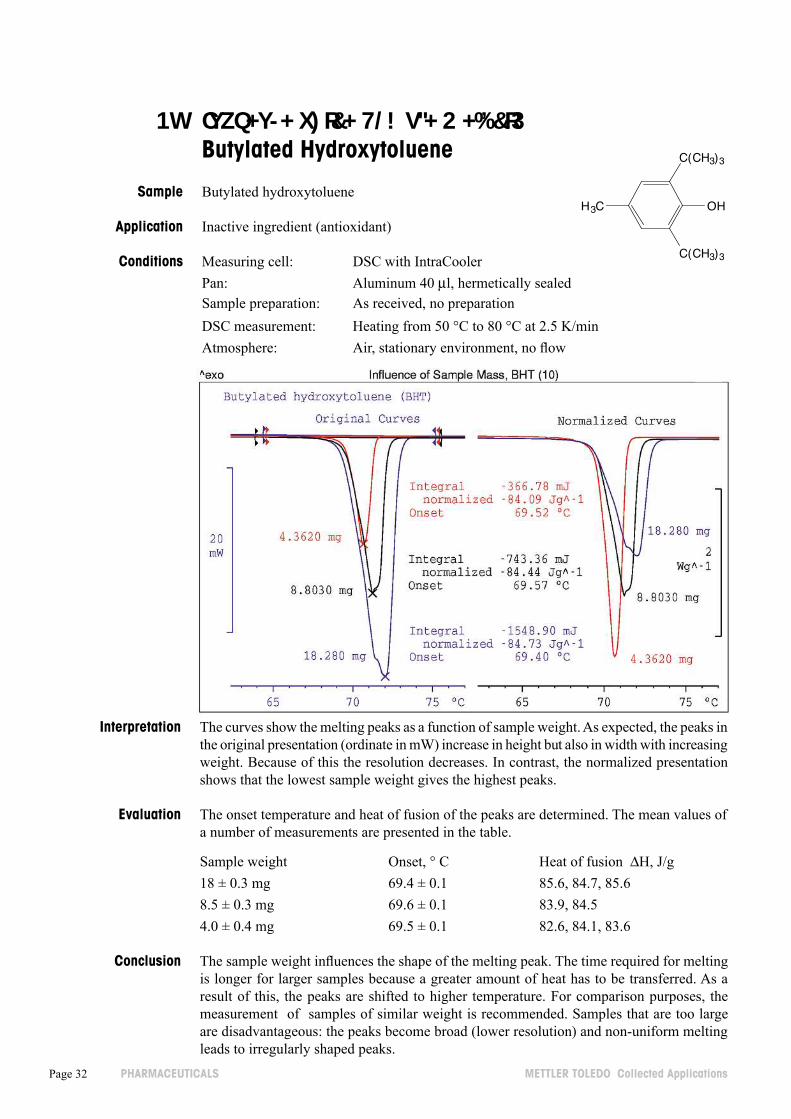
10 Influence of the Sample Weight,Butylated Hydroxytoluene
Sample Butylated hydroxytoluene
Application Inactive ingredient (antioxidant)
DSC measurement: Heating from 50 °C to 80 °C at 2.5 K/min
Atmosphere: Air, stationary environment, no flow
Interpretation The curves show the melting peaks as a function of sample weight. As expected, the peaks inthe original presentation (ordinate in mW) increase in height but also in width with increasingweight. Because of this the resolution decreases. In contrast, the normalized presentationshows that the lowest sample weight gives the highest peaks.
Evaluation The onset temperature and heat of fusion of the peaks are determined. The mean values ofa number of measurements are presented in the table.
Sample weight Onset, ° C Heat of fusion ∆H, J/g18 ± 0.3 mg 69.4 ± 0.1 85.6, 84.7, 85.6
8.5 ± 0.3 mg 69.6 ± 0.1 83.9, 84.5
4.0 ± 0.4 mg 69.5 ± 0.1 82.6, 84.1, 83.6
Conclusion The sample weight influences the shape of the melting peak. The time required for meltingis longer for larger samples because a greater amount of heat has to be transferred. As aresult of this, the peaks are shifted to higher temperature. For comparison purposes, themeasurement of samples of similar weight is recommended. Samples that are too largeare disadvantageous: the peaks become broad (lower resolution) and non-uniform meltingleads to irregularly shaped peaks.
C(CH3)3
OH
C(CH3)3
H3C
Conditions Measuring cell: DSC with IntraCooler
Pan: Aluminum 40 µl, hermetically sealedSample preparation: As received, no preparation

METTLER TOLEDO Collected Applications PHARMACEUTICALS Page 33
11 Influence of the Pan on the Determination of MoistureContent, Cellulose
Sample Microcrystalline Cellulose (Avicel)
Application Inactive ingredient (gel binder, adsorption agent, flow improver)
pierced automatically immediately before the measurement (needlediameter 1 mm).
Sample preparation: As received, no preparation
TGAmeasurement: Heating from 30 °C to 300 °C at 20 K/min, all measurements areblank curve corrected.
Atmosphere: Nitrogen, 80 cm3/min
O
OH
HOH2CHO
HO O OO O
O OHOH2C
OHHO
HO
HOH2C
OH
OH
HOH2C
HO OH
n
Interpretation Cellulose and its derivatives easily take up water from the surroundings or release waterdepending on the humidity in the laboratory.
Conditions Measuring cell: TGA with sample robot
Pan: Aluminum 100 µl, without a lid or with a pierced lid. The lid was
METTLER TOLEDO Collected Applications PHARMACEUTICALS Page 59
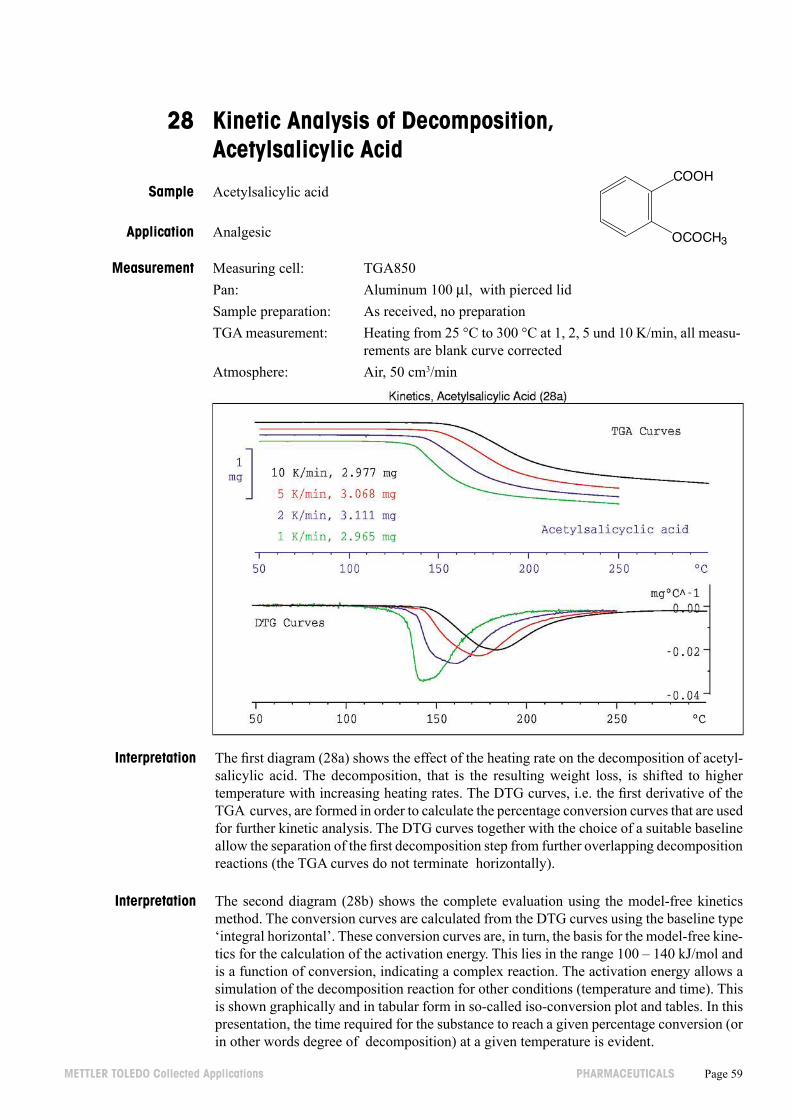
28 Kinetic Analysis of Decomposition,Acetylsalicylic Acid
Sample Acetylsalicylic acid
Application Analgesic
TGAmeasurement: Heating from 25 °C to 300 °C at 1, 2, 5 und 10 K/min, all measu-rements are blank curve corrected
Atmosphere: Air, 50 cm3/min
Interpretation The first diagram (28a) shows the effect of the heating rate on the decomposition of acetyl-salicylic acid. The decomposition, that is the resulting weight loss, is shifted to highertemperature with increasing heating rates. The DTG curves, i.e. the first derivative of theTGA curves, are formed in order to calculate the percentage conversion curves that are usedfor further kinetic analysis. The DTG curves together with the choice of a suitable baselineallow the separation of the first decomposition step from further overlapping decompositionreactions (the TGA curves do not terminate horizontally).
Interpretation The second diagram (28b) shows the complete evaluation using the model-free kineticsmethod. The conversion curves are calculated from the DTG curves using the baseline type‘integral horizontal’. These conversion curves are, in turn, the basis for the model-free kine-tics for the calculation of the activation energy. This lies in the range 100 – 140 kJ/mol andis a function of conversion, indicating a complex reaction. The activation energy allows asimulation of the decomposition reaction for other conditions (temperature and time). Thisis shown graphically and in tabular form in so-called iso-conversion plot and tables. In thispresentation, the time required for the substance to reach a given percentage conversion (orin other words degree of decomposition) at a given temperature is evident.
COOH
OCOCH3
Measurement Measuring cell: TGA850
Pan: Aluminum 100 µl, with pierced lid
Sample preparation: As received, no preparation

Page 60 PHARMACEUTICALS METTLER TOLEDO Collected Applications
Evaluation The activation energy is determined as a function of the percentage conversion. The detailsare given in the diagrams.
Prediction of the storage time/storage temperature for a conversion of 1, 2, 3 or 4% (appliedkinetics). It is evident from the table, that a conversion of 1% is reached when the substanceis stored at 15.2 °C for 10 000 hours; 1 year has 8760 hours.
Time Conversion
1% 2% 3% 4%
10 000 h 15.3 °C 25.3 °C 33.1 °C 38.7 °C
20 000 h 10.6 °C 20.7 °C 28.7 °C 34.3 °C
30 000 h 8.0 °C 18.1 °C 26.1 °C 31.8 °C
Please note: Extrapolation of results from reactions performed in the liquid state to the solidstate have a high degree of uncertainty.
Conclusion The example shows that thermal analysis and the application of model-free kinetics is anefficient means of estimating the potential storage lifetime of pharmaceutical preparationsat a minimum expense. The TGA can of course only be used when the decomposition iscoincidental with a significant weight loss.
It must be emphasized that this procedure can never replace a proper long-term test. Themethod is more useful for the preliminary selection of formulations. The formulations thatexhibit good properties can then be subjected to the time-consuming and expensive finaltests.

METTLER TOLEDO Collected Applications PHARMACEUTICALS Page 71
35 Polymorphism, L-Polylactide
Sample L-Polylactide
Application Inactive ingredient
DSC measurement: Heating from 30 °C to 300 °C at 10 K/min
Atmosphere: Nitrogen, 50 cm3/min
Interpretation The form of the DSC curve is typical for substances that undergo transformations in the melt.A separation of the two peaks depends on the crystallization rates of the modifications. Inspite of the good peak separation, the measured heat of fusion of the first modification is toolow: firstly, because an unknown quantity of the high-meltingmodification is already present,secondly, because the exothermic crystallization of the high-melting form takes place at thesame time as the melting of the first form, and thirdly, because a solid-solid transition canoccur. The second peak is usually too small, because the transformation or crystallizationis incomplete when heating dynamically. For this reason both heats of fusion are displayedin brackets.
In order to produce the high temperature form, the sample could be annealed at 160 °C ina similar way to that described in application example 33.
On
OHO H
Conditions Measuring cell: DSC
Pan: Aluminum 40 µl, hermetically sealedSample preparation: As received

Page 72 PHARMACEUTICALS METTLER TOLEDO Collected Applications
Evaluation Several different baseline options have to be applied in order to evaluate the melting peakcorrectly. For the first peak the type ‘horizontal left’ is used and for the second peak the type‘horizontal right’.
Onset, °C ∆H, J/g
First peak 151.0 (24.4)
Second peak 168.4 (58.9)
Conclusion The example demonstrates that polymers can also exhibit polymorphism.

METTLER TOLEDO Collected Applications PHARMACEUTICALS Page 49
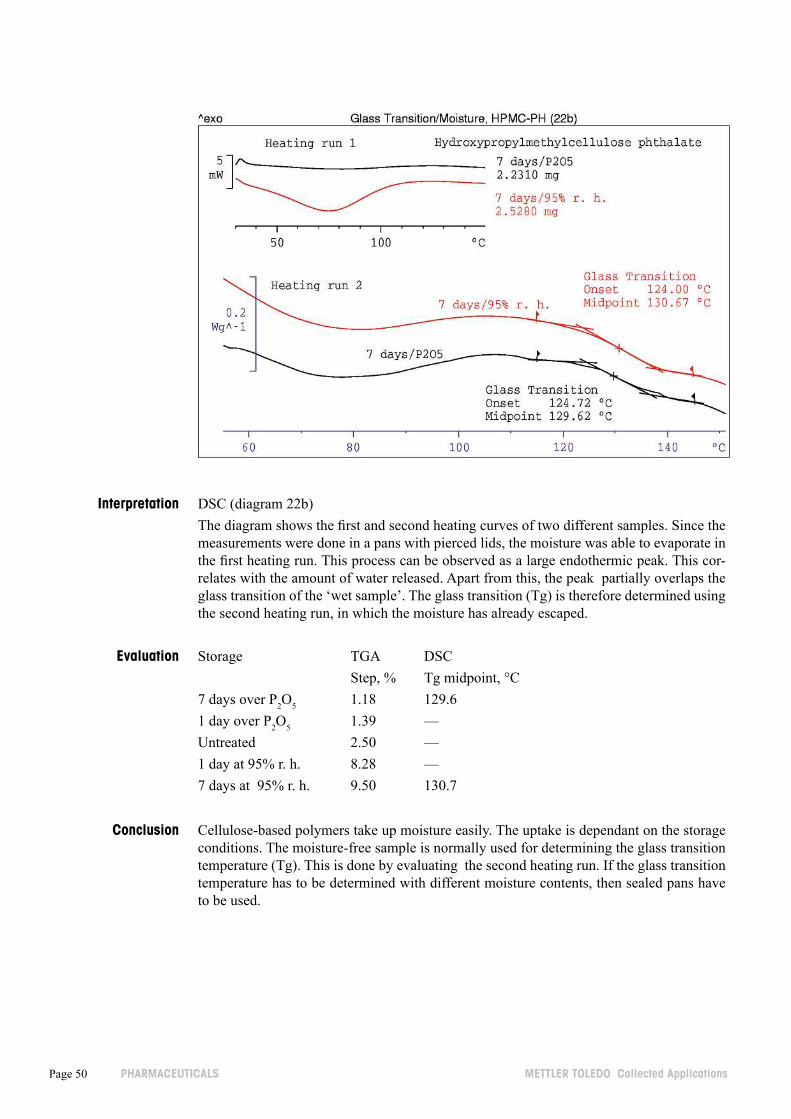
22 Glass Transition and Moisture Content,Hydroxypropoxymethylcellulose Phthalate (HPMC-PH)
Sample Hydroxypropoxymethylcellulose phthalate (HPMCPH HP 55)
Application Inactive ingredient (tablet coating substance)
tions in exsiccators
DSC measurement: Heating from 30 °C to 150 °C, cooling to 30 °C, 5 minutes iso-thermally at 30 °C, then heating to 300 °C at 20 K/min
TGAmeasurement: Heating from 30 °C to 300 °C at 20 K/min
Atmosphere: Nitrogen, DSC: 50 cm3/min, TGA: 80 cm3/min
Interpretation TGA (diagram 22a)
The diagram shows the TGA curves of samples that were stored under different relative hu-midity conditions. The moisture content of a sample can be determined from the first step ofthe corresponding TGA curve. The values obtained correlate with the storage conditions.
Conditions Measuring cells: DSC or TGA
Pans: Aluminum 40 µl or 100 µl, both with pierced lidsSample preparation: The samples were stored under different relative humidity condi-
Page 50 PHARMACEUTICALS METTLER TOLEDO Collected Applications
Interpretation DSC (diagram 22b)
The diagram shows the first and second heating curves of two different samples. Since themeasurements were done in a pans with pierced lids, the moisture was able to evaporate inthe first heating run. This process can be observed as a large endothermic peak. This cor-relates with the amount of water released. Apart from this, the peak partially overlaps theglass transition of the ‘wet sample’. The glass transition (Tg) is therefore determined usingthe second heating run, in which the moisture has already escaped.
Evaluation Storage TGA DSC
Step, % Tg midpoint, °C
7 days over P2O
51.18 129.6
1 day over P2O
51.39 —
Untreated 2.50 —
1 day at 95% r. h. 8.28 —
7 days at 95% r. h. 9.50 130.7
Conclusion Cellulose-based polymers take up moisture easily. The uptake is dependant on the storageconditions. The moisture-free sample is normally used for determining the glass transitiontemperature (Tg). This is done by evaluating the second heating run. If the glass transitiontemperature has to be determined with different moisture contents, then sealed pans haveto be used.

METTLER TOLEDO Collected Applications PHARMACEUTICALS Page 51
23 Quality Control, PE Films
Samples PE-LLD, PE-LD, PE-HD
Application Packaging material
DSC measurement: Heating from 30 °C to 160 °C, cooling to 30 °C, then heating to160 °C, all steps with heating or cooling rates of 10 K/min
Atmosphere: Nitrogen, 50 cm3/min
Interpretation DSC is specified in the USP for the physical testing of polyethylene containers: the qualityof packaging material is of decisive importance for the protection of raw materials and endproducts. In particular, primary packaging material i.e. packaging material that comes intodirect contact with the product must be perfect as far as quality is concerned, must satisfythe specified requirements and must not react with the material that it is designed to protect.The first heating run serves to eliminate any (unknown) thermal history so that samples ofdifferent quality can be properly compared with each other in the second heating run. Themelting peak maximum and the crystallinity (calculated from the heat of fusion), are usedas quality criteria.
Evaluation The crystallinity of a sample is determined by comparing its measured heat of fusion withthat of 100% crystalline PE which is assumed to have a heat of fusion of 290 J/g. This isdemonstrated as example with one of the curves.
CH2 CH2
nConditions Measuring cell: DSC
Pan: Aluminum 40 µl, hermetically sealedSample preparation: Samples cut out of the films


