Registered Office: Essar House, 11, Keshavrao Khadye Marg, Opp. Race Course, Mahalaxmi, Mumbai - 400 034, Maharashtra, India CIN: L32200MH1986PLC040652 AGC Networks Limited Essar House, 11 Keshavrao Khadye Marg, Opp. Race Course, Mahalaxmi, Mumbai 400 034 T - +91 22 6660 1100 F -+91 22 2354 4331 www.agcnetworks.com T +91 22 6660 1100 F +91 22 2354 4331 AGC/SD/SE/2021/107 August 18, 2021 To, Corporate Relationship Department Bombay Stock Exchange Limited P.J. Tower, Dalal Street, Fort, Mumbai 400001 Corporate Relationship Department The National Stock Exchange of India Limited Exchange Plaza, Bandra Kurla Complex, Bandra East, Mumbai 400051 Sub: Submission of Investor Presentation Ref: AGC Networks Limited – Scrip Code: 500463 NSE Symbol: AGCNET Dear Sir/Madam, Pursuant to Regulation 30 of SEBI (Listing Obligations and Disclosure Requirements) Regulations, 2015, Please find enclosed herewith Investor Presentation. The same will also be available on the website of the Company at www.agcnetworks.com. This is for your information, record and necessary dissemination to the stakeholders. Thanking you, Yours Faithfully, For AGC Networks Limited Aditya Goswami Company Secretary & Compliance Officer Encl: A/a.
Dear Sir/Madam, Pursuant to Regulation 30 of SEBI (Listing Obligations and Disclosure Requirements) Regulations, 2015, Please find enclosed herewith Investor Presentation. The same will also be available on the website of the Company at www.agcnetworks.com. This is for your information, record and necessary dissemination to the stakeholders. Thanking you, Yours Faithfully, For AGC Networks Limited Aditya Goswami Company Secretary & Compliance Officer Encl: A/a.
1
INVESTOR PRESENTATION
August 2021
Think Global. Act Local.
AGC Networks Ltd.
SAFE HARBOUR
2
This presentation and the accompanying slides (the “Presentation”), which have been prepared by AGC Networks Ltd (the“Company”), have been prepared solely for information purposes and do not constitute any offer, recommendation or invitation topurchase or subscribe for any securities, and shall not form the basis or be relied on in connection with any contract or bindingcommitment whatsoever. No offering of securities of the Company will be made except by means of a statutory offering documentcontaining detailed information about the Company.
This Presentation has been prepared by the Company based on information and data which the Company considers reliable, but theCompany makes no representation or warranty, express or implied, whatsoever, and no reliance shall be placed on, the truth,accuracy, completeness, fairness and reasonableness of the contents of this Presentation. This Presentation may not be all inclusiveand may not contain all of the information that you may consider material. Any liability in respect of the contents of, or anyomission from, this Presentation is expressly excluded.
This presentation contains certain forward-looking statements concerning the Company’s future business prospects and businessprofitability, which are subject to a number of risks and uncertainties and the actual results could materially differ from those insuch forward looking statements. The risks and uncertainties relating to these statements include, but are not limited to, risks anduncertainties regarding fluctuations in earnings, our ability to manage growth, competition (both domestic and international),economic growth in India and abroad, ability to attract and retain highly skilled professionals, time and cost over runs on contracts,our ability to manage our international operations, government policies and actions regulations, interest and other fiscal costsgenerally prevailing in the economy. The Company does not undertake to make any announcement in case any of these forward-looking statements become materially incorrect in future or update any forward-looking statements made from time to time by oron behalf of the Company.
3Think Global. Act Local.
Q1FY22 HIGHLIGHTS
Q1FY22 HIGHLIGHTS
4
Revenue
EBITDA&
EBITDA%
PAT
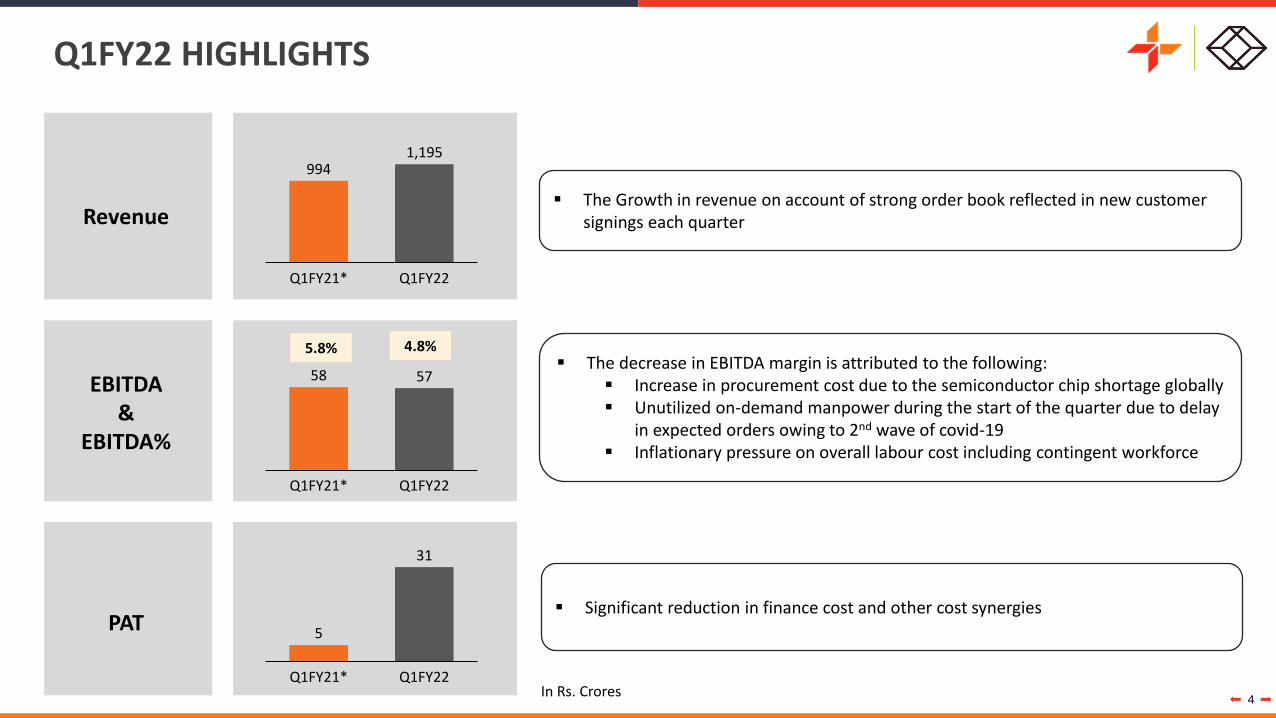
9941,195
Q1FY22Q1FY21*
58 57
Q1FY21* Q1FY22
5.8% 4.8%
5
31
Q1FY21* Q1FY22
▪ The decrease in EBITDA margin is attributed to the following: ▪ Increase in procurement cost due to the semiconductor chip shortage globally▪ Unutilized on-demand manpower during the start of the quarter due to delay
in expected orders owing to 2nd wave of covid-19▪ Inflationary pressure on overall labour cost including contingent workforce
▪ The Growth in revenue on account of strong order book reflected in new customer signings each quarter
▪ Significant reduction in finance cost and other cost synergies
In Rs. Crores
ROBUST BALANCE SHEET
5
Total Borrowings
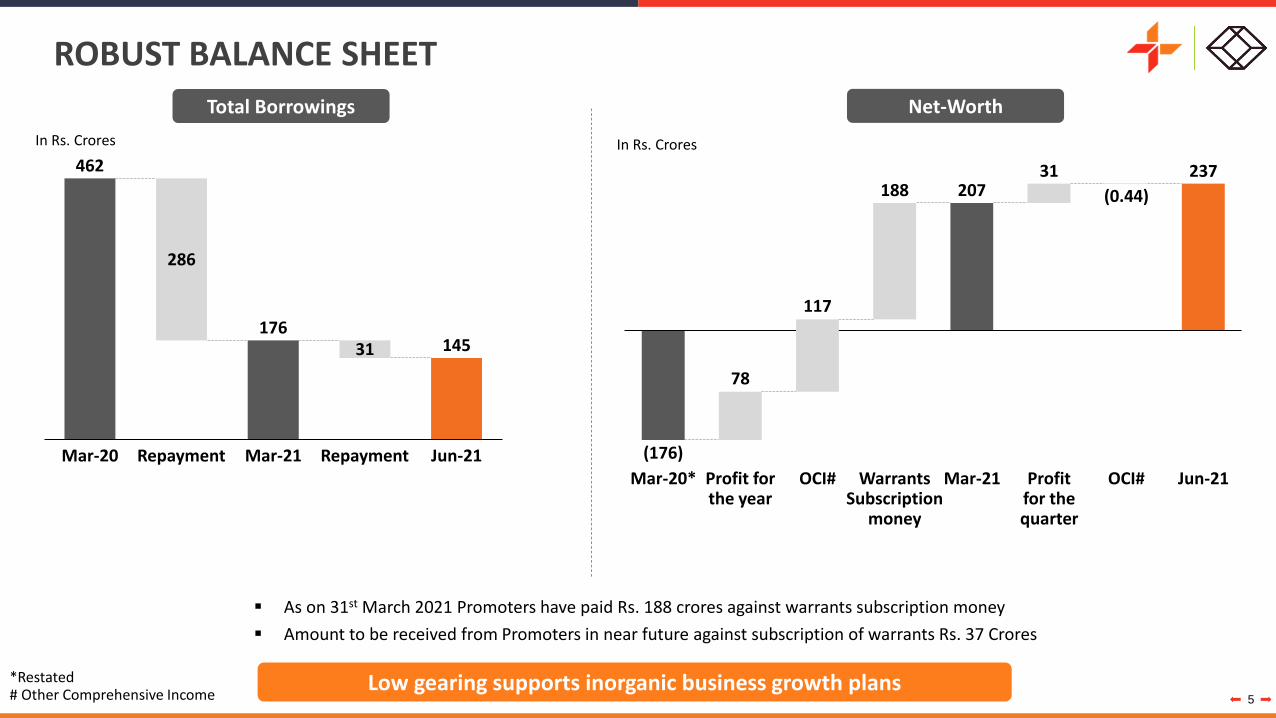
462
176145
286
31
Jun-21RepaymentMar-20 Repayment Mar-21
Net-Worth
(176)
188 207 31 237
Warrants Subscription
money
Mar-20* Profit for the quarter
Profit for the year
OCI# Mar-21
(0.44)
OCI# Jun-21
78
117
Low gearing supports inorganic business growth plans*Restated
▪ As on 31st March 2021 Promoters have paid Rs. 188 crores against warrants subscription money
▪ Amount to be received from Promoters in near future against subscription of warrants Rs. 37 Crores
# Other Comprehensive Income
In Rs. Crores In Rs. Crores
MANAGEMENT COMMENTARY
6
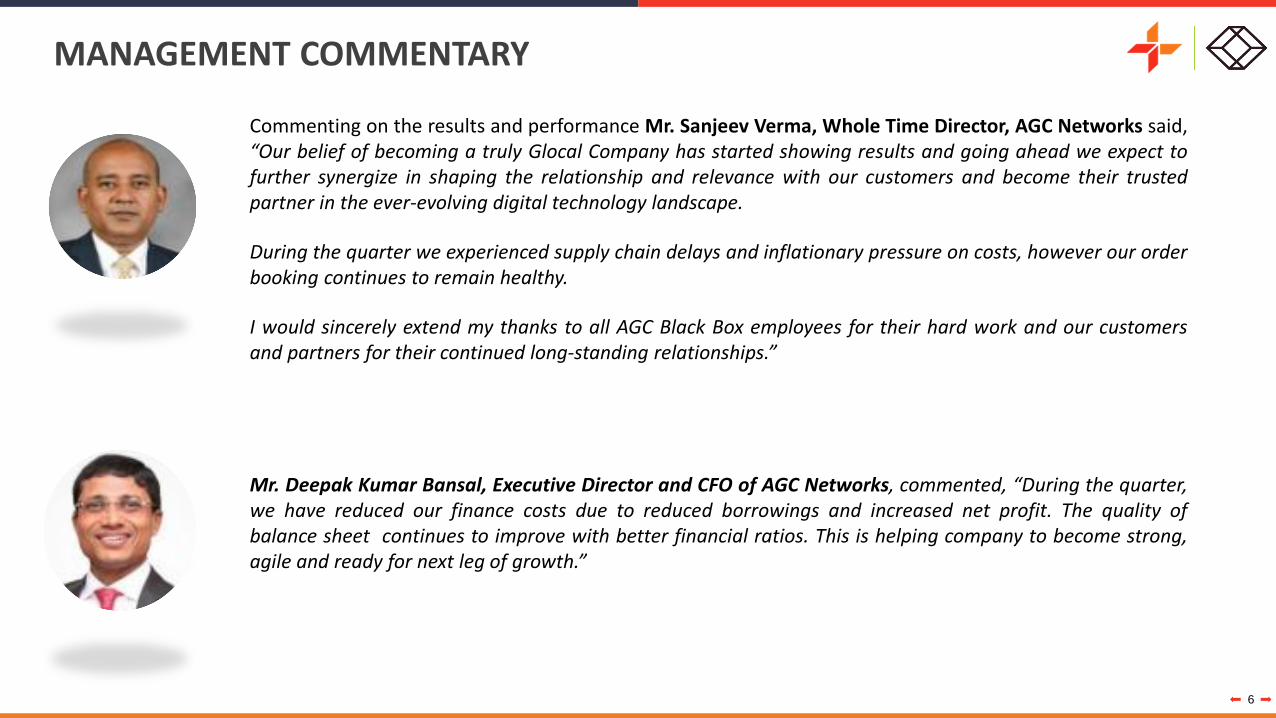
Commenting on the results and performance Mr. Sanjeev Verma, Whole Time Director, AGC Networks said,“Our belief of becoming a truly Glocal Company has started showing results and going ahead we expect tofurther synergize in shaping the relationship and relevance with our customers and become their trustedpartner in the ever-evolving digital technology landscape.
During the quarter we experienced supply chain delays and inflationary pressure on costs, however our orderbooking continues to remain healthy.
I would sincerely extend my thanks to all AGC Black Box employees for their hard work and our customersand partners for their continued long-standing relationships.”
Mr. Deepak Kumar Bansal, Executive Director and CFO of AGC Networks, commented, “During the quarter,we have reduced our finance costs due to reduced borrowings and increased net profit. The quality ofbalance sheet continues to improve with better financial ratios. This is helping company to become strong,agile and ready for next leg of growth.”
DEAL WINS DURING THE QUARTER
7
Transaction Value Clients
$16.88 Mn Managed Services contract for the end client of an Indian multinational IT company
$11.60 Mn Data Center installation & upgrade, Designing & Installing Public Safety DAS system for a leading social media company
$10.48 MnIn-Building 5G/OnGo solutions for the end client of an innovative wireless infrastructure investment and development
Company
$7.60 Mn Connected Buildings & 5G solutions for one of the largest general contractors & construction managers in the US
$6.41 Mn Connected Buildings solutions for the largest home improvement retailer in the US
$6.21 Mn Data center installation & Connected Buildings solutions for an American multinational bank
$3.73 Mn Unified Communications infrastructure maintenance for one of the largest hospital networks in the US
$2.80 Mn Connected Buildings solutions for the largest retailer of aftermarket automotive parts and accessories in the US
$1.44 Mn Enterprise Networking, Digital Workplace & On-Demand solutions for an American biotechnology corporation
$0.95 Mn Voice and Digital App solutions for an Indian multinational IT company
$0.94 Mn Audio-Video Collaboration solutions for a provider of human resources management software and services
$0.77 Mn Network Integration solutions for one of India’s biggest ecommerce enterprise
$0.75 Mn Voice solutions for an American multinational professional services company
$0.66 Mn Connectivity and signal distribution systems for a leading provider of IT infrastructure solutions in the EU
$0.60 Mn Connectivity and signal distribution systems for an American multinational cable sports channel
$0.35 Mn Connectivity and signal distribution systems for an aircraft carrier shipbuilder
Q1 deal wins with leading global clients will Strengthen the relationships and help accelerate growth
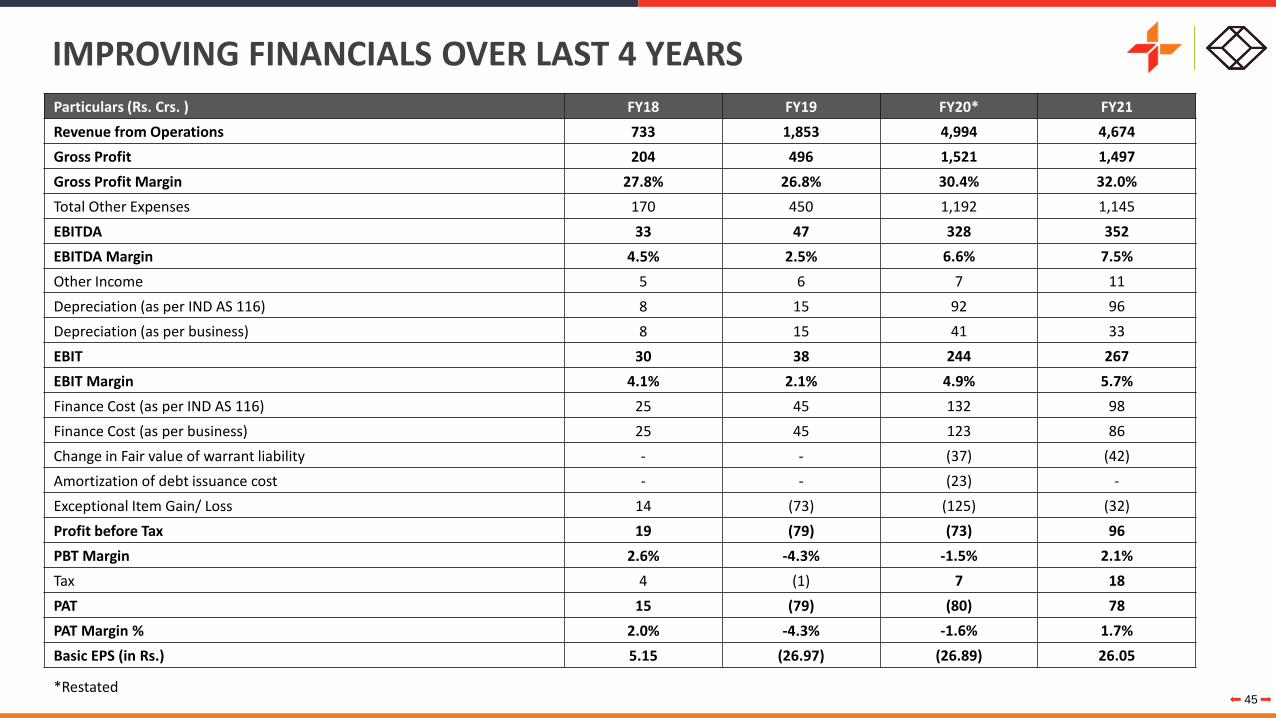
Gain on foreign currency transaction and translation (net) 4 0 0
Total Other Expenses 303 258 308
EBITDA 57 58 -1% 93 -39%
EBITDA Margin 4.8% 5.8% 7.6%
Other Income 5 1 2
Depreciation (as per IND AS 116) 24 23 29
Depreciation (as per business) 11 6 15
EBIT 38 36 67
EBIT Margin 3.2% 3.6% 5.5%
Finance Cost (as per IND AS 116) 15 22 24
Finance Cost (as per business) 12 18 22
Loss / (gain) on fair value of financial liabiltiy 0 0 (24)
Gain on settlement of financial liability 14 0 0
Exceptional Item Gain/(Loss) (3) (6) (10)
Profit before Tax 33 8 10
PBT Margin 2.7% 0.9% 0.8%
Tax 2 3 8
PAT 31 5 473% 1 2061%
PAT Margin % 2.6% 0.5% 0.1%
Other Comprehensive Income (1) 13 74
Total Comprehensive Income 31 19 76
TCI Margin % 2.6% 1.9% 6.2%
Basic EPS 9.57** 1.82** 0.48**
9Think Global. Act Local.
MEDIUM TERM TARGETS
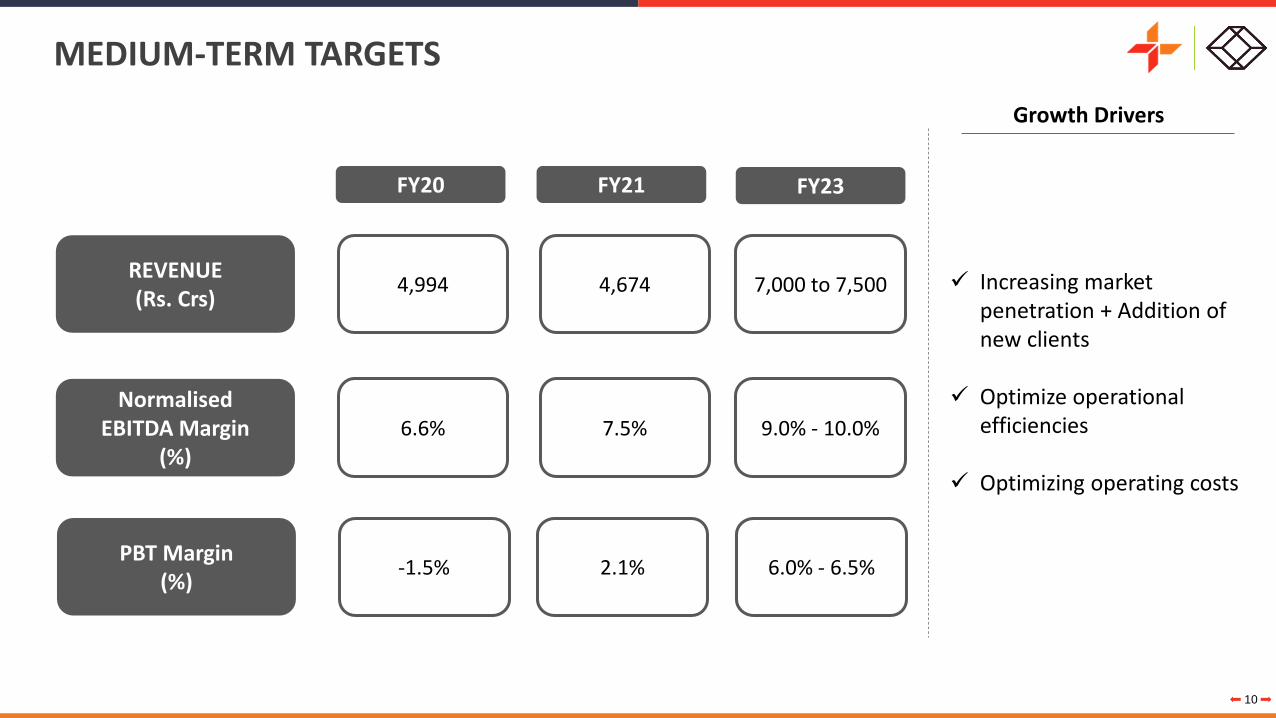
MEDIUM-TERM TARGETS
10
REVENUE(Rs. Crs)
Normalised EBITDA Margin
(%)
FY20
4,994
FY21
4,674
FY23
7,000 to 7,500
6.6% 7.5% 9.0% - 10.0%
Growth Drivers
✓ Increasing market penetration + Addition of new clients
✓ Optimize operational efficiencies
✓ Optimizing operating costs
PBT Margin(%)
-1.5% 2.1% 6.0% - 6.5%
11Think Global. Act Local.
BUSINESS OVERVIEW
SNAPSHOT
12
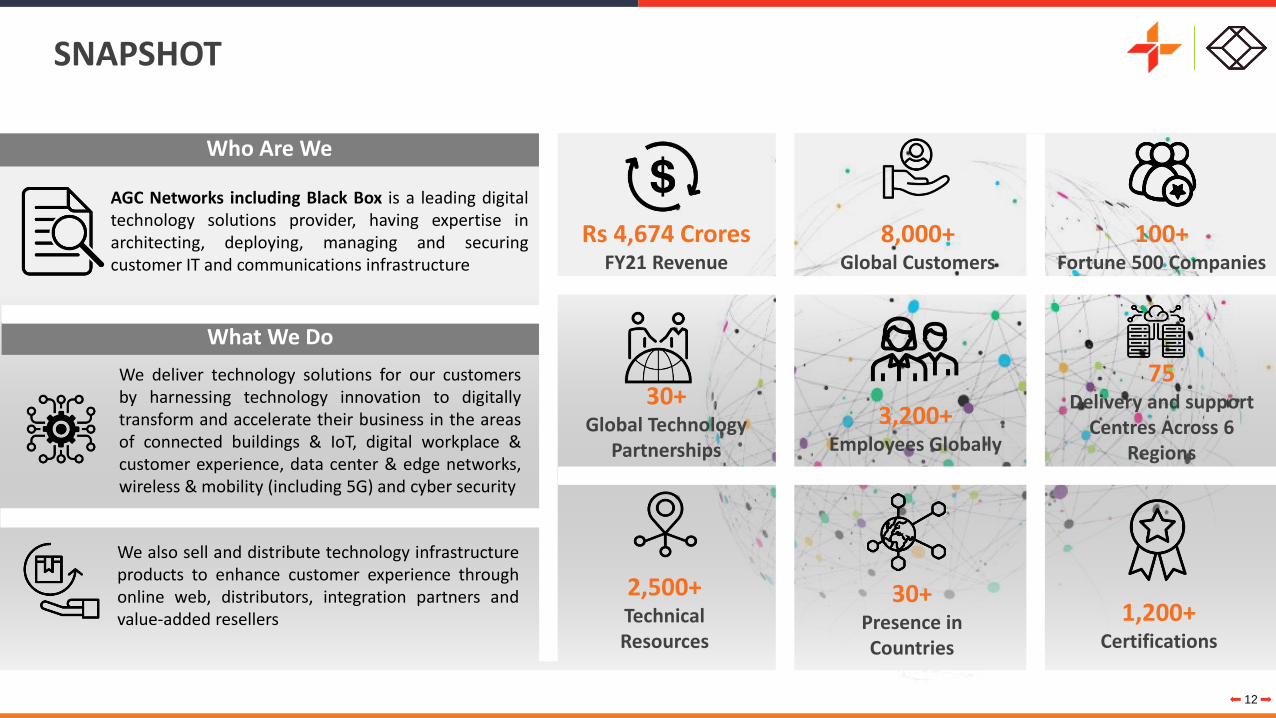
8,000+Global Customers
100+Fortune 500 Companies
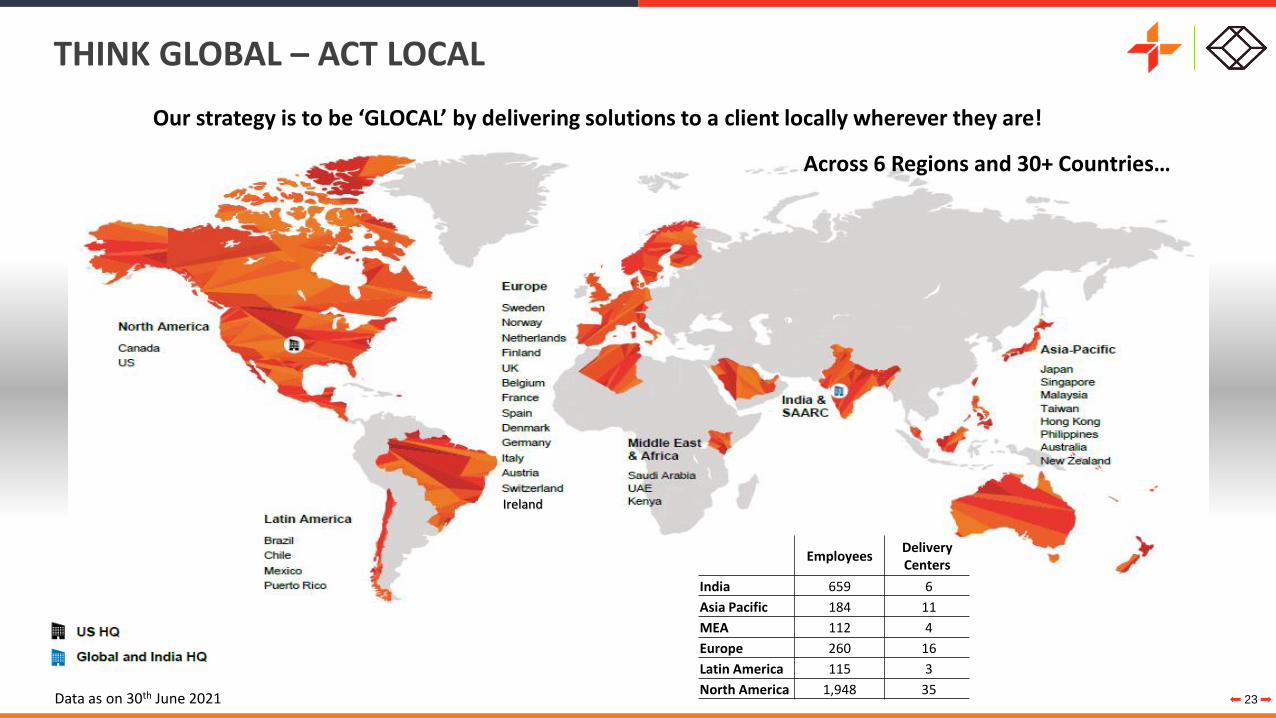
30+Presence in Countries
75Delivery and support
Centres Across 6 Regions
2,500+Technical Resources
30+Global Technology
Partnerships
3,200+Employees Globally
1,200+Certifications
Who Are We
AGC Networks including Black Box is a leading digitaltechnology solutions provider, having expertise inarchitecting, deploying, managing and securingcustomer IT and communications infrastructure
What We Do
We deliver technology solutions for our customersby harnessing technology innovation to digitallytransform and accelerate their business in the areasof connected buildings & IoT, digital workplace &customer experience, data center & edge networks,wireless & mobility (including 5G) and cyber security
We also sell and distribute technology infrastructureproducts to enhance customer experience throughonline web, distributors, integration partners andvalue-added resellers
Rs 4,674 CroresFY21 Revenue
OUR JOURNEY FROM LOCAL TO GLOCAL
13
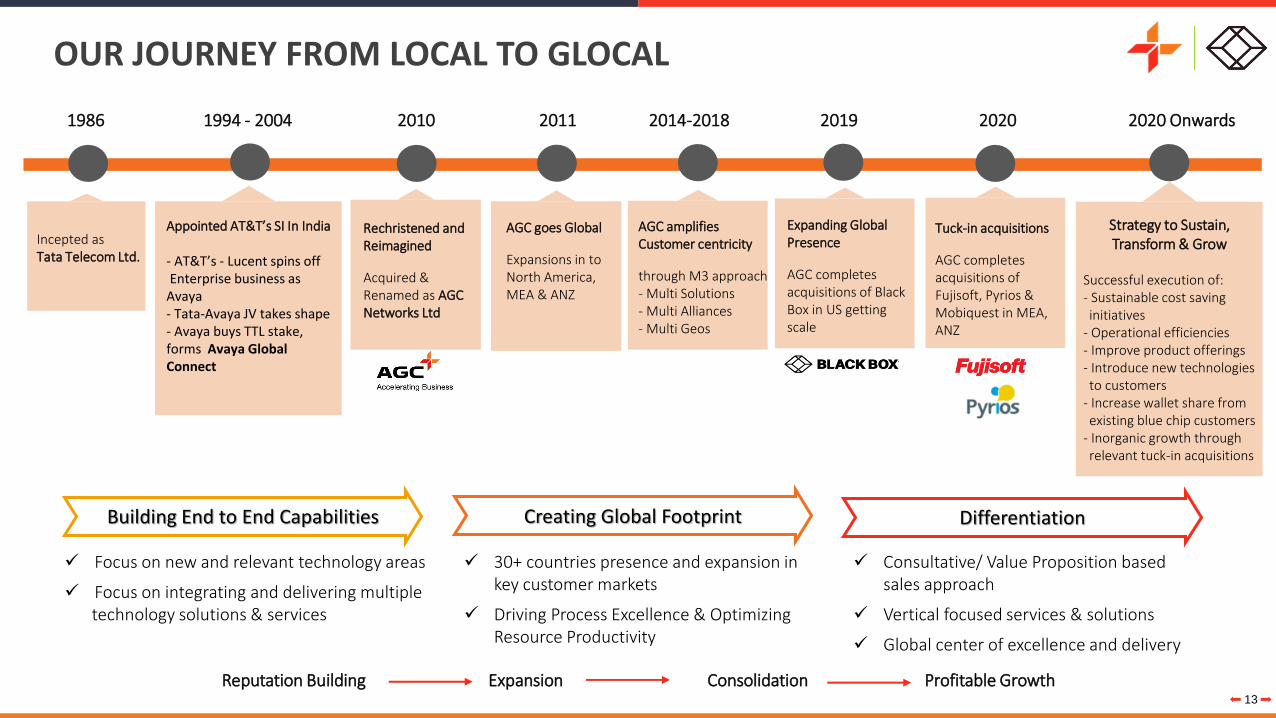
Incepted as Tata Telecom Ltd.
Appointed AT&T’s SI In India
- AT&T’s - Lucent spins off Enterprise business as
Avaya - Tata-Avaya JV takes shape- Avaya buys TTL stake, forms Avaya Global Connect
Rechristened and Reimagined
Acquired & Renamed as AGC Networks Ltd
AGC goes Global
Expansions in to North America, MEA & ANZ
AGC amplifies Customer centricity
through M3 approach - Multi Solutions- Multi Alliances- Multi Geos
Expanding Global Presence
AGC completes acquisitions of Black Box in US getting scale
Tuck-in acquisitions
AGC completes acquisitions of Fujisoft, Pyrios & Mobiquest in MEA, ANZ
Building End to End Capabilities Creating Global Footprint Differentiation
✓ Focus on new and relevant technology areas
✓ Focus on integrating and delivering multiple technology solutions & services
✓ 30+ countries presence and expansion in key customer markets
✓ Driving Process Excellence & Optimizing Resource Productivity
✓ Consultative/ Value Proposition based sales approach
✓ Vertical focused services & solutions
✓ Global center of excellence and delivery
Reputation Building Expansion Consolidation Profitable Growth
OUR BOARD OF DIRECTORS
14
Dilip ThakkarIndependent Director
Experience: 54 years
Neha NagpalIndependent Director
Experience: 13 years
Anshuman RuiaNon-Executive Director
Experience: 30 years
Naresh KothariNon-Executive Director
Experience: 25 years
Sanjeev VermaWhole time Director
Experience: 24 years
Deepak Kumar BansalExecutive Director & Global CFO
Experience: 24 years
Mahua MukherjeeExecutive Director
Experience: 22 years
Sujay ShethChairman – Independent Director
Experience: 25 years
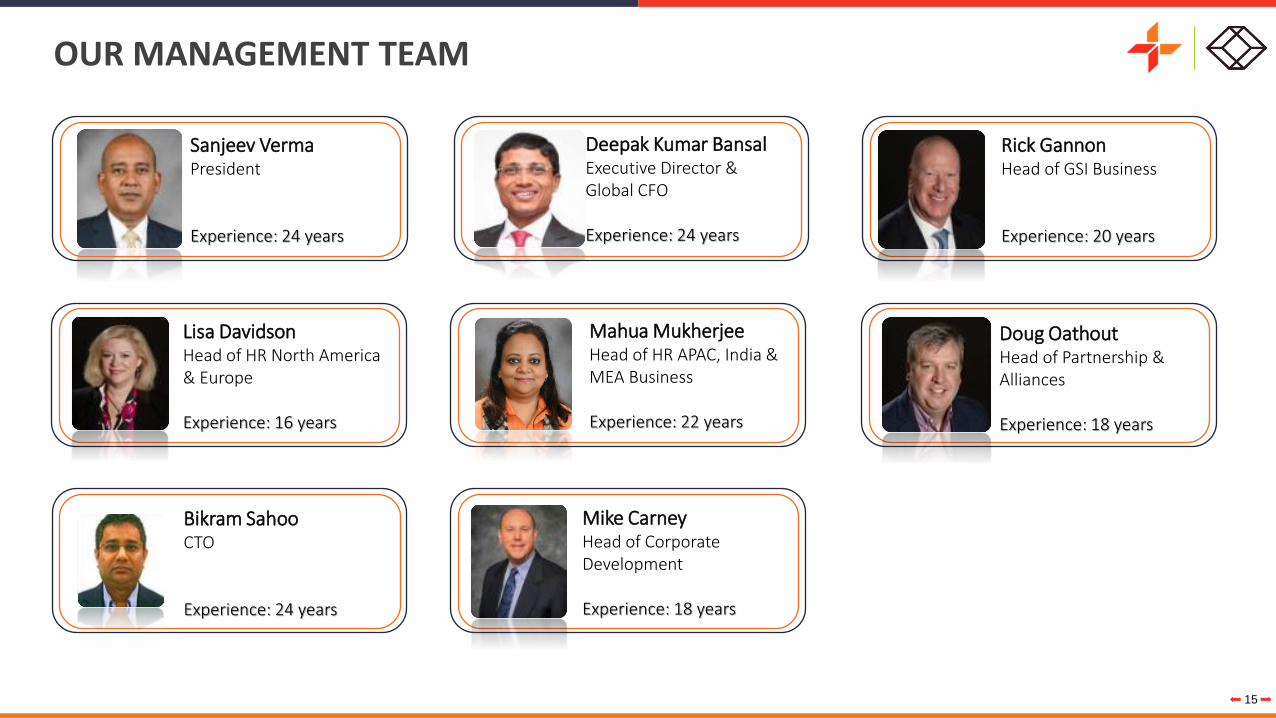
OUR MANAGEMENT TEAM
15
Sanjeev VermaPresident
Experience: 24 years
Deepak Kumar BansalExecutive Director & Global CFO
Experience: 24 years
Rick GannonHead of GSI Business
Experience: 20 years
Lisa DavidsonHead of HR North America & Europe
Experience: 16 years
Mahua MukherjeeHead of HR APAC, India & MEA Business
Experience: 22 years
Doug OathoutHead of Partnership & Alliances
Experience: 18 years
Bikram SahooCTO
Experience: 24 years
Mike CarneyHead of Corporate Development
Experience: 18 years
IMPROVING FINANCIAL FLEXIBILITY
16
The Financial Flexibility will help to:
• Improve business offerings and acquire larger customers
• Extend business within existing markets to build scale and size
• Faster growth through inorganic acquisitions
• Promoters infusing equity through
warrants: Rs.225 Crores at
Rs.675 per Warrant
• Money will be used to meet the
growth requirements of the
company, reduction in liabilities
and general corporate purposes
• Rs.188 Crores received in
Q4FY21 as subscription amount
Promoter Funding Balance Sheet Strength
• Transformation at Blackbox has
improved the financial strength
• Promoter funding to help in
increasing the net worth further
and reduce the liabilities
• Cash & Cash equivalents as on
31st March 2020: Rs.410 Crores
Credit Rating
• CRISIL has assigned BBB-/Stable
rating (Investment Grade) to the
long-term facilities and A3 for
short-term facilities
• Ratings reflect upon healthy
business risk profile, driven by the
established market position and
the improving profitability &
cashflows of the company
17Think Global. Act Local.
INORGANIC STRATEGY
INORGANIC GROWTH STRATEGY
18
Strategy
Identify Businesses that provides expansion through scale and revenues currently operating with sub-optimal margin profile
Complementary to existing business
Transform the acquired entities
✓ Capability expansion in areas like Cloud, Data center, Cyber Security, IOT
✓ Geographic expansion within US and Europe and APAC
✓ Execute short term synergies
✓ Identify and implement mid-term transformation opportunities
✓ Exit non-strategic, low margin revenue segments
✓ Simplify capital, financial and tax structure
✓ Scale up existing businesses
✓ Acquire new customers
✓ Diversify to newer geographic locations
✓ Acquire capabilities in newer delivery verticals and solutions
AGC Blackbox strengthens presence in Middle East
19
OverviewZ Services HQ is is a Cyber security cloud services provider, offering Secure Access ServiceEdge (SASE), Unified Cloud security, Email Cloud Security / Archiving, Cloud Access SecurityBroker (CASB), Secure Public Wifi Cloud Services, Cyber Security Awareness Cloud Services,End point detection and response cloud services, combined with service implementationand digital transformation professional services
IndustryOperates in Cloud, Cyber Security and Technology Solutions/Service Industry
Rationale for AcquisitionThe acquisition will help to strengthen AGC Blackbox’s presence in the Middle East region andadd cloud Cybersecurity services capabilities to offer a wide range of services to customers. Thisalso gives an opportunity to cross sell between current customers of AGC Black Box and ZServices HQ
ConsiderationPursuant to the Share Sale agreement, Black Box shall acquire 86% of the legal and beneficialinterest in the Target Company for a Cash Consideration of an amount of ~US$ 3.44 million
Acquisition of majority stake in
Z Services HQ DMCC
ACQUISITION HISTORY
20
Company Acquired Rationale Strategic Objectives fulfilled
Black Box Corporation
▪ Expands offerings, scale and Geographic reach to Service Global Enterprise Clients
▪ Increased AGC’s combined revenues by over $600mn
✓ Business that provides expansion through scale and revenues currently operating with sub-optimal margin profile
✓ Complementary to existing business
✓ Transform the acquired entities
Pyrios Pty Ltd (Australia)
Pyrios Pty Ltd (New Zealand)
▪ Increase and strengthen AGC | Black Box presence and offerings in the Australia and New Zealand market
▪ Enhance the current solution portfolio of AGC and Black Box in the Unified Communications and Contact center space and Cloud services
Fujisoft Technologies UAE
▪ Establish and scale presence in Middle East region
▪ Enhance the current solution portfolio across Cloud Computing & Virtualization, Cyber Security, Managed SoC & NoC, Managed Services, Data Center and Collaboration solutions
▪ Opportunity to cross sell between the current customers of Blackbox and the acquired Companies
Mobiquest (Singapore)
▪ Custom application development to enable clients to manage data integration with legacy systems
▪ Digitized and automated processes and workflows to monitor and manage key performance indicators (KPIs) to improve visibility and boost operational efficiency
▪ Digital transformation services with end-to-end lifecycle management of software applications with application services through technologies such as RPA, blockchain, AI/Ml and IoT
IMPROVED SERVICE OFFERINGS and SCALE VIA ACQUISITION OF BLACK BOX
21
Focus on Global Solutions Integration (GSI) + Technology Product Solutions business (TPS)
Focus on Global Solutions Integration Business (GSI)
Digital Transformation & Applications
Cyber Security
Data Center & Edge IT
Unified Communications & Collaboration
Managed Services
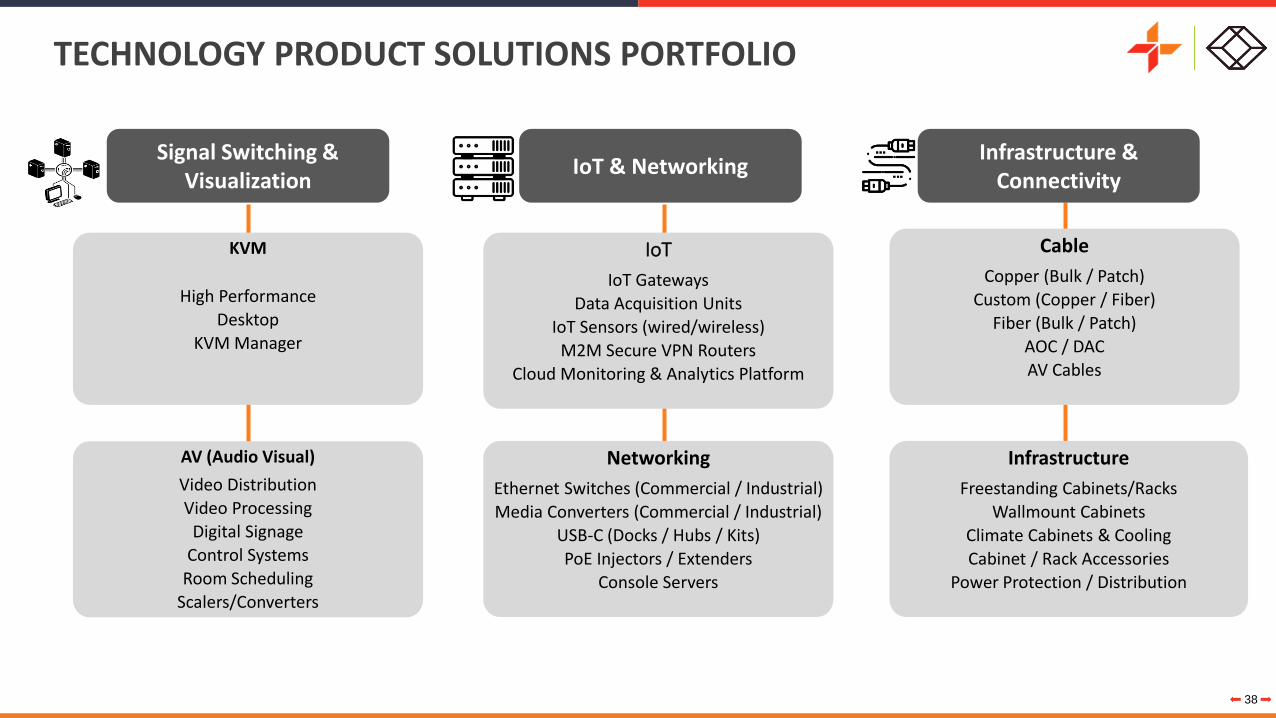
Signal Switching & Visualization
IoT & Networking
Infrastructure & Connectivity
Connected Buildings
5G / Wireless
Combined FY21 Revenues of Rs.4,674 Crs
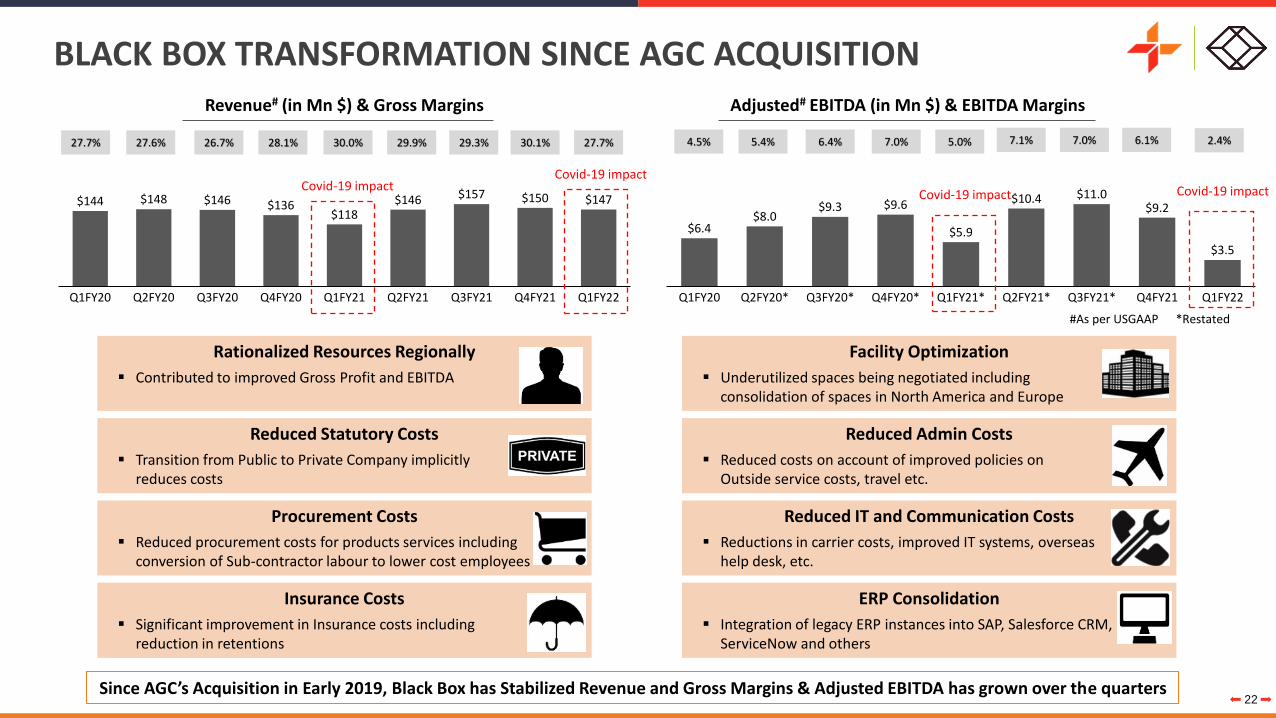
BLACK BOX TRANSFORMATION SINCE AGC ACQUISITION
22Since AGC’s Acquisition in Early 2019, Black Box has Stabilized Revenue and Gross Margins & Adjusted EBITDA has grown over the quarters
and implementation for infrastructure deployments, modernizations,
and active management
Provides the ability for organization to achieve the most out of existing
infrastructure as well as design, plan and deploy next generation
infrastructure
Capabilities
Data Center Infrastructure
Networking, Wireless & Fiber Internet-of-Things
Integrated Security Solutions Site Builds Communication Cabling
Contact Center Infrastructure Upgrade for an Indian Logistics Company
The ChallengeThe client decided to upgrade their existing Contact Center technology thatwas obsolete and move on to a robust optimized architecture so as toensure maximum uptime
The SolutionAGC explained the merits of a centralized set-up vis-à-vis the existing de-centralized set-up & ensured optimization on the design by leveragingtheir existing infrastructure to the maximum. This involved completeContact Center consolidation with back-office transformation on soft-phones. AGC’s Professional Services were a part of this deal whichshowcased AGC’s capability as a true Solution Integrator
BenefitsA future-ready solution with low. Total Cost of Ownership and high uptime
DIGITAL INFRASTRUCTURE
The Client: Our client is an Indian Logistics Company providing courierdelivery services & has a subsidiary cargo airline that operates in South Asiancountries
34
Solution Overview
Capabilities
Seamless Migration for Voice Technology Service
The ChallengeThe client was utilizing PRI, an outdated voice technology service that lacksredundancy and scalability. In addition, the client’s current service provider(as well as others) were phasing out legacy PRI services in the region
The SolutionAGC provided an up-to-date voice technology service delivering 2,000 SIPcall paths over a redundant MPLS network. The on-site AGC technical teamenabled a seamless migration from the old to the new system
BenefitsThe new centralized SIP service gave the client flexibility and scalability toadd capacity as needed and redundancy with failover between circuits. Bestof all, it reduced the client’s voice technology service costs by nearly 30%.
UNIFIED COMMUNICATIONS & COLLABORATION (UCC)
Comprehensive solutions to transform, migrate, and integrate unified
communication and collaboration platforms
Supports real-time engagement by integrating voice, video, data,
messaging, conferencing and mobility technologies
Mobility
Computer Telephony Integration
Audio
Web
Video
Voice / Unified Messaging
Presence
The Client: This healthcare provider, known worldwide for its excellence inclinical care, was given the highest recognition and national rankings in sixspecialties ranging from cardiology/heart surgery to neurology/neurosurgery
Chat
35
Solution Overview
Capabilities
Distributed Antenna Systems
Wireless / LTE WiFi
Mobile Device Management
Managed Mobile Services
Ubiquitous, 5G-Ready Wireless Coverage
The ChallengeThe client needs to provide mission-critical cellular coverage in multipleexisting and new buildings across its very large campus. The wirelesscoverage is designed for use by physicians, staff, patients, and visitors
The SolutionAGC has, so far, designed and installed the CommScope IONEra DigitalDistributed Antenna (DAS) System with more than 500 universal accesspoints (UAPs) in nine buildings across the campus
BenefitsFuture-ready and 5G capable, the DAS system provides ubiquitous,multioperator, in-building wireless coverage to support physician/staffcommunications and patient/visitor satisfaction
MOBILITY and 5G
Enterprise WiFi, distributed antenna systems (DAS) / small-cell design,
deployment and management to enable connectivity in challenging
locations from high-rises to buildings with large footprints and below
ground features
Establish in-building wireless DAS, called InterWireless 4G
/
The Client: This large, university-based healthcare system cares for tens ofthousands of patients a year. It is world renowned for its neuroscience,cancer research and treatment capabilities
36
Solution Overview
Capabilities
Asset Lifecycle Management
Desktop & Application Management Service Desk
Digital Engagement Enterprise Mobility IT Staffing
Global 24/7/365 Managed Services
The ChallengeThe client needed a single managed services provider with global reach aswell as local expertise to provide uniform, consistent IT services at its manylocations spanning North and Latin America
The SolutionThe 24x7x365 solution involves more than 150 on-site staffers at 14 of theclient’s locations. Services include LAN/ WAN support, equipmentinstallation and management, plus structured cabling in offices, datacenters, and manufacturing facilities. deal which showcased AGC’scapability as a true Solution Integrator
BenefitsWith outsourced managed services, the client now benefits fromconsistency, uniformity, and services optimization across all its informationtechnology disciplines and at all of its locations
MAINTENANCE & MANAGED SERVICES
The Client: The client is a widely known multinational company and pioneerin communications and computing technologies. AGC partnered with a globalinformation technology services and consulting company on the project
Value proposition covers the full lifecycle of IT services – from procurement of
technology to configuration, design, implementation and management of complex
environments
Standardized set of offerings for on demand requirements, day 2 support, projects
and managed edge services with ability to be bundled or à la carte to address the
unique needs of each customer
Team of off-site and on-site technicians capable of providing 24x7x365 support
from break-fix to complex management, deployment, and integration. Providing 4
hour response time
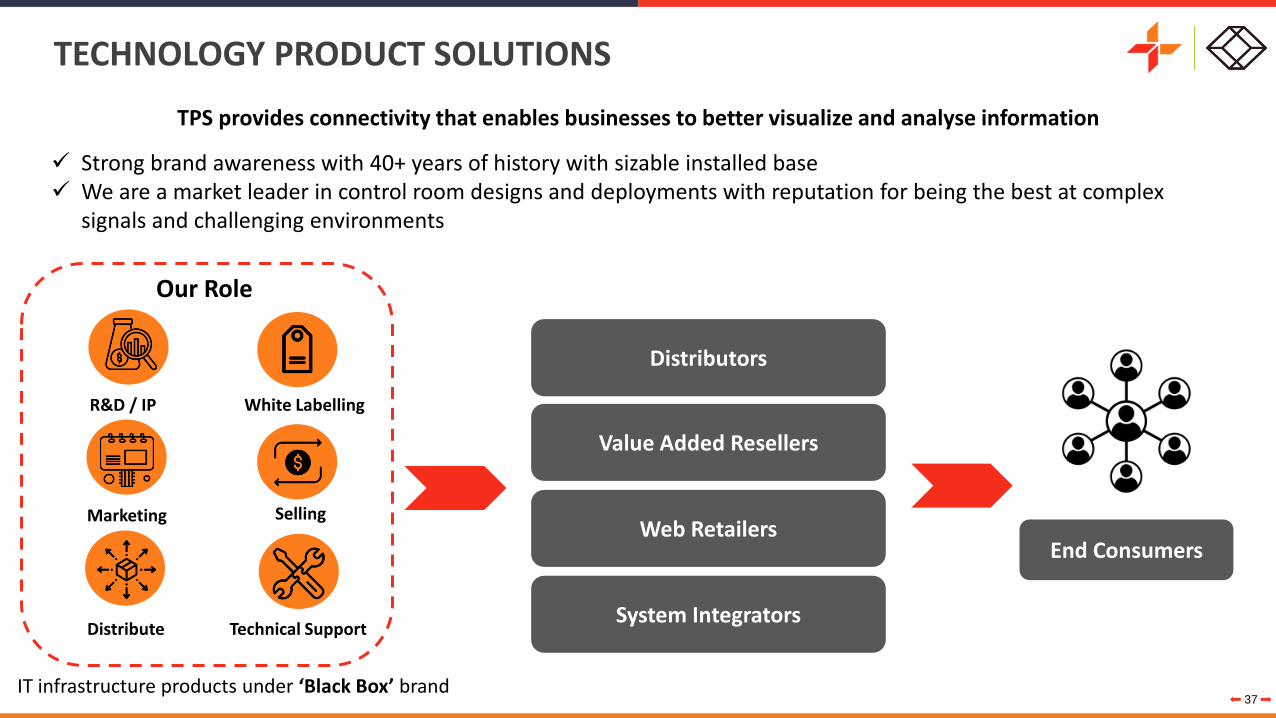
TECHNOLOGY PRODUCT SOLUTIONS
37
TPS provides connectivity that enables businesses to better visualize and analyse information
Value Added Resellers
Web Retailers
IT infrastructure products under ‘Black Box’ brand
Our Role
R&D / IP White Labelling
Selling
Distribute
✓ Strong brand awareness with 40+ years of history with sizable installed base✓ We are a market leader in control room designs and deployments with reputation for being the best at complex
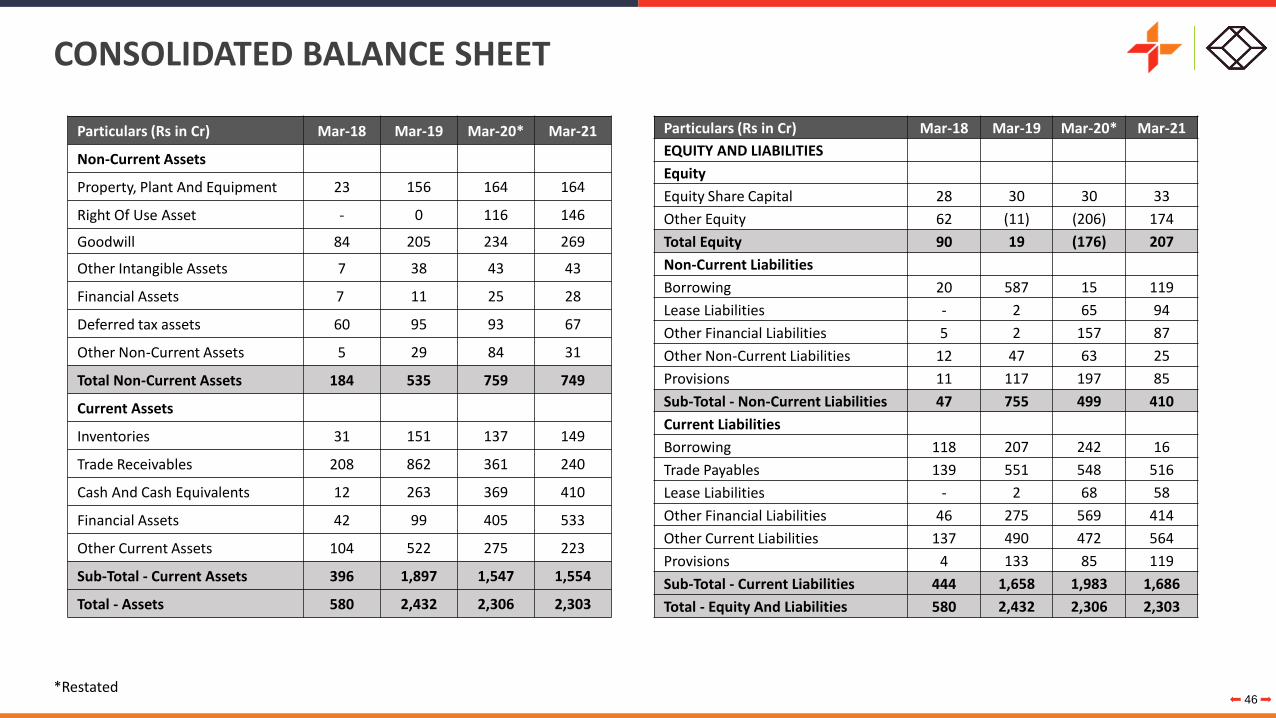
Sub-Total - Current Liabilities 444 1,658 1,983 1,686
Total - Equity And Liabilities 580 2,432 2,306 2,303
*Restated
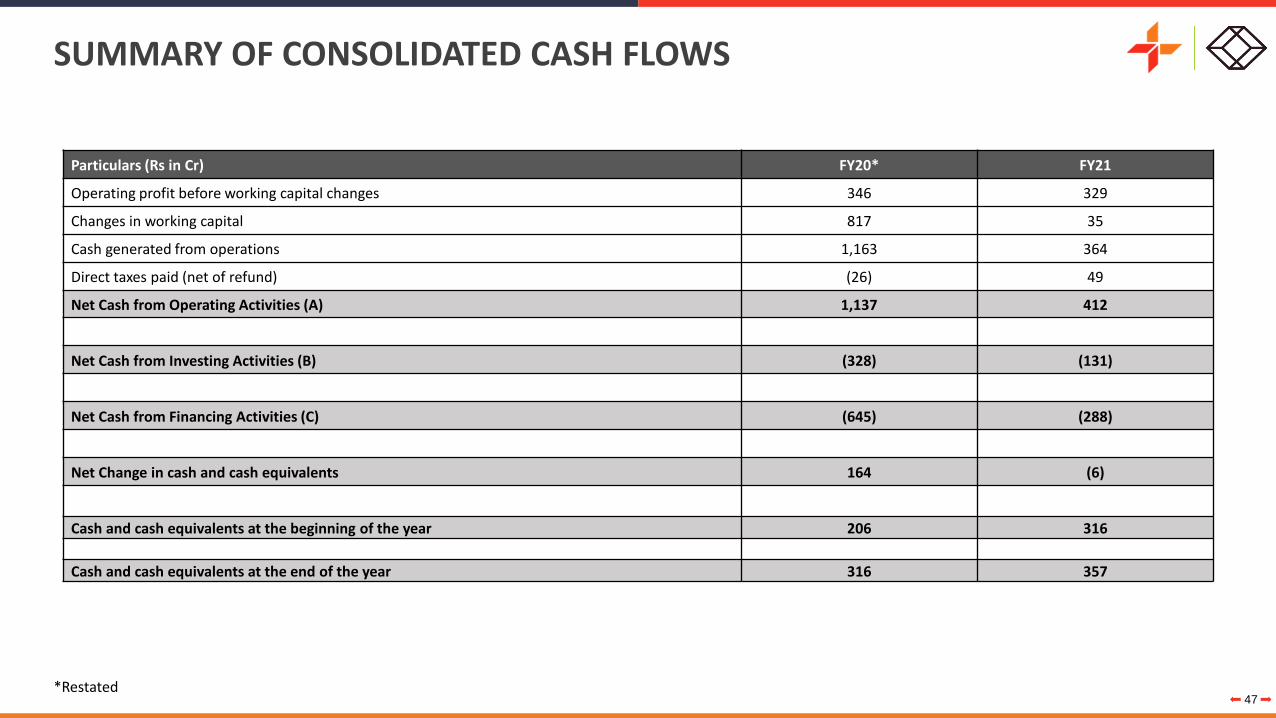
SUMMARY OF CONSOLIDATED CASH FLOWS
47*Restated
Particulars (Rs in Cr) FY20* FY21
Operating profit before working capital changes 346 329
Changes in working capital 817 35
Cash generated from operations 1,163 364
Direct taxes paid (net of refund) (26) 49
Net Cash from Operating Activities (A) 1,137 412
Net Cash from Investing Activities (B) (328) (131)
Net Cash from Financing Activities (C) (645) (288)
Net Change in cash and cash equivalents 164 (6)
Cash and cash equivalents at the beginning of the year 206 316
Cash and cash equivalents at the end of the year 316 357
DISCLOSURE OF FINANCIAL RESTATEMENT
48
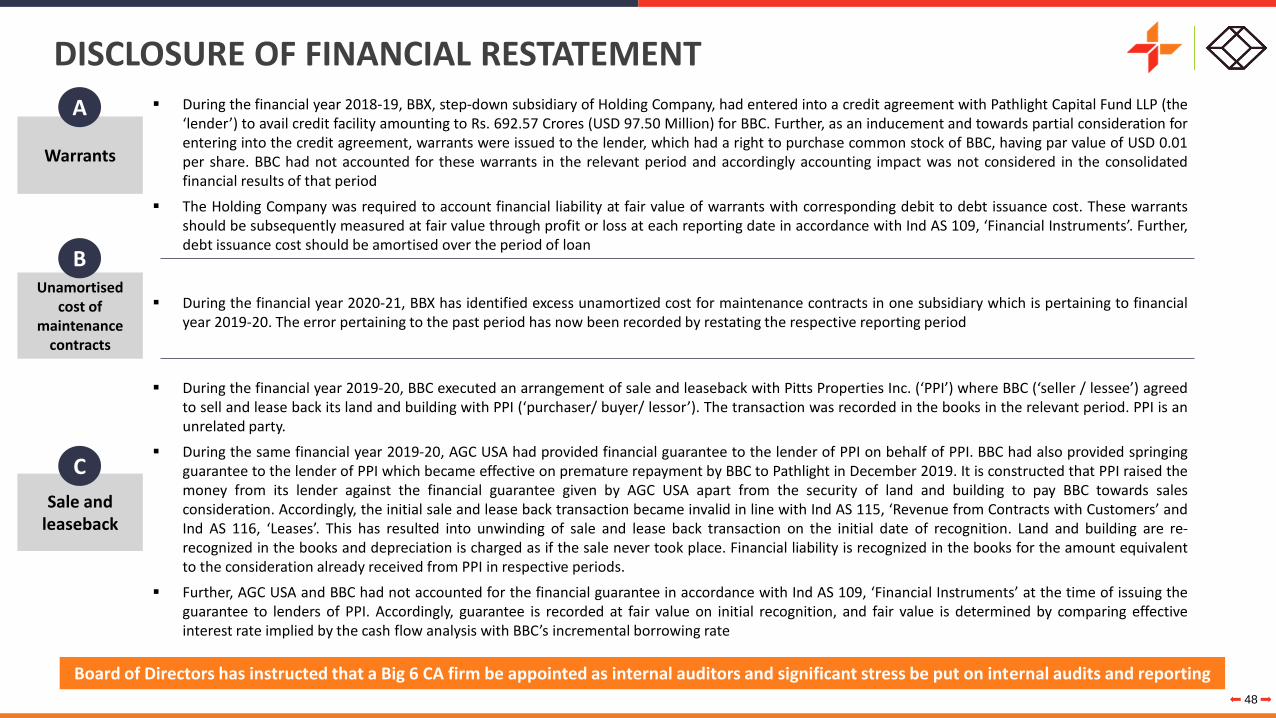
▪ During the financial year 2018-19, BBX, step-down subsidiary of Holding Company, had entered into a credit agreement with Pathlight Capital Fund LLP (the‘lender’) to avail credit facility amounting to Rs. 692.57 Crores (USD 97.50 Million) for BBC. Further, as an inducement and towards partial consideration forentering into the credit agreement, warrants were issued to the lender, which had a right to purchase common stock of BBC, having par value of USD 0.01per share. BBC had not accounted for these warrants in the relevant period and accordingly accounting impact was not considered in the consolidatedfinancial results of that period
▪ The Holding Company was required to account financial liability at fair value of warrants with corresponding debit to debt issuance cost. These warrantsshould be subsequently measured at fair value through profit or loss at each reporting date in accordance with Ind AS 109, ‘Financial Instruments’. Further,debt issuance cost should be amortised over the period of loan
▪ During the financial year 2020-21, BBX has identified excess unamortized cost for maintenance contracts in one subsidiary which is pertaining to financialyear 2019-20. The error pertaining to the past period has now been recorded by restating the respective reporting period
▪ During the financial year 2019-20, BBC executed an arrangement of sale and leaseback with Pitts Properties Inc. (‘PPI’) where BBC (‘seller / lessee’) agreedto sell and lease back its land and building with PPI (‘purchaser/ buyer/ lessor’). The transaction was recorded in the books in the relevant period. PPI is anunrelated party.
▪ During the same financial year 2019-20, AGC USA had provided financial guarantee to the lender of PPI on behalf of PPI. BBC had also provided springingguarantee to the lender of PPI which became effective on premature repayment by BBC to Pathlight in December 2019. It is constructed that PPI raised themoney from its lender against the financial guarantee given by AGC USA apart from the security of land and building to pay BBC towards salesconsideration. Accordingly, the initial sale and lease back transaction became invalid in line with Ind AS 115, ‘Revenue from Contracts with Customers’ andInd AS 116, ‘Leases’. This has resulted into unwinding of sale and lease back transaction on the initial date of recognition. Land and building are re-recognized in the books and depreciation is charged as if the sale never took place. Financial liability is recognized in the books for the amount equivalentto the consideration already received from PPI in respective periods.
▪ Further, AGC USA and BBC had not accounted for the financial guarantee in accordance with Ind AS 109, ‘Financial Instruments’ at the time of issuing theguarantee to lenders of PPI. Accordingly, guarantee is recorded at fair value on initial recognition, and fair value is determined by comparing effectiveinterest rate implied by the cash flow analysis with BBC’s incremental borrowing rate
Warrants
Unamortised cost of
maintenance contracts
Sale and leaseback
A
B
C
Board of Directors has instructed that a Big 6 CA firm be appointed as internal auditors and significant stress be put on internal audits and reporting
IMPACT OF FINANCIAL RESTATEMENT
49
Liability created on warrants as on 31st March 2021 is for Rs. 102.03 Crores (US$14.0 Million). However, On 30 June 2021, BBX has entered into a contract to premature the warrant agreement with Pathlight Capital Fund LLP, executed in pursuance of credit agreement, by buying back the warrants for a value of Rs. 89.71 Crores (US$ 12.25 Million).