17
4/6/2011 1 Age‐Earnings Profiles The fanning out of earnings by education level as the cohort ages
| Date post: | 29-Apr-2018 |
| Category: |
Documents |
| Upload: | nguyentruc |
| View: | 216 times |
| Download: | 3 times |

4/6/2011
1
Age‐Earnings Profiles
The fanning out of earnings by education level as the cohort ages

4/6/2011
2
Money Earnings (Mean) for Full‐Time, Year‐Round Male Workers, 2009
Lifetime Sum of College vs High School Earnings through age 65
$1,416,000
4/6/2011
3
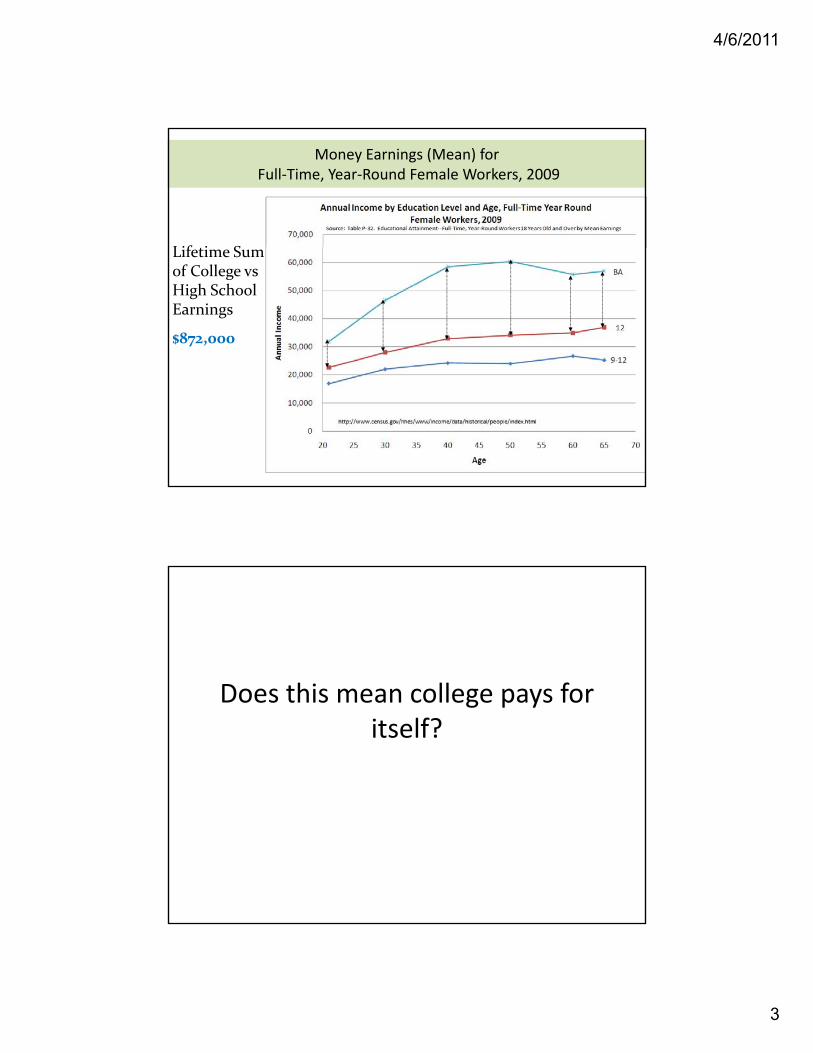
Money Earnings (Mean) forFull‐Time, Year‐Round Female Workers, 2009
Lif i S Lifetime Sum of College vs High School Earnings
$872,000
D hi ll fDoes this mean college pays for itself?

4/6/2011
4
Source: Blau, Ferber, Winkler, 2006. The Economics of Women, Men and Work, 5th edition
Factors affecting returns to college in the Human Capital Model
Ht = Earnings from High School Education in year tt
St = Earnings from College Education in year t
Ct = College Tuition in year t
r = Rate of time preference
T = Time Span
Need a mechanism to equalize utility of income earned at different times: Present Value

4/6/2011
5
Future Value: The value at a future date of dollar today
Present value review
Period 0 Period 1 Period 2
$1 $1*(1+r) {$1*(1+r)}*(1+r)
$1*(1+r)2
Rate of time preference : proportional increase in income p p prequired next period to compensate for the loss of $1 today
:personal interest rate
Compounding: sequential computation of future value
Future Value: The value at a future date of dollar today
P i d 0 P i d 1 P i d 2 P i d 3 P i d T
Present value review
Period 0 Period 1 Period 2 Period 3 Period T
$1 $1*(1+r) $1*(1+r)2 $1*(1+r)3 $1(1+r)T
r = 0.10; T=40
$1 $1*(1.1) $1*(1.1)2 $1*(1.1)3 $1(1.1)40
$1 $1.10 $1.21 $1.33 $45.26

4/6/2011
6
Present Value: The current value of a stream of future income
d d
Present value review
Period 0 Period 1
$1 $1*(1+r)
$1/(1+r) $1
Present Value: The current value of a stream of future income
P i d 0 P i d 1 P i d 2
Present value review
Period 0 Period 1 Period 2$1 $1*(1+r) $1*(1+r)2
$1/(1+r)2 $1/(1+r) $1
r = 0.1$1/(1.1)2 $1/(1.1) $1$0.83 $0.91 $1

4/6/2011
7
Present Value: The current value of a stream of future income
P i d 0 P i d 1 P i d 2 P i d 3 P i d T
Present value review
Period 0 Period 1 Period 2 Period 3 Period T
$1 $1*(1+r) $1*(1+r)2 $1*(1+r)3 $1(1+r)T
$1/(1+r)T $1
r = 0.10; T=40
$1/(1.1)40 $1
$0.022 $1
Present Value: The current value of a stream of future income
Stream of $1 every year for T periods, starting next period
Present value review
y y p , g p
T
Σ1/(1+r)t = $1/(1+r) + $1/(1+r)2 + $1/(1+r)3 + + $1/(1+r)TΣt=1
1/(1+r) $1/(1+r) + $1/(1+r) + $1/(1+r) + … + $1/(1+r)
< T
4/6/2011
8
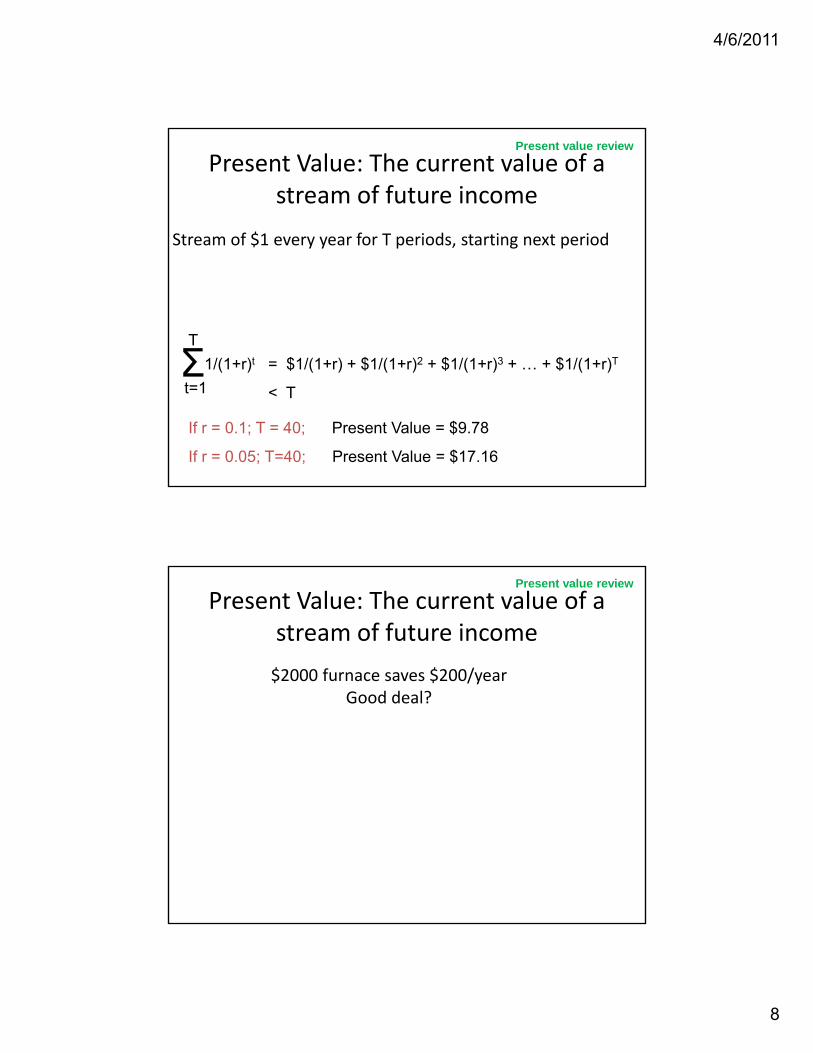
Present Value: The current value of a stream of future income
Stream of $1 every year for T periods, starting next period
Present value review
y y p , g p
T
Σ1/(1+r)t = $1/(1+r) + $1/(1+r)2 + $1/(1+r)3 + + $1/(1+r)TΣt=1
1/(1+r) $1/(1+r) + $1/(1+r) + $1/(1+r) + … + $1/(1+r)
< T
If r = 0.1; T = 40; Present Value = $9.78
If r = 0.05; T=40; Present Value = $17.16
Present Value: The current value of a stream of future income
$2000 furnace saves $200/year
Present value review
Good deal?

4/6/2011
9
Present Value: The current value of a stream of future income
$2000 furnace saves $200/year
Present value review
Good deal?T
Σt=1
1/(1+r)t
If r = 0.1; T = 40; Present Value = $1956
Breakeven: NEVER
If r = 0.05; T=40; Present Value = $3432
Breakeven: 15 years
Factors affecting returns to college in the Human Capital Model
PVS = Present Value of College Salary
PVS = 5 6 7
5 6 7 ...(1 ) (1 ) (1 ) (1 )
TT
S S S Sr r r r
+ + + ++ + + +
PVC = Present Value of College Costs
PVC = 3 3 51 1 2 2 4 42 3 4 5 ...
(1 ) (1 ) (1 ) (1 ) (1 ) (1 )T
T
H C HH C H C H C Hr r r r r r
++ + ++ + + + + +
+ + + + + +

4/6/2011
10
Factors affecting returns to college in the Human Capital Model
( ) ( )( ) ( ) ( ) ( )H C S HH C H C H C S H
Ht => decreases incentive to invest
St => increases incentive to invest
Ct => decreases incentive to invest
NPV = 3 3 5 51 1 2 2 4 42 3 4 5
( ) ( )( ) ( ) ( ) ( )...(1 ) (1 ) (1 ) (1 ) (1 ) (1 )
T TT
H C S HH C H C H C S Hr r r r r r
+ −− + + + −− − − + + +
+ + + + + +
t
r => decreases incentive to invest
T => increases incentive to invest
How high do returns have to be for college to break even?
NPV = 3 3 5 51 1 2 2 4 42 3 4 5
( ) ( )( ) ( ) ( ) ( )...(1 ) (1 ) (1 ) (1 ) (1 ) (1 )
T TT
H C S HH C H C H C S Hr r r r r r
+ −− + + + −− − − + + +
+ + + + + +(1 ) (1 ) (1 ) (1 ) (1 ) (1 )r r r r r r+ + + + + += 0 at breakeven
C = $5,000/year
H = 20,000/year for 44 years
r = 0.10
C = $15,000/year
H = 20,000/year for 44 years
r = 0.10
PV C ll t $PV College cost = $79,250
Breakeven
S – H = $8,104 over 40 years
Total: $324,000
PV College cost = $110,950
Breakeven
S – H = $11,346 over 40 years
Total: $453,830

4/6/2011
11
Can the human capital model explain earnings profiles?
Male Profile Female Profile
Stylized Facts Regarding Age Earnings Profiles
1) All profiles flatten with ageMost rapid wage growth early in career
2) Earnings increase with education
3) Earnings gap between education groups widens with age
4) M l f l i4) Male female comparisons1) Female earnings lower than male earnings
2) Female wage profiles flatter than men
Note: These are synthetic cohorts—longitudinal data may differ especially for women

4/6/2011
12
The role of labor market attachment on the increase in women’s college
enrollment
Women’s relative enrollment in college began to accelerate with the 1950 birth cohort
(the 1970s college cohort)
Time allocation decisions of white college educated women by birth cohort
Claudia Goldin, Lawrence Katz, and Ilyana Kuziemko, “Homecoming of American Women”, Journal of Economic Perspectives, 2006, 20:133-156.

4/6/2011
13
Percentage of degrees earned by women , by year of issue and degree level
Source: Blau, Ferber, Winkler, 2006. The Economics of Women, Men and Work, 5th edition
Around the decade of the 70s, we start seeing increases in Around the decade of the 70s, we start seeing increases in nontraditional educational choices for womennontraditional educational choices for women
Percentage of first professional degrees earned by women, by year
Source: Blau, Ferber, Winkler, 2006. The Economics of Women, Men and Work, 5th edition
Around the decade of the 70s, we start seeing increases in Around the decade of the 70s, we start seeing increases in nontraditional professional choices for womennontraditional professional choices for women

4/6/2011
14
Between 1972 and 1992 high school classes,
•Male college completion rate rose from 30% to 35%
•Female college completion rate rose from 26% to 42%
Sample high school graduates in the 1972 NLS and the 1992 NELSthe 1992 NELS.
Reported in Claudia Goldin, Lawrence Katz, and Ilyana Kuziemko, “Homecoming of American Women”, Journal of Economic Perspectives, 2006, 20:133-156
College Enrollment and College Wage Premium

4/6/2011
15
College Enrollment and College Wage Premium
The role of cognitive ability
Women have Women have eliminated the gapeliminated the gap
Claudia Goldin, Lawrence Katz, and Ilyana Kuziemko, “Homecoming of American Women”, Journal of Economic Perspectives, 2006, 20:133-156.
eliminated the gap eliminated the gap in high school in high school math and sciencemath and science
4/6/2011
16
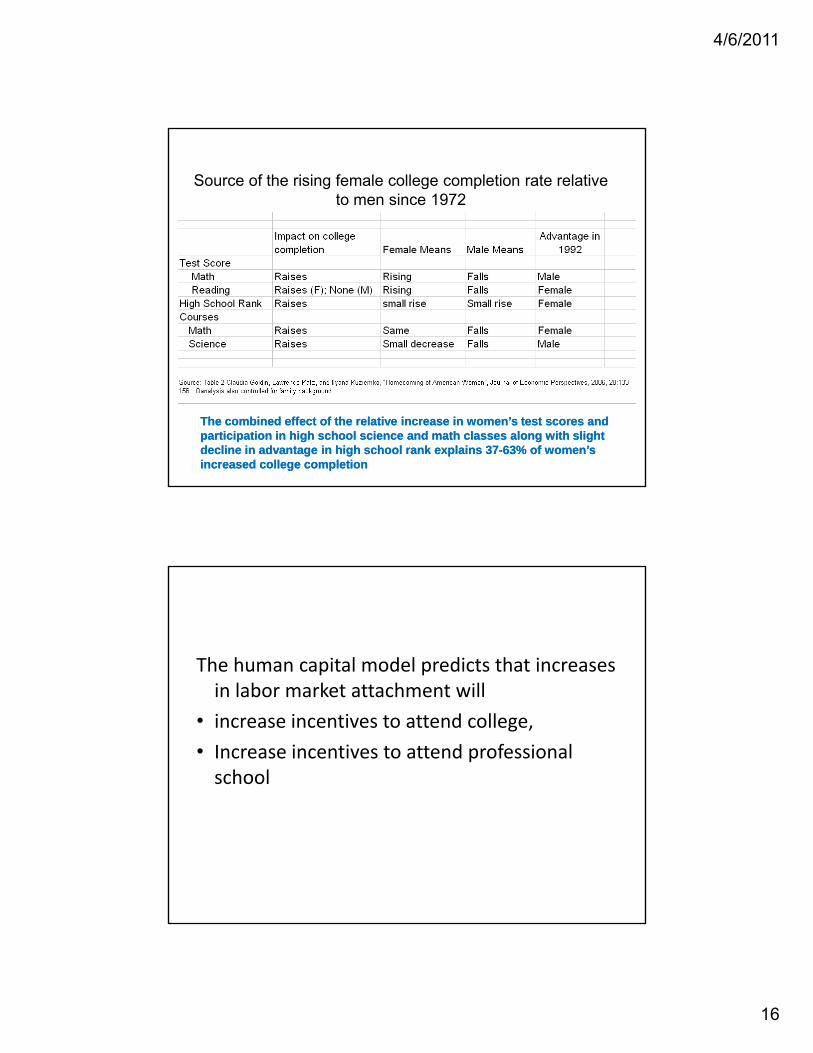
Source of the rising female college completion rate relative to men since 1972
The combined effect of the relative increase in women’s test scores and The combined effect of the relative increase in women’s test scores and participation in high school science and math classes along with slight participation in high school science and math classes along with slight decline in advantage in high school rank explains 37decline in advantage in high school rank explains 37--63% of women’s 63% of women’s increased college completionincreased college completion
The human capital model predicts that increases i l b k t tt h t illin labor market attachment will
• increase incentives to attend college,
• Increase incentives to attend professional school

4/6/2011
17
Astin Survey, “Do you disagree with the statement, “the activities of married women are best confined to the home and family?” Responses of first year college women
NLS Survey, “Do you expect to be in the paid labor force at age 35?” Longitudinal responses of white womenClaudia Goldin, Lawrence Katz, and Ilyana Kuziemko, “Homecoming of American Women”, Journal of Economic Perspectives, 2006, 20:133-156.
Claudia Goldin, Lawrence Katz, and Ilyana Kuziemko, “Homecoming of American Women”, Journal of Economic Perspectives, 2006, 20:133-156.


