24
Age of Owner Data from US Census’ Survey of Business Owners 2007 2.30% 11.40% 22.20% 30.20% 23.20% 10.60% Women-Owned Firms <25 25-34 35-44 45-54 55-64 65+
| Date post: | 22-Dec-2015 |
| Category: |
Documents |
| View: | 214 times |
| Download: | 1 times |

Age of Owner
Data from US Census’ Survey of Business Owners 2007
2.30%
11.40%
22.20%
30.20%
23.20%
10.60%
Women-Owned Firms
<2525-3435-4445-5455-6465+

Education Level of Owner
Data from US Census’ Survey of Business Owners 2007
4%
21%
7%
18%8%
26%
16%
Women-Owned Firms
Less than HS
High School
Technical, Trade, Vocational
Some college, no degree
Associate's degree
Bachelor's degree
Advanced degree

Minority Women-Owned Businesses
Data from US Census’ Survey of Business Owners 2007
White African American
Hispanic Asian American Indian/ Native
Alaskan
Native Hawaiian/ Pacific Is-
lander
0
1,000
2,000
3,000
4,000
5,000
6,000
7,000 6359
912 788 52397 15N
umbe
r of F
irm
s
(in thousands)
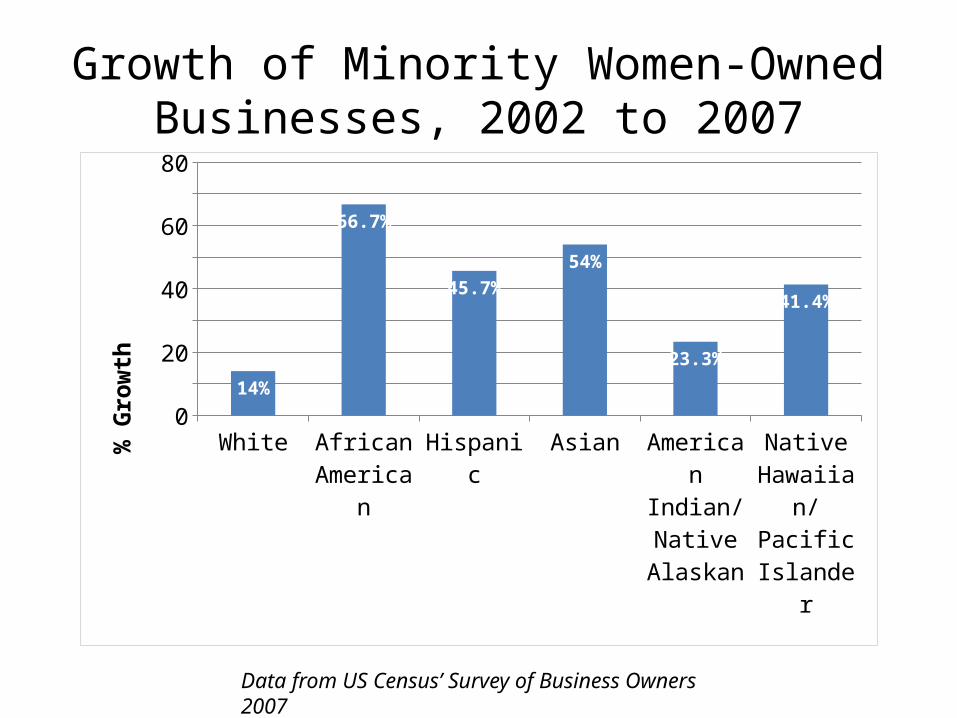
Growth of Minority Women-Owned Businesses, 2002 to 2007
Data from US Census’ Survey of Business Owners 2007
White African American
Hispanic Asian American Indian/ Native
Alaskan
Native Hawaiian/ Pacific Is-
lander
0
10
20
30
40
50
60
70
80
14%
66.7%
45.7%
54%
23.3%
41.4%
% G
row
th
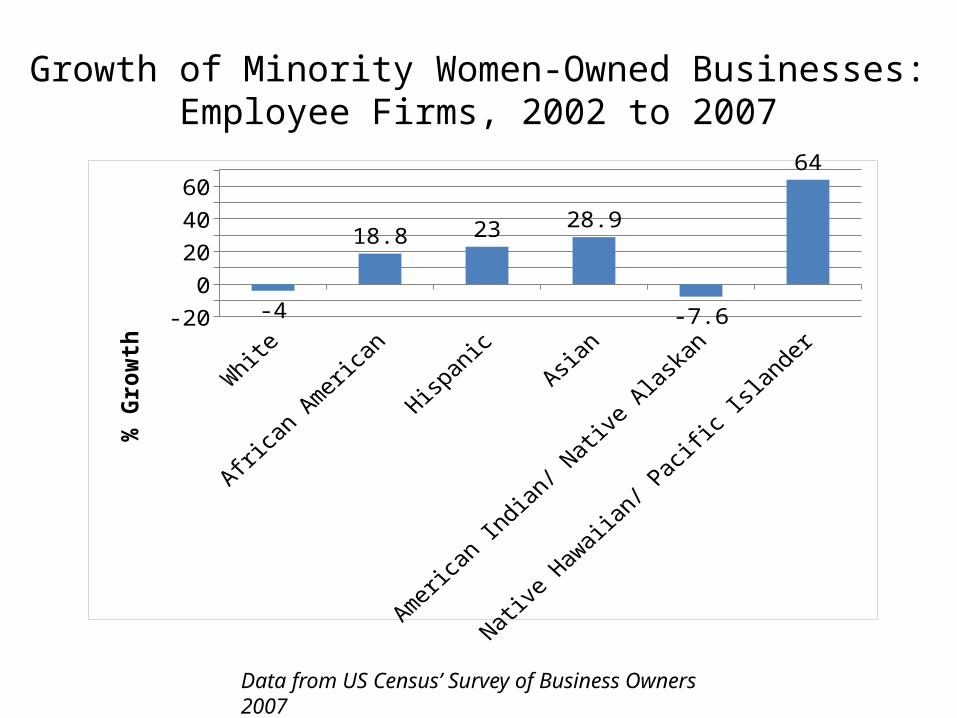
Growth of Minority Women-Owned Businesses: Employee Firms, 2002 to 2007
Data from US Census’ Survey of Business Owners 2007
White
Africa
n American
Hispan
icAsia
n
American
Indian
/ Nati
ve Alas
kan
Native
Hawaii
an/ P
acific I
slander
-20-10
010203040506070
-4
18.8 23 28.9
-7.6
64
% G
row
th

Characteristics of Women-Owned Businesses: Geography
Data from US Census’ Survey of Business Owners 2007
30.6%-34.5%
28.8%-30.5%
24.8%-28.7%
22.1%-24.7%
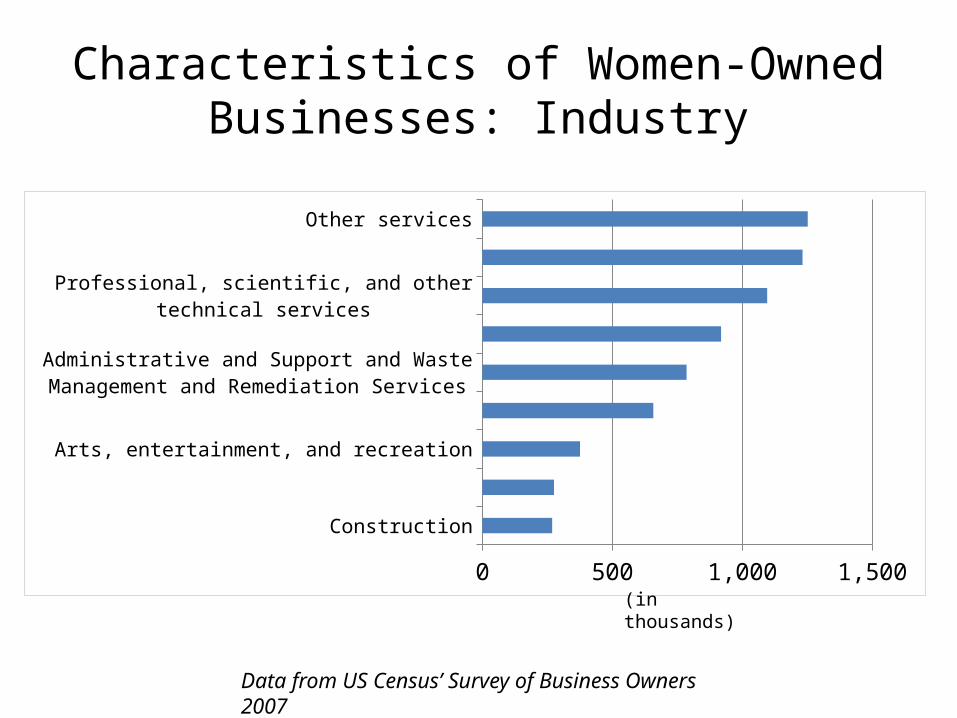
Characteristics of Women-Owned Businesses: Industry
Data from US Census’ Survey of Business Owners 2007
Construction
Educational services
Arts, entertainment, and recreation
Real estate and rental and leasing
Administrative and Support and Waste Management and Remediation Services
Retail trade
Professional, scientific, and other technical services
Health care and social assistance
Other services
0200
400600
8001,000
1,2001,400
(in thousands)
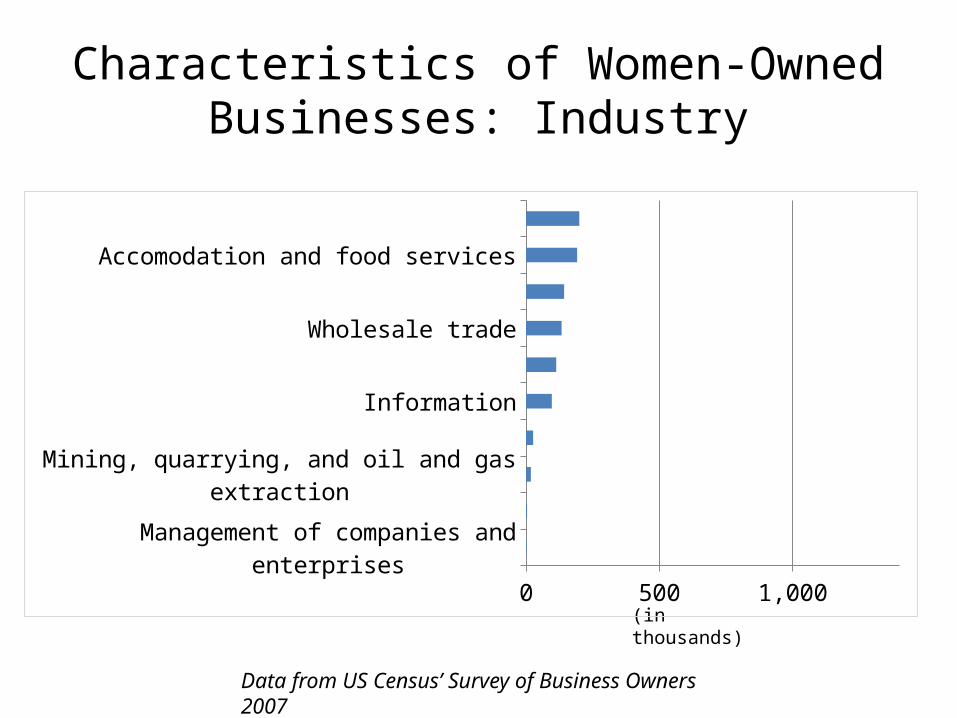
Characteristics of Women-Owned Businesses: Industry
Data from US Census’ Survey of Business Owners 2007
(in thousands)
Management of companies and enterprises
Utilities
Mining, quarrying, and oil and gas extraction
Agriculture, forestry, fishing, and hunting
Information
Manufacturing
Wholesale trade
Transportation and warehousing
Accomodation and food services
Finance and insurance
0 200 400 600 800 1,0001,2001,400

Characteristics of Women-Owned Businesses: Employees
Data from US Census’ Survey of Business Owners 2007
88%
12%No paid employees
Paid em-ployees
1-4
5-9
10-19
20-49
50-99
100-499
500+
0 100 200 300 400 500 600
Of 12% with paid employees:
# of
em
ploy
ees
(in thousands)

Characteristics of Women-Owned Businesses: Receipts
Data from US Census’ Survey of Business Owners 2007
Less than $5,000
$5,000-$9,999
$10,000-$24,999
$25,000-$49,999
$50,000-$99,999
$100,000-$249,999
$250,000-$499,999
$500,000-$999,999
$1,000,000 or more
0 500 1,000 1,500 2,000 2,500
Sale
s/re
ceip
ts o
f firm
(in thousands)

Large Revenue Women-Owned Businesses
Data from US Census’ Survey of Business Owners 2007
• There are 141,502 women-owned firms with receipts of $1 million or more, just 1.82% of all women-owned firms.
• These large revenue firms generate total receipts of $835.7 billion annually.
• A full 97% of these firms are employer firms, employing 4.7 million people across the country with a payroll of $159.1 billion. These employer firms have average receipts of $6.1 million.
• Just 2.9% of these firms do not have any paid employees. They generate average receipts of $1.8 million annually.

Large Revenue Women-Owned Businesses: Industry
Data from US Census’ Survey of Business Owners 2007
Real estate and rental and leasing
Accomodation and food services
Administrative and Support and Waste Management and Remediation Services
Manufacturing
Health care and social assistance
Professional, scientific, and other technical services
Construction
Wholesale trade
Retail trade
0 10,00020,000
30,000
Number of companies

Large Revenue Women-Owned Businesses: Industry
Data from US Census’ Survey of Business Owners 2007
UtilitiesAgriculture, forestry, fishing, and hunting
Mining, quarrying, and oil and gas extractionEducational services
Management of companies and enterprisesArts, entertainment, and recreation
InformationFinance and insurance
Other servicesTransportation and warehousing
0 10,00020,000
30,000
Number of companies

Business As Primary Source of Income
Data from US Census’ Survey of Business Owners 2007
Yes No0.00%
10.00%
20.00%
30.00%
40.00%
50.00%
60.00%
All firmsWomen-Owned Firms

Initial Acquisition of Business
Data from US Census’ Survey of Business Owners 2007
Founded Purchased Inherited Transfer or Gift
0.00%
10.00%
20.00%
30.00%
40.00%
50.00%
60.00%
70.00%
80.00%
90.00%
All FirmsWomen-Owned

Source of Capital to Start/Acquire
Data from US Census’ Survey of Business Owners 2007
Personal/f
amily sa
vings
Personal/f
amily asse
ts other t
han savin
gs
Personal/f
amily home equity
loan
Credit C
ard
Govern
ment busin
ess loans
Govern
ment-guara
nteed
bank busin
ess loan
Bank Busin
ess Lo
an
Business
loan/inve
stments
from fa
mily/fr
iends
Investm
ent by v
enture ca
pitalis
t(s)
Grants
Other
Don't Know
None needed0.00%
10.00%20.00%30.00%40.00%50.00%60.00%70.00%
All Firms Women-Owned

Source of Capital to Start/Acquire
Data from US Census’ Survey of Business Owners 2007
Personal/f
amily sa
vings
Personal/f
amily asse
ts other t
han savin
gs
Personal/f
amily home equity
loan
Credit C
ard
Govern
ment busin
ess loans
Govern
ment-guara
nteed
bank busin
ess loan
Bank Busin
ess Lo
an
Business
loan/inve
stments
from fa
mily/fr
iends
Investm
ent by v
enture ca
pitalis
t(s)
Grants
Other
Don't Know
None needed0.00%
10.00%20.00%30.00%40.00%50.00%60.00%70.00%
Employer Firms Non-employer Firms

Amount of Capital to Start/Acquire
Data from US Census’ Survey of Business Owners 2007
<$5K $5K-$9,999 $10K-$24,999 $25K-$49,999 $50K-$99,999 $100K-$249,999
$250K-$999,999
$1M+0.00%
5.00%
10.00%
15.00%
20.00%
25.00%
30.00%
35.00%
40.00%
All Firms Women-Owned

Amount of Capital to Start/Acquire
Data from US Census’ Survey of Business Owners 2007
<$5K $5K-$9,999 $10K-$24,999 $25K-$49,999 $50K-$99,999 $100K-$249,999
$250K-$999,999
$1M+0.00%
5.00%
10.00%
15.00%
20.00%
25.00%
30.00%
35.00%
40.00%
45.00%
Employer Firms Non-employer Firms

Source of Capital to Expand in 2007
Data from US Census’ Survey of Business Owners 2007
Personal/f
amily sa
vings
Personal/f
amily asse
ts other t
han savin
gs
Personal/f
amily home equity
loan
Credit C
ard
Govern
ment busin
ess loans
Govern
ment-guara
nteed
bank busin
ess loan
Bank Busin
ess Lo
an
Business
loan/inve
stments
from fa
mily/fr
iends
Investm
ent by v
enture ca
pitalis
t(s)
Business
profits/
assets
Grants
Other
Don't Know
Did not exp
and0.00%
10.00%
20.00%
30.00%
40.00%
50.00%
60.00%
All Firms Women-Owned

Seasonal or Part-time Business
Data from US Census’ Survey of Business Owners 2007
Operated less than 40 hrs per week
Operated less than 12 months
Seasonal business Operated occasionally0.00%
5.00%
10.00%
15.00%
20.00%
25.00%
30.00%
35.00%
40.00%
45.00%
50.00%
All Firms Women-Owned
*In 2007, did any of the following characteristics describe the activity of this business?”

Seasonal or Part-time Business
Data from US Census’ Survey of Business Owners 2007
Operated less than 40 hrs per week
Operated less than 12 months
Seasonal business Operated occasionally0.00%
10.00%
20.00%
30.00%
40.00%
50.00%
60.00%
Employer Firms Non-employer Firms
*In 2007, did any of the following characteristics describe the activity of this business?”

Types of Customers*
Data from US Census’ Survey of Business Owners 2007
Federal gov't State or local gov't Other business or organizations Individuals0.00%
10.00%
20.00%
30.00%
40.00%
50.00%
60.00%
70.00%
80.00%
90.00%
All Firms Women-Owned
*”In 2007, which of the following types of customers accounted for 10% or more of this business’s total sales of goods and/or services?”

Benefits of Employer Firms
Data from US Census’ Survey of Business Owners 2007
Health in
sura
nce
Contributions t
o retire
ment plans
Profit s
haring or s
tock options
Paid holidays,
vaca
tion, or s
ick le
ave
None of the above
0.00%10.00%20.00%30.00%40.00%50.00%60.00%
All Firms Women-Owned
*”In 2007, which of the following employee benefits were paid totally or partly by this business?”


