17
AGE RELATED COMPARATIVE CIRCUMFERENCE, TESTICULAR TONOMETRY WITH THE SEMEN FRIESIAN 1 Gábor G, 2 Szász F. 1 Dept. Cattle Breeding, Res. Inst. for AI Corporation, ÁTK HERCEGHALOM
| Date post: | 02-Jan-2016 |
| Category: |
Documents |
| Upload: | susanna-marshall |
| View: | 214 times |
| Download: | 0 times |
AGE RELATED COMPARATIVE CIRCUMFERENCE, TESTICULAR TONOMETRY WITH THE SEMEN
FRIESIAN 1Gábor G, 2Szász F. 1Dept. Cattle Breeding, Res. Inst. for
AI Corporation,
ÁTKHERCEGHALOM
STUDY OF THE SCROTAL ECHOTEXTURE ANDPRODUCTION IN HOLSTEIN- AI BULLS Animal Breeding Herceghalom, Hungary, 2 NationalGödöllő, Hungary
INTRODUCTION
• The most common method for predicting spermatozoa production is scrotal circumference (SC). Examination of the testicular echotexture (ET) suggested that ultrasonography also may be useful for prediction of sperm production. Testicular tonometry (TM) also was reported to estimate the semen output.
OBJECTIVES
• The objectives were to determine relationships among SC, ultrasonographic ET of the testis, testicular consistency (TM) and semen production in Holstein-Friesian bulls (HF).
METHODS
ANIMALS
Breed No. Age (month)
HF 30 11.7 ± 2.4 (1st examination)
18.0 ± 1.6 (2nd examination)
Morphological Measures
Scrotal Circumference (SC) - By Coulter Scrotal Tape Testicular Consistency (TM) - By electronic tonometer - see Figure 1
Image Analysis by TesTracto® Software
Echotexture - see Figure 2 and 3 Used a Scanner 450 with a 7.5 MHz Linear Transducer (12 mo of age), and
Scanner 100 VET with 8.0 MHz dual frequency Linear Transducer (18 mo of age)
Gain was held constant Images were saved on a IBM notebook or disk (18 mo of age) Controlled pressure between scrotal skin and the probe (0.76 kg/cm2) see
Figure 4
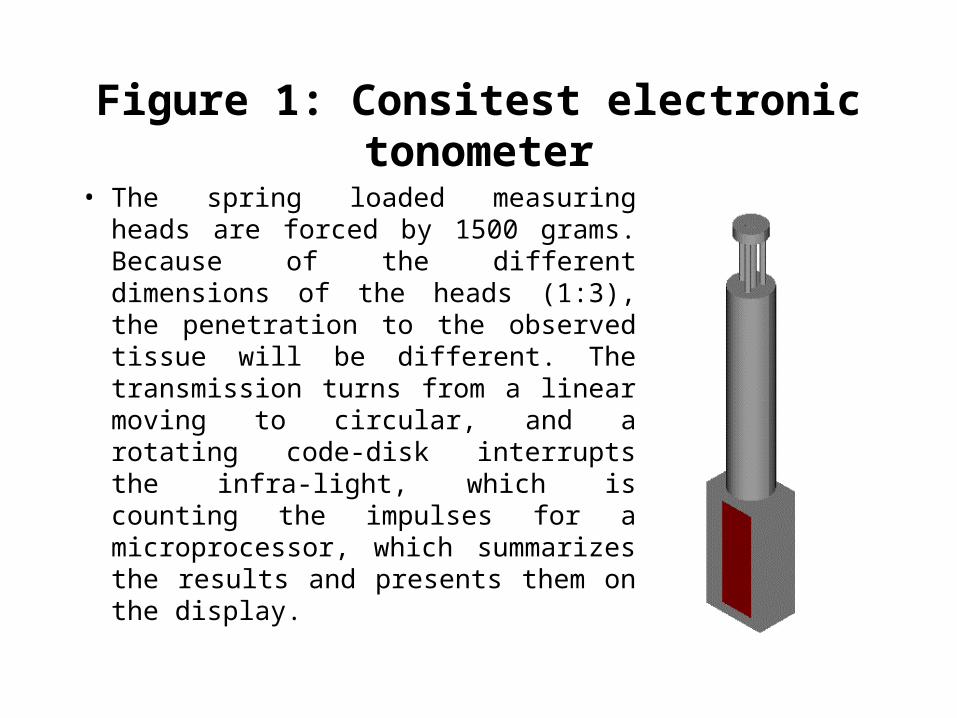
Figure 1: Consitest electronic tonometer
• The spring loaded measuring heads are forced by 1500 grams. Because of the different dimensions of the heads (1:3), the penetration to the observed tissue will be different. The transmission turns from a linear moving to circular, and a rotating code-disk interrupts the infra-light, which is counting the impulses for a microprocessor, which summarizes the results and presents them on the display.
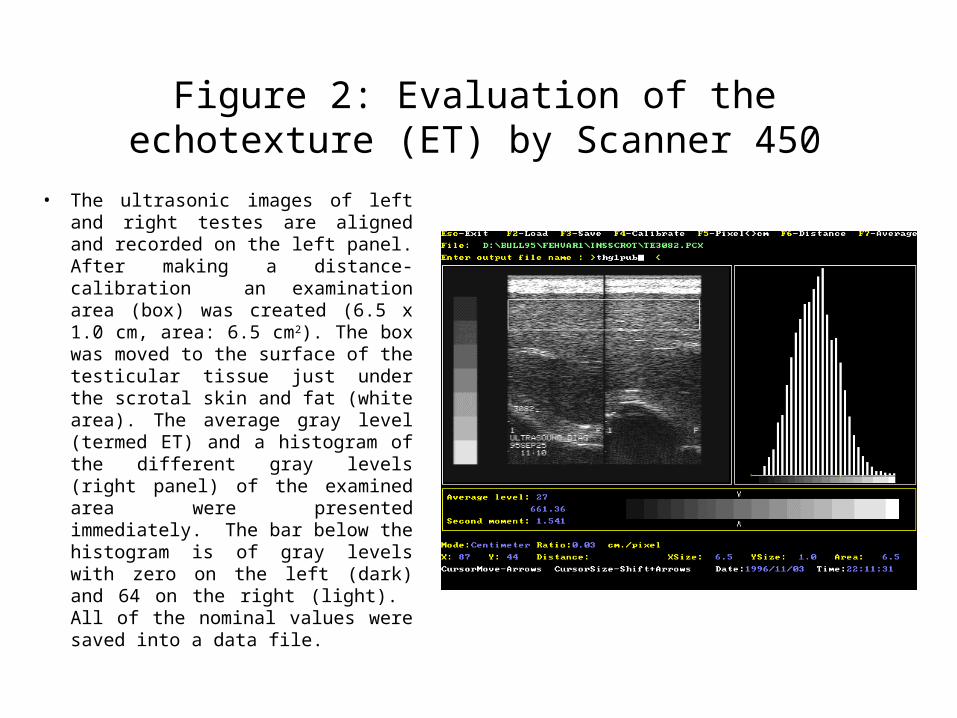
Figure 2: Evaluation of the echotexture (ET) by Scanner 450
• The ultrasonic images of left and right testes are aligned and recorded on the left panel. After making a distance-calibration an examination area (box) was created (6.5 x 1.0 cm, area: 6.5 cm2). The box was moved to the surface of the testicular tissue just under the scrotal skin and fat (white area). The average gray level (termed ET) and a histogram of the different gray levels (right panel) of the examined area were presented immediately. The bar below the histogram is of gray levels with zero on the left (dark) and 64 on the right (light). All of the nominal values were saved into a data file.
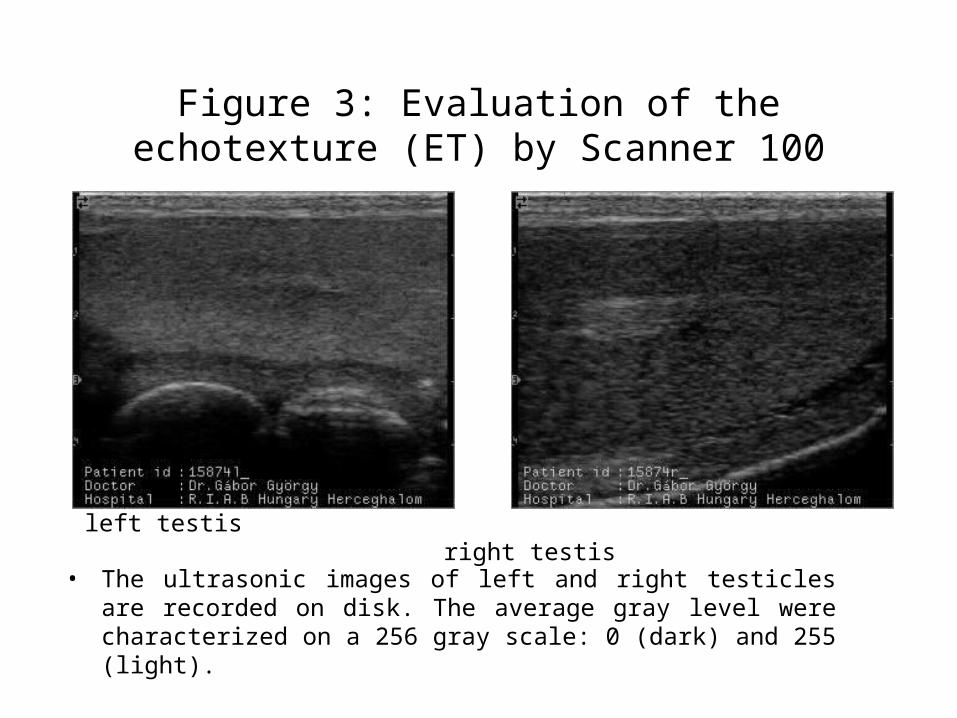
Figure 3: Evaluation of the echotexture (ET) by Scanner 100
• The ultrasonic images of left and right testicles are recorded on disk. The average gray level were characterized on a 256 gray scale: 0 (dark) and 255 (light).
left testis right testis
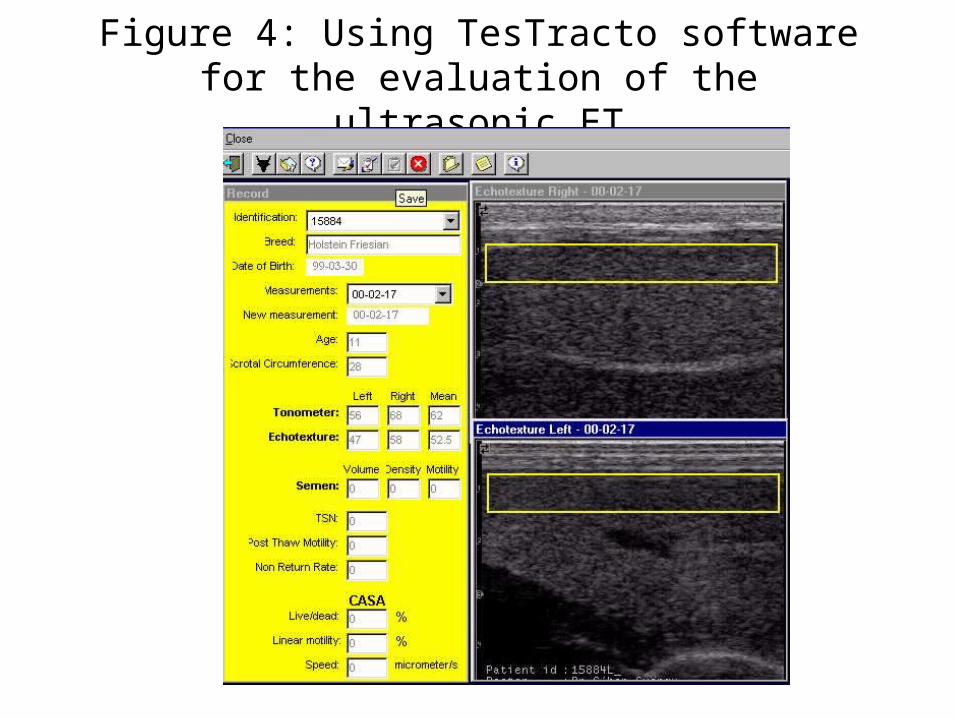
Figure 4: Using TesTracto software for the evaluation of the ultrasonic ET
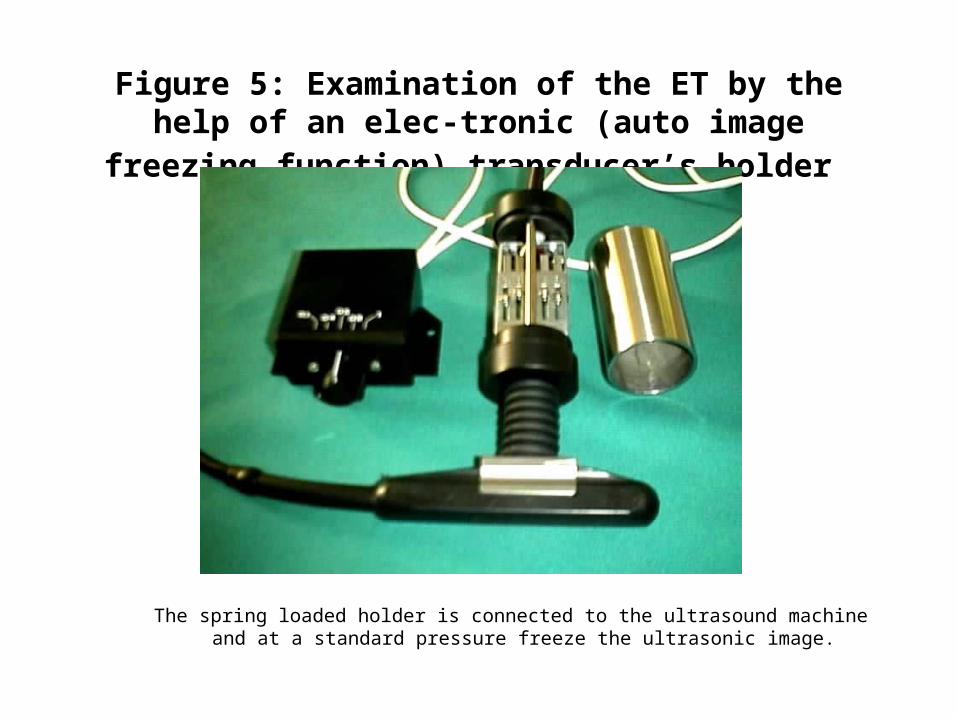
Figure 5: Examination of the ET by the help of an elec-tronic (auto image freezing function) transducer’s holder
The spring loaded holder is connected to the ultrasound machine and at a standard pressure freeze the ultrasonic image.
Semen Examination
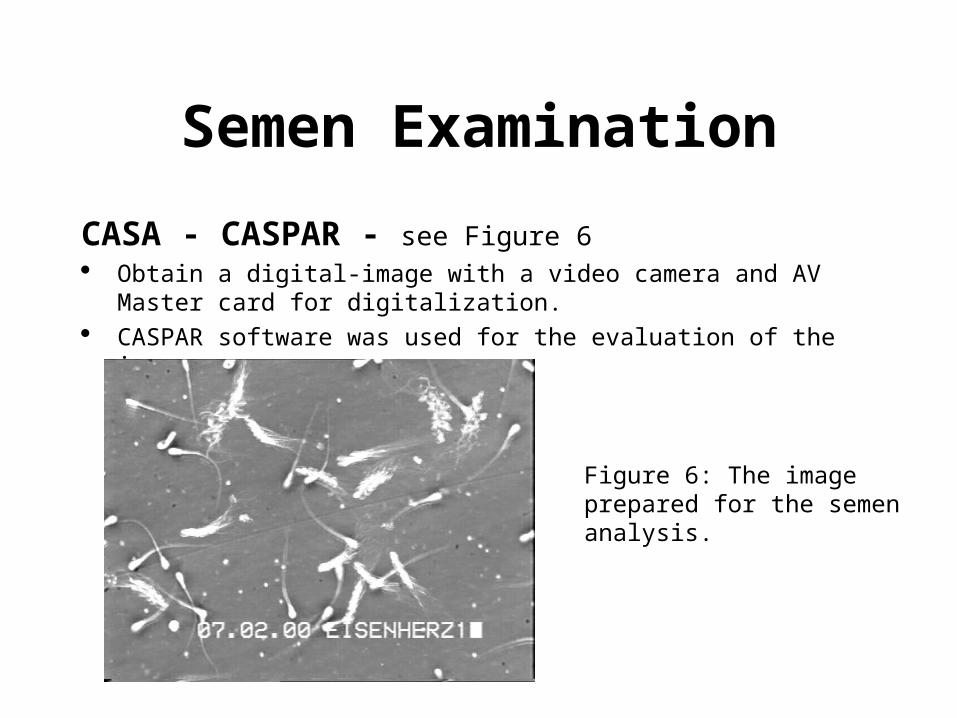
CASA - CASPAR - see Figure 6 Obtain a digital-image with a video camera and AV Master card for
digitalization. CASPAR software was used for the evaluation of the images.
Figure 6: The image prepared for the semen analysis.
RESULTS
• Data of the examinations are presented in Table 1.
• Results of the statistical analysis are presented in Table 2.
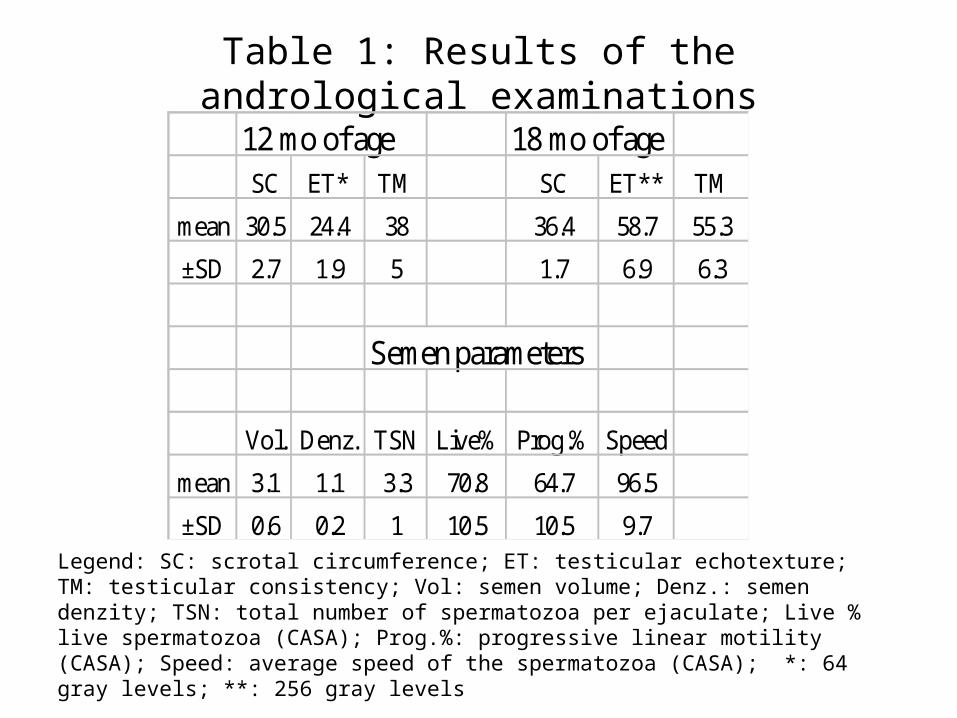
Table 1: Results of the andrological examinations
Legend: SC: scrotal circumference; ET: testicular echotexture; TM: testicular consistency; Vol: semen volume; Denz.: semen denzity; TSN: total number of spermatozoa per ejaculate; Live % live spermatozoa (CASA); Prog.%: progressive linear motility (CASA); Speed: average speed of the spermatozoa (CASA); *: 64 gray levels; **: 256 gray levels
12 mo of age 18 mo of ageSC ET* TM SC ET** TM
mean 30.5 24.4 38 36.4 58.7 55.3
±SD 2.7 1.9 5 1.7 6.9 6.3
Semen parameters
Vol. Denz. TSN Live% Prog.% Speed
mean 3.1 1.1 3.3 70.8 64.7 96.5
±SD 0.6 0.2 1 10.5 10.5 9.7
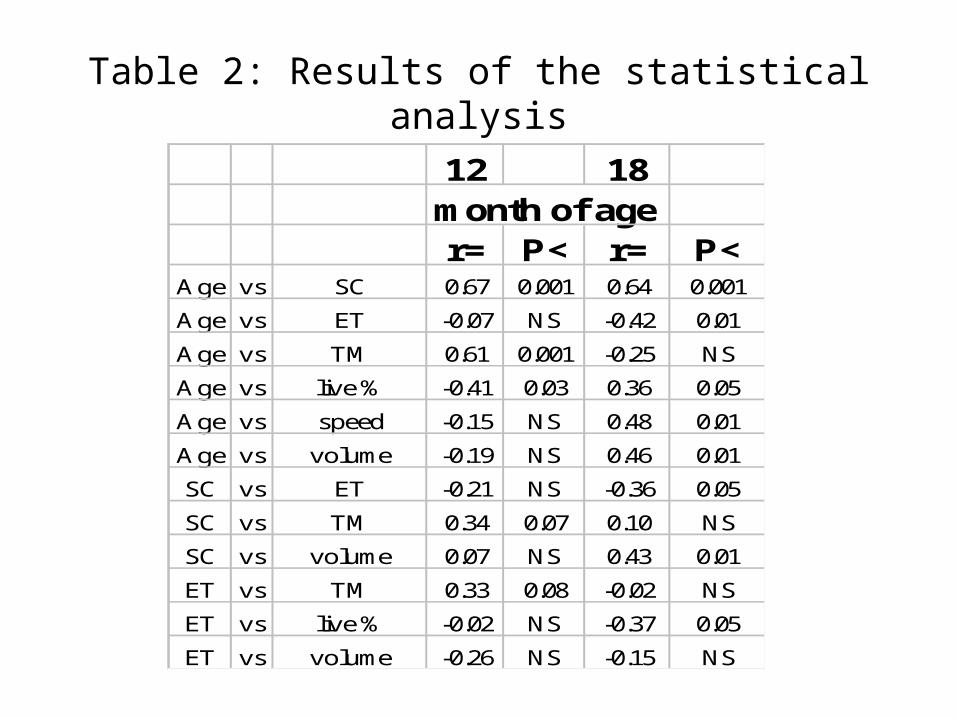
Table 2: Results of the statistical analysis
12 18month of ager= P< r= P<
Age vs SC 0.67 0.001 0.64 0.001
Age vs ET -0.07 NS -0.42 0.01
Age vs TM 0.61 0.001 -0.25 NS
Age vs live % -0.41 0.03 0.36 0.05
Age vs speed -0.15 NS 0.48 0.01
Age vs volume -0.19 NS 0.46 0.01
SC vs ET -0.21 NS -0.36 0.05
SC vs TM 0.34 0.07 0.10 NS
SC vs volume 0.07 NS 0.43 0.01
ET vs TM 0.33 0.08 -0.02 NS
ET vs live % -0.02 NS -0.37 0.05
ET vs volume -0.26 NS -0.15 NS
DISCUSSIONIn older age of bulls, expected to have bigger SC (age vs. SC
r=0.67 and 0.64; P<0.001) and greater seminiferous tubule
activity, have a lower ET (age vs. ET: r=-0.07 and r=-0.43;
P<0.01). Lower ET suggests a greater seminiferous tubule
lumenal space and fluid content within testicular parenchyma,
and higher level of the spermatozoa production (age vs. TSN:
r=0.39; P<0.05). At 12 mo of age TM positively correlated with
the age (r=0.62; P<0.001), and negatively by the TSN (r=-0.45;
P<0.01). Also negative correlation were found between ET and
live percentage of spermatozoa at 18 mo of age (r=-0.37;
P<0.05). ET at 12 mo of age predicted the SC at 18 mo of age
(r=-0.48; P<0.01), and positively correlated the mean ET
(r=0.36; P<0.05).
CONCLUSIONS
• These results suggest that there are associations among the ET, TM and semen characteristics. ET, SC and TM may be used to predict semen production in young bulls.


