45
I 1 I Ageas in Asia AGEAS INVESTOR DAY 6 TH OF JUNE 2017 I LISBON PORTUGAL

I 1 I
Ageas in AsiaAG E AS I N V ESTO R DAY 6 T H O F J U N E 2017 I L IS BO N PO RTUGA L

I 2 I
Agenda• Ageas in Asia
• The story of China
• Additional financial disclosures
• Conclusion

I 3 I
Ageas in Asia
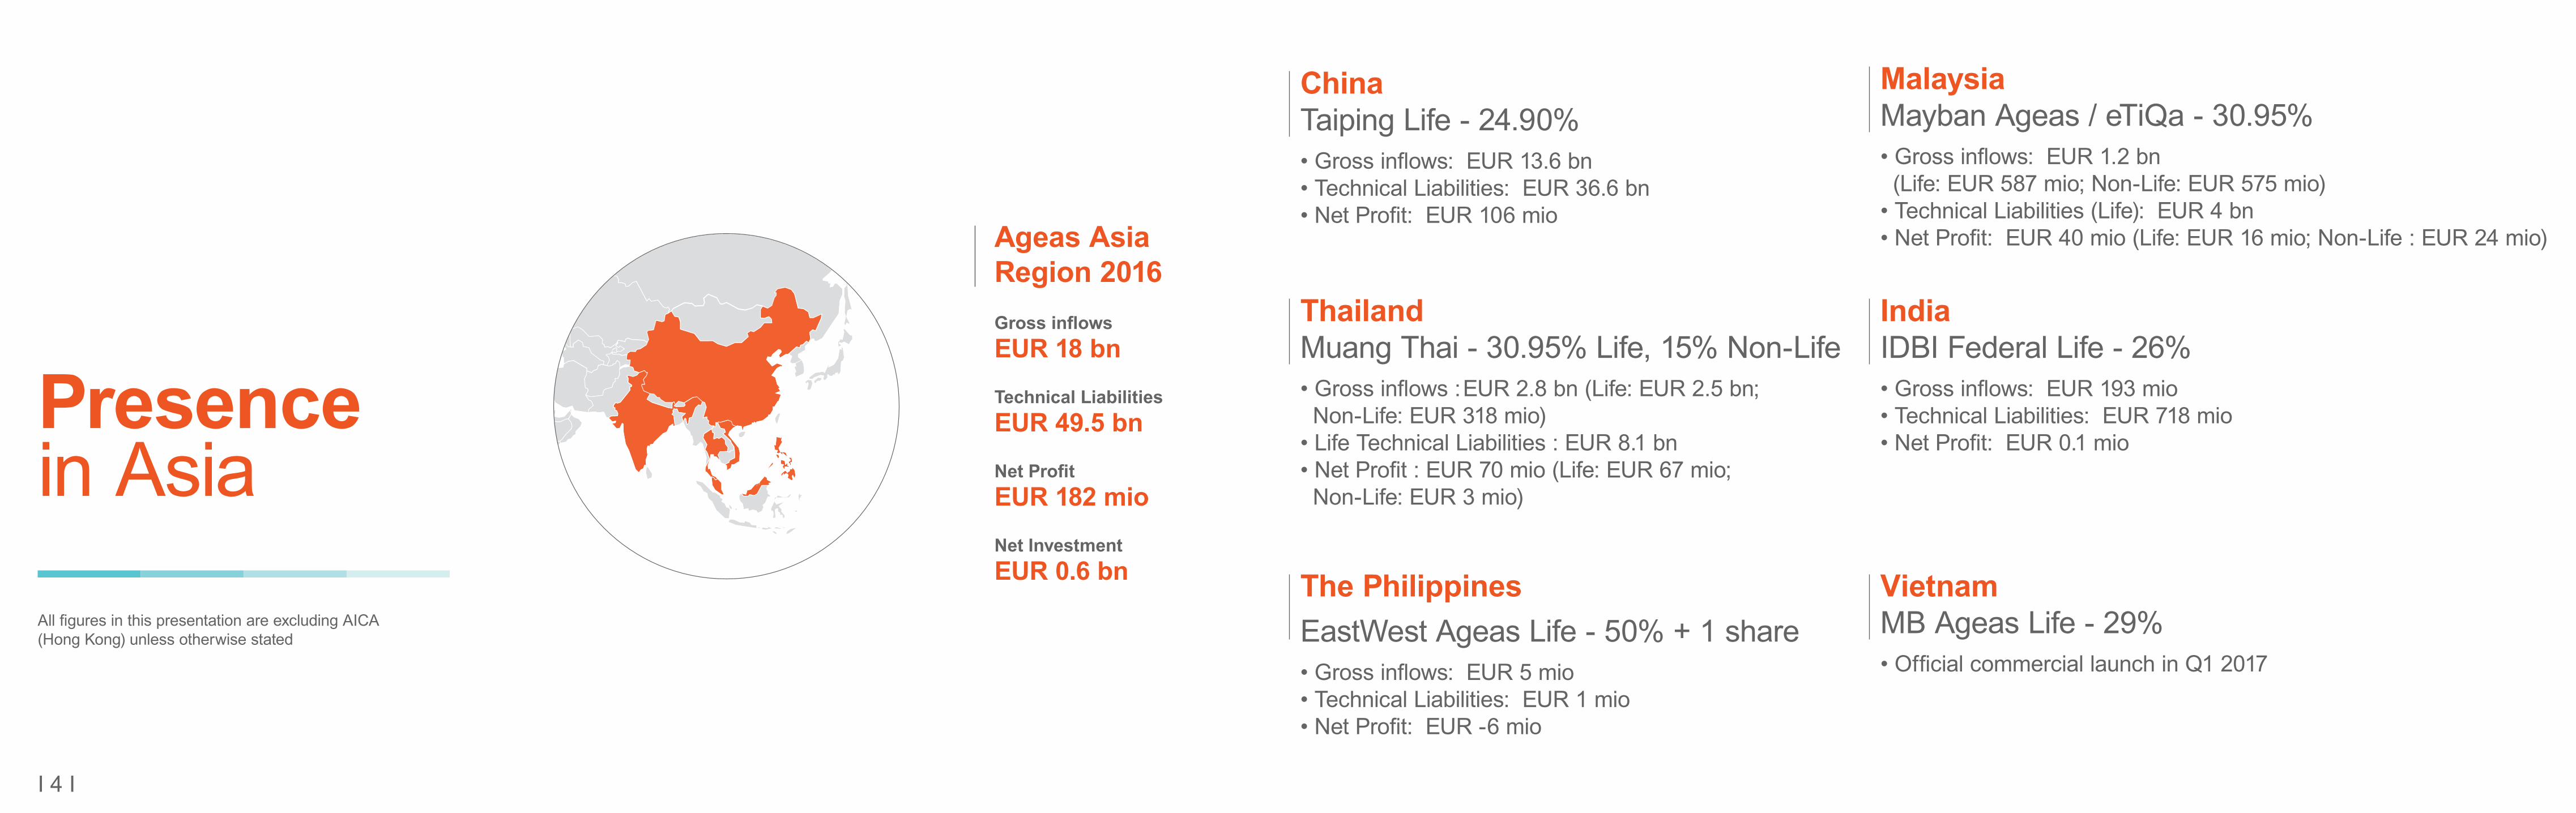
Ageas Asia Region 2016Gross inflows EUR 18 bn
Technical LiabilitiesEUR 49.5 bn
Net ProfitEUR 182 mio
Net InvestmentEUR 0.6 bn
I 4 I
Presencein Asia
IndiaIDBI Federal Life - 26%• Gross inflows: EUR 193 mio• Technical Liabilities: EUR 718 mio • Net Profit: EUR 0.1 mio
ChinaTaiping Life - 24.90%• Gross inflows: EUR 13.6 bn• Technical Liabilities: EUR 36.6 bn • Net Profit: EUR 106 mio
Thailand Muang Thai - 30.95% Life, 15% Non-Life• Gross inflows : EUR 2.8 bn (Life: EUR 2.5 bn; Non-Life: EUR 318 mio)• Life Technical Liabilities : EUR 8.1 bn• Net Profit : EUR 70 mio (Life: EUR 67 mio; Non-Life: EUR 3 mio)
The Philippines EastWest Ageas Life - 50% + 1 share • Gross inflows: EUR 5 mio• Technical Liabilities: EUR 1 mio• Net Profit: EUR -6 mio
Vietnam MB Ageas Life - 29%• Official commercial launch in Q1 2017
Malaysia Mayban Ageas / eTiQa - 30.95%• Gross inflows: EUR 1.2 bn (Life: EUR 587 mio; Non-Life: EUR 575 mio)• Technical Liabilities (Life): EUR 4 bn• Net Profit: EUR 40 mio (Life: EUR 16 mio; Non-Life : EUR 24 mio)
All figures in this presentation are excluding AICA (Hong Kong) unless otherwise stated

Net proceeds from Asia to Ageas Group of EUR 101 mio since 2001in EUR mio
I 5 I
Capital invested vs. dividend/divestment upstream
0
(500)
(1,000)
(1,500)
500
1,000
1,500
(204)
(203) (203) (216)
(310) (361) (375)
(1,054) (1,043) (1,053) (1,024)(1,133) (1,124)
(1,274)(1,138) (1,125)
0 0 0 0 0 1 1 1
(3) (48) (25) (2) (3) (30)(84)(119)
(203)
15 38 54 10 11 52139
43
1,310
(13)(94) (52) (15)
(680)
CapitalDividend/DivestmentCumulative cash flow
2001 2002 2003 2004 2005 2006 2007 2008 2009 2010 2011 2012 2013 2014 2015 2016

Life insurance penetration (premiums as % of GDP) and density (premiums per capita) 2015
I 6 I
Why Asia? Well positioned in World’s Key Growth Markets
0%
5%
10%
15%
20%
0
1,000
2,000
3,000
4,000
5,000
6,000 (US$)
Taiw
an HK
Japa
n
UK
S K
orea
Fran
ce
Sing
apor
e
Thai
land
Aust
ralia
Mal
aysi
a
USA
Gem
any
Indi
a
Chi
na
Philip
pine
s
Indo
nesi
a
Vie
tnam
PenetrationWorld average penetrationDensity
Sources: China State Council, IMF, World Bank, ACLI, A.M. Best, McKinsey, Swiss Re, and Company estimates

I 7 I
Why Asia? Well positioned in World’s Key Growth Markets
China Potential and U.S Historical Penetration Rates
Compounding GrowthGrowing GDP and Penetration
1930 1938 1993
5 years
10 years
20150%
2%
7%
US 50+ years
2030 ChinaPotential
US HistoricalPenetration
PenetrationRate
2020 ChinaTarget
2015 China
$10,000 $30,000 $50,0000%
2% Asia Life Potential = $10trn7x the G7 today
7%
ThailandMalaysia
ChinaIndia
IndonesiaPhilippines
= $1 trillion premium
GDP/Capita2015
PenetrationRate
G7
Sources: China State Council, IMF, World Bank, ACLI, A.M. Best, McKinsey, Swiss Re, and Company estimates
I 8 I
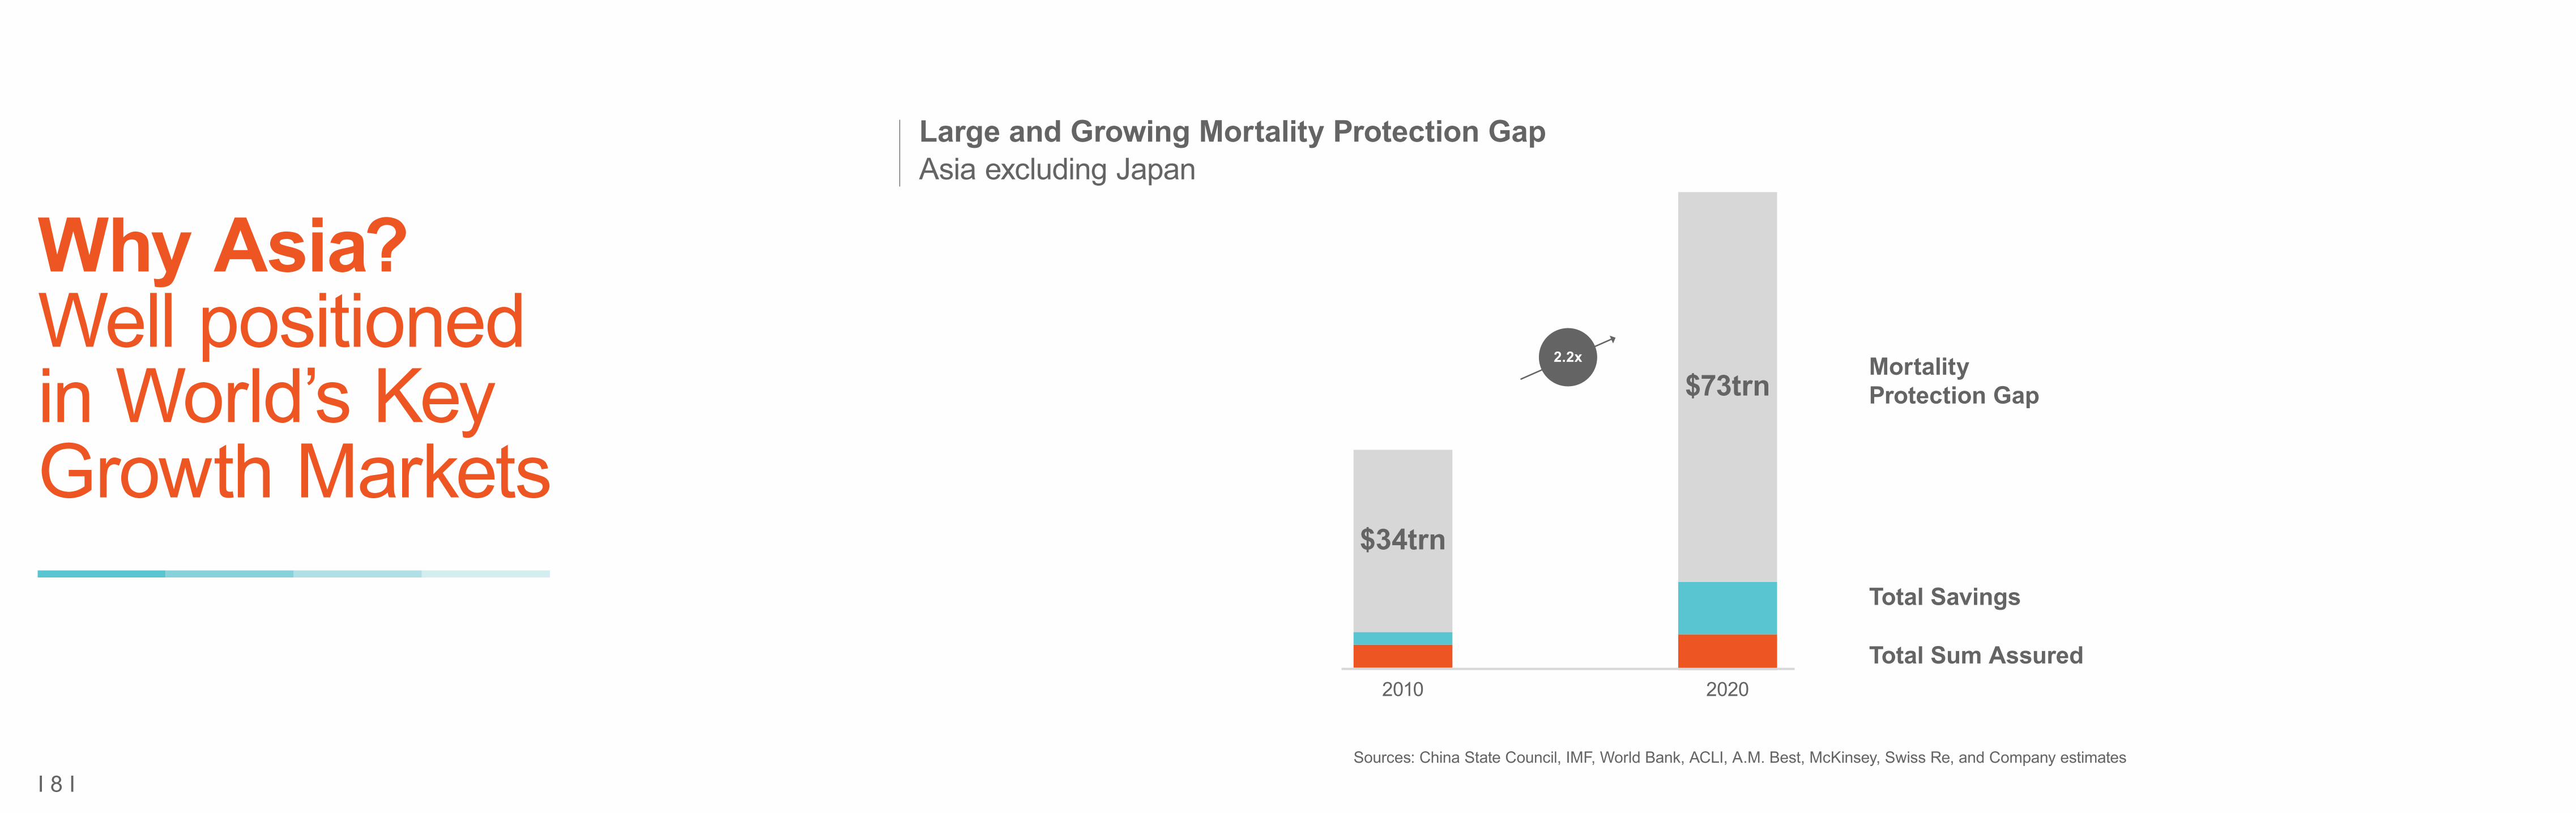
$73trn
$34trn
2010 2020
MortalityProtection Gap
Total Savings
Total Sum Assured
2.2x
Large and Growing Mortality Protection GapAsia excluding Japan
Why Asia? Well positioned in World’s Key Growth Markets
Sources: China State Council, IMF, World Bank, ACLI, A.M. Best, McKinsey, Swiss Re, and Company estimates
I 9 I
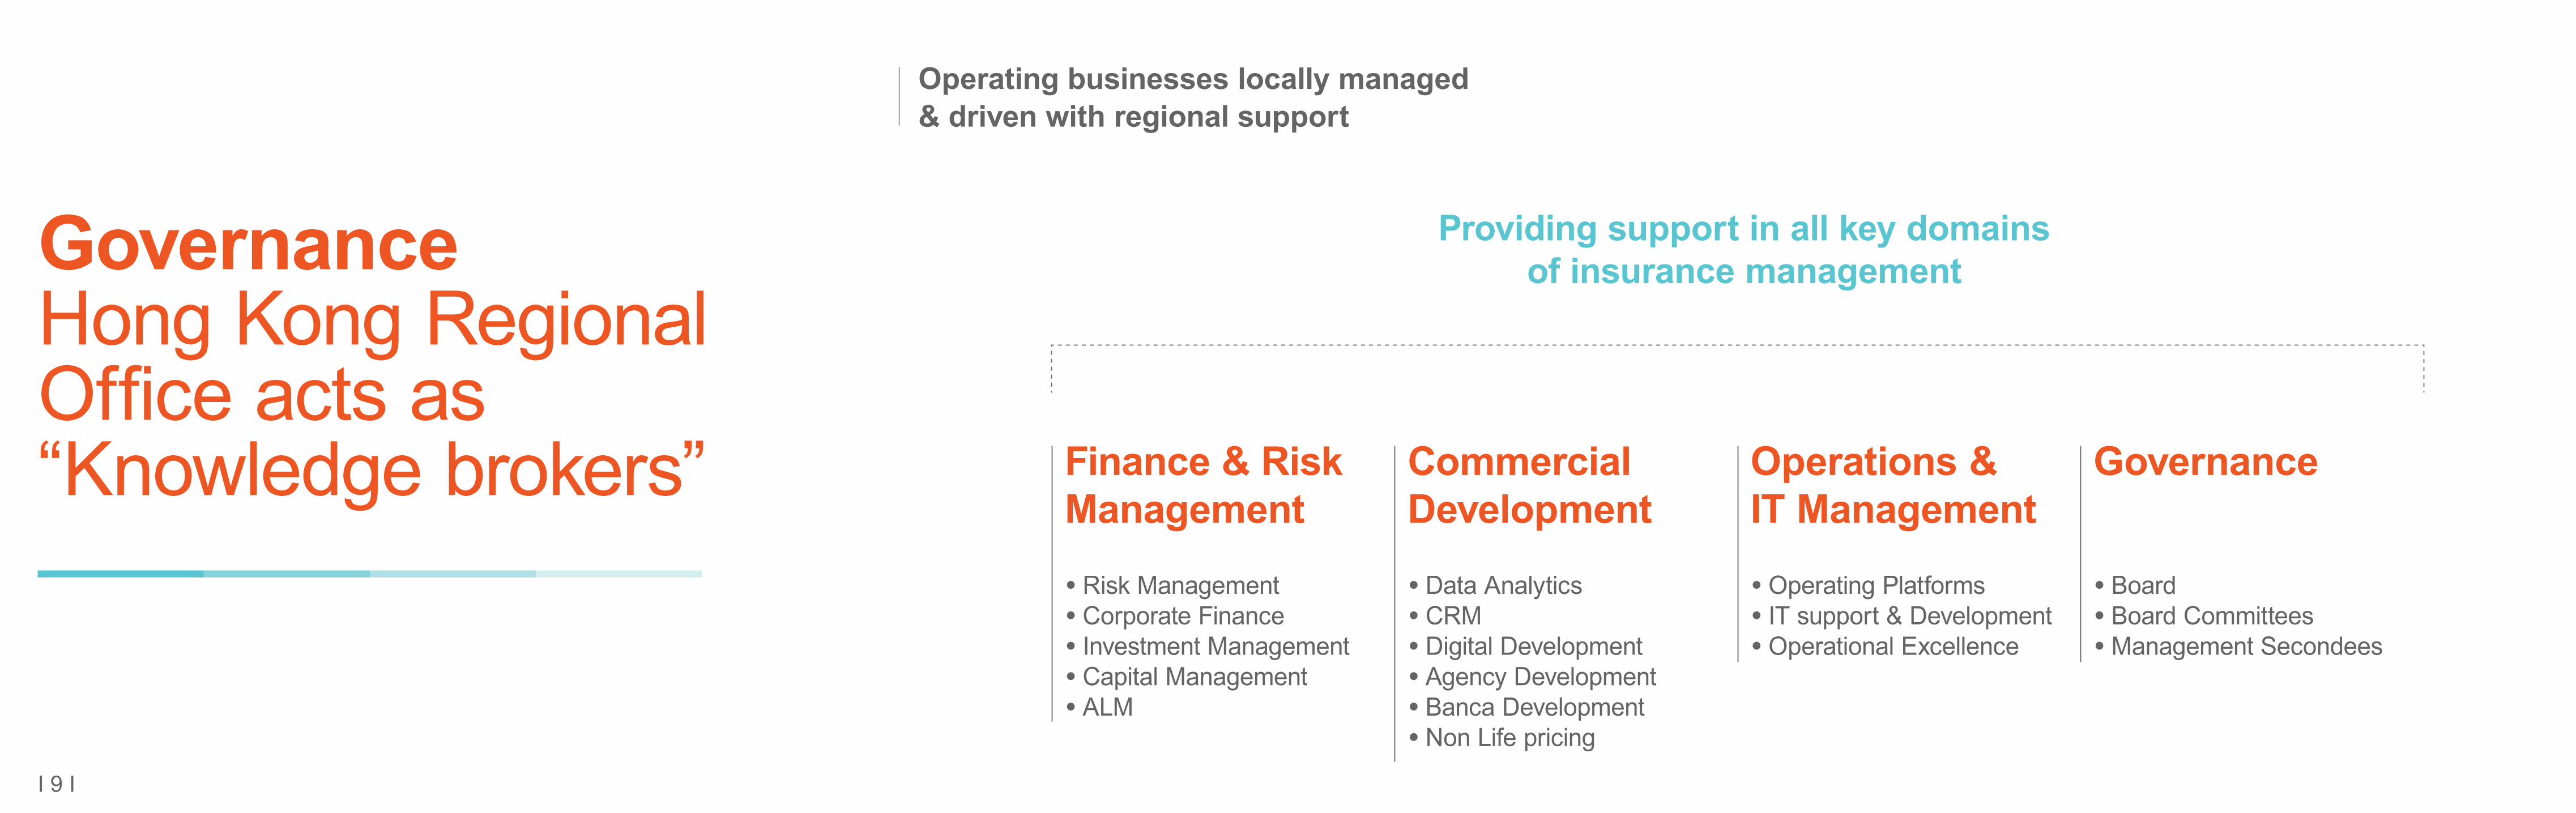
Governance Hong Kong Regional Office acts as “Knowledge brokers”
Operating businesses locally managed & driven with regional support
Finance & Risk Management
Commercial Development
Operations & IT Management
Governance
• Risk Management• Corporate Finance• Investment Management• Capital Management• ALM
• Data Analytics• CRM• Digital Development• Agency Development• Banca Development• Non Life pricing
• Operating Platforms• IT support & Development• Operational Excellence
• Board • Board Committees• Management Secondees
Providing support in all key domains of insurance management
I 10 I
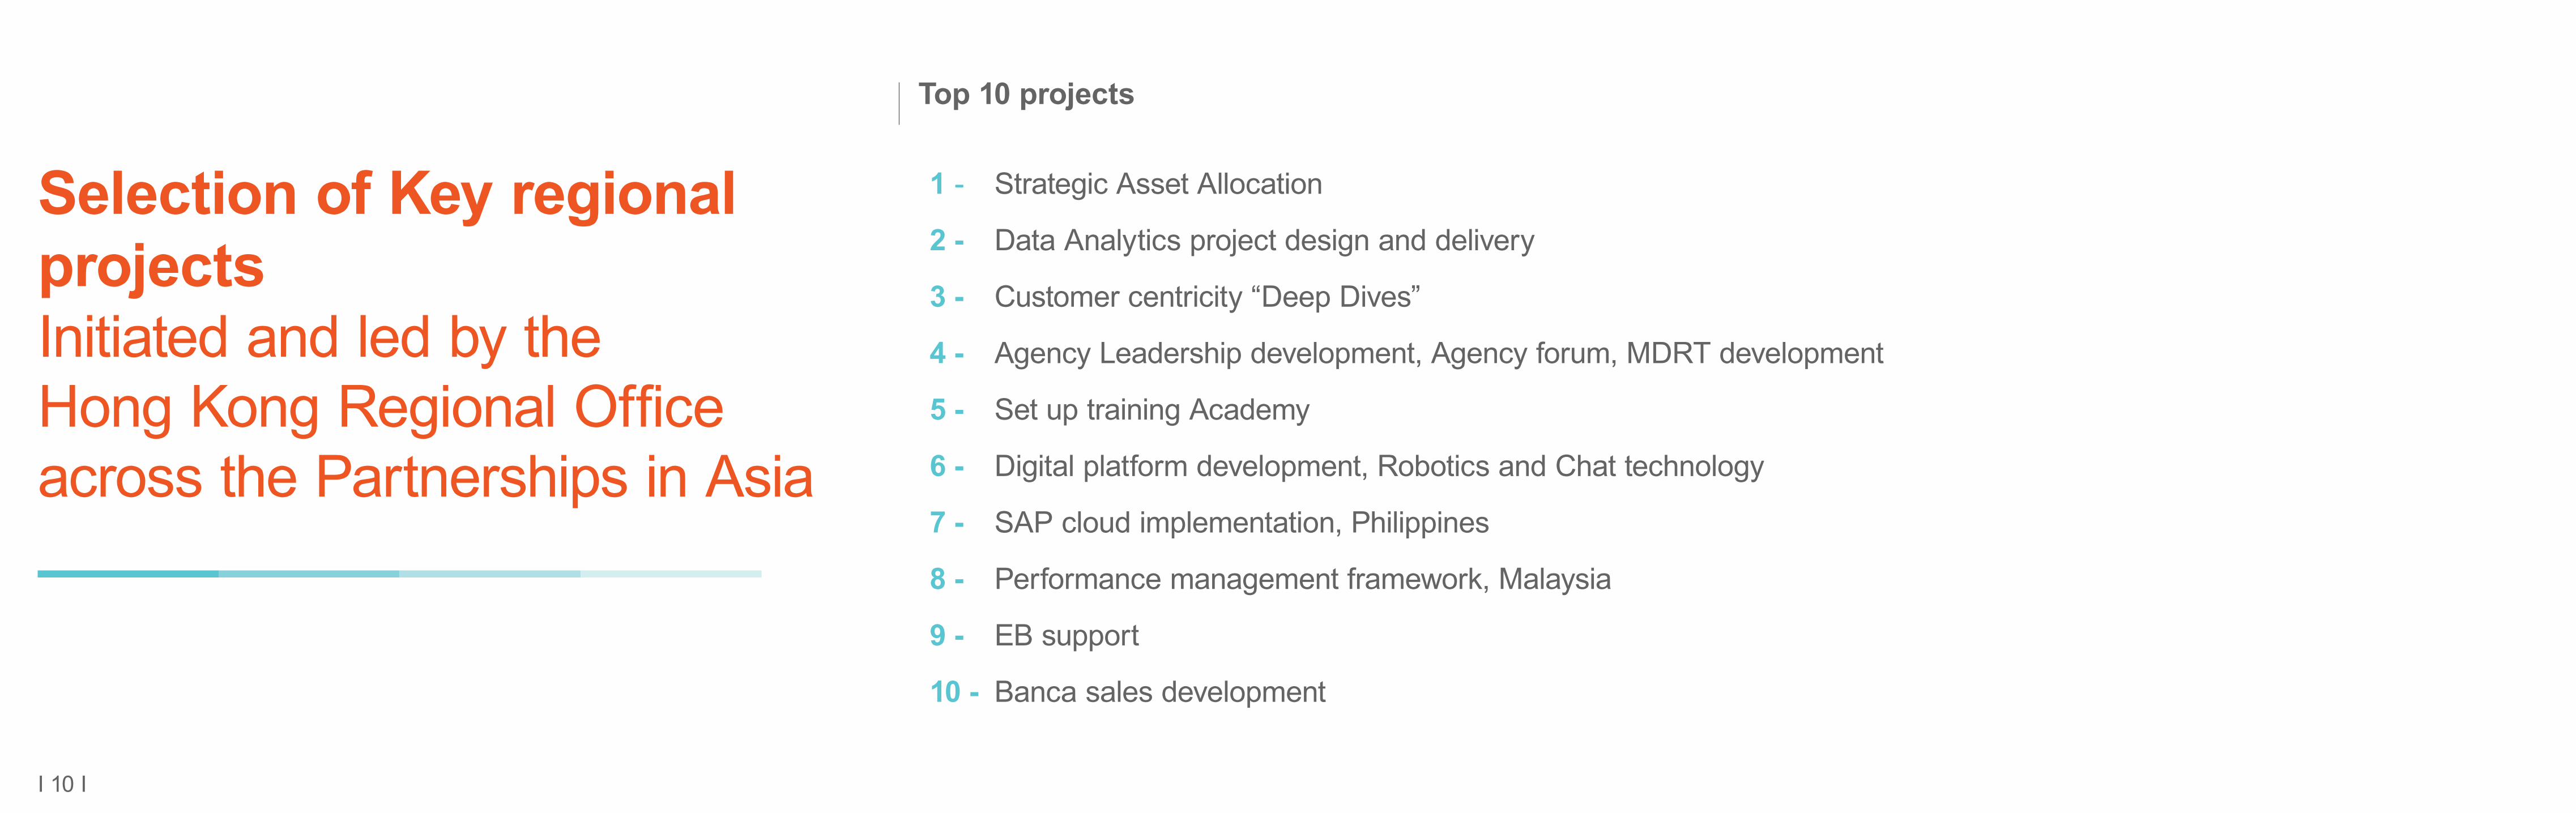
Selection of Key regional projects Initiated and led by the Hong Kong Regional Office across the Partnerships in Asia
1 - Strategic Asset Allocation
2 - Data Analytics project design and delivery
3 - Customer centricity “Deep Dives”
4 - Agency Leadership development, Agency forum, MDRT development
5 - Set up training Academy
6 - Digital platform development, Robotics and Chat technology
7 - SAP cloud implementation, Philippines
8 - Performance management framework, Malaysia
9 - EB support
10 - Banca sales development
Top 10 projects

I 11 I
Governance Ageas Management Positions in Asia JV’s
Actuarial domain
Risk Management
CFO/CIO Domain
Marketing & Sales
IT & OPS
Other
ChinaAppointed Actuary, TPL
Assistant GM & CRO, TPAM
Deputy CFO, TPL
Deputy GM, TPSSC
Representative Office, Chief Rep acts as senior country officer
Malaysia
Chief Risk OfficerOperation Risk Officer
Chief Marketing OfficerHead of Banca Development
Head of Operational Transformation
ThailandAppointed Actuary
Deputy CFO/CIO
Chief Bancassurance
VietnamAppointed Actuary (Combined CRO)
See above
Chief Financial Officer
Director of Bancassurance
Chief Operations Officer
PhilippinesAppointed Actuary (combined CRO)
see above
Chief Financial Officer
Chief Operations OfficerChief Technology Officer
Chief Executive Officer
IndiaConsulting Actuary
Consulting Distribution Team
Active Ageas Management Participation @ Country Level
Selected Ageas secondees to Opcos who are also members of the local management committee

I 12 I
Ageas AsiaAgeas well represented in local boards Proportional representation in all main Boards
Reserved matters protection in all partnerships at key levels
Membership in all key committees, including Risk, Audit, Investment and Nomination where applicable
IndiaIDBI Federal Life - 26%• 2 Board members including the Chairman• Present in all committees
Thailand Muang Thai - 30.95% Life, 15% Non-Life• Board participation: Muang Thai Group Holding;
Muang Thai Holding; Muang Thai Life and Muang Thai Insurance
• Present in all committees except Audit in MTI (regulatory issue)
• Memberships in all Operating Company Executive Committees
The Philippines EastWest Ageas Life - 50% + 1 share • Appointed the CEO• 3 Board members including chairman• Present in all committees• Memberships in the Management Committee
Vietnam MB Ageas Life - 29%• 1 Board member along with one member from
Muang Thai• Present in all committees• Membership in the Executive Committee
Malaysia Mayban Ageas / eTiQa - 30.95%• Board memberships on all Boards including Singapore• Present in all committees except Audit in Singapore• Memberships in the Senior Management Committees
Governance Board Participation across Asia
ChinaTaiping Life - 24.90%• 3 Board members plus 1 Supervisor at TPL• Board memberships at TPAM and TPeC• Present in all committees• Memberships in the Executive Committees of TPL and
TPAM

I 13 I
Performance overviewInflows
2011
2011
2016
2016
5.2
1,129
3,351
0.6 0.9
16.9
CAGR (Life) + 27%
CAGR (Non-Life)
+ 8%
CAGR + 24%
Evolution Gross Inflows in EUR bn
Life inflows by nature
APEin EUR mio
30%
19%
51% 2011
22%
23%
55% 2016
Single Regular Renewal
Non-Life Single Premium Regular PremiumRenewal Premium

I 14 I
Performance overviewLife Inflows
Gross Inflowsin EUR bn
Gross Inflows by distribution channel
2011 2016
CAGR + 27%
5.2
16.9
3.6
13.6
0.6
0.62.5
0.9
• Balanced channels, broad customer access
• Total agency force: over 350,000 agents across five countries
• Bank branch network: present in more than 37,000 branches
• More than 20 mio customers across markets
Unit Linked Risk ParNon Par
BancaAgency BrokersOthers
Gross Inflows by product
7% 2%
20%
44%53%
37%
36%
1%
2016 2016
IndiaThailandMalaysiaChina
0.1
0.2

I 15 I
Performance overviewNon-Life Inflows
Gross Inflowsin EUR mio
• Balanced mix of lines and channels
• Competence based underwriting
• “Control” based retention
• Alignment of interest with the channel
2011 2016
CAGR + 8%
129
318
478575
607
893
Gross Inflows by distribution channel
Net earned premium by product
2016 2016
MotorFire Marine, Aviation & TransportationOther
BancaAgency BrokersOthers
46%
20%
24%
36%
20%
12%
18%
24%
ThailandMalaysia
I 16 I
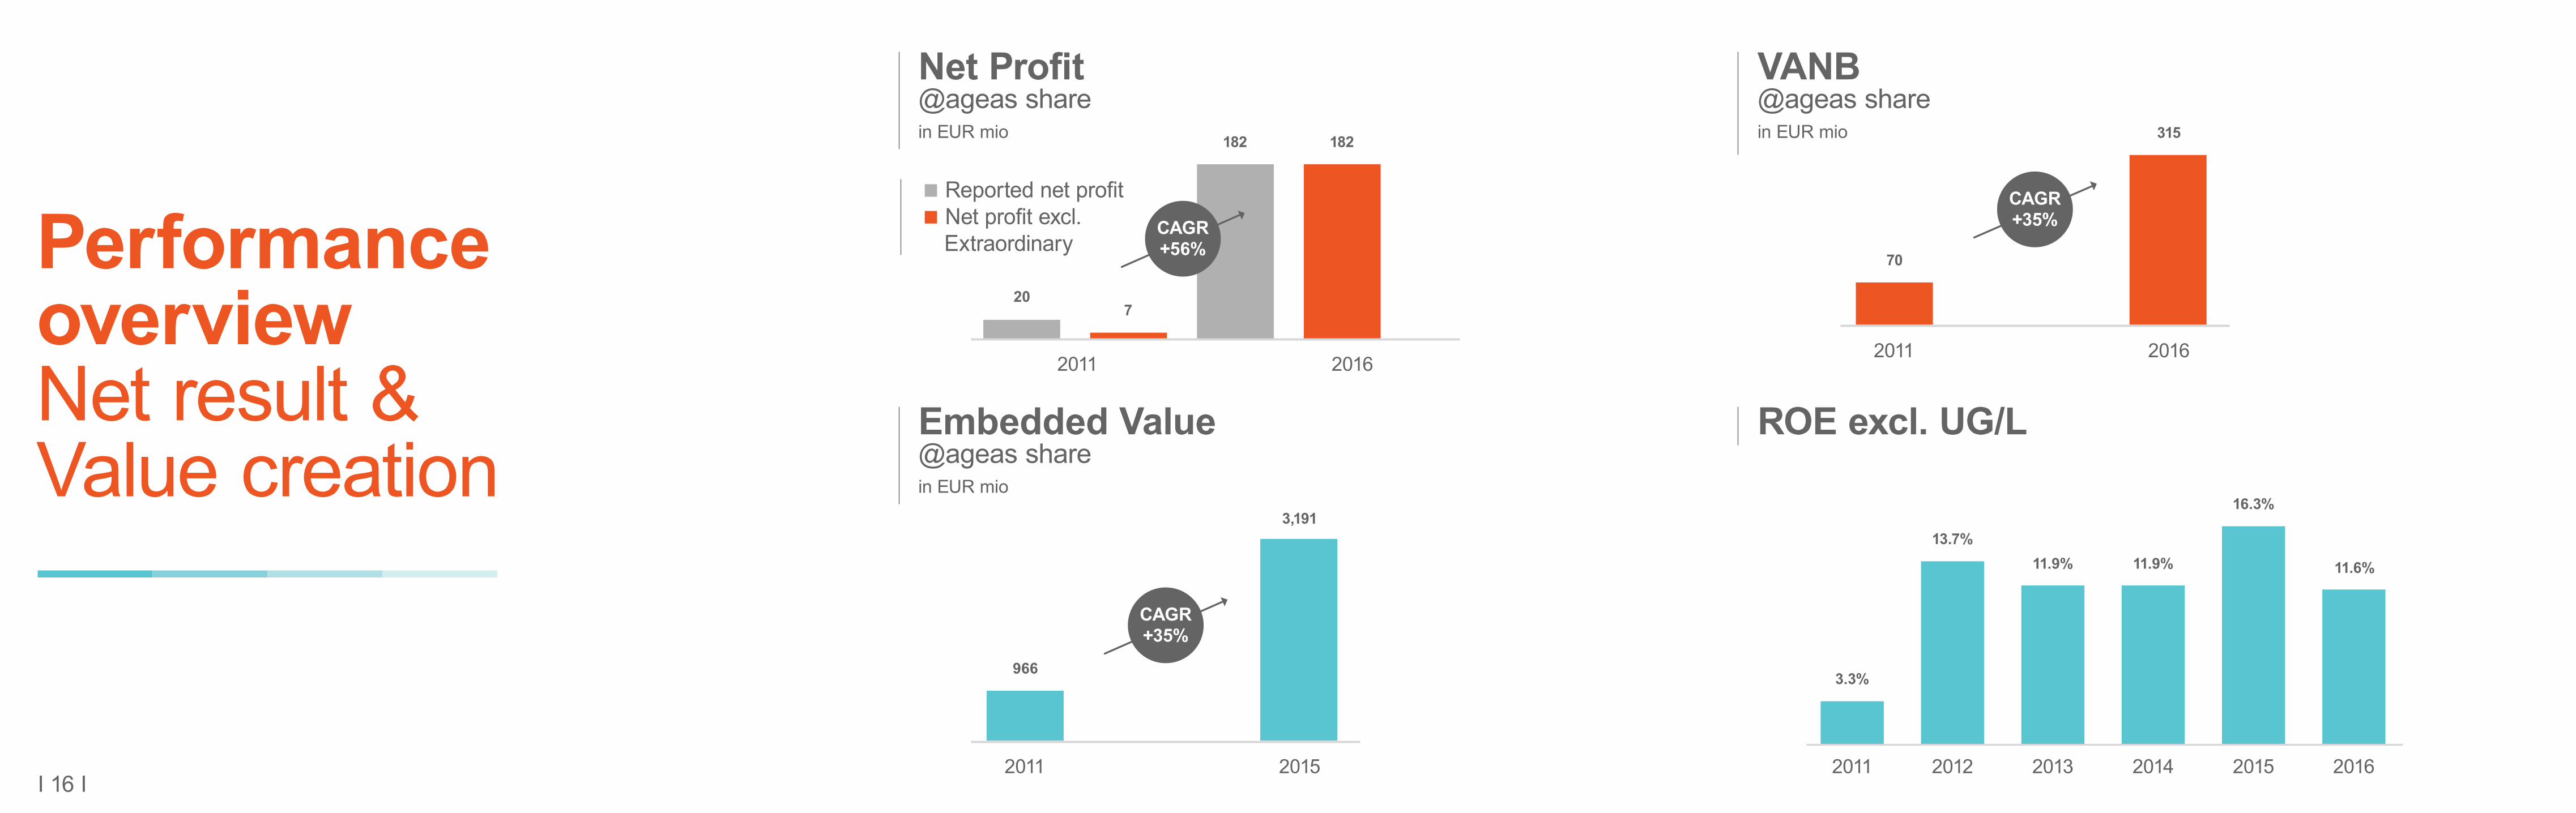
Performance overviewNet result & Value creation
Net Profit @ageas sharein EUR mio
VANB@ageas sharein EUR mio
Embedded Value@ageas sharein EUR mio
ROE excl. UG/L2011 2016
CAGR +56%
CAGR +35%
CAGR +35%
207
182 182
3,191
315
966
70
3.3%
13.7%11.9% 11.9%
16.3%
11.6%
2011 2011 2012 2013 2014 2015 2016
2011
2015
2016
Reported net profitNet profit excl. Extraordinary

I 17 I
Performance overviewOther
Technical Liabilities@ageas sharein EUR mio
2011 2016
5,139
13,078
630
CAGR +21%(at 100% FUM)
Shareholder's Equity excl. UG/L@ageas sharein EUR mio
Investment portfolio Solvency
CAGR +32%
2011 2012 2013 2014 2015 2016
2011 2016
1,728
2016 76%
11%
4%9%
Fixed IncomeEquity Real EstateCash & cash equivalents
237% 247% 253%288%
261% 266%

I 18 I
Performance overviewOperating performance
Non-LifeCombined ratio
LifeCost ratio
LifeProductivity improvements2016 vs. 2015
36.0%
34.6%
66.0%50.5%
2011 20112016 2016
SumAssured
Opex expense
FuM
-7%
50.8% 102.0%
85.1%
3.7%
2.6%
17.7%
ExpensesClaims

I 19 I
The story of China

I 20 I
Focus on sustainable growth
Gross Inflows @100%
EUR 13.6 bnincrease by 283%
Major goals to achieve:• Balance in value and size• Excellent business quality• Efficient resource allocation • Build up quality staff and agents
Total Invested Assets @100%
EUR 42 bnincrease by 178%
Net profit @ageas share
EUR 106 mioincrease by 128%
Number of agents 253,780increase by 451%
Challenge to “double Taiping Life” successfully achieved
Taiping Life new objective: focus on sustainable, profitable growth and building value
“To build Taiping Life into a boutique insurance company with uniqueness and potential”

I 21 I
1,881
683988
2,682
7301,154
3,215
1,028
2,153
4,003
1,580
2,594
6,579
2,309
3,078
7,330
3,050
3,230
2011 2012 20122013 20132014 20142015 20152016 2016
3,5524,566
6,396
8,177
11,966
13,610
China InflowsBusiness Mix
VANB
The results
RenewalRegularSingle
Market ShareVANB
0.0%00
2,000
4,000
6,000
8,000
10,000
12,000
14,000
16,000
1.0%200
2.0%400
3.0%
27%
600
4.0%
35%
800
5.0%31% 1,000
6.0%
31%
CAGR
1,200
Banca Single Premiums downEUR 2.65 bn to EUR 2.5 bn

I 22 I
Strong commercial power
Agency numbers have grown from 133K at YE 2014 to +/- 254K at YE 2016
13-month persistency in the channel improved from 92% to 95%
Productivity consistent through same period
ChinaLife
PingAn
CPIC NewChinaLife
ChinaTaiping
PICCLife
PICCHealth
3,809 3,837
3,454
2,593
3,456
2,333
1,434
2,000
4,000
0,000
Chinese insurersAgent productivity (by VNB)
1H141H151H16
VNB/Agentmonth (RMB)

I 23 I
Additional financial disclosures

I 24 I
Currentdisclosures
Current Disclosures Region Asia Individual Country Level
Disclosure
Gross Inflow (Life & Non-Life) Q Q Press Release/Quarterly IR Presentation
Net Result* (Life & Non-Life) Q A Press Release/Quarterly IR Presentation/Annual Report
Total Income - A Annual Report
Total Expenses - A Annual Report
Net Capital Gains (Life & Non-Life) Q - Quarterly IR Presentation
Combined Ratio Q - Press Release/Quarterly IR Presentation
Dividend Upstream Semi-Annual Semi-Annual Press Release/Quarterly IR Presentation
Solvency Q - Press Release/Quarterly IR Presentation
Total Assets - A Annual Report
Total Liabilities - A Annual Report
Life Technical Liabilities Q - Press Release/Quarterly IR Presentation
Shareholder’s Equity Q A Press Release/Quarterly IR Presentation/Annual Report
* including RO costs

I 25 I
Why additional disclosures?
We think the consensus view of Ageas’ Asian operations does a large disservice to the quality, margin focus and stability of these franchises. The implied PE of the Asian operations is 8x, relative to AIA at 17x and Asia peer average at 17x.
Maybe the joint venture could make some slides that they share. The two companies could agree on the slides and then Ageas could show them. So it would be good to have one slide that just shows underwriting quality.
The key opportunity for me is that at some point the market will hopefully value the quality of the Asian franchise.
It’s very hard for investors to judge the quality of the growth in Asia. We normally would see it in the underwriting profitability, not just profitability from the investments from the securities book.

I 26 I
1 2 3 4 5 6 7 8 9 10 Analyst
Asian FV
Overview valuation Asia by analystsin EUR mio
2,759 3,678 3,315 2,573 3,217 2,366 2,477 2,389 2,759 2,214Min 2,214Max 3,678Average 2,775Median 2,666
Max-Min 1,464
50% difference in valuation by analysts

I 27 I
Improved disclosuresGeneral Guidelines
StartingPoint
LevelDisclosure
Timing ofDisclosure
LagDisclosure
As ofWhen?
Continue reporting what we already disclose
Continue respecting Partners disclosures
China & Other with certain KPI’s on individual country level
QuarterlyHalf YearFull Year
Respect of reporting deadlines & public releases of our JV’s
FY 2017

I 28 I
CurrentDisclosure
Asia & split per country on total Life and Non-Life level
ImprovedDisclosure
New Business Regular PremiumNew Business Single PremiumRenewal PremiumAPE
LevelDisclosure
Per country: China, Thailand, Malaysia, India& Other
Timing of Disclosure
Semi-Annual1 Quarter Delay
Improved disclosuresGross inflows

I 29 I
ImprovedDisclosuresNew Business Single Premium
ImprovedDisclosure
• Per country: China, Thailand, Malaysia & India• Semi-Annual• 1 Quarter Delay
2011 2012 2013 2014 2015 2016
366183
988
500
233
1,154
312
279
2,153
264303
2,594
224307
3,078
180279
3,230
Life New BusinessSingle Premium @100%in EUR mio
IndiaMalaysiaThailand China
1,599
1,896
2,754
3,165
3,660 3,736
21
9
10
5
50 47
CAGR
+19%

I 30 I
ImprovedDisclosuresNew Business Regular Premium
ImprovedDisclosure
• Per country: China, Thailand, Malaysia & India• Semi-Annual• 1 Quarter Delay
Life New BusinessRegular Premium @100% in EUR mio
IndiaMalaysiaThailand China
2011 2012 2013 2014 2015 2016
214
683
310
730
398
1,028
515
1,580
690
2,309
587
3,050972
1,123
1,508
2,200
3,118
3,799
4447
47
69
78
111
3236
36
36
40
46
CAGR
+31%

I 31 I
ImprovedDisclosuresRenewal Premium
ImprovedDisclosure
• Per country: China, Thailand, Malaysia & India• Semi-Annual• 1 Quarter Delay
Life Renewal Premium @100%in EUR mio
IndiaMalaysiaThailand China
2011 2012 2013 2014 2015 2016
510
1,881
681
2,682
799
3,215
926
4,003
1,313
6,579
1,619
7,330
212
239234
235
268
296
63
6462
68
89
100
2,666
3,6664,310
5,232
8,250
9,345
CAGR
+29%
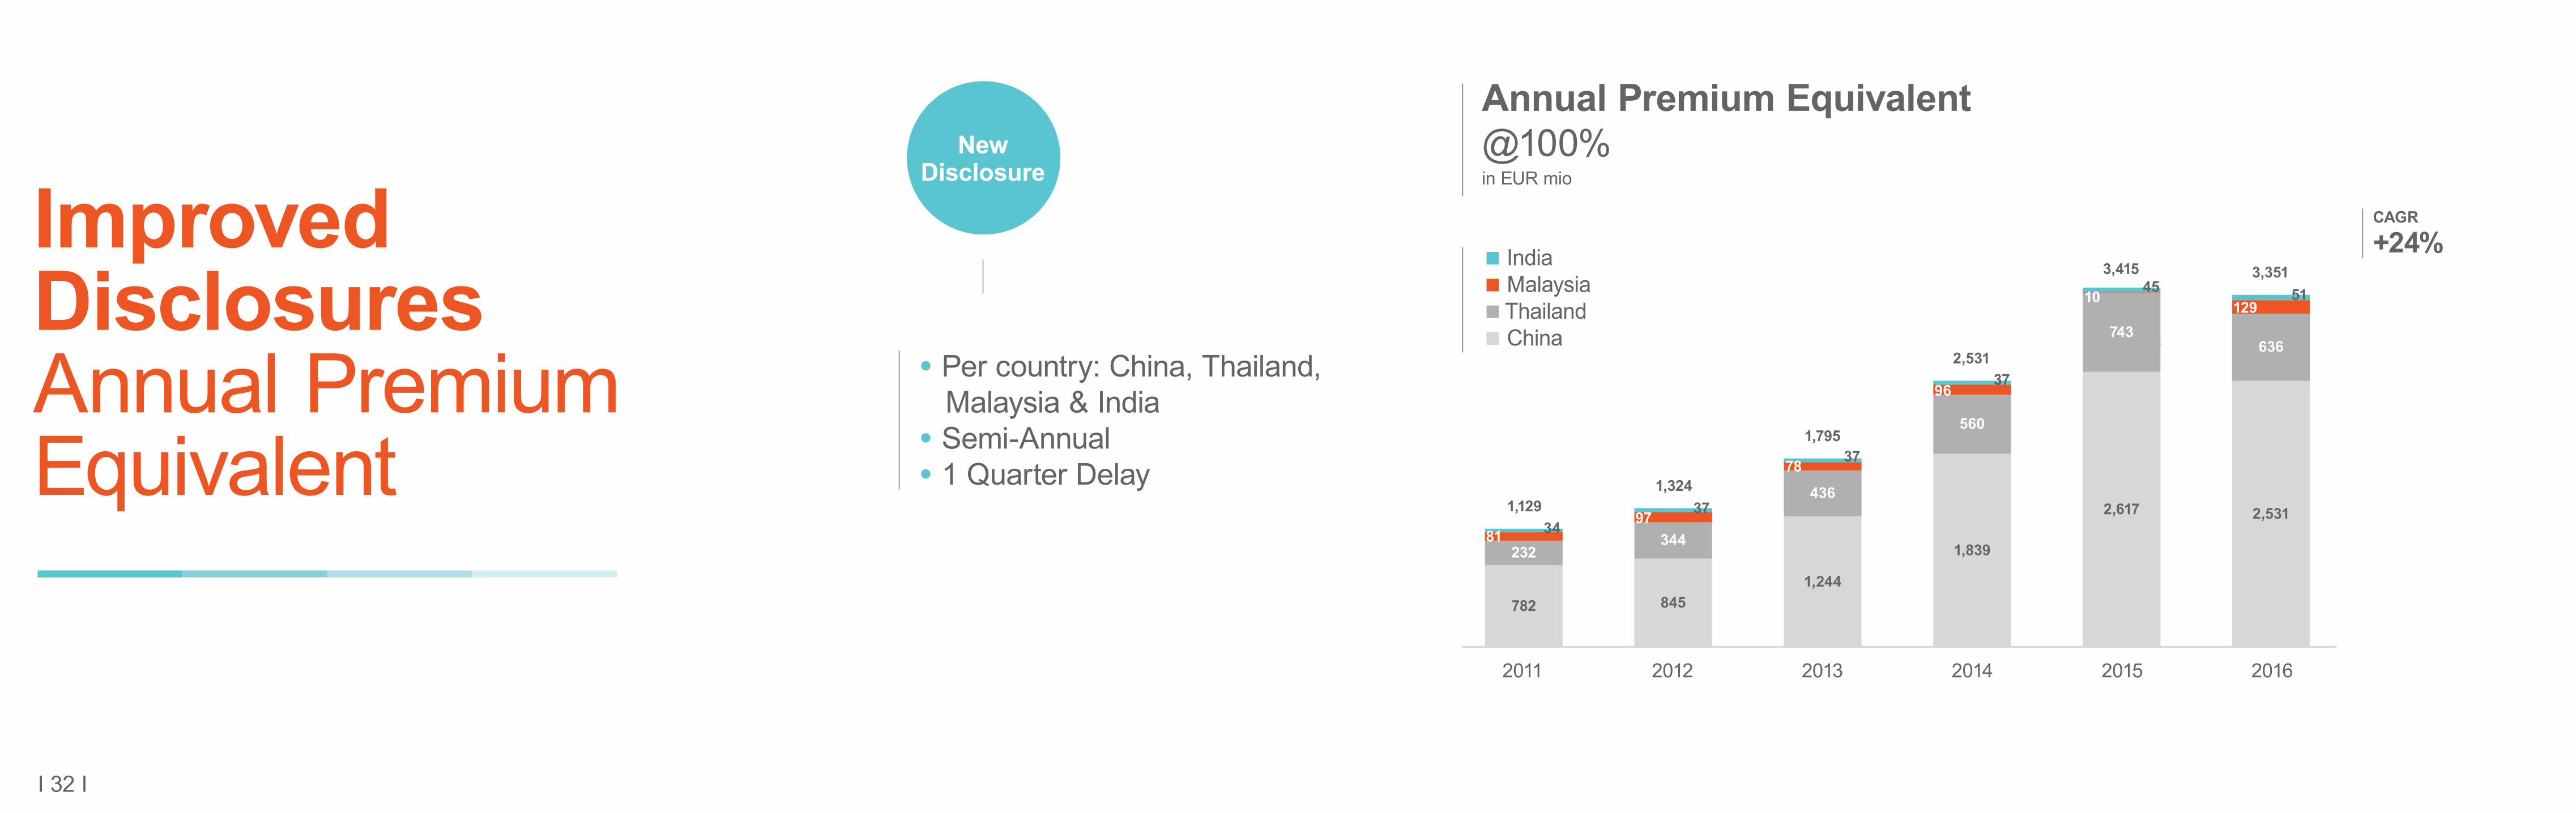
I 32 I
ImprovedDisclosuresAnnual PremiumEquivalent
NewDisclosure
• Per country: China, Thailand, Malaysia & India• Semi-Annual• 1 Quarter Delay
Annual Premium Equivalent@100%in EUR mio
2011 2012 2013 2014 2015 2016
1,1291,324
1,795
2,531
3,415 3,351
CAGR
+24% IndiaMalaysiaThailandChina
232
782
344
845
436
1,244
560
1,839
743
2,617
636
2,53181 34
37
37
37
45 51
97
78
96
10129

I 33 I
ImprovedDisclosuresLife Technical Liabilities
CurrentDisclosure
ImprovedDisclosure
Timing of Disclosure
Life Technical Liabilities @ageas Sharein EUR mio
IndiaMalaysiaThailandChina
• Per country: China, Thailand, Malaysia & India
• Semi-Annual• 1 Quarter Delay
• Asia Quarterly Basis
2011 2012 2013 2014 2015 2016
1,301
735
3,032
1,413
969
3,607
1,279
1,097
4,468
1,410
1,561
6,175
1,231
1,971
7,811
1,279
2,503
9,10970
8784
115
149
187
5,139
6,928
9,260
11,163
13,078
6,076
CAGR
+21%
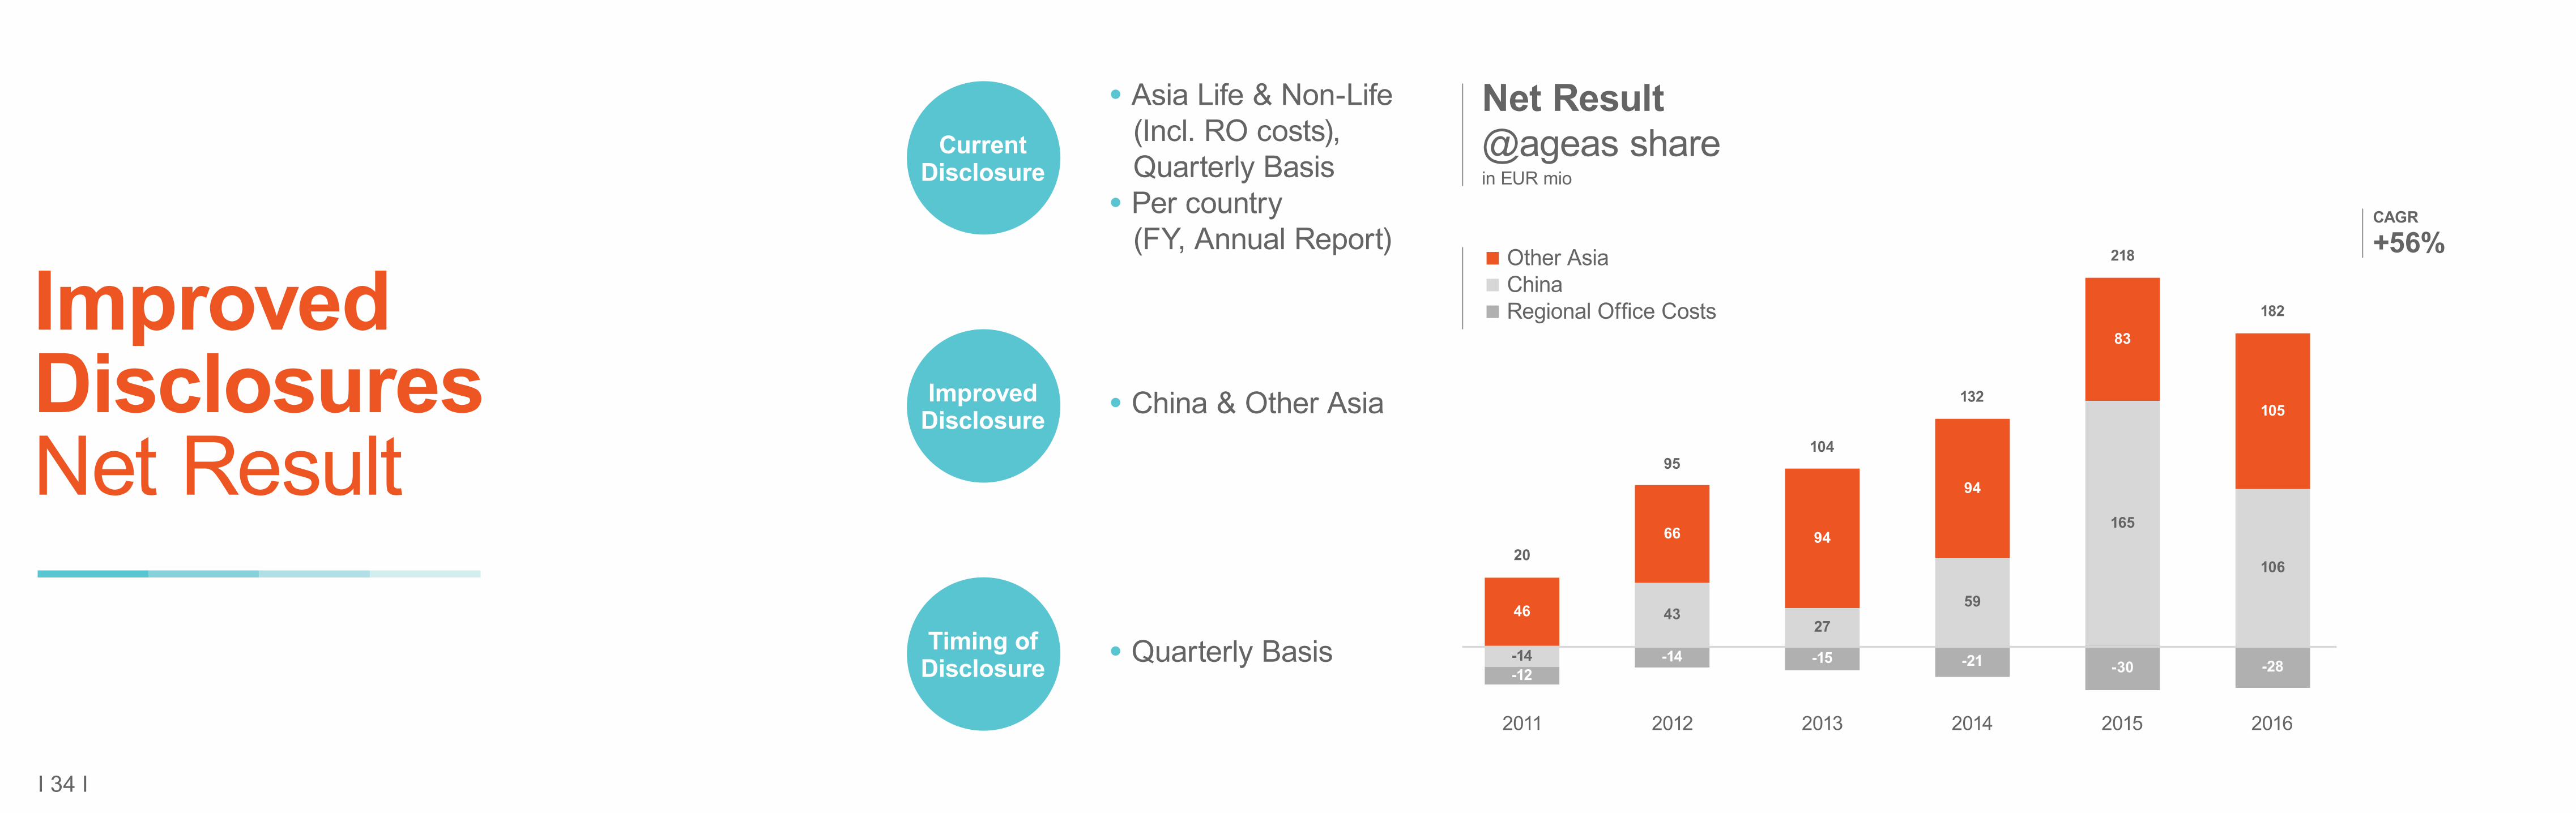
I 34 I
ImprovedDisclosuresNet Result
CurrentDisclosure
ImprovedDisclosure
Timing of Disclosure
Net Result@ageas sharein EUR mio
Other AsiaChinaRegional Office Costs
• China & Other Asia
• Quarterly Basis
• Asia Life & Non-Life (Incl. RO costs), Quarterly Basis• Per country (FY, Annual Report)
2011 2012 2013 2014 2015 2016
46
-14-12
66
43
-14
94
27
-15
94
59
-21
83
165
-30
105
106
-28
20
95104
132
218
182
CAGR
+56%
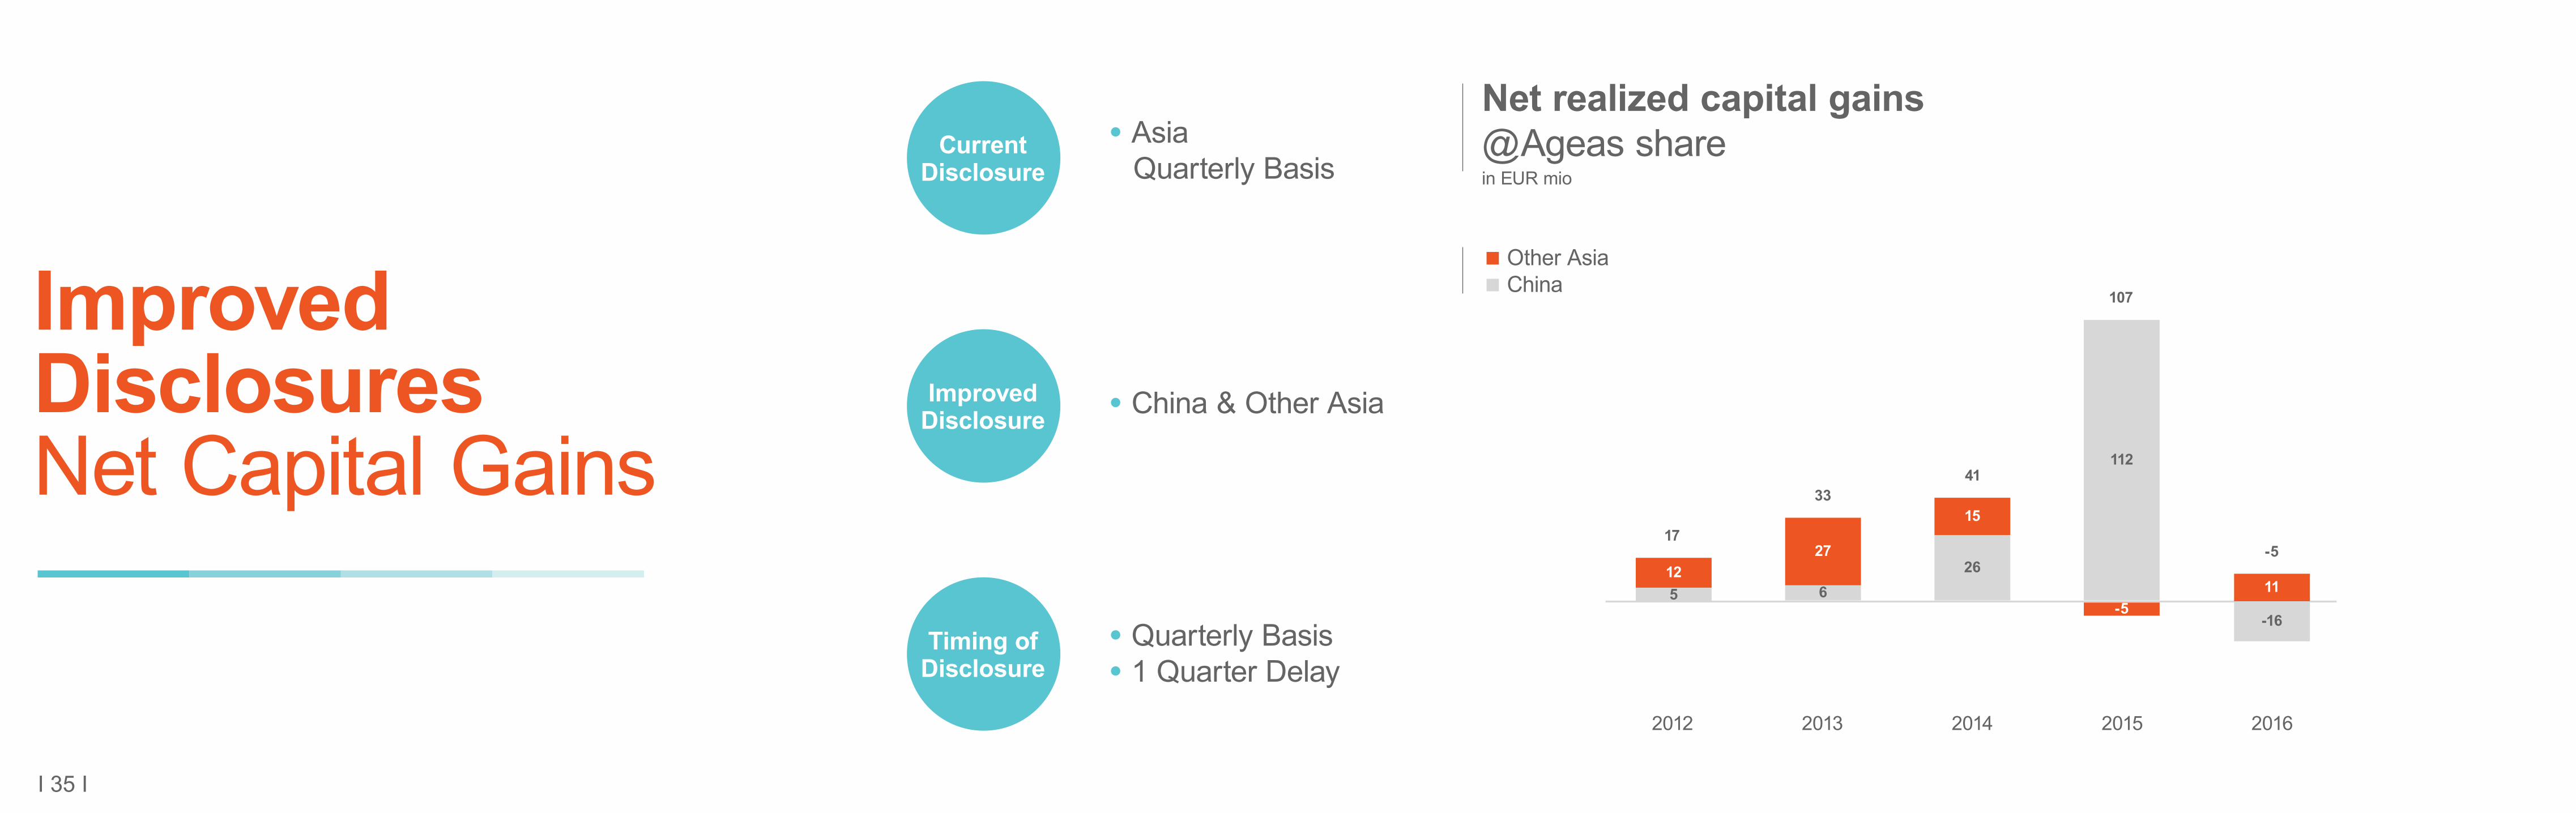
I 35 I
ImprovedDisclosuresNet Capital Gains
CurrentDisclosure
ImprovedDisclosure
Timing of Disclosure
Net realized capital gains @Ageas sharein EUR mio
Other AsiaChina
• Quarterly Basis• 1 Quarter Delay
2012 2013 2014 2015 2016
17
3341
-5
107
• China & Other Asia
• Asia Quarterly Basis
125
27
6
15
26
-5
112
11
-16
I 36 I
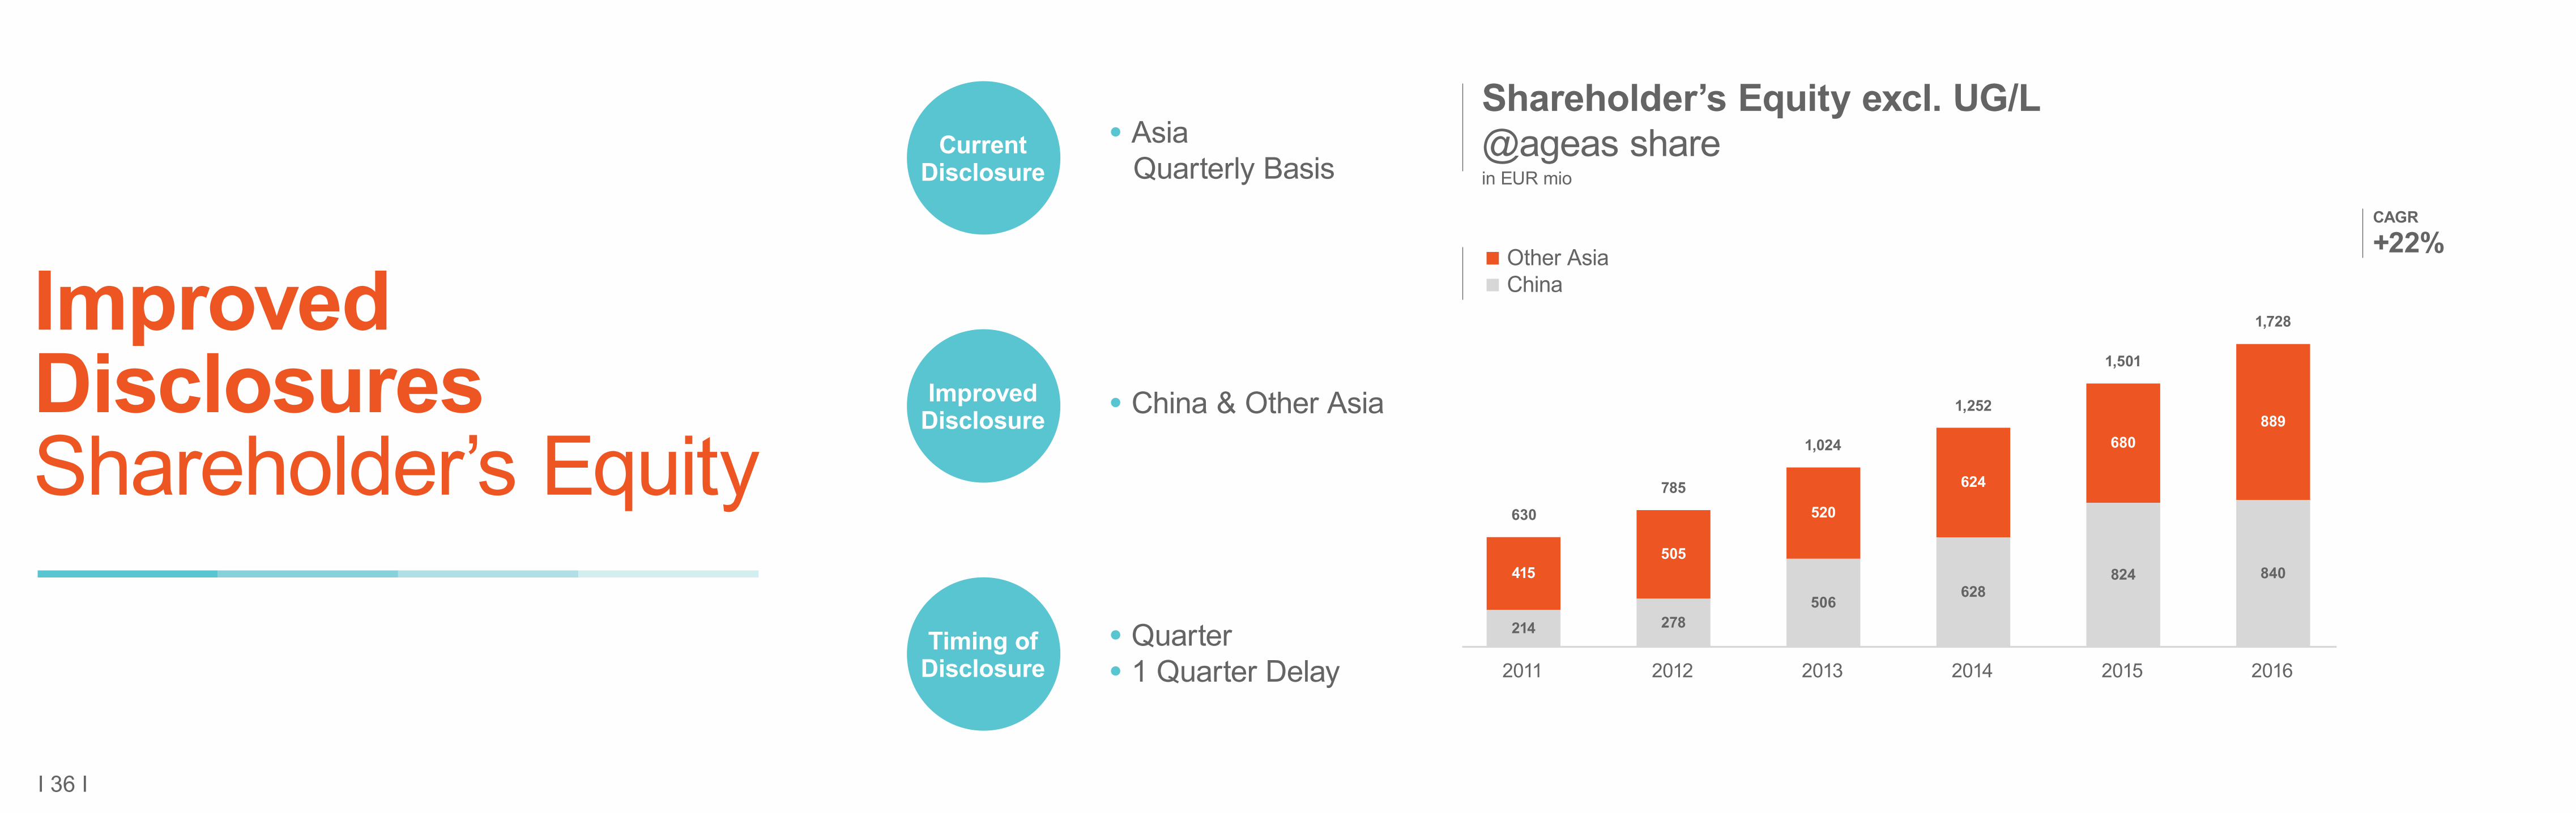
ImprovedDisclosuresShareholder’s Equity
CurrentDisclosure
ImprovedDisclosure
Timing of Disclosure
Shareholder’s Equity excl. UG/L@ageas sharein EUR mio
Other AsiaChina
2011 2012 2013 2014 2015 2016
630
785
1,024
1,252
1,501
1,728
• Quarter• 1 Quarter Delay
• Asia Quarterly Basis
415
214
505
278
520
506
624
628
680
824
889
840
• China & Other Asia
CAGR
+22%

I 37 I
ImprovedDisclosuresLocal Solvency
CurrentDisclosure
ImprovedDisclosure
Timing of Disclosure
Local Solvency
AsiaChina
2011 2012 2013 2014 2015 2016
178%
164%
247%253%
288%
261% 266%
237%
223%
275%
226%*
251%
100%
150%
200%
250%
300%
• Quarter• 1 Quarter Delay
• China & Asia
• Asia Quarterly Basis
* Restated C-Ross Figure of 271%
I 38 I
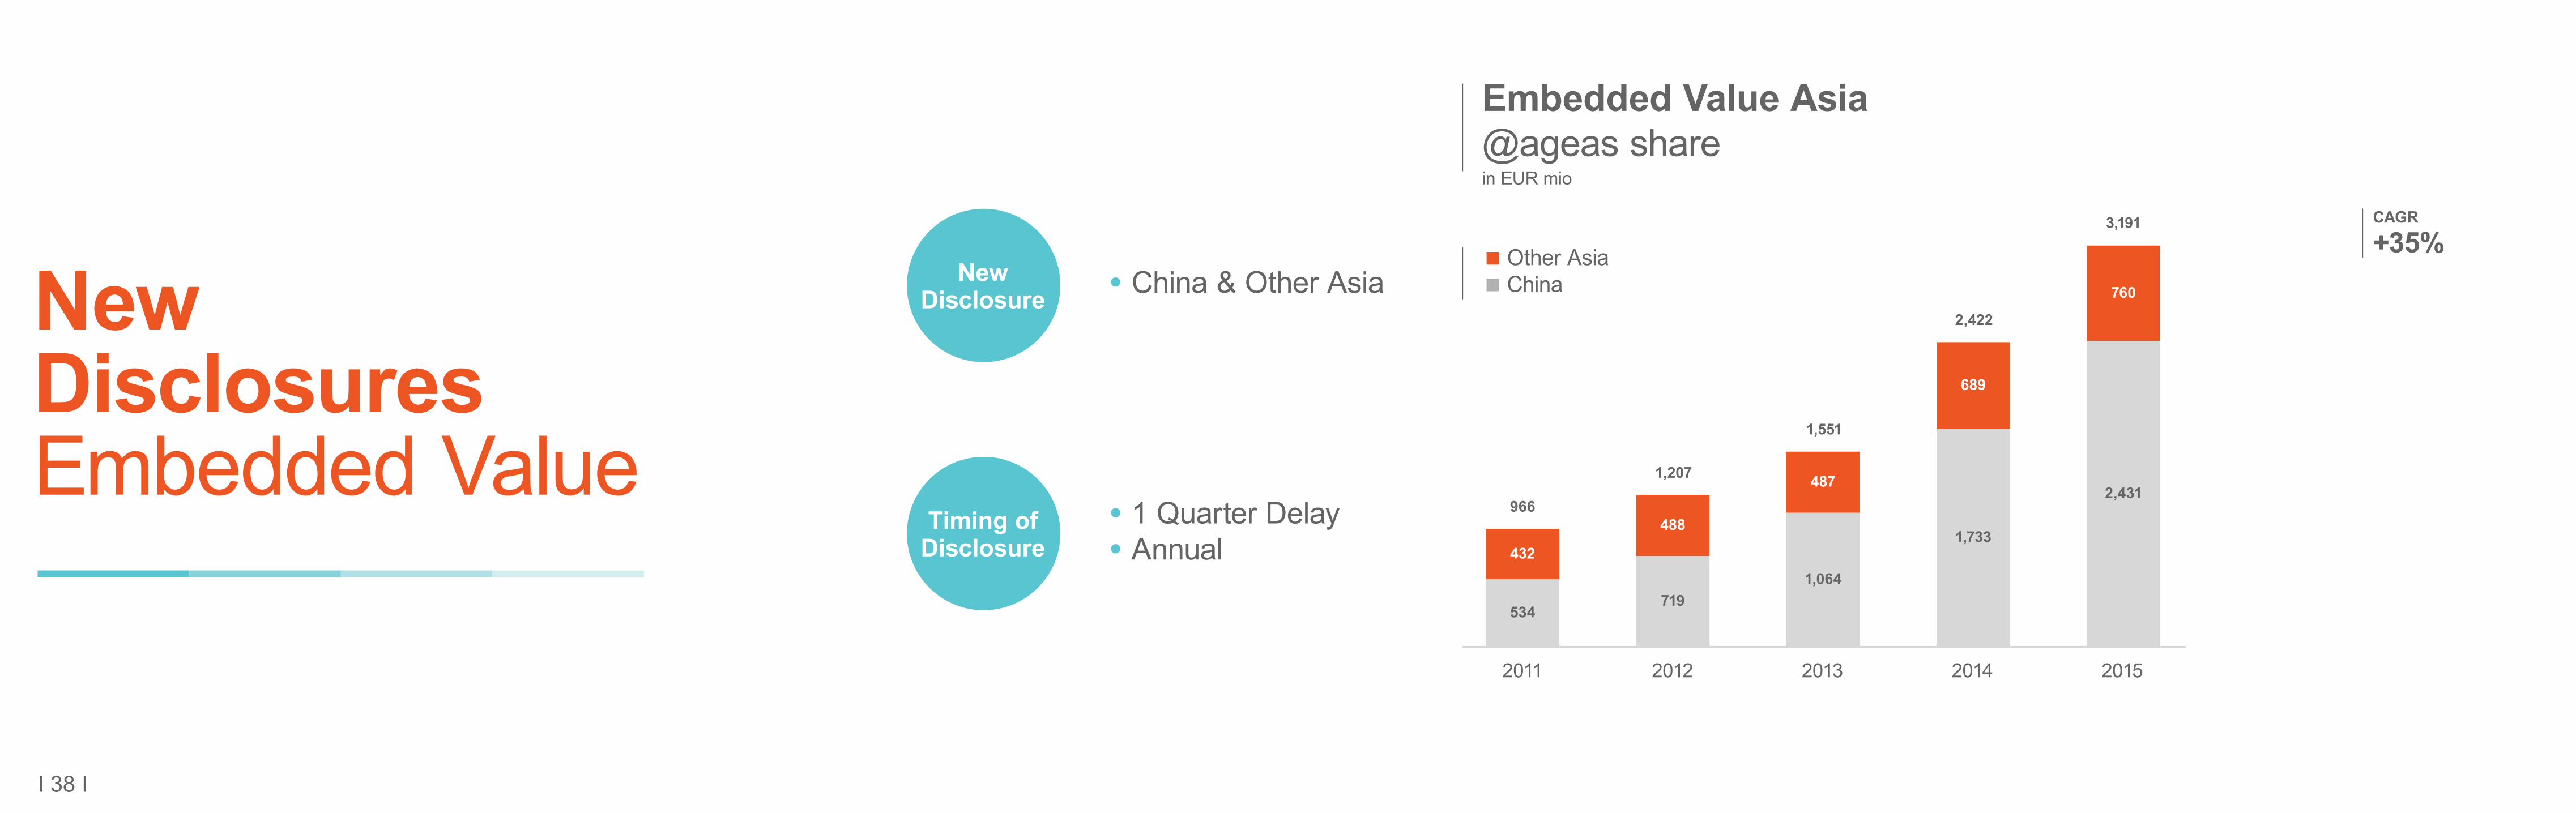
NewDisclosuresEmbedded Value
Embedded Value Asia @ageas sharein EUR mio
Other AsiaChina
2011 2012 2013 2014 2015
432
534
488
719
487
1,064
689
1,733
760
2,431966
1,207
1,551
2,422
3,191
NewDisclosure
Timing of Disclosure
• 1 Quarter Delay• Annual
• China & Other Asia
CAGR
+35%
I 39 I
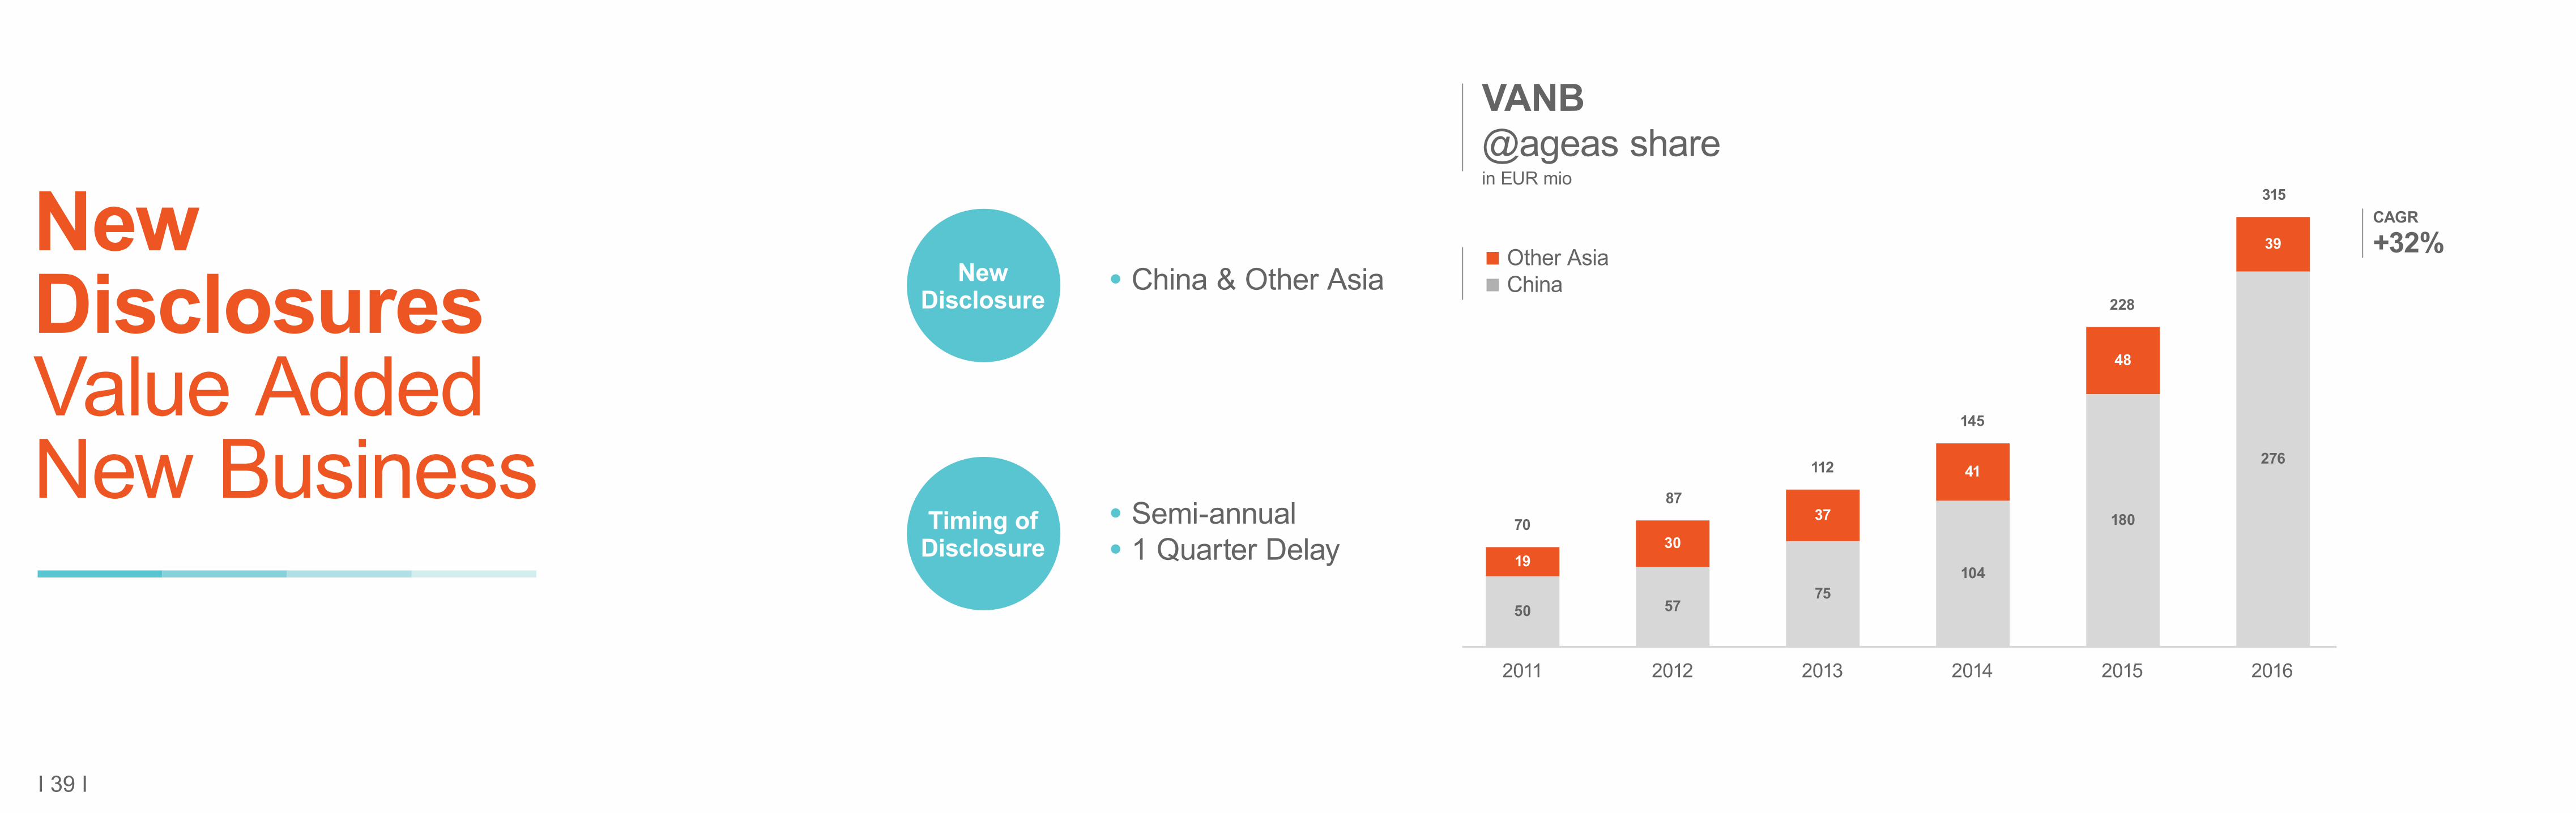
NewDisclosuresValue Added New Business
2011 2012 2013 2014 2015 2016
VANB @ageas sharein EUR mio
Other AsiaChina
19
50
30
57
37
75
41
104
48
180
39
276
70
87
112
145
228
315
NewDisclosure
Timing of Disclosure
• Semi-annual• 1 Quarter Delay
• China & Other Asia
CAGR
+32%
I 40 I
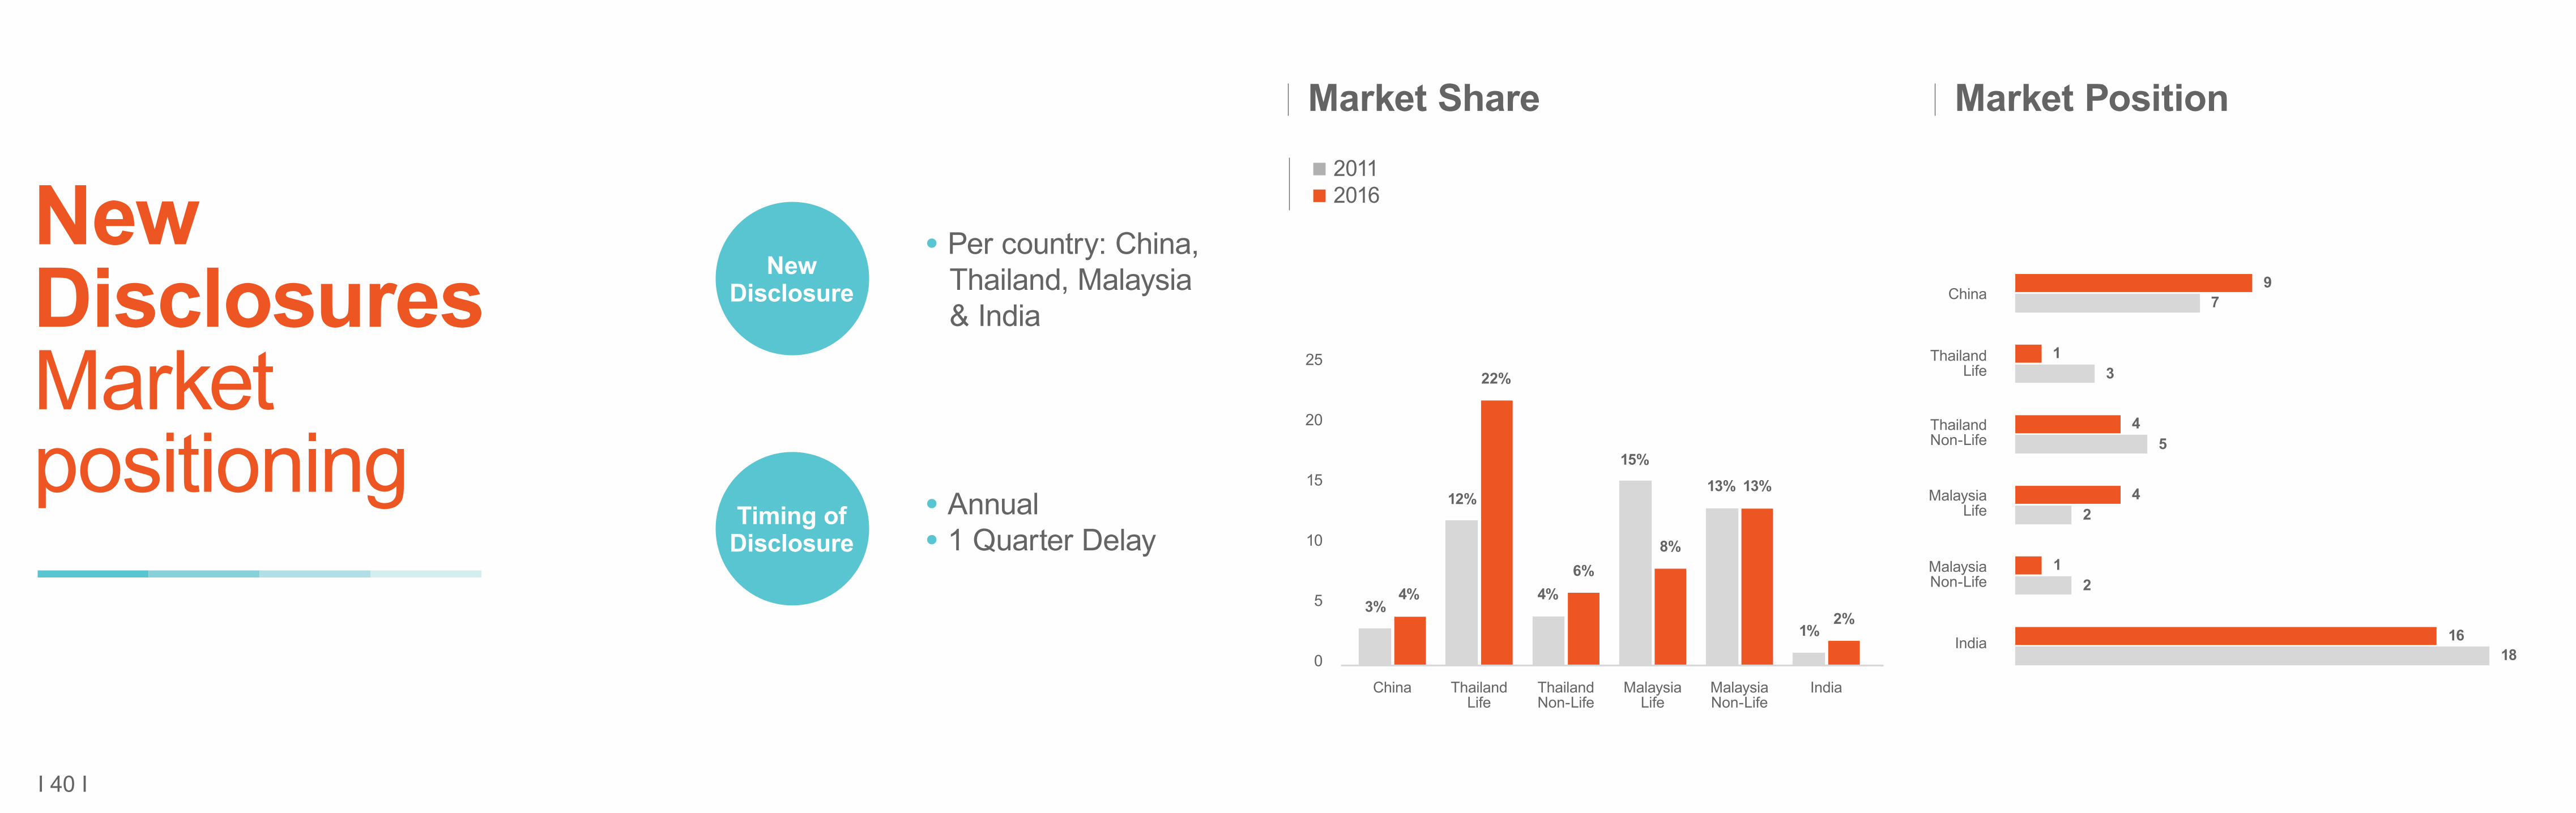
NewDisclosures Marketpositioning
NewDisclosure
Timing of Disclosure
• Per country: China, Thailand, Malaysia & India
• Annual• 1 Quarter Delay
Market Share Market Position 20112016
0
5
10
15
20
25
China
China
ThailandLife
ThailandNon-Life
MalaysiaLife
MalaysiaNon-Life
India
ThailandLife
ThailandNon-Life
MalaysiaLife
MalaysiaNon-Life
India
3%4%
12%13% 13%
1%2%
22%
97
13
4
42
1
1618
2
5
4%6%
15%
8%

I 41 I
NewDisclosures# Agents
• Per country: China, Thailand, Malaysia, India
Number of Agents
2011 2012 2013 2014 2015 2016
50,000
100,000
150,000
200,000
250,000
300,000
253,780
46,06429,23624,29211,18121,0158,5777,752
ChinaThailandMalaysia India
NewDisclosure
Timing of Disclosure
• Annual• 1 Quarter Delay

I 42 I
Summary more insight in quality of performance
Improved & New Disclosures Region Asia China Other Asia China/ Thailand/ Malaysia/ India
New Business Regular Premium Q - - Semi-Annual (1Q delay)
New Business Single Premium Q - - Semi-Annual (1Q delay)
Renewal Premium Q - - Semi-Annual (1Q delay)
APE Q - - Semi-Annual (1Q delay)
Life Technical Liabilities Q (No change) - - Semi-Annual (1Q delay)
Net Result (Life & Non-Life) incl. RO Q (No change) Q (1Q delay) Q (1Q delay) -
Net Capital Gains (Life & Non-Life) Q (No change) Q (1Q delay) Q (1Q delay) -
Local Solvency Q (No change) Q (1Q delay) Q (1Q delay) -
Shareholder's Equity Q (No change) Q (1Q delay) Q (1Q delay) -
Value Added New Business (VANB) - Semi-Annual (1Q Semi-Annual (1Q -
Embedded Value Annual (1Q delay) Annual (1Q delay) Annual (1Q delay) -
Market Position - - - Annual (1Q delay)
Number of Agents - - - Annual (1Q delay)

I 43 I
Conclusion

I 44 I
Gross Inflows @ 100%
EUR 18 bn(CAGR '11-'16 +35%)
Net ResultEUR 182 mio
(CAGR '11-'16 +56%)
APEEUR 3.4 bn(CAGR '11-'16 +24%)
EV @ageas share
EUR 3.2 bn*
(CAGR '11-'15 +37%)
VANB @ageas share
EUR 315 mio(CAGR '11-'16 +36%)
Technical Liabilities @ageas share
EUR 13.1 bn(CAGR '11-'16 +21%)
Cost Ratio Life
2.6%Combined Ratio
85%Solvency
266%ROE excl. UG/L
11.6%* 2015 number @ ageas share

I 45 I
Vibrant franchise
Strong Distribution Networks• ˃ 375,000 agents (as of today)• 36,000 bank branches• > 20 mio customers
Developing strengths in• Data Analytics• Digital Platform• Customer Centricity
Focus on improving• productivity in agency & banca• persistency• growth in VANB• ALM capabilities• dividend flows


