Towards competitive European batteries GC.NMP.2013-1 Grant. 608936 2020 1 Alexander Warnecke Workshop EPE Conference – Geneva (Switzerland) 9 th of September 2015 Ageing effects of Lithium-ion batteries
Transcript
Towards competitive European batteries
GC.NMP.2013-1 Grant. 608936 2020
1
Alexander Warnecke Workshop EPE Conference – Geneva (Switzerland) 9th of September 2015
Ageing effects of Lithium-ion batteries
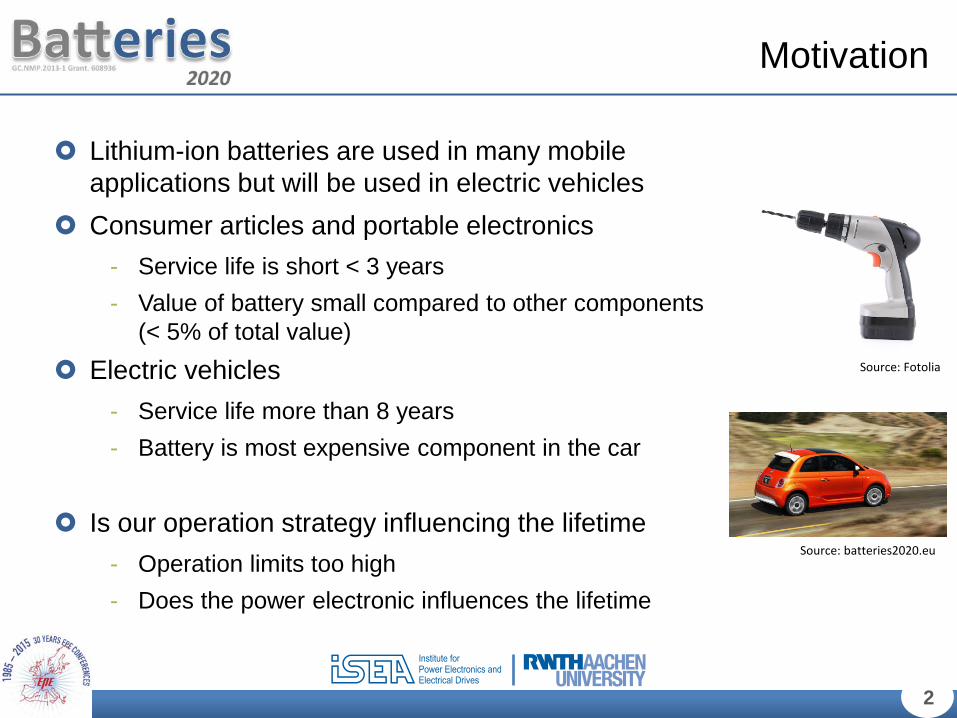
Lithium-ion batteries are used in many mobile applications but will be used in electric vehicles
Consumer articles and portable electronics - Service life is short < 3 years - Value of battery small compared to other components
(< 5% of total value) Electric vehicles
- Service life more than 8 years - Battery is most expensive component in the car
Is our operation strategy influencing the lifetime
- Operation limits too high - Does the power electronic influences the lifetime
2
Motivation
Source: batteries2020.eu
Source: Fotolia
INDEX
1. Ageing effects
2. How to predict ageing?
3. Ageing tests
4. Ageing examples
5. Influence of ripples
4
Ageing effects
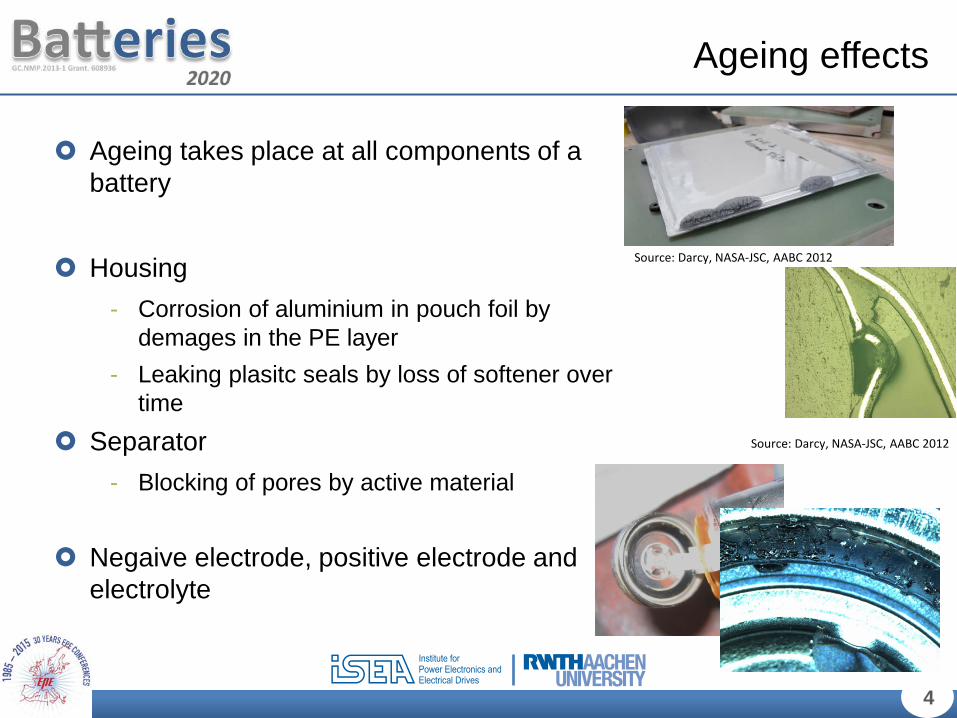
Ageing takes place at all components of a battery
Housing - Corrosion of aluminium in pouch foil by
demages in the PE layer - Leaking plasitc seals by loss of softener over
time Separator
- Blocking of pores by active material
Negaive electrode, positive electrode and electrolyte
Source: Darcy, NASA-JSC, AABC 2012
Source: Darcy, NASA-JSC, AABC 2012
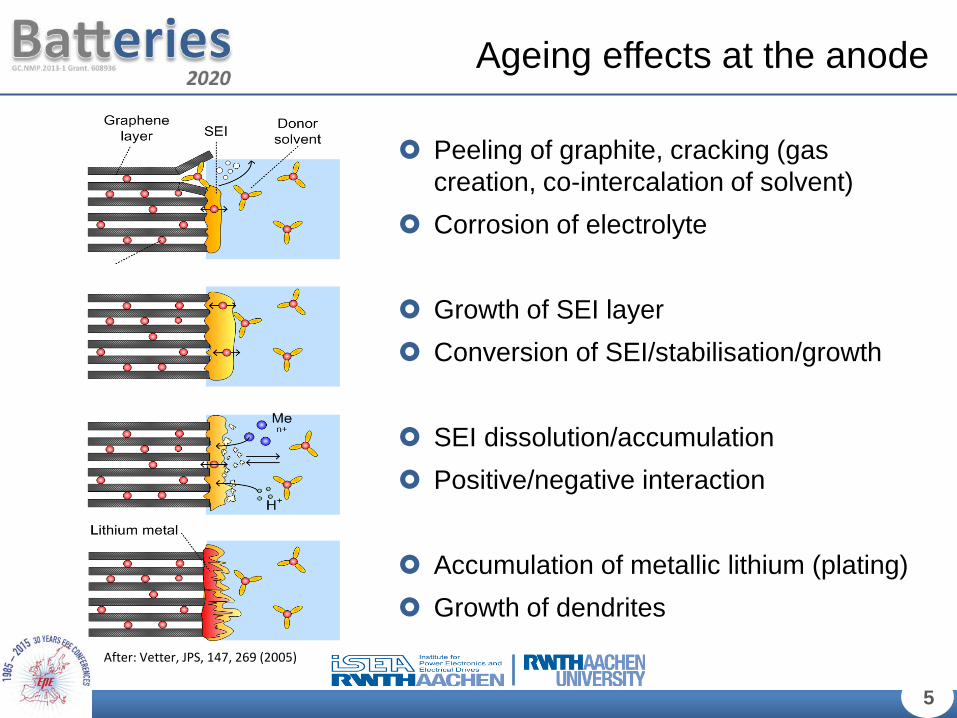
Peeling of graphite, cracking (gas creation, co-intercalation of solvent)
Corrosion of electrolyte
Growth of SEI layer Conversion of SEI/stabilisation/growth
SEI dissolution/accumulation Positive/negative interaction
Accumulation of metallic lithium (plating) Growth of dendrites
5
Ageing effects at the anode
After: Vetter, JPS, 147, 269 (2005)
Stability window of organic elctrolytes responsible for ageing effects at anode
Standard anode is far out of stability window
- Formation of SEI on the surface
When high voltage cathodes
(above 4.5 V) are used, electrolyte is also not stable
6
Ageing effects of the elctrolyte
5 4 3 2 1 0
LiCoO2
LiNiO2
LiMn2O4
MnO2
V2O5
V6O13
TiS2
MoO2
Li Metal
Graphite Coke Li6Fe2O3
+
-
7
Ageing effects at the anode
Intercalation of solvent/ peeling of graphite/cracking results in loss of capacity (loss of active material, loss of lithium)
accelerated if: Overcharging („very high SoC“)
Dissolution of electrolyte (cathodic oxidation / anodic reduction) / dissolution of binder results in: loss of capacity, loss of power capability
accelerated by: high temperature, high state of charge (SOC)
Growth of SEI/ Change of surface porosity results in: growth of impedance, loss of power capability
accelerated by: high current, high cycle depths (DOD)
Decrease of active surface (continuous growth of SEI) results in: growth of impedance, loss of power capability
accelerate by: high temperature, high state of charge (SOC)
After: Vetter, JPS, 147, 269 (2005)
8
Ageing effects at the anode
Deposition of metallic lithium/ formation of SEI results in: Loss of capacity, loss of power capability (loss of lithium)
accelerated by: low temperature, high current, bad design of cells
Loss of contact active mass particles because of volume change results in: Loss of capacity
accelerated by: high current, high depth of cycling (DOD)
Corrosion of conductor results in: Loss of power capability (overvoltage),growth of
impedance
accelerated by: low SOC, deep discharge
9
Ageing effects at the cathode
Source: J. Vetter et al. / Journal of Power Sources 147 (2005) 269–281
10
Ageing effects at the cathode
Source: J. Vetter et al. / Journal of Power Sources 147 (2005) 269–281
Structural disordering Results in loss of storage places for lithium
accelerated if: stored (research in progress)
Migration of soluble species results in: loss of capacity by firm formation on anode
accelerated by: high temperature, high state of charge (SOC)
Electrolyte decomposition Results in loss of power capability
accelerated by: high temperature, high state of charge (SOC)
Corrosion of conductor results in: Loss of power capability (overvoltage),
growth of impedance
accelerated by: low SOC, deep discharge
11
How to predict ageing?
Prediction of ageing can be done by detailed understanding of all components and their reactions
- At the moment impossible much more research
- Approximation by physico chemical models
Accelerated ageing of the cell at critical points and see the capacity and resistance changes
- Storing cells for long time - Cycling cells with syntetic load profiles - Mayor disadvantage: Costs and testing time
Solution
Active material
SEI
12
Accelerated ageing tests
Testing all possible stress parameters seperately to identify dependencies
Stress factors: - Temperature - Depth of discharge (DOD) - Middle SoC (mid. SoC) - Charge current - Discharge current
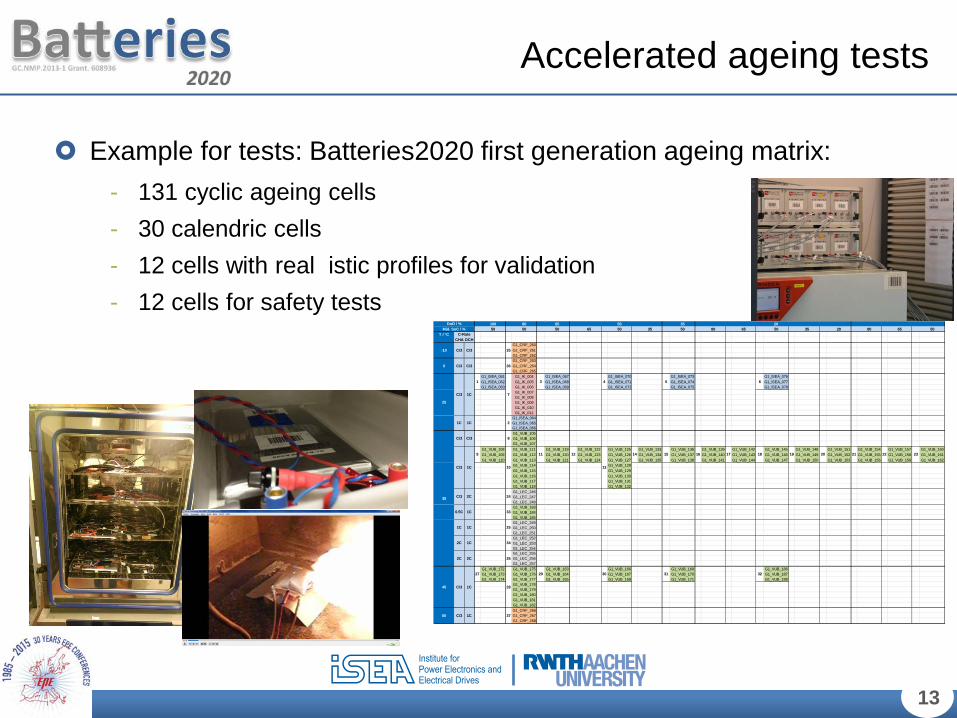
Example for tests: Batteries2020 first generation ageing matrix: - 131 cyclic ageing cells - 30 calendric cells - 12 cells with real istic profiles for validation - 12 cells for safety tests
Every cell ages different! - Bad for general statements about ageing, great for research!
Example of ageing curves in Batteries2020:
14
Ageing examples
0 200 400 600 800 100080
85
90
95
100
FCE / #C
apac
ity /
%
3: 45°C - C/3-1C - 50% Mid.SoC
0 500 1000 150080
85
90
95
100
FCE / #
Cap
acity
/ %
1: 25°C - C/3-1C - 50% Mid.SoC
100% DoD80% DoD65% DoD50% DoD35% DoD20% DoD
0 200 400 600 800 100080
85
90
95
100
FCE / #
Cap
acity
/ %
2: 35°C - C/3-1C - 50% Mid.SoC
Storage tests (Calendric ageing)
15
Ageing examples
0 100 200 300 40080
85
90
95
100
Storage Time / Days
Cap
acity
/ %
Ageing at 25°C
0 100 200 300 40080
85
90
95
100
Storage Time / Days
Cap
acity
/ %
Ageing at 35°C
100% SoC80% SoC65% SoC50% SoC35% SoC20% SoC
0 100 200 300 40080
85
90
95
100
Storage Time / DaysC
apac
ity /
%
Ageing at 45°C
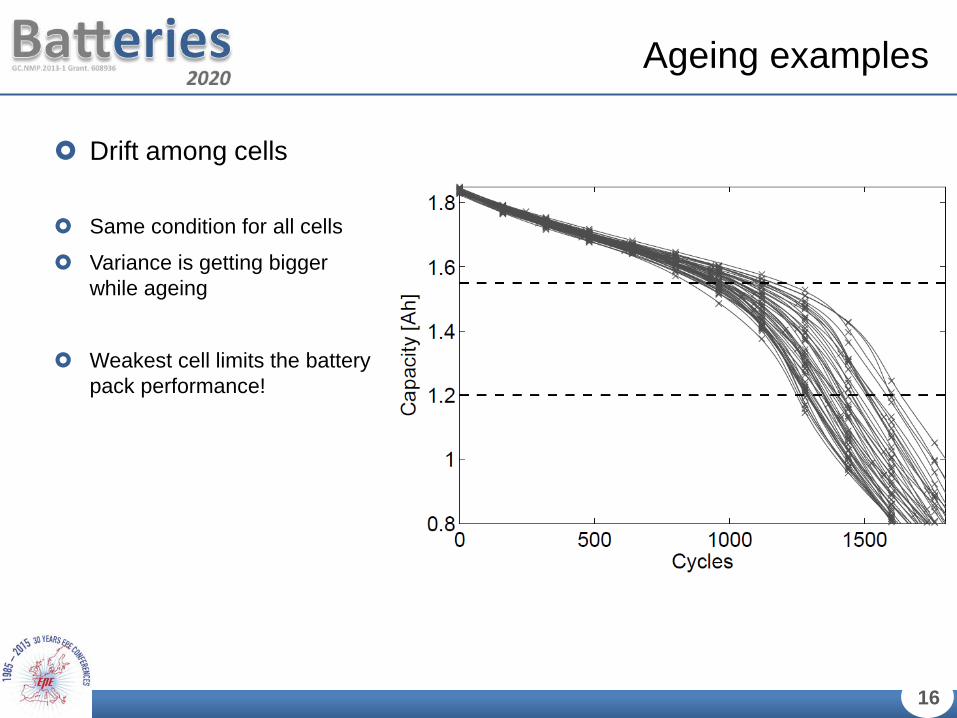
Drift among cells
Same condition for all cells
Variance is getting bigger while ageing
Weakest cell limits the battery pack performance!
16
Ageing examples
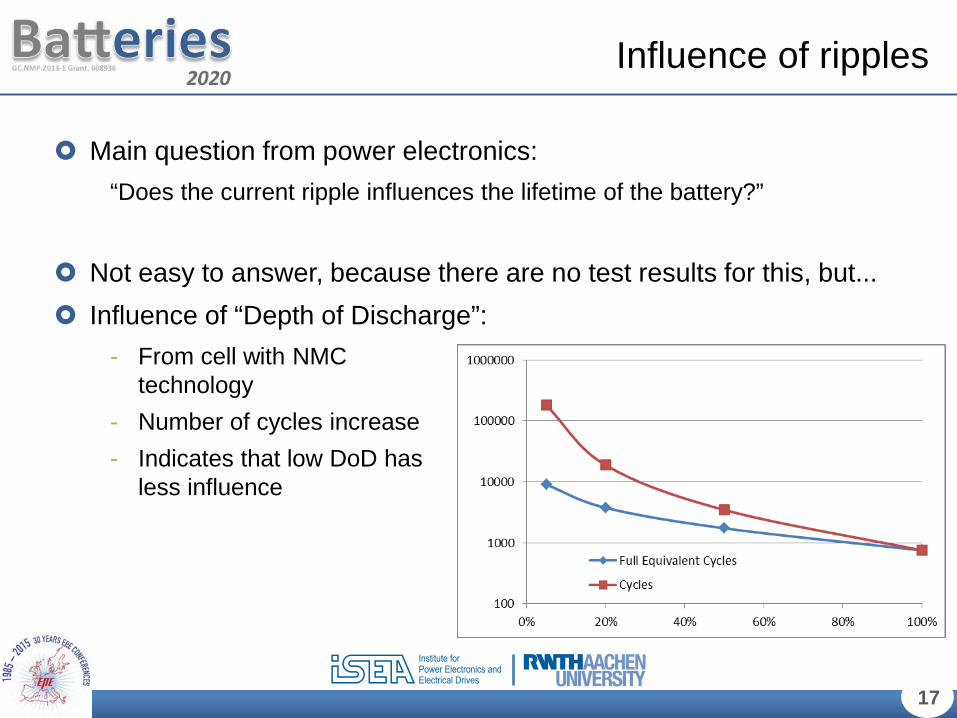
Main question from power electronics: “Does the current ripple influences the lifetime of the battery?”
Not easy to answer, because there are no test results for this, but... Influence of “Depth of Discharge”:
- From cell with NMC technology
- Number of cycles increase - Indicates that low DoD has
less influence
17
Influence of ripples
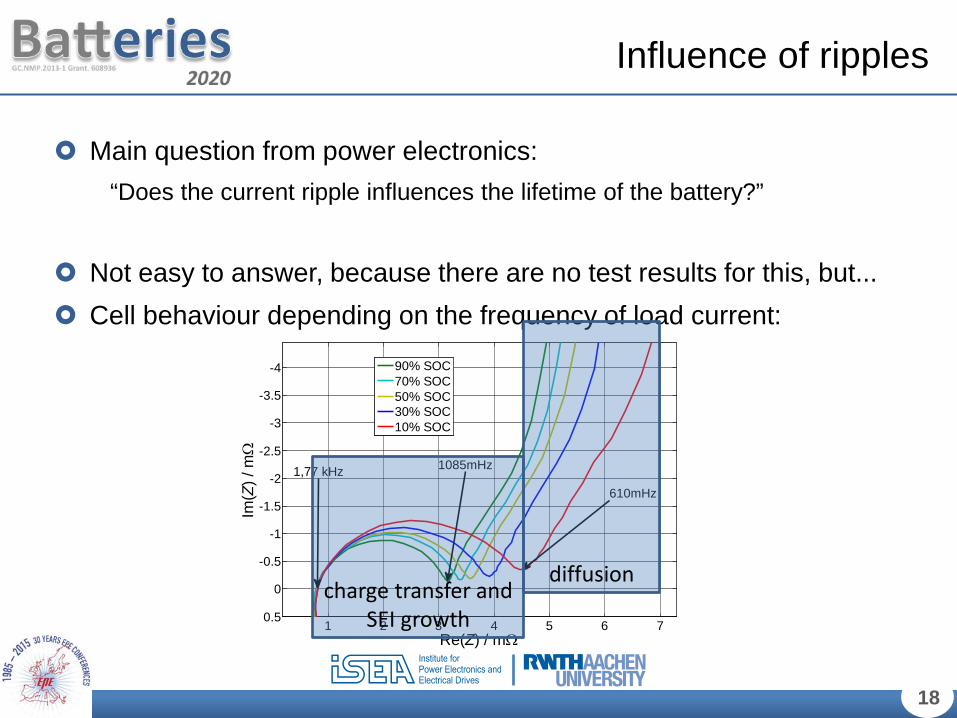
Main question from power electronics: “Does the current ripple influences the lifetime of the battery?”
Not easy to answer, because there are no test results for this, but... Cell behaviour depending on the frequency of load current:
18
Influence of ripples
1 2 3 4 5 6 7
-4
-3.5
-3
-2.5
-2
-1.5
-1
-0.5
0
0.5
Re(Z) / mΩ
Im(Z
) / m
Ω
90% SOC70% SOC50% SOC30% SOC10% SOC
1,77 kHz 1085mHz
610mHz
charge transfer and SEI growth
diffusion
Basic ageing effects in lithium-ion batteries are known Todays models and testing methods give good results Batteries are behaving profoundly non-linear
Lifetime of batteries are sufficient for electric vehicle applications
- Energy density and price are the critical properties
Does current ripples influence the ageing? - Actual results indicate that there are no influences, but no detailed
studies. - One objective of the Project “HV-Modal” is testing this issue (Results will


![Skin Effects and Dielectric Loss[1]suddendocs.samtec.com/notesandwhitepapers/skin... · Title: Skin Effects and Dielectric Loss[1] Keywords Created Date: 20180220220629Z](https://static.documents.pub/doc/80x56/5f31d271bbf918721221e2d1/skin-effects-and-dielectric-loss1-title-skin-effects-and-dielectric-loss1-keywords.jpg)


