28
AGENCY OVERVIEW Fixed Route Service / Direct Service, ADA Complementary Paratransit service Service 3 municipalities 4 Routes (Blue, Red, Green & The LOOP) Non-unionized workforce 1
| Date post: | 28-Dec-2015 |
| Category: |
Documents |
| Upload: | camilla-gilmore |
| View: | 216 times |
| Download: | 0 times |
AGENCY OVERVIEW Fixed Route Service / Direct Service, ADA
Complementary Paratransit service
Service 3 municipalities
4 Routes (Blue, Red, Green & The LOOP)
Non-unionized workforce
1
CURRENT FINANCIAL OVERVIEW
Historically conservative Short-term outlook = GOOD
No federal money in FY09-10 / FY11-12
Significant reserves 2

CURRENT FINANCIAL POSITION Reserves (As of June 30, 2011)
Source Balance
PTAF $399,797
ASG
BSG
Section 1513 $590,386
Local $73,606
Other
3

CURRENT FINANCIAL POSITION CONT.
Level of Short-Term Debt/Loans—Identify each line of credit (excludes long-term bond financing)
Name of Financial Institution
Amount of Available
Credit
Interest Rate
Current Credit in Use
N/A
4

CURRENT FINANCIAL POSITION CONT.Accounts Payable – Past due 90 days and
over
Accounts Receivable – Past due 90 days and over
Vendor Amount Past Due Estimated Pay Date
N/A
Program/Agency
Amount Past Due
Date Requisitione
d
Estimated Pay Date
N/A5
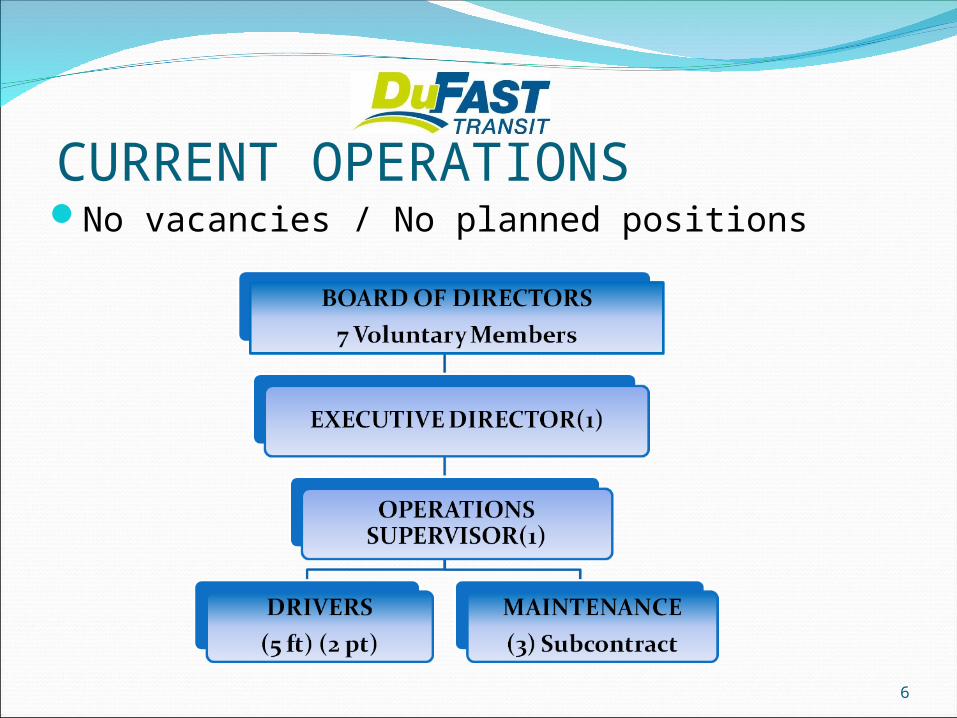
CURRENT OPERATIONSNo vacancies / No planned positions
6
CURRENT OPERATIONS CONT. Term of current union contract ___N/A____ to
__________
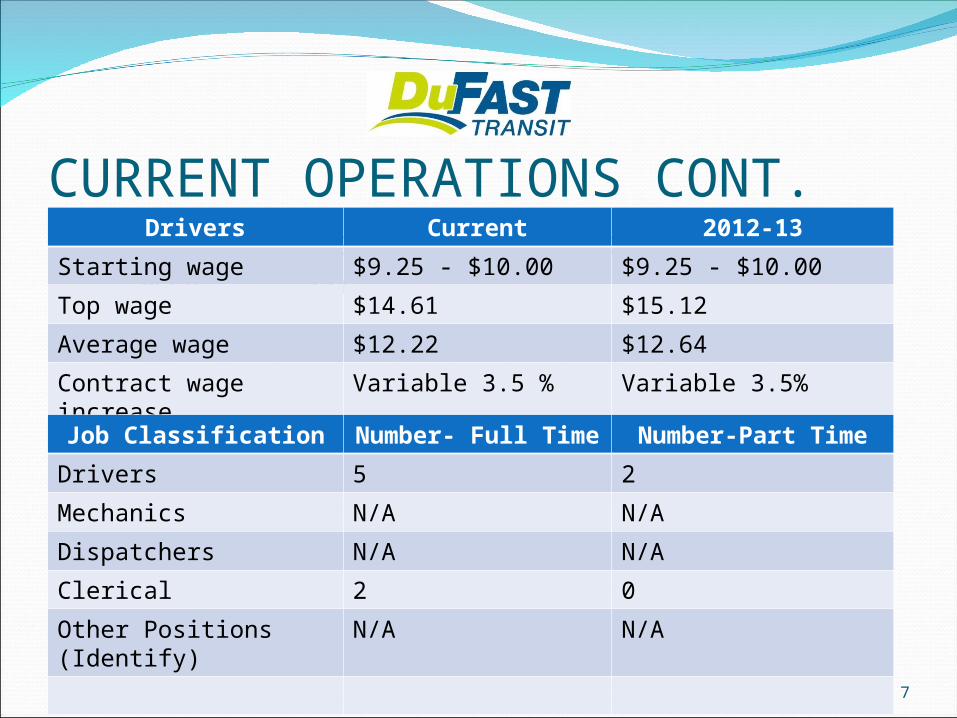
Drivers Current 2012-13
Starting wage $9.25 - $10.00 $9.25 - $10.00
Top wage $14.61 $15.12
Average wage $12.22 $12.64
Contract wage increase
Variable 3.5 % Variable 3.5%
Job Classification Number- Full Time
Number-Part Time
Drivers 5 2
Mechanics N/A N/A
Dispatchers N/A N/A
Clerical 2 0
Other Positions (Identify)
N/A N/A
7
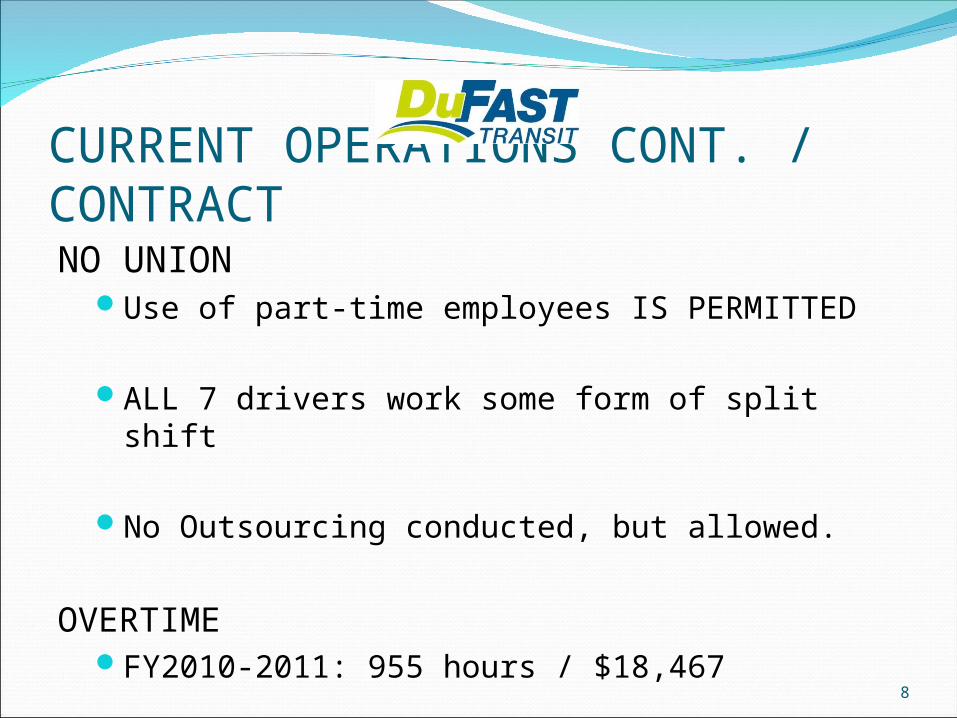
CURRENT OPERATIONS CONT. / CONTRACT NO UNION
Use of part-time employees IS PERMITTED
ALL 7 drivers work some form of split shift
No Outsourcing conducted, but allowed.
OVERTIME FY2010-2011: 955 hours / $18,467
8
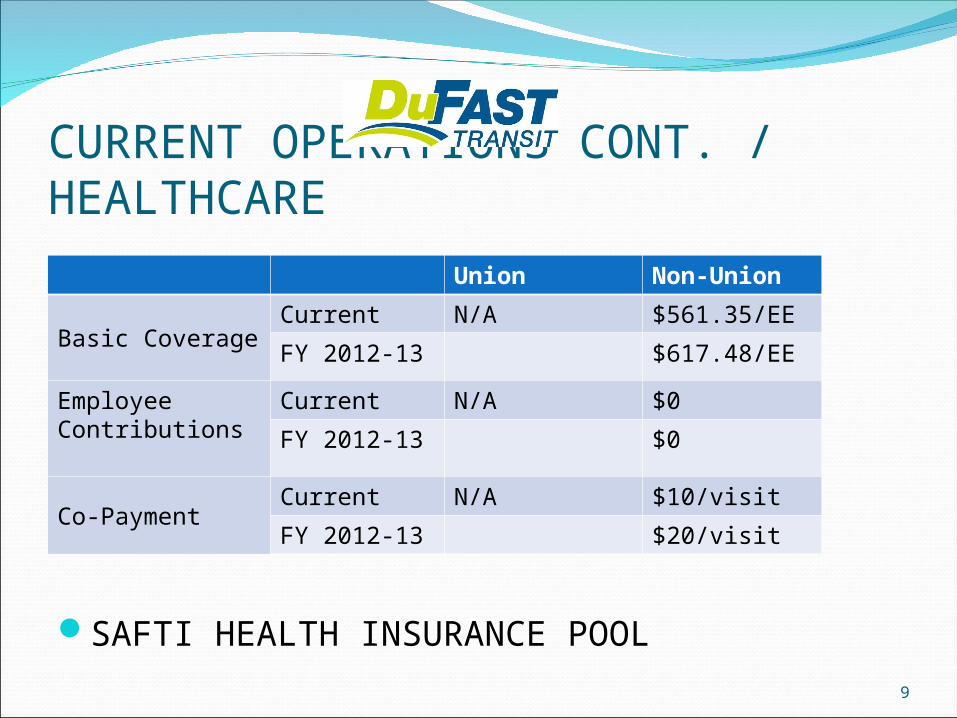
CURRENT OPERATIONS CONT. / HEALTHCARE
SAFTI HEALTH INSURANCE POOL
Union Non-Union
Basic CoverageCurrent N/A $561.35/EE
FY 2012-13 $617.48/EE
Employee Contributions
Current N/A $0
FY 2012-13 $0
Co-PaymentCurrent N/A $10/visit
FY 2012-13 $20/visit
9
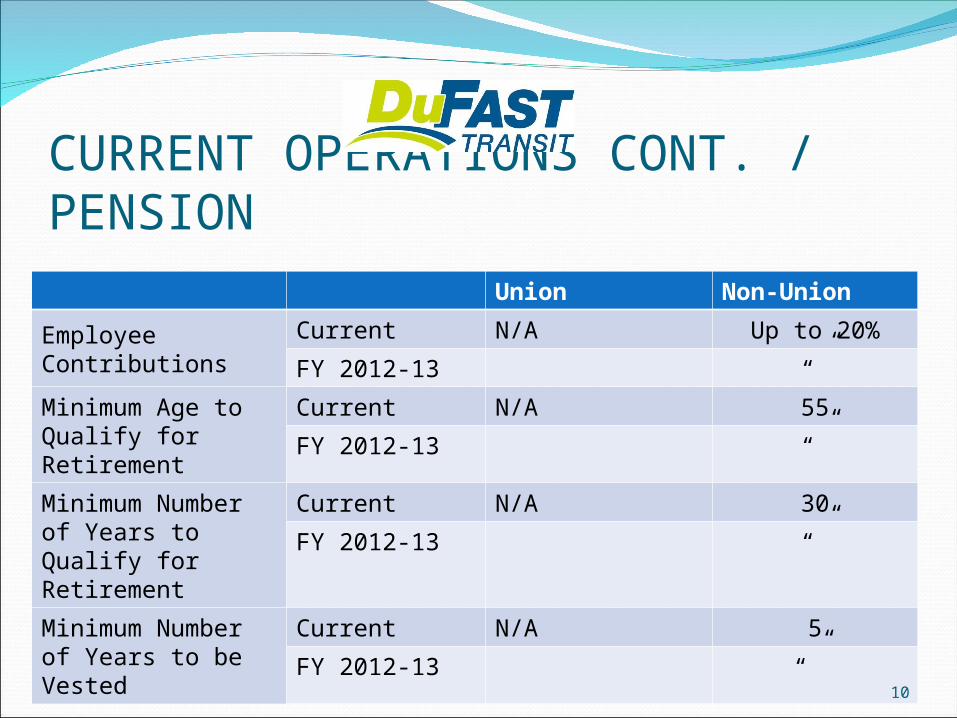
CURRENT OPERATIONS CONT. / PENSIONUnion Non-Union
Employee Contributions
Current N/A Up to 20%
FY 2012-13 “”
Minimum Age to Qualify for Retirement
Current N/A 55
FY 2012-13 “”
Minimum Number of Years to Qualify for Retirement
Current N/A 30
FY 2012-13 “”
Minimum Number of Years to be Vested
Current N/A 5
FY 2012-13 “”
10
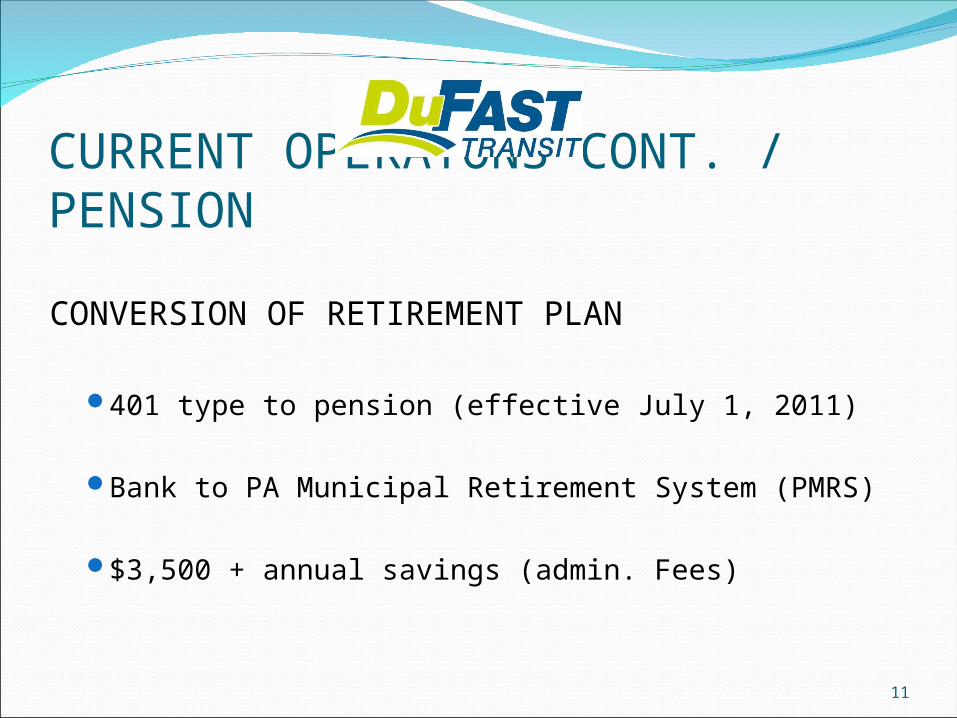
CURRENT OPERATONS CONT. / PENSION
CONVERSION OF RETIREMENT PLAN
401 type to pension (effective July 1, 2011)
Bank to PA Municipal Retirement System (PMRS)
$3,500 + annual savings (admin. Fees)
11
CURRENT OPERATIONS / FUEL$3.19 /gallon Average
No contract. Market rate. Bid annually.
Expires September 30, 2012
Diesel and gasoline (2012 2/3 fleet gas)
12
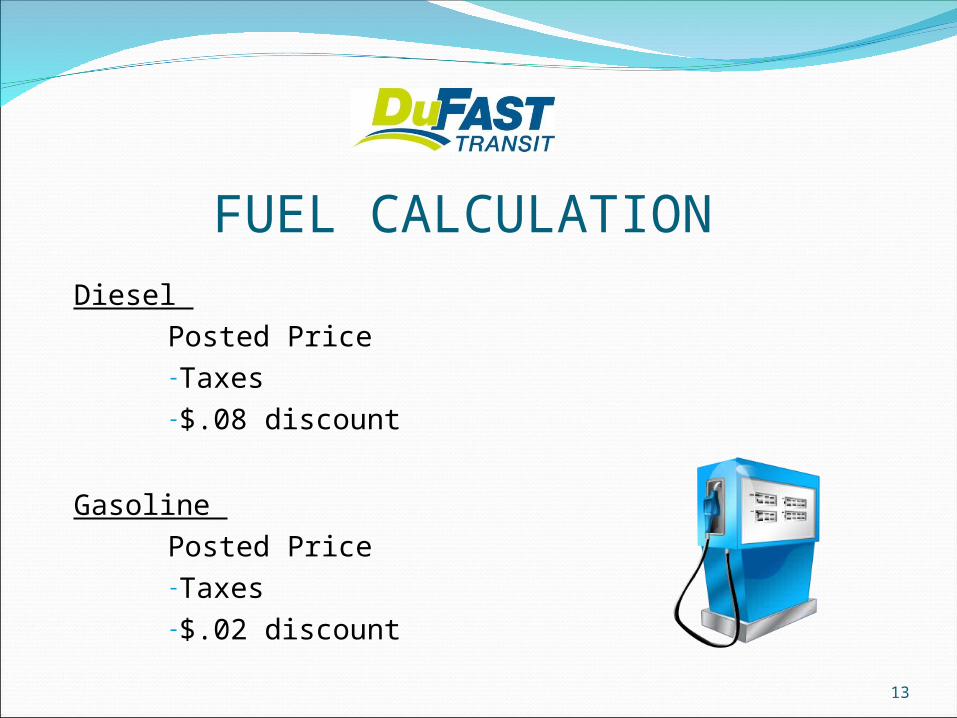
FUEL CALCULATION Diesel
Posted Price-Taxes-$.08 discount
Gasoline Posted Price-Taxes-$.02 discount
13
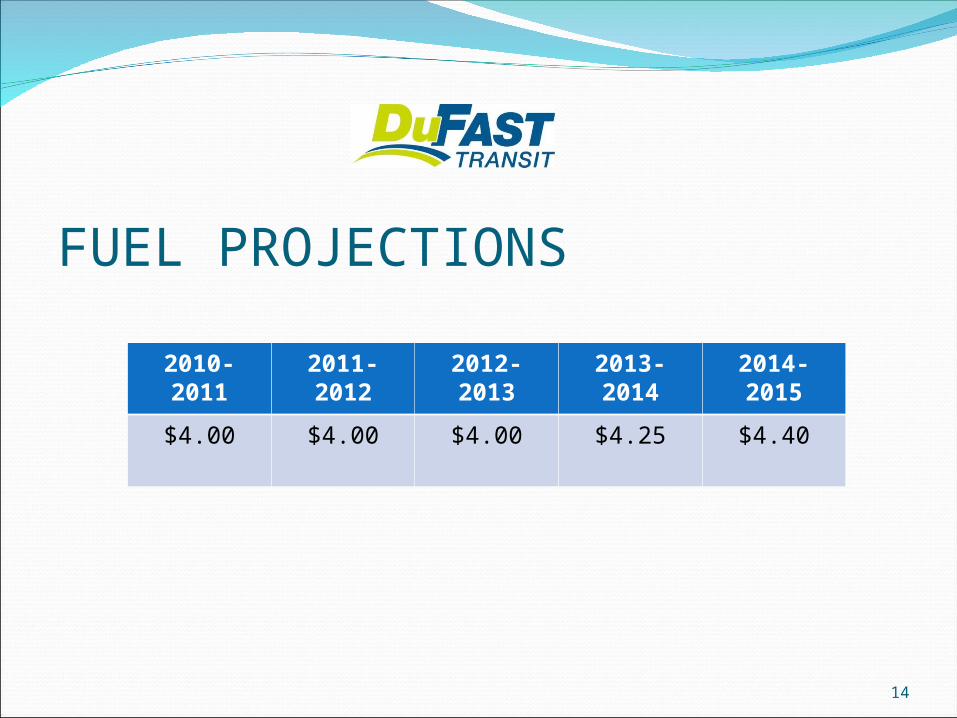
FUEL PROJECTIONS
14
2010-2011
2011-2012
2012-2013
2013-2014
2014-2015
$4.00 $4.00 $4.00 $4.25 $4.40

Fixed Route Fares:Fare Type
Date of Last
Increase
Current Amount
Date of Planned Increase
Amount After
Planned Increase
Base Fare
July 2009
$1.25/adult$.75/student$.50/LOOP
July 2014 $1.50/adult$1.00/student$.50/LOOP
Transfers FREE FREE
Zone Fares N/A N/A N/A N/A
Other multi-ride tickets/passes (Add as appropriate)
AdultStudent Econo
$10$15$30
July 2014 $15----$35
15

Shared Ride Fares: N/ADate of Last Fare Increase
Current Average fareSponsorship arrangements
Planned ChangesDate of planned increase Estimated average fareSponsorship arrangements
Describe Fare Policy16
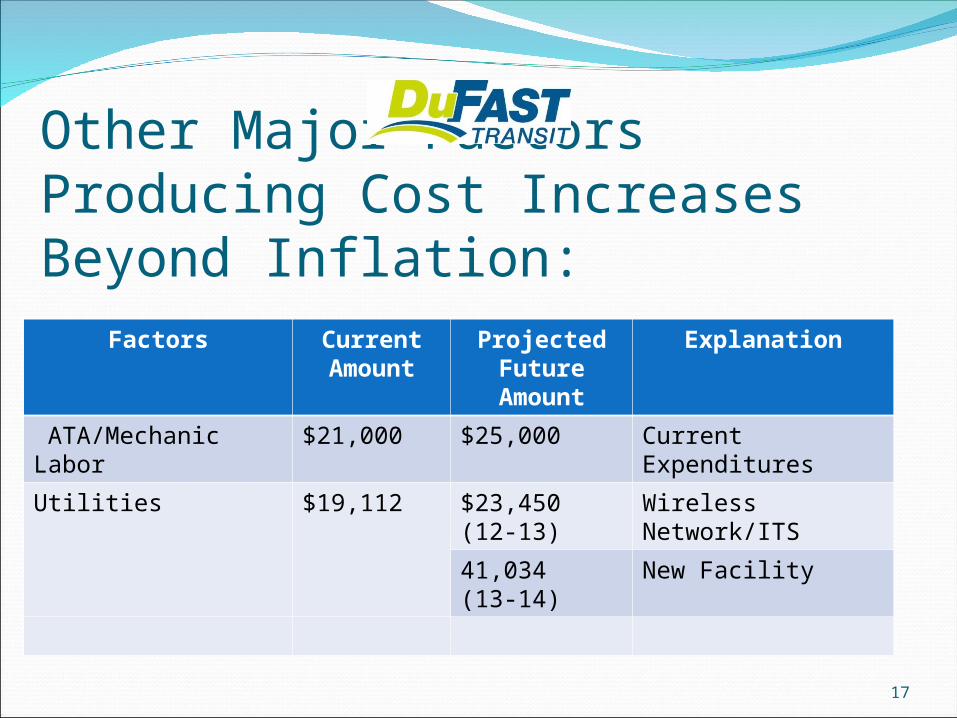
Other Major Factors Producing Cost Increases Beyond Inflation:
Factors Current Amount
Projected Future Amount
Explanation
ATA/Mechanic Labor
$21,000 $25,000 Current Expenditures
Utilities $19,112 $23,450 (12-13)
Wireless Network/ITS
41,034 (13-14)
New Facility
17
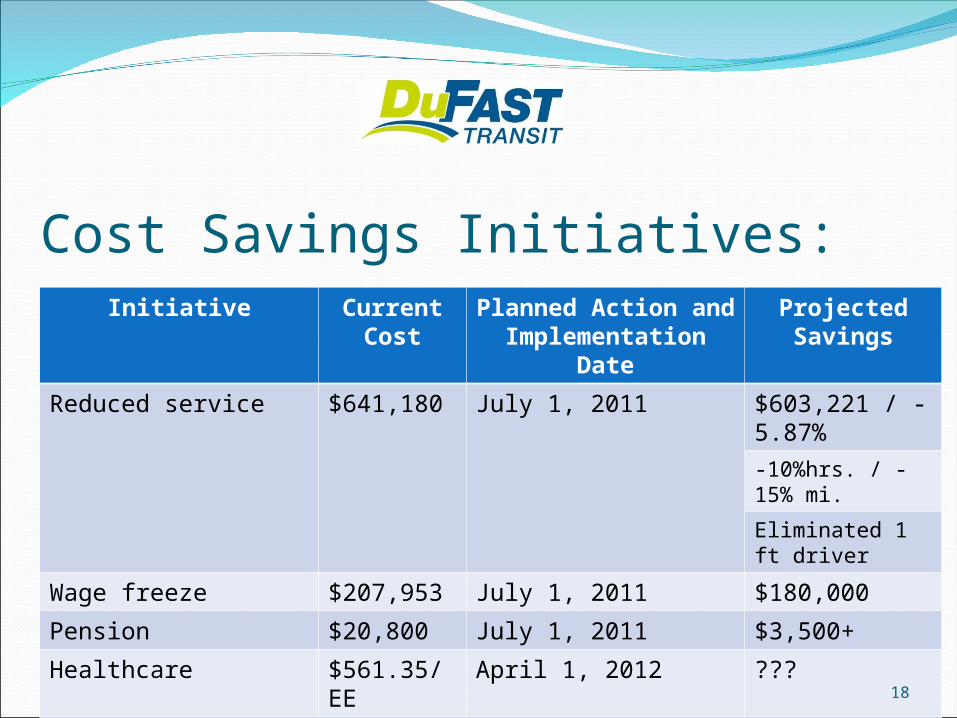
Cost Savings Initiatives:Initiative Current
CostPlanned Action
and Implementation
Date
Projected Savings
Reduced service $641,180 July 1, 2011 $603,221 / -5.87%
-10%hrs. / -15% mi.
Eliminated 1 ft driver
Wage freeze $207,953 July 1, 2011 $180,000
Pension $20,800 July 1, 2011 $3,500+
Healthcare $561.35/EE
April 1, 2012 ???
Marketing materials $35,000 Reduced to $15,000 $20,000
SAFTI W/C & P/L Pool
NEXT PAGE / SLIDE 19
18
19
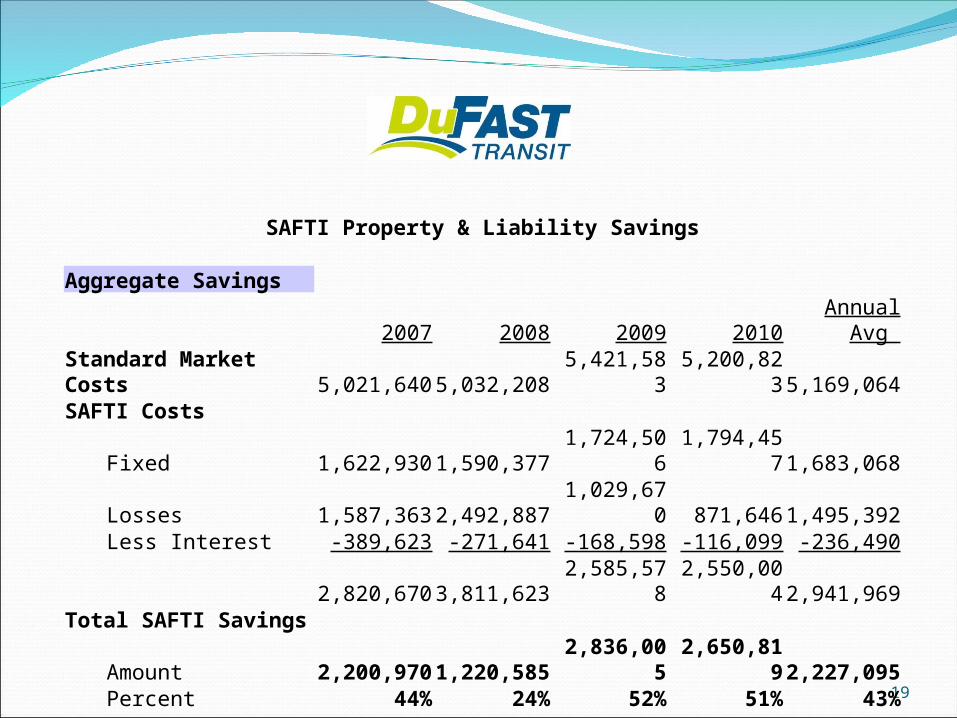
SAFTI Property & Liability Savings
Aggregate Savings2007 2008 2009 2010Annual Avg
Standard Market Costs 5,021,640 5,032,208 5,421,583 5,200,823 5,169,064SAFTI Costs
Fixed 1,622,930 1,590,377 1,724,506 1,794,457 1,683,068Losses 1,587,363 2,492,887 1,029,670 871,646 1,495,392Less Interest -389,623 -271,641 -168,598 -116,099 -236,490
2,820,670 3,811,623 2,585,578 2,550,004 2,941,969Total SAFTI Savings
Amount 2,200,970 1,220,585 2,836,005 2,650,819 2,227,095Percent 44% 24% 52% 51% 43%
Individual Member SavingsDuFAST Transit 9,953 1,178 13,458 10,136 8,682

20
SAFTI Workers Compensation Savings
Aggregate Savings
2007 2008 2009 2010 Annual AvgStandard Market Costs 3,247,049 3,276,128 3,505,540 3,086,971 3,278,922SAFTI Costs 0
Fixed 793,567 809,632 844,081 964,690 852,993Losses 1,262,157 1,666,218 1,169,150 945,420 1,260,736Interest & Non Loss Fund -352,869 -312,747 -169,709 -138,038 -243,341
1,702,855 2,163,103 1,843,522 1,772,072 1,870,388Total SAFTI Savings
Amount 1,544,194 1,113,025 1,662,018 1,314,899 1,408,534Percent 48% 34% 47% 43% 43%
Individual Member SavingsDuFAST Transit 11,559 9,188 9,554 9,237 9,884

Fixed Route FundingFY
2010-11
FY 2011-
12
FY 2012-
13
FY 2013-14
FY 2014-15
Total Operating Expenses
$641,180
$603,221
$639,265
$684,860 $716,345
Total Operating Revenue
$32,159 $22,000 $23,100 $24,252 $28,937
Total Operating Deficit
$609,021
$581,221
$616,165
$660,608
$687,408
Subsidies:
Federal $34,098 $0 $0 $0 $200,980
State $539,287
$544,885
$578,010
$620,545 $444,362
Local $35,636 $36,336 $38,155 $40,063 $42,066
Total Funding $609,021
$581,221
$616,165
$660,608
$687,408
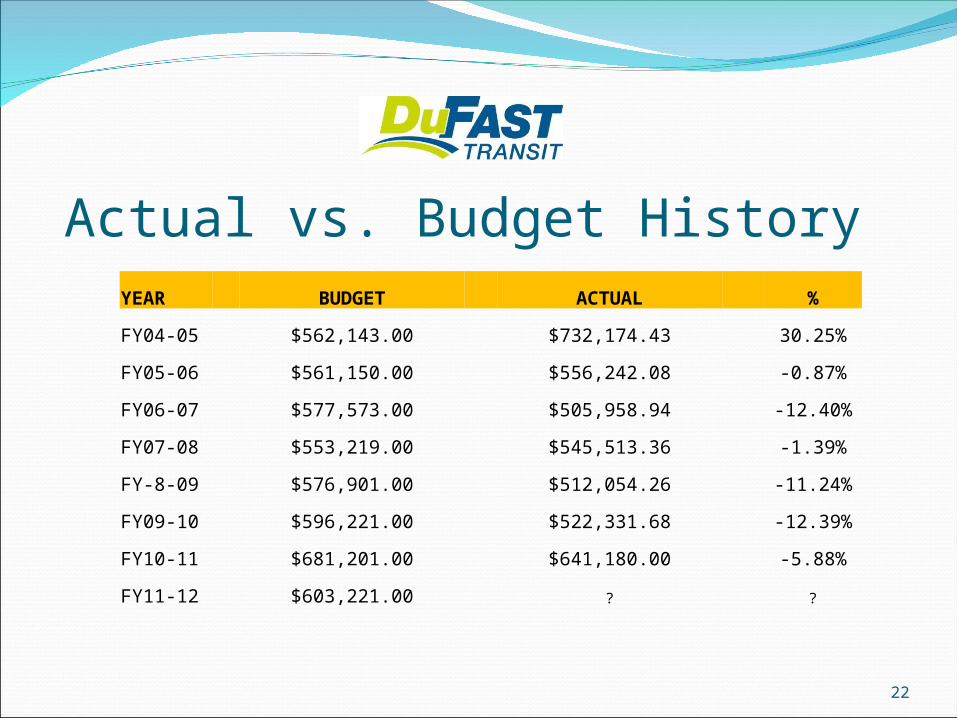
Actual vs. Budget History
22
YEAR BUDGET ACTUAL %
FY04-05 $562,143.00 $732,174.43 30.25%
FY05-06 $561,150.00 $556,242.08 -0.87%
FY06-07 $577,573.00 $505,958.94 -12.40%
FY07-08 $553,219.00 $545,513.36 -1.39%
FY-8-09 $576,901.00 $512,054.26 -11.24%
FY09-10 $596,221.00 $522,331.68 -12.39%
FY10-11 $681,201.00 $641,180.00 -5.88%
FY11-12 $603,221.00 ? ?

Fixed Route Service Statistics/Trends
Describe Any Proposed Changes
Fixed Route FY 2010-11
FY 2011-12
FY 2012-13
FY 2013-14
FY 2014-15
Rev. Veh. Miles
153,101 131,000 131,000 131,000 131,000
Rev. Veh. Hours
11,971 10,500 10,500 10,500 10,500
Passenger Trips
65,783 63,700 66,885 70,229 73,400
ACT 44 PERF. MEASURES
Pass. Trips/Hour
5.49 6.06 6.37 6.68 7.02
Op. Cost/Hour
$53.56 $57.45 $60.88 $65.22 $68.22
Op. Rev./Hour
$2.68 $2.09 $2.20 $2.30 $2.75
Op. Cost/Trip $9.75 $9.47 $9.56 $9.75 $9.71
23

Performance / Statistics Report
24
Current Year to Date Blue Red Green LOOP
This Year Last Year TOTAL PASSENGERS 65,783 56,325 31,380 12,150 12,965 5,718TOTAL VEHCILE MILES 153,101 122,143 40,219 47,783 49,627 12,653TOTAL VEHCILE HOURS 11,971 9,398 3,386 3,432 3,386 1,368REVENUE VEHICLE FUEL (GAL.) 19318.04 19961.60 MILES PER GALLON 7.93 6.12 AVERAGE SPEED 12.79 13.00 11.88 13.92 14.66 9.25 TOTAL REVEUNUES $32,159.00 $26,723.88 $12,567.75 $3,877.75 $4,222.00 $782.00 PER BUS MILE $0.21 $0.22 $0.31 $0.08 $0.09 $0.06 PER BUS HOUR $2.69 $2.84 $3.71 $1.13 $1.25 $0.57 EXPENSES LABOR $306,677 $243,846 FRINGE BENEFITS $97,114 $76,716 SERVICES $73,815 $84,608 MATERIALS & SUPPLIES $22,322 $13,968 FUEL $79,023 $46,578 TIRES & TUBES $2,686 $6,364 UTILITIES $15,448 $12,692 CASUALTY & LIABILITIES $23,578 $45,053 PURCHASED TRANSPORTATION $0 $0 MISC. EXPENSES $20,516 $13,802 LEASES & RENTALS $0 $0
TOTAL EXPENSES $641,179.90 $543,626 $166,706.77 $198,765.77 $205,177.57 $70,529.79 PER BUS MILE $4.19 $4.45 $4.14 $4.16 $4.13 $5.57 PER BUS HOUR $53.56 $57.84 $49.23 $57.92 $60.60 $51.56 PER PASSENGER $9.75 $9.65 $5.31 $16.36 $15.83 $12.33 COST RECOVERY 5.02% 4.92% 7.54% 1.95% 2.06% 1.11% PASSENGERS ADULT FARES 11372 11538 6260 1910 1947 1142 STUDENT FARES 1197 1123 805 68 305 0 ADULT PASS 21763 15010 9626 3318 4359 2350 STUDENT PASS 2391 1939 1530 94 232 24 LOOP PASS 151 n/a n/a n/a n/a 151TOTAL FARE PAYING PASSENGERS 36,874 29,610 18,221 5,390 6,843 3,667 SENIOR CITIZENS 27610 25449 12765 6299 5678 2051 TRANSFERS 1299 1266 394 461 444 0TOTAL OTHER PASSENGERS 28,909 26,715 13,159 6,760 6,122 2,051TOTAL PASSENGERS 65,783 56,325 31,380 12,150 12,965 5,718 PASSENGER PER MILE 0.43 0.46 0.78 0.25 0.26 0.45 PASSENGER PER HOUR 5.50 5.99 9.27 3.54 3.83 4.18 ACCIDENTS 4 n/a INCIDENTS (falls, disputes, etc) 6 n/a COMPLAINTS 8 n/a ACCOLADES 5 n/a

Shared Ride Funding: N/AFY
2010-11
FY 2011-
12
FY 2012-
13
FY 2013-
14
FY 2014-
15
Operating Expense
Passenger Revenue
Lottery
MATP
Other
Balance
25

Shared Ride Statistics/Trends: N/A
26
Shared-Ride FY 2010-11
FY 2011-12
FY 2012-13
FY 2013-14
FY 2014-15
Total Veh. Miles
Cost per Mile
Total Veh. Hours
Cost per Hour
Total Pass. Trips
Cost per Trip
Rev. per Trip
Trips per Hour

Capital Status Review…2010Constructed Bus DepotPosted Bus Stop SignsPurchased 2 vehicles2011Ordered BenchesInitiated ITS Project2012Purchase 2 vehiclesDisplay Advertising RacksSOGR
27
Other Information/Discussion Topics:LOCAL MATCH FUNDING FALLS CREEK BOROUGH TREASURE LAKE, SANDY TOWNSHIP
CENSUS
MARCELLAS SHALE
MOBILITY DEVICES / LOW-FLOOR VEHICLES
ATA COORDINATION
MATP / ITS
28


