1 Agenda • Objectives and outcome • Overview of portfolio management – why you should care • Moore’s Core/Context model – portfolio mgt. for strategy • GE/McKinsey model – analytical portfolio management • Case studies to consider • Some of our “less academic” learning’s about PM
Transcript
1
Agenda
• Objectives and outcome
• Overview of portfolio management – why you should care
• Moore’s Core/Context model – portfolio mgt. for strategy
• GE/McKinsey model – analytical portfolio management
• Case studies to consider
• Some of our “less academic” learning’s about PM
2
Session Objectives
• Understand of the portfolio management process and its application.
• Gain insights into the key success factors, best practices and common pitfalls in portfolio planning.
• Apply what we learned from the classroom to strategic and operational decisions you face.
• The strategy development, evaluation, prioritization and optimal allocation of investment dollars for a set of competing opportunities: markets, businesses, strategic initiatives or investment projects
• The allocation of resources (people, skillsets, capacity) to a set of competing projects or opportunities to maximize the value and throughput of the project pipeline or operation of the business
In both types of PM, the challenge is to:
• Optimize the value output for any given level of financial or human resource input.
• Align the portfolio in support of the organization’s overall strategy and strategic intent
4
The three high-level goals of PM are:
1. Strategic alignment—active investments are necessary and sufficient for the strategy to succeed • The active investments are on-strategy (Strategic Fit) • The active investments truly enable our strategic intent &
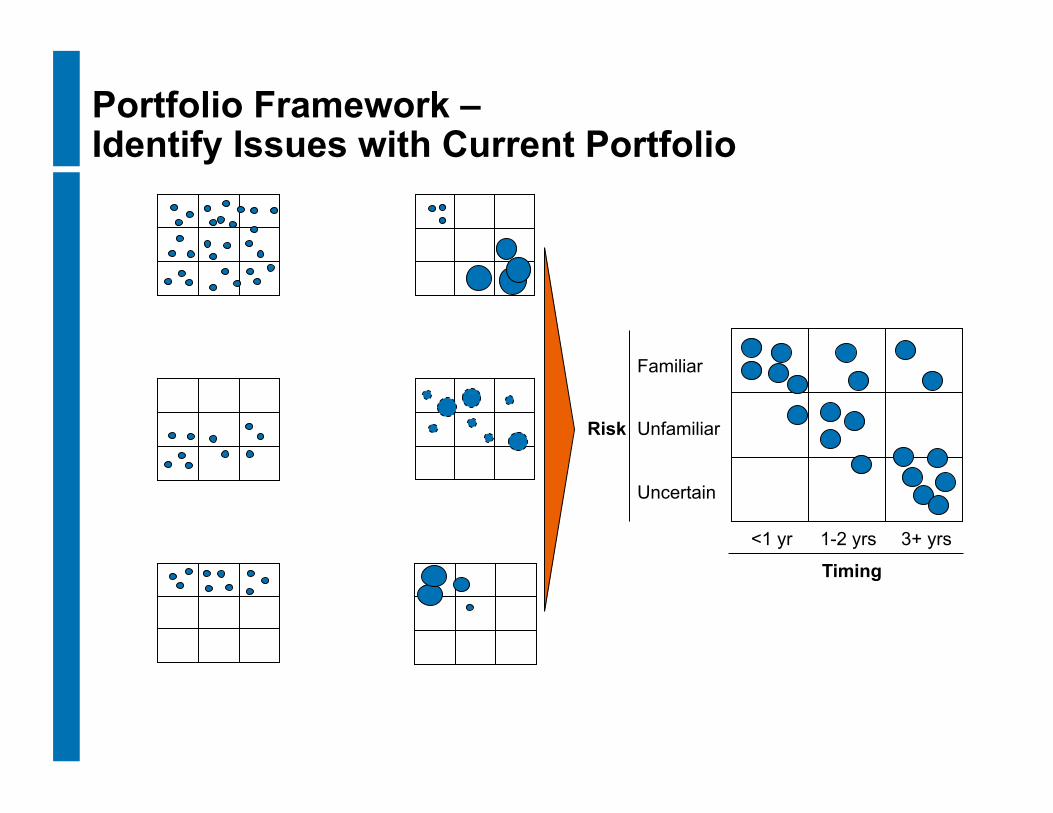
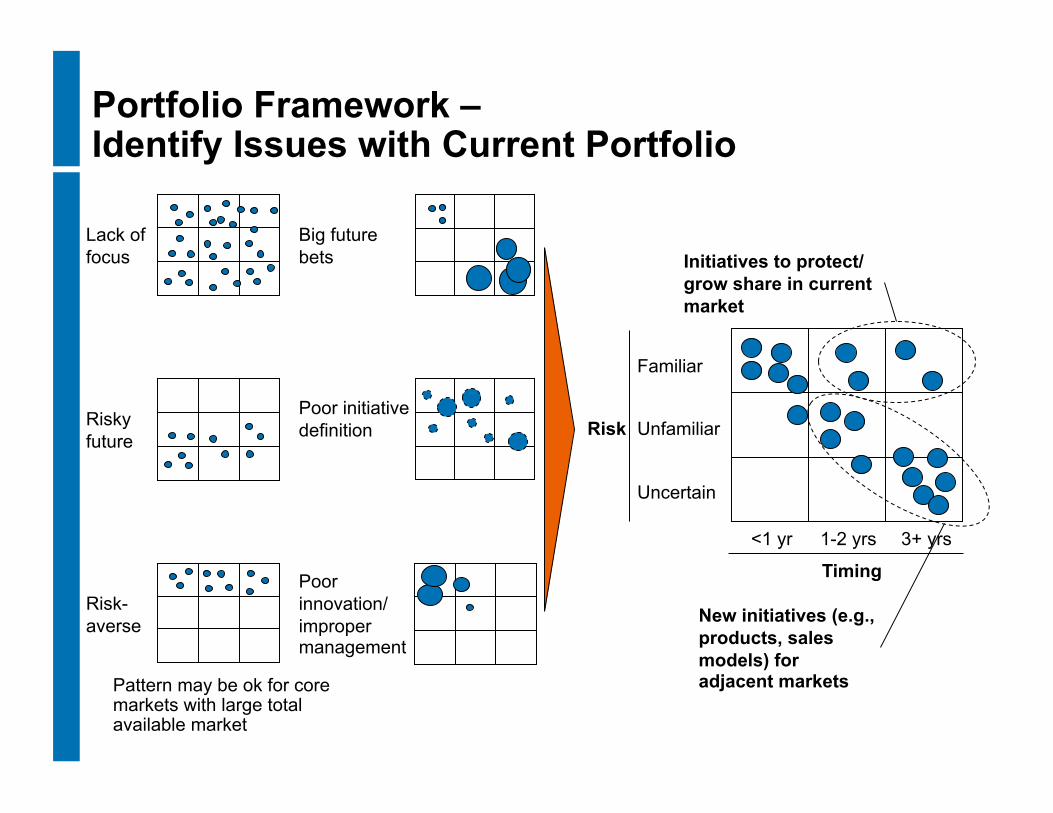
direction 2. Strategic balance—active investments have a “desired” mix or
balance across multiple important dimensions • Long-term vs. short-term, Core/Emerging/New markets • High-risk vs. low-risk, Risk vs. reward • Markets of Interest, Business Models, etc.
3. Maximum return • The portfolio is designed to make optimal use of scarce
resources to achieve desired objectives.
5
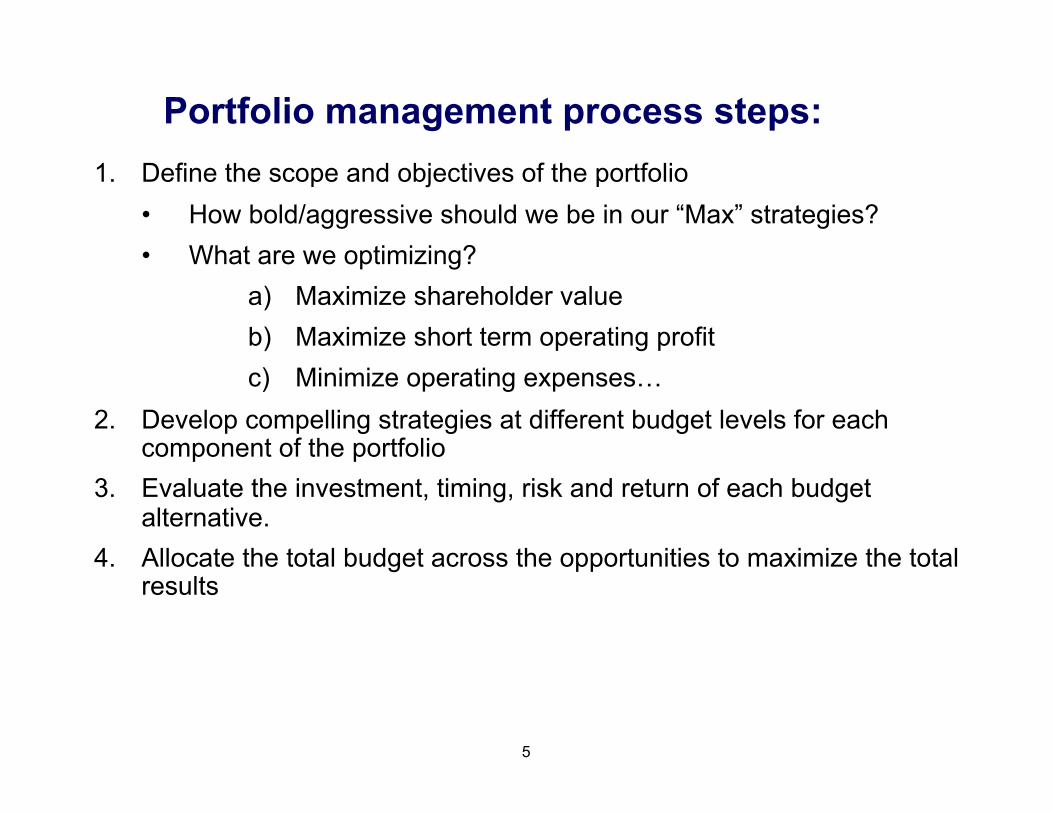
Portfolio management process steps: 1. Define the scope and objectives of the portfolio
• How bold/aggressive should we be in our “Max” strategies? • What are we optimizing?
a) Maximize shareholder value b) Maximize short term operating profit c) Minimize operating expenses…
2. Develop compelling strategies at different budget levels for each component of the portfolio
3. Evaluate the investment, timing, risk and return of each budget alternative.
4. Allocate the total budget across the opportunities to maximize the total results
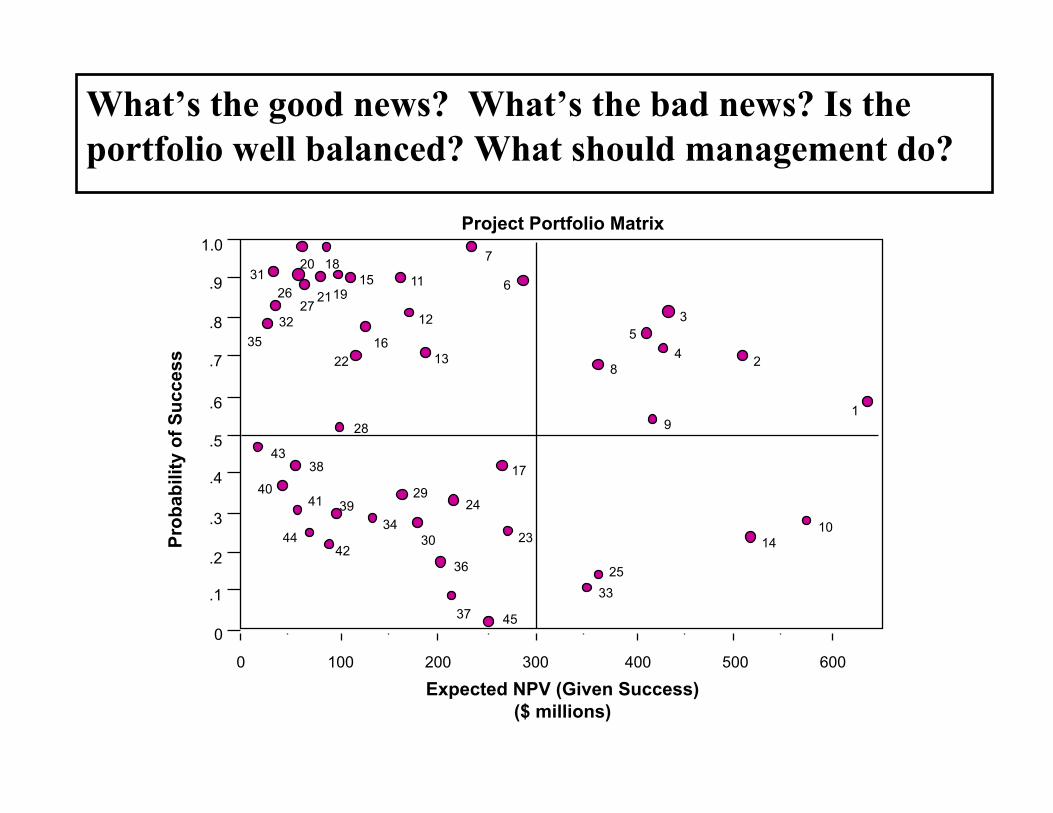
6
7
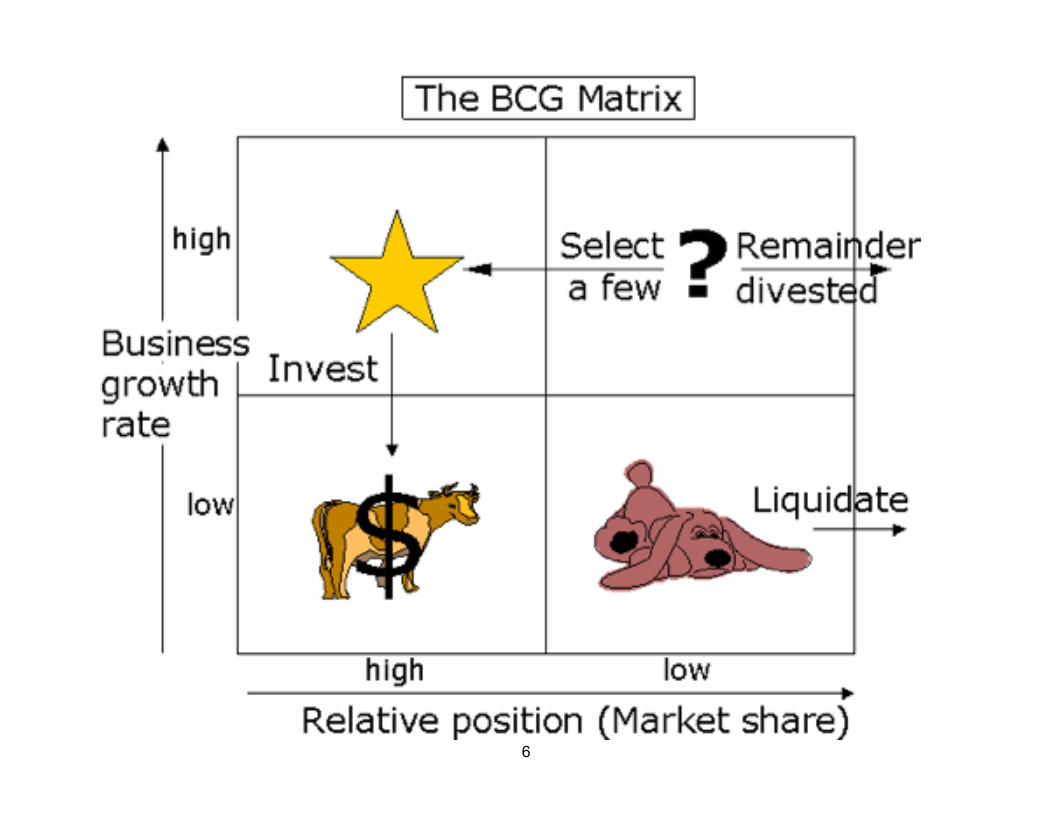
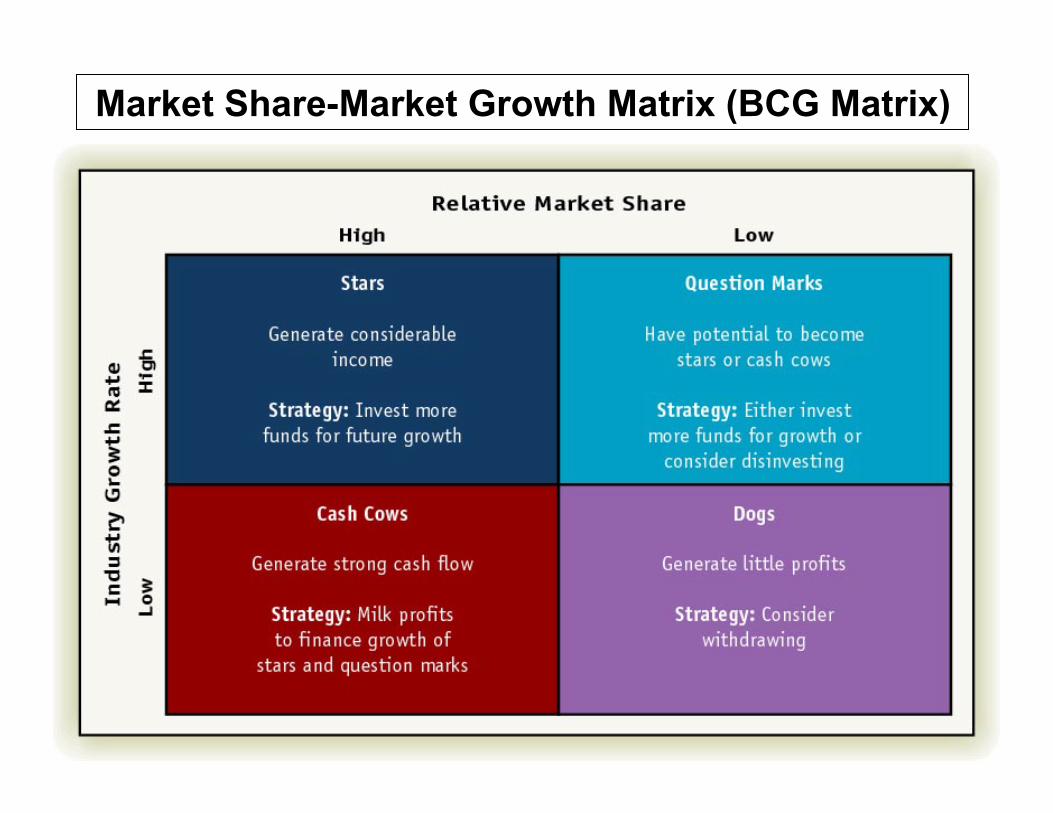
Market Share-Market Growth Matrix (BCG Matrix)
8
LES Marketing (excludes FPM)
The BCG matrix method is based on the product life cycle theory that can be used to determine what priorities should be given in the product portfolio of a business unit.
To ensure long-term value creation, a company should have a portfolio of products that contains both high-growth products in need of cash inputs and low-growth products that generate a lot of cash.
It has 2 dimensions: market share and market growth. The basic idea behind it is the bigger the market share a product has or the faster the product’s market grows, the better it is for the company.
9
LES Marketing (excludes FPM)
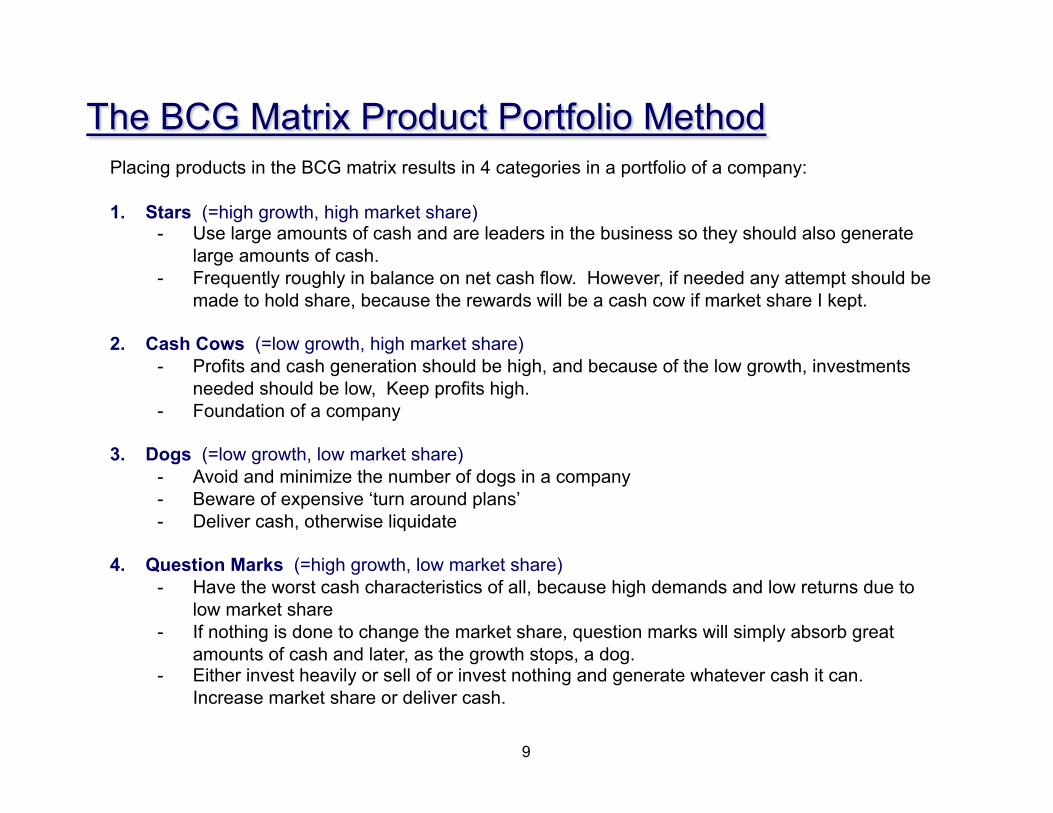
Placing products in the BCG matrix results in 4 categories in a portfolio of a company:
1. Stars (=high growth, high market share) - Use large amounts of cash and are leaders in the business so they should also generate
large amounts of cash. - Frequently roughly in balance on net cash flow. However, if needed any attempt should be
made to hold share, because the rewards will be a cash cow if market share I kept.
2. Cash Cows (=low growth, high market share) - Profits and cash generation should be high, and because of the low growth, investments
needed should be low, Keep profits high. - Foundation of a company
3. Dogs (=low growth, low market share) - Avoid and minimize the number of dogs in a company - Beware of expensive ‘turn around plans’ - Deliver cash, otherwise liquidate
4. Question Marks (=high growth, low market share) - Have the worst cash characteristics of all, because high demands and low returns due to
low market share - If nothing is done to change the market share, question marks will simply absorb great
amounts of cash and later, as the growth stops, a dog. - Either invest heavily or sell of or invest nothing and generate whatever cash it can.
Increase market share or deliver cash.
10
LES Marketing (excludes FPM)
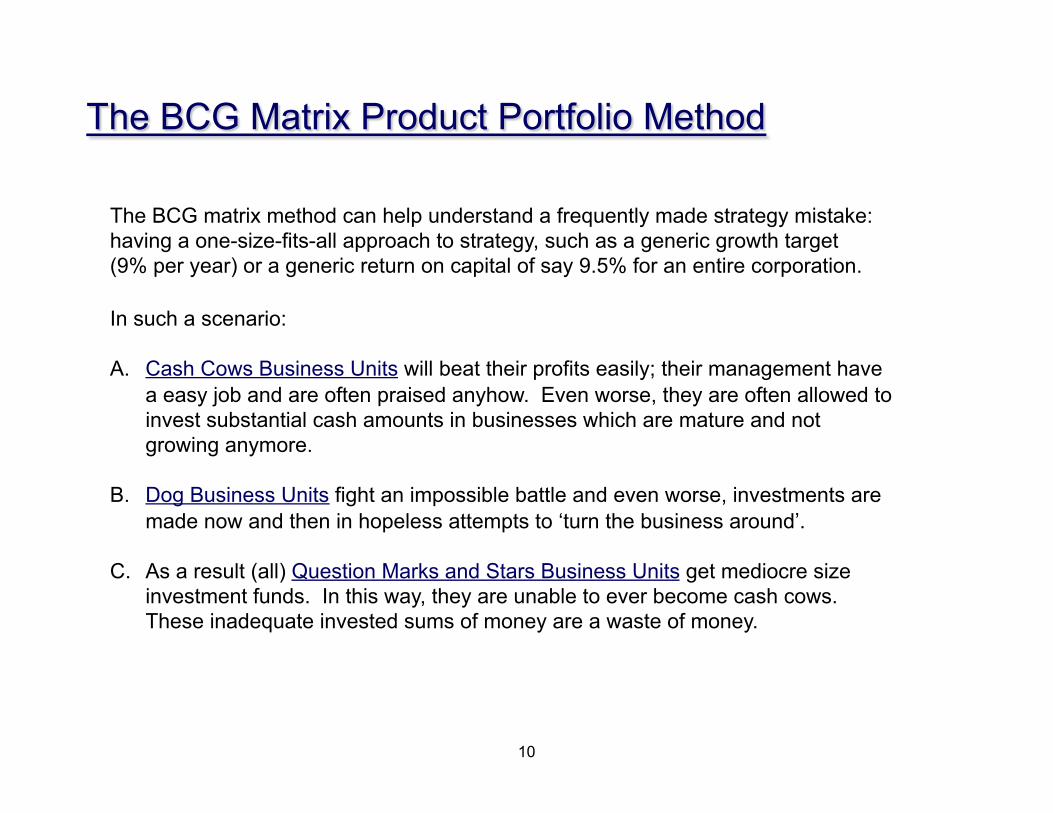
In such a scenario:
A. Cash Cows Business Units will beat their profits easily; their management have a easy job and are often praised anyhow. Even worse, they are often allowed to invest substantial cash amounts in businesses which are mature and not growing anymore.
B. Dog Business Units fight an impossible battle and even worse, investments are made now and then in hopeless attempts to ‘turn the business around’.
C. As a result (all) Question Marks and Stars Business Units get mediocre size investment funds. In this way, they are unable to ever become cash cows. These inadequate invested sums of money are a waste of money.
The BCG matrix method can help understand a frequently made strategy mistake: having a one-size-fits-all approach to strategy, such as a generic growth target (9% per year) or a generic return on capital of say 9.5% for an entire corporation.
11
LES Marketing (excludes FPM)
Some limitations of the Boston Consulting Group Matrix include:
• High market share is not the only success factor
• Market growth is not the only indicator for attractiveness of a market
• Sometimes dogs can earn as much cash as Cash Cows
Defining Core and Context Nuances Relative to Hierarchy of Powers
Definition of Core Definition of Context
Category High growth Low growth (or worse)
Company High market share within category Low market share within category
Market High market share within segment Low market share within segment
Offer High differentiation vs. competition Low differentiation vs. competition
Program High differentiation vs. competition Low differentiation vs. competition
14
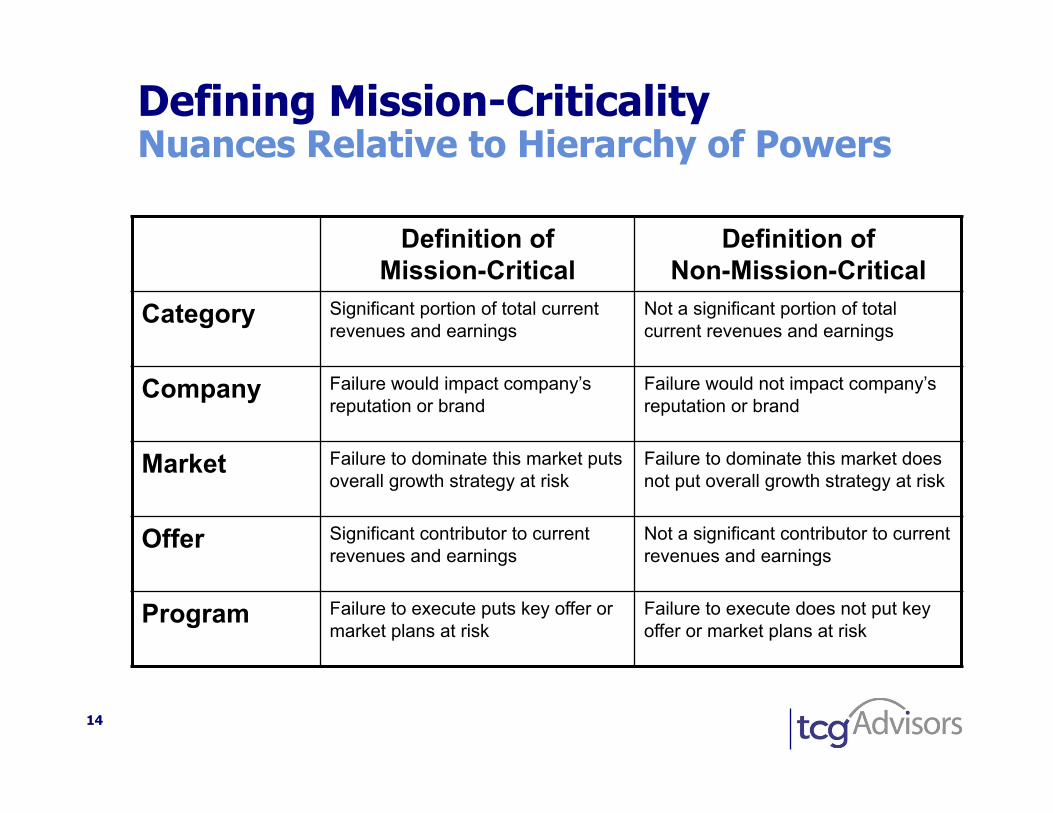
Defining Mission-Criticality Nuances Relative to Hierarchy of Powers
Definition of Mission-Critical
Definition of Non-Mission-Critical
Category Significant portion of total current revenues and earnings
Not a significant portion of total current revenues and earnings
Company Failure would impact company’s reputation or brand
Failure would not impact company’s reputation or brand
Market Failure to dominate this market puts overall growth strategy at risk
Failure to dominate this market does not put overall growth strategy at risk
Offer Significant contributor to current revenues and earnings
Not a significant contributor to current revenues and earnings
Program Failure to execute puts key offer or market plans at risk
Failure to execute does not put key offer or market plans at risk
15
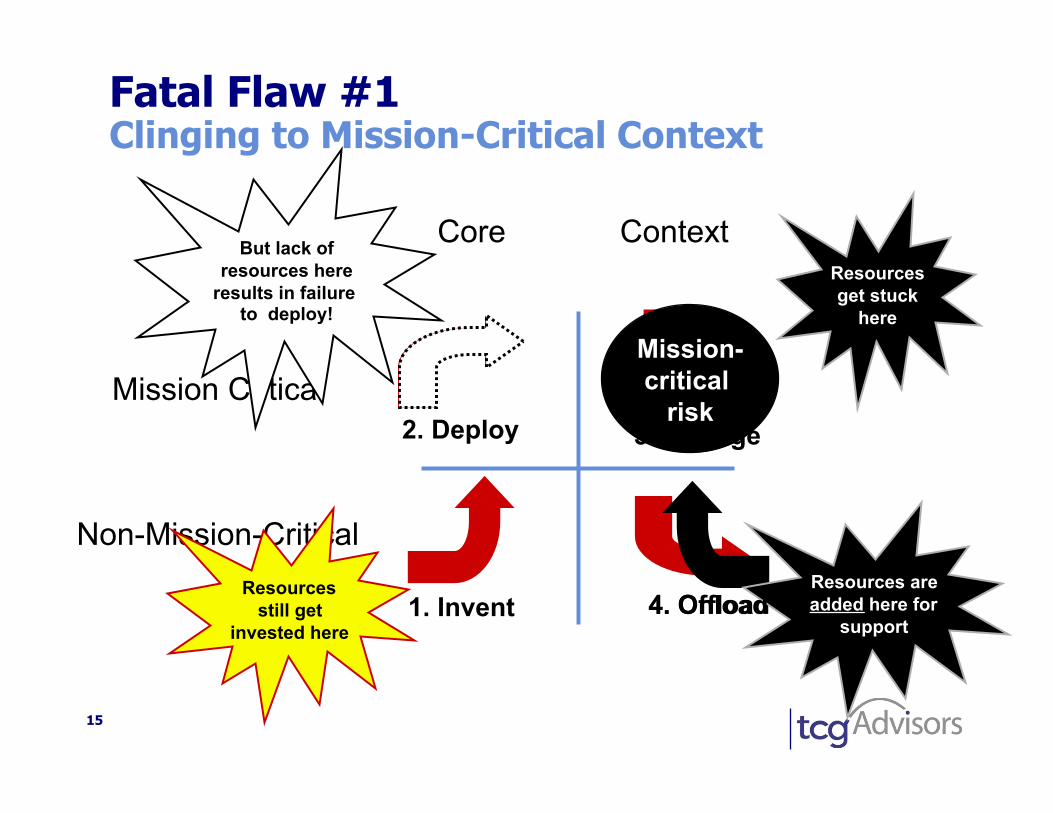
Mission Critical
Non-Mission-Critical
Fatal Flaw #1 Clinging to Mission-Critical Context
2. Deploy
1. Invent
3. Manage
4. Offload
Resources get stuck
here
Resources are added here for
support
Resources still get
invested here
But lack of resources here
results in failure to deploy!
4. Onload
Mission- critical
risk
Core Context
16
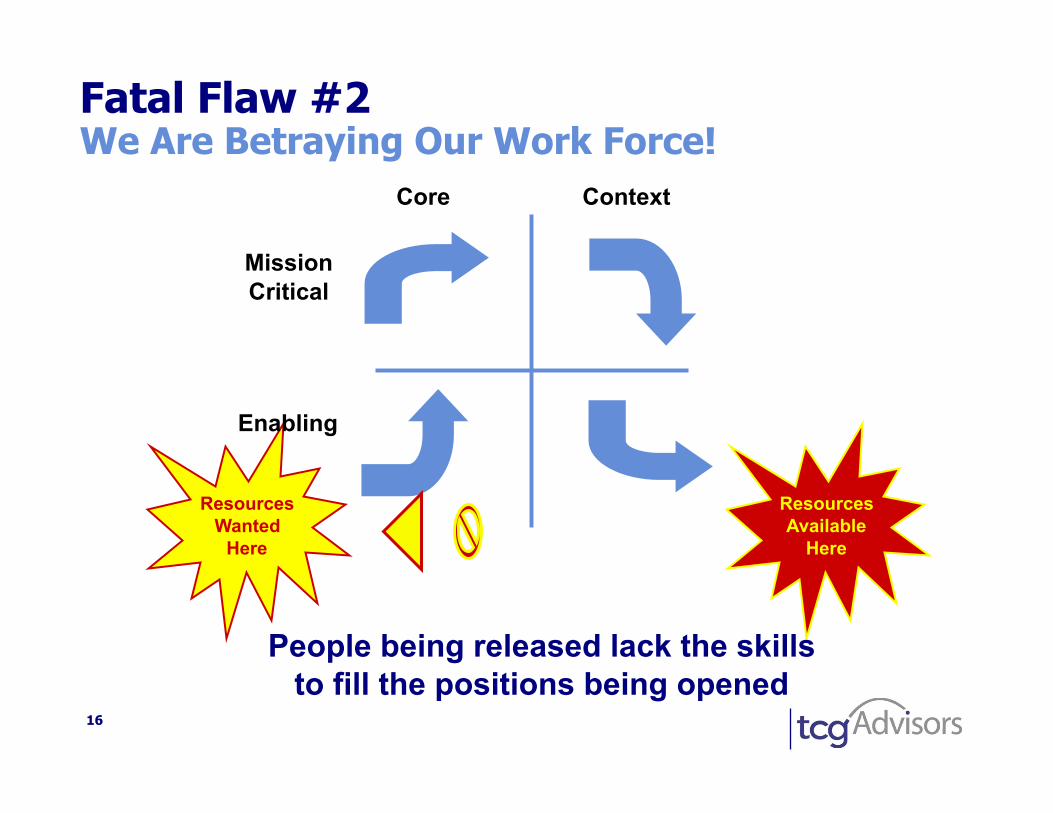
Fatal Flaw #2 We Are Betraying Our Work Force!
Resources Available
Here
Resources Wanted
Here
Core Context
Mission Critical
Enabling
People being released lack the skills to fill the positions being opened
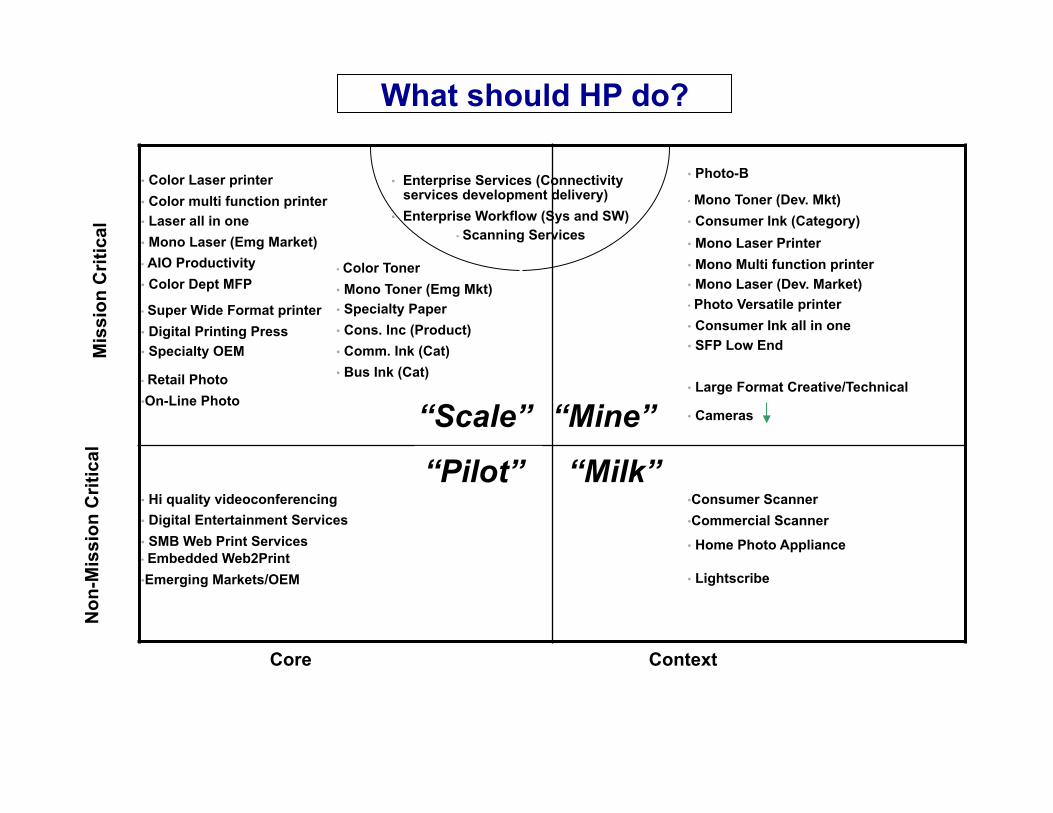
Core Context
Non
-Mis
sion
Crit
ical
M
issi
on C
ritic
al
• Color Laser printer • Color multi function printer • Laser all in one • Mono Laser (Emg Market) • Mono Laser Printer
• Mono Multi function printer • Mono Laser (Dev. Market)
• Enterprise Services (Connectivity services development delivery)
• Enterprise Workflow (Sys and SW)
• AIO Productivity • Color Dept MFP
• Photo Versatile printer • Consumer Ink all in one • SFP Low End
• Consumer Scanner • Commercial Scanner
• Scanning Services
• Super Wide Format printer • Digital Printing Press • Specialty OEM
• Large Format Creative/Technical
• Lightscribe
• Hi quality videoconferencing
• Retail Photo • On-Line Photo
• Photo-B
• Cameras
• Home Photo Appliance
• Digital Entertainment Services • SMB Web Print Services
• Color Toner • Mono Toner (Emg Mkt) • Specialty Paper • Cons. Inc (Product) • Comm. Ink (Cat) • Bus Ink (Cat)
• Mono Toner (Dev. Mkt) • Consumer Ink (Category)
• Embedded Web2Print • Emerging Markets/OEM
1
What should HP do?
“Pilot”
“Scale” “Mine”
“Milk”
18
GE/McKinsey Model
Business Strength/competitiveness
Indu
stry
/Mar
ket
attra
ctiv
enes
s
Medium
High
High
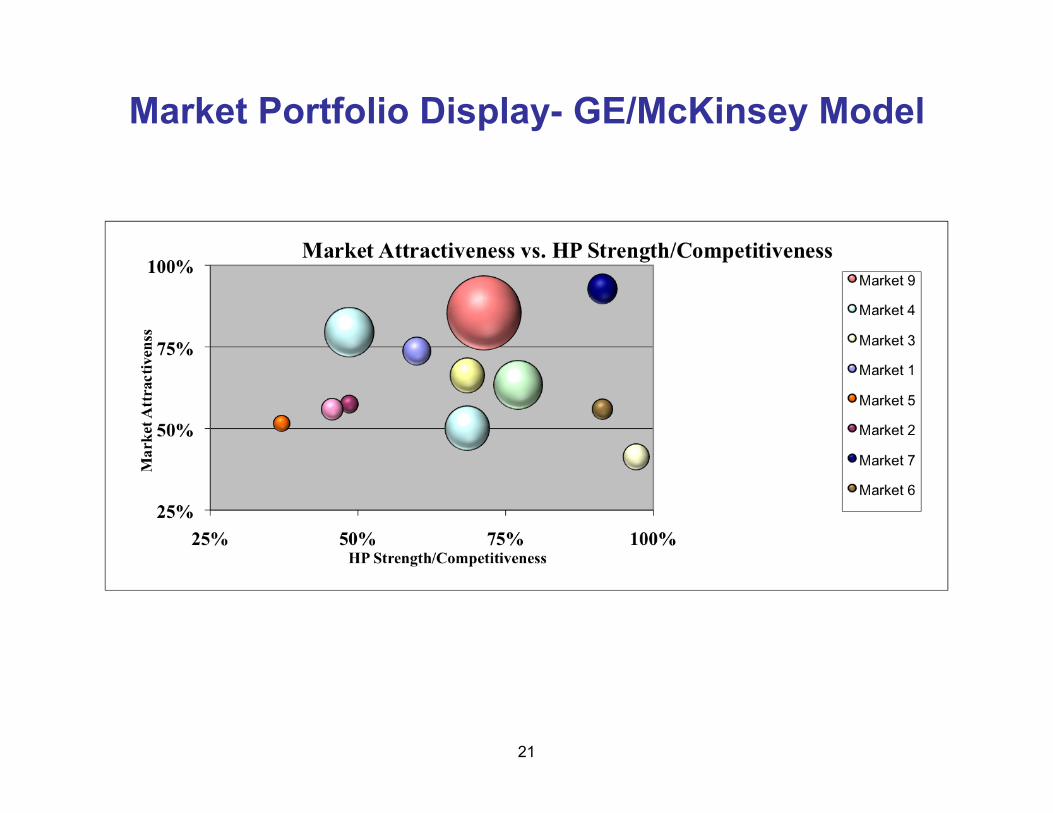
• The GE/McKinsey matrix was developed as a more advanced form of the best known portfolio planning model – Boston Consulting Group matrix (Stars, dogs, cash cows and question marks)
• BCG model was a 2X2 based on market growth and market share.
• GE/McKinsey model is more sophisticated in three aspects: 1. Market/Industry attractiveness replaces market growth as the dimension of industry
attractiveness and includes a much broader range of “attractiveness” factors. 2. Competitive strength replaces market share as the dimension by which competitive
position is determined, also including a broader range of factors. 3. Works with a 3X3 grid
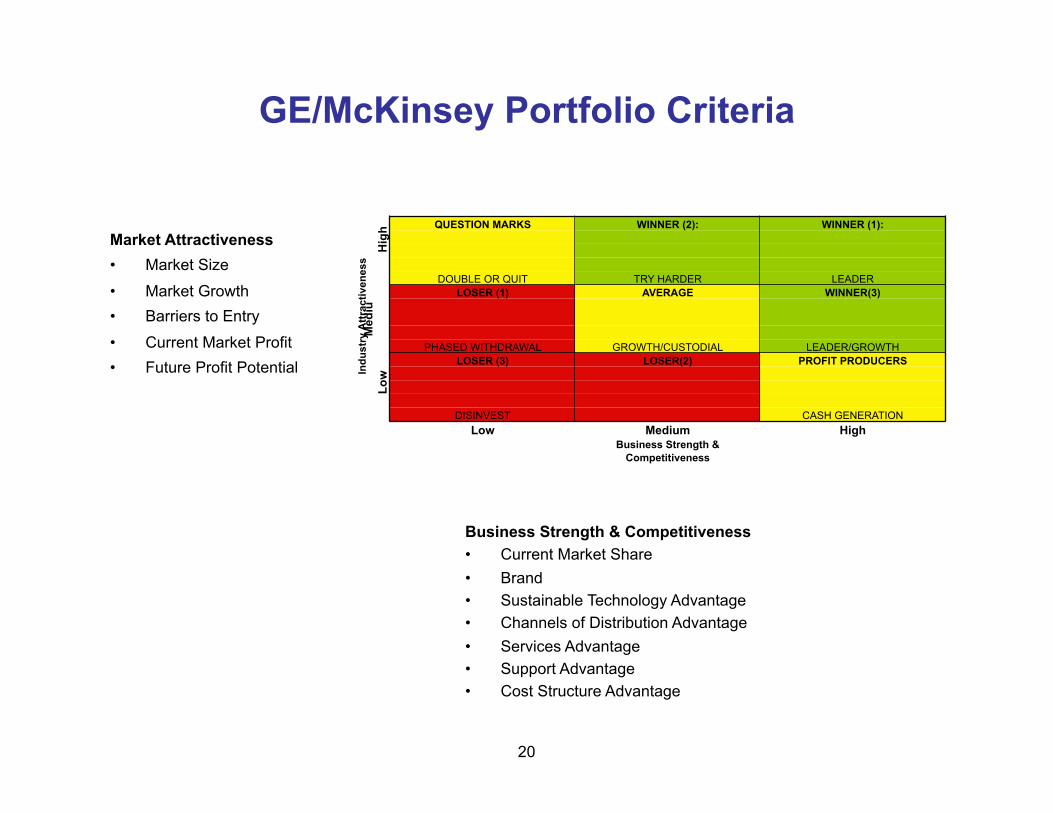
• The goal: The optimal business portfolio that fits the companies strengths and exploits the most attractive markets.
• Market Size • Market Growth rate • Barriers to Entry • Current Market Profit • Future Profit Potential • Competitive intensity • Overall risk of returns in the industry • Opportunity for differentiation • Demand variability • Segmentation • Distribution structure • Technology development
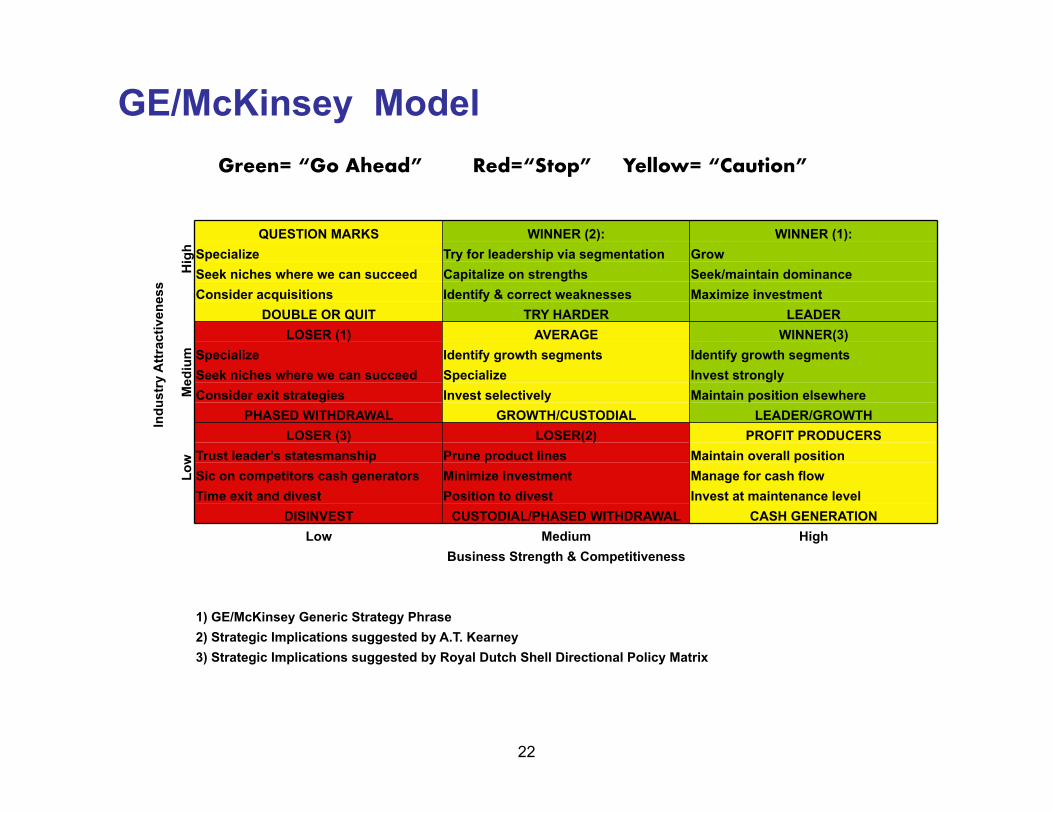
GE/McKinsey Model Green= “Go Ahead” Red=“Stop” Yellow= “Caution”
Hig
h
QUESTION MARKS WINNER (2): WINNER (1): Specialize Try for leadership via segmentation Grow Seek niches where we can succeed Capitalize on strengths Seek/maintain dominance
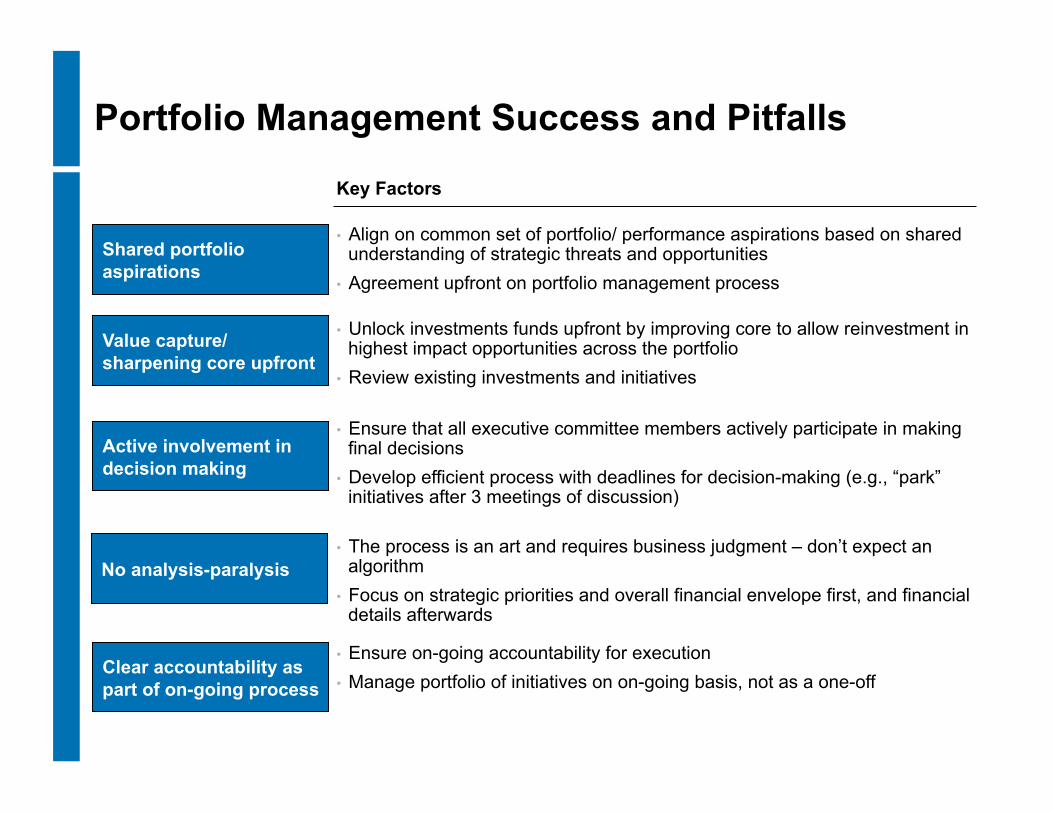
• Align on common set of portfolio/ performance aspirations based on shared understanding of strategic threats and opportunities
• Agreement upfront on portfolio management process
Active involvement in decision making
Shared portfolio aspirations
Key Factors
• Ensure that all executive committee members actively participate in making final decisions
• Develop efficient process with deadlines for decision-making (e.g., “park” initiatives after 3 meetings of discussion)
Value capture/ sharpening core upfront
• Unlock investments funds upfront by improving core to allow reinvestment in highest impact opportunities across the portfolio
• Review existing investments and initiatives
• The process is an art and requires business judgment – don’t expect an algorithm
• Focus on strategic priorities and overall financial envelope first, and financial details afterwards
• Ensure on-going accountability for execution • Manage portfolio of initiatives on on-going basis, not as a one-off
Clear accountability as part of on-going process
No analysis-paralysis
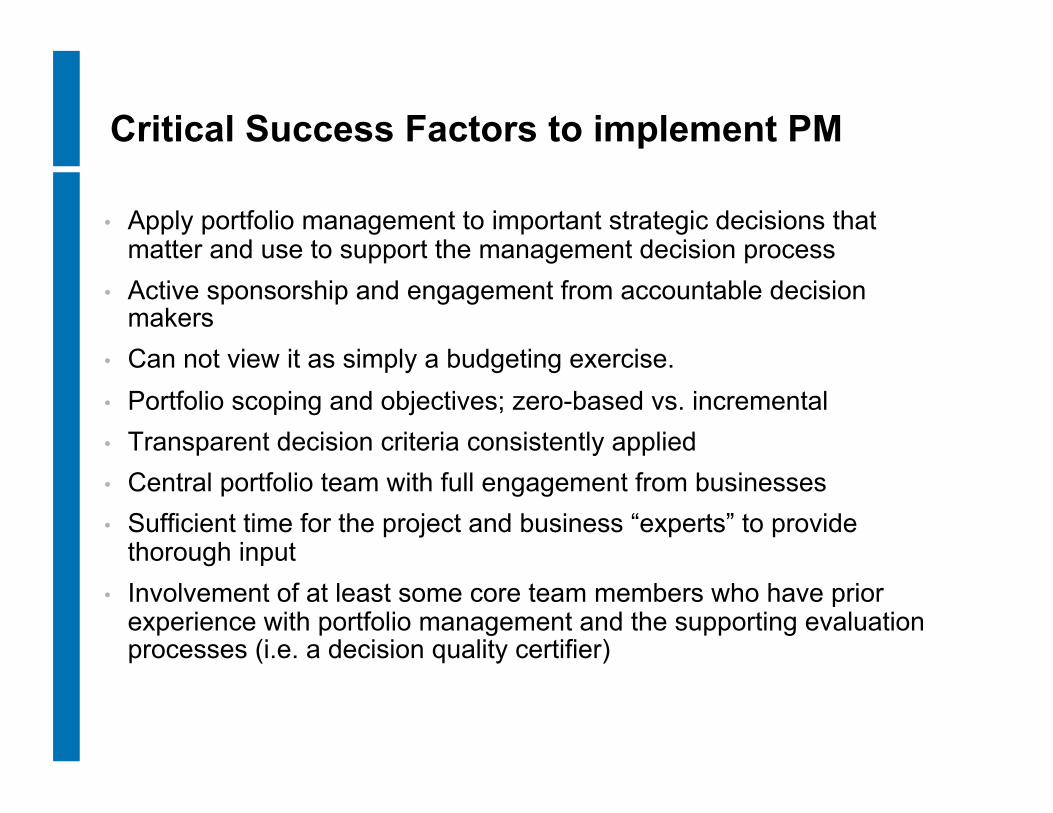
Critical Success Factors to implement PM
• Apply portfolio management to important strategic decisions that matter and use to support the management decision process
• Active sponsorship and engagement from accountable decision makers
• Can not view it as simply a budgeting exercise. • Portfolio scoping and objectives; zero-based vs. incremental • Transparent decision criteria consistently applied • Central portfolio team with full engagement from businesses • Sufficient time for the project and business “experts” to provide
thorough input • Involvement of at least some core team members who have prior
experience with portfolio management and the supporting evaluation processes (i.e. a decision quality certifier)
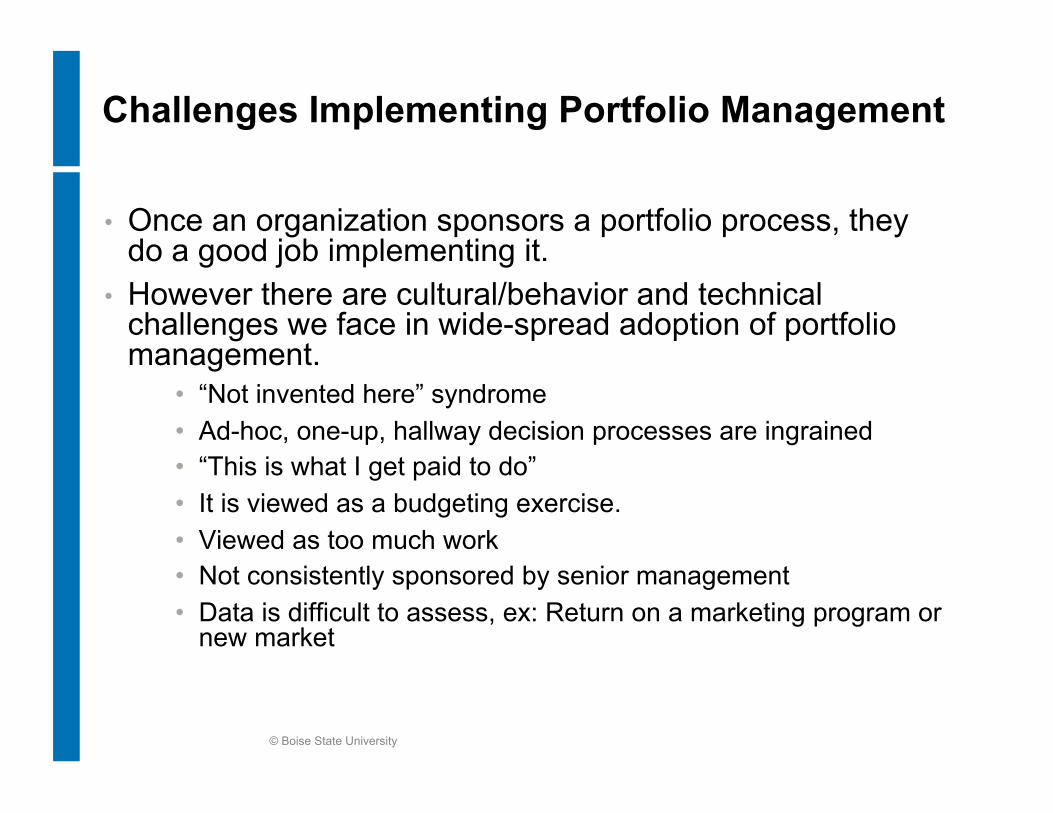
Challenges Implementing Portfolio Management
• Once an organization sponsors a portfolio process, they do a good job implementing it.
• However there are cultural/behavior and technical challenges we face in wide-spread adoption of portfolio management.
• “Not invented here” syndrome • Ad-hoc, one-up, hallway decision processes are ingrained • “This is what I get paid to do” • It is viewed as a budgeting exercise. • Viewed as too much work • Not consistently sponsored by senior management • Data is difficult to assess, ex: Return on a marketing program or
Politics in Portfolio Management? • “Where you sit, influences where you stand”. • Bosses’ pet projects or pet people • Back room and side deals being made • Powerful organizations wielding a big stick (usually “core”
businesses) • Fiddling with the denominators • Justification for the answer that is already known • Good portfolio management shouldn’t be about “win-win”.
There are winners and losers. • But, when there are winners and losers, it can throw some
folks in to backup mode • Getting to an answer is hard – implementing the changes
• Communicate. Look for ways to facilitate 2 way dialog and understanding. When you find resistance, ask “what”, not “why” questions.
• Don’t try to put lipstick on a pig – bad news, is bad news -- don’t risk eroding trust.
• Make sure you have measurable goals and break the work in to doable chunks -- both in terms of time (Quick wins are critical) and scope (try to keep ambiguity at senior mgr level).
• Remember, the stronger your business success has been, the harder it is going to be to change.
• What have you learned that you can put to work immediately yourself?
• What have you learned that you can use at work, in this program?
• What have you learned that you would like to use but feel you need more help, support, permission, etc.?
• What obstacles or barriers do you anticipate in doing things to improve the way we make decisions and develop strategies? What could be done to reduce or eliminate these barriers?
43
References
Portfolio Management for New Products, Robert G. Cooper, Scott J. Edgett and Elko J Kleinschmidt, Perseus Books, 1998. The classic survey of methods for NPD portfolio management
“How SmithKline Beecham Makes Better Resource-Allocation Decisions”, Paul Sharpe and Tom Keelin, Harvard Business Review, March-April 1998, Reprint 98210
The Smart Organization, David Matheson & Jim Matheson, Harvard Business School Press, 1998. Chapters 10 discusses R&D portfolio strategy.
Business Portfolio Management, Michael Allen, John Wiley & Sons, New York et al., 2000 One of very few books devoted to business portfolio management