1 Agent Network Accelerator Survey: Bangladesh Country Report 2014 November, 2014 Contributing Authors: Aakash Mehrotra, Denny George, Graham A.N. Wright, Leena Anthony, Maha Khan, Mike McCaffrey, Pawan Bakhshi
Transcript
1
Agent Network Accelerator Survey: Bangladesh Country Report 2014
November, 2014
Contributing Authors: Aakash Mehrotra, Denny George, Graham A.N. Wright, Leena Anthony,
Maha Khan, Mike McCaffrey, Pawan Bakhshi
2
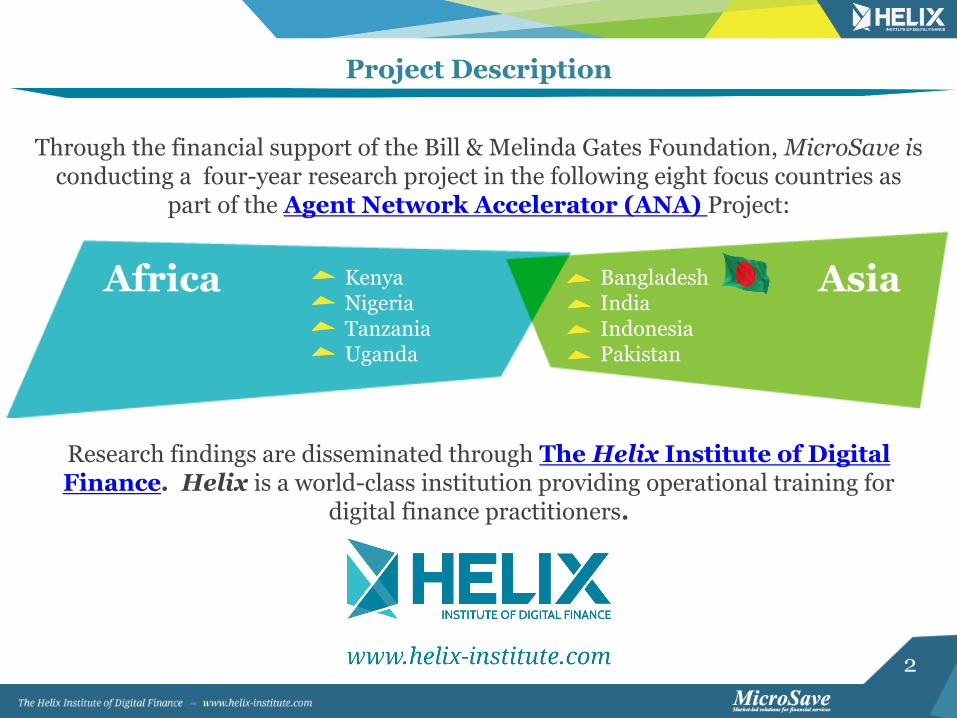
Through the financial support of the Bill & Melinda Gates Foundation, MicroSave is conducting a four-year research project in the following eight focus countries as
part of the Agent Network Accelerator (ANA) Project:
Research findings are disseminated through The Helix Institute of Digital Finance. Helix is a world-class institution providing operational training for
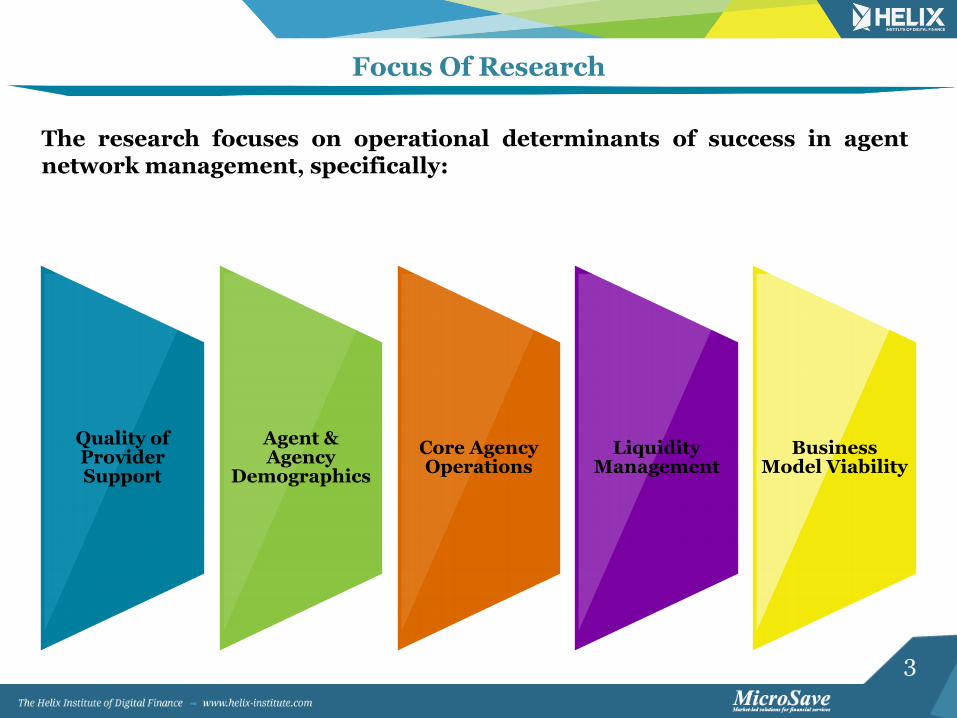
The research focuses on operational determinants of success in agent network management, specifically:
Focus Of Research
Quality of Provider Support
Agent & Agency
Demographics
Core Agency Operations
Liquidity Management
Business Model Viability
4
57%
Total Sample Size
Location Exclusivity
2,490 2393 576
District HQ
Metro Non-
Dedicated Thana
HQ
Non-Exclusive
Exclusive Dedicated
958
Dedication
859 1082 1408 97
Sample Profile*
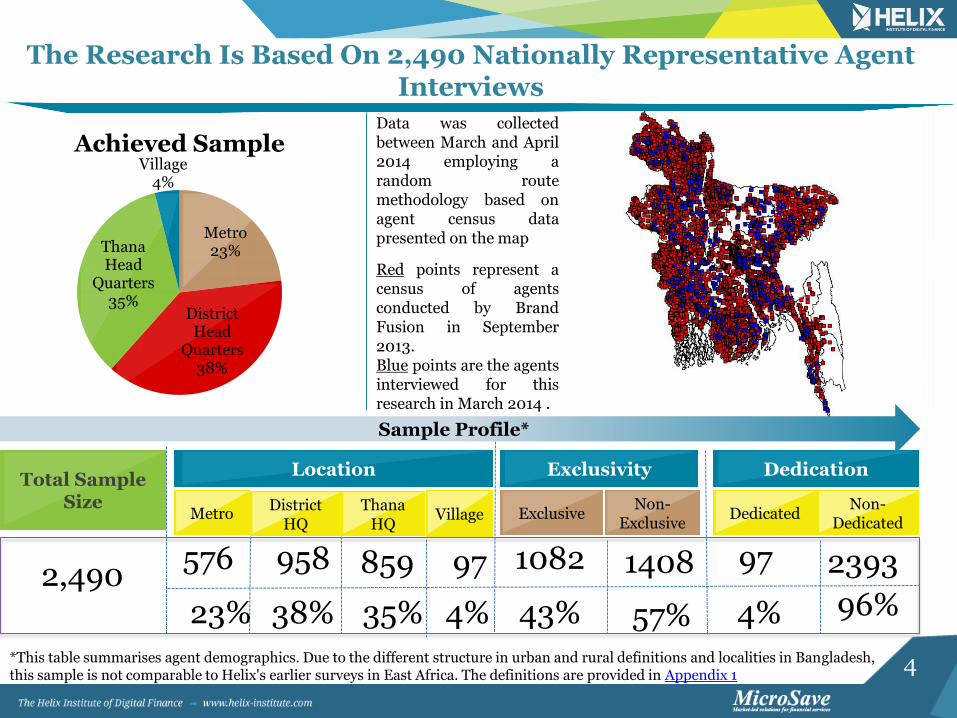
The Research Is Based On 2,490 Nationally Representative Agent Interviews
Red points represent a census of agents conducted by Brand Fusion in September 2013. Blue points are the agents interviewed for this research in March 2014 .
*This table summarises agent demographics. Due to the different structure in urban and rural definitions and localities in Bangladesh, this sample is not comparable to Helix's earlier surveys in East Africa. The definitions are provided in Appendix 1
Data was collected between March and April 2014 employing a random route methodology based on agent census data presented on the map
Village
97
Metro 23%
District Head
Quarters 38%
Thana Head
Quarters 35%
Village 4%
Achieved Sample
23% 38% 35% 4% 43% 4% 96%
5
Transaction volumes are very low compared to East Africa, but very low operational costs keep the majority of agents profitable.
Most agents have rebalancing done for them at their outlets, and
report rarely having to deny a transaction for lack of it.
Almost all agents are non-dedicated, and while bKash is the dominant provider, other providers seem to be quickly building their networks on top of bKash’s, meaning the majority of agents are now
non-exclusive.
Bangladesh has created many unique systems for agent network management which are yielding world class results especially with regards
to liquidity management. However, transaction volumes and profits are low compared to East Africa and support structures are still developing.
Bangladesh Overview
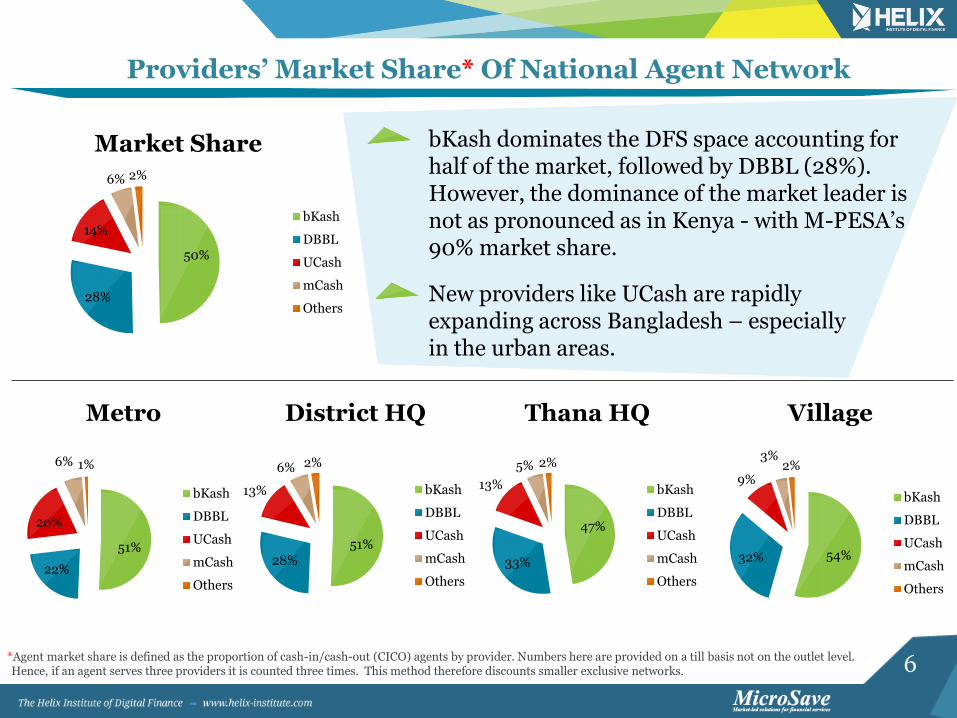
6 *Agent market share is defined as the proportion of cash-in/cash-out (CICO) agents by provider. Numbers here are provided on a till basis not on the outlet level. Hence, if an agent serves three providers it is counted three times. This method therefore discounts smaller exclusive networks.
Providers’ Market Share* Of National Agent Network
bKash dominates the DFS space accounting for half of the market, followed by DBBL (28%). However, the dominance of the market leader is not as pronounced as in Kenya - with M-PESA’s 90% market share.
New providers like UCash are rapidly expanding across Bangladesh – especially in the urban areas.
50%
28%
14%
6% 2%
Market Share
bKash
DBBL
UCash
mCash
Others
51%
22%
20%
6% 1%
Metro
bKash
DBBL
UCash
mCash
Others
51% 28%
13%
6% 2%
District HQ
bKash
DBBL
UCash
mCash
Others
47%
33%
13%
5% 2%
Thana HQ
bKash
DBBL
UCash
mCash
Others
54% 32%
9%
3% 2%
Village
bKash
DBBL
UCash
mCash
Others
7
Digital Finance Is Relatively New And So Are Most Agents
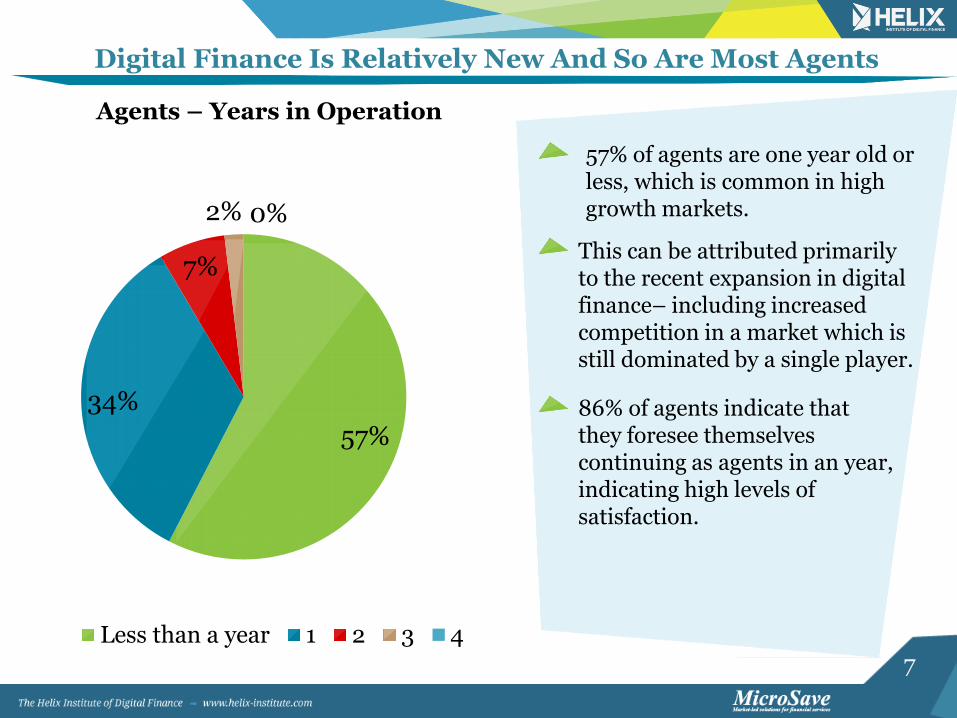
57%
34%
7%
2% 0%
Agents – Years in Operation
Less than a year 1 2 3 4
57% of agents are one year old or less, which is common in high growth markets.
This can be attributed primarily to the recent expansion in digital finance– including increased competition in a market which is still dominated by a single player.
86% of agents indicate that they foresee themselves continuing as agents in an year, indicating high levels of satisfaction.
8
44%
96%
48%
71%
56%
4%
52%
29%
0%
10%
20%
30%
40%
50%
60%
70%
80%
90%
100%
Bangladesh Kenya Tanzania Uganda
Exclusive Non-Exclusive
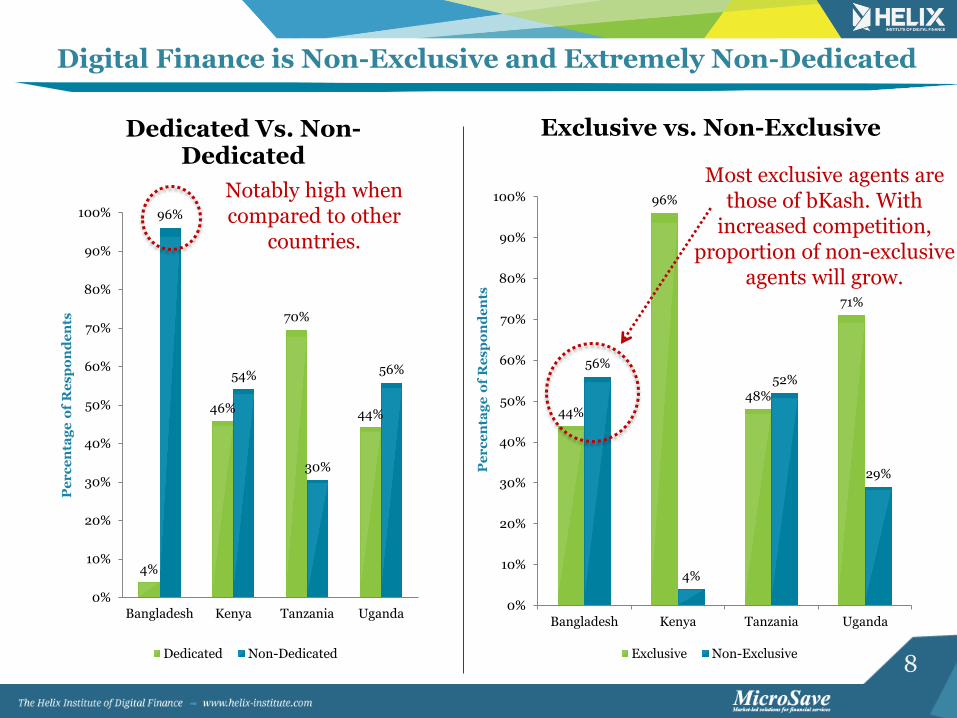
Digital Finance is Non-Exclusive and Extremely Non-Dedicated
4%
46%
70%
44%
96%
54%
30%
56%
0%
10%
20%
30%
40%
50%
60%
70%
80%
90%
100%
Bangladesh Kenya Tanzania Uganda
Pe
rc
en
tag
e o
f R
es
po
nd
en
ts
Dedicated Vs. Non-Dedicated
Dedicated Non-Dedicated
Notably high when compared to other
countries.
Most exclusive agents are those of bKash. With
increased competition, proportion of non-exclusive
agents will grow.
Pe
rc
en
tag
e o
f R
es
po
nd
en
ts
Exclusive vs. Non-Exclusive
9
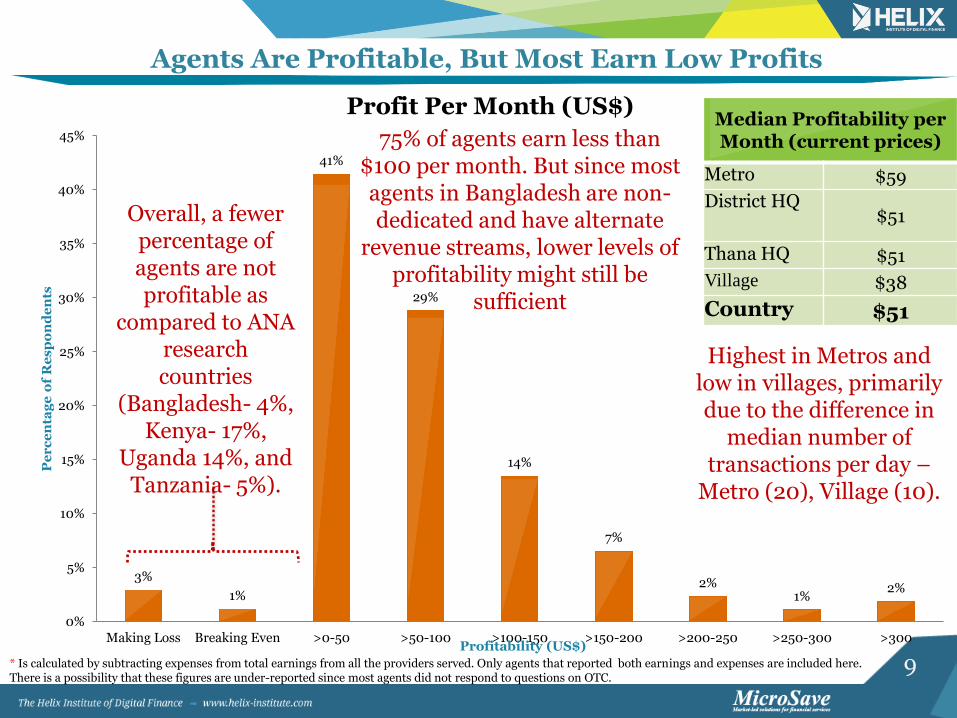
3%
1%
41%
29%
14%
7%
2% 1%
2%
0%
5%
10%
15%
20%
25%
30%
35%
40%
45%
Making Loss Breaking Even >0-50 >50-100 >100-150 >150-200 >200-250 >250-300 >300
Pe
rc
en
tag
e o
f R
es
po
nd
en
ts
Profitability (US$)
Profit Per Month (US$)
Highest in Metros and low in villages, primarily due to the difference in
median number of transactions per day –
Metro (20), Village (10).
Agents Are Profitable, But Most Earn Low Profits
Median Profitability per Month (current prices)
Metro $59
District HQ $51
Thana HQ $51
Village $38
Country $51
Overall, a fewer percentage of agents are not profitable as
compared to ANA research countries
(Bangladesh- 4%, Kenya- 17%,
Uganda 14%, and Tanzania- 5%).
75% of agents earn less than $100 per month. But since most agents in Bangladesh are non-dedicated and have alternate
revenue streams, lower levels of profitability might still be
sufficient
* Is calculated by subtracting expenses from total earnings from all the providers served. Only agents that reported both earnings and expenses are included here. There is a possibility that these figures are under-reported since most agents did not respond to questions on OTC.
10
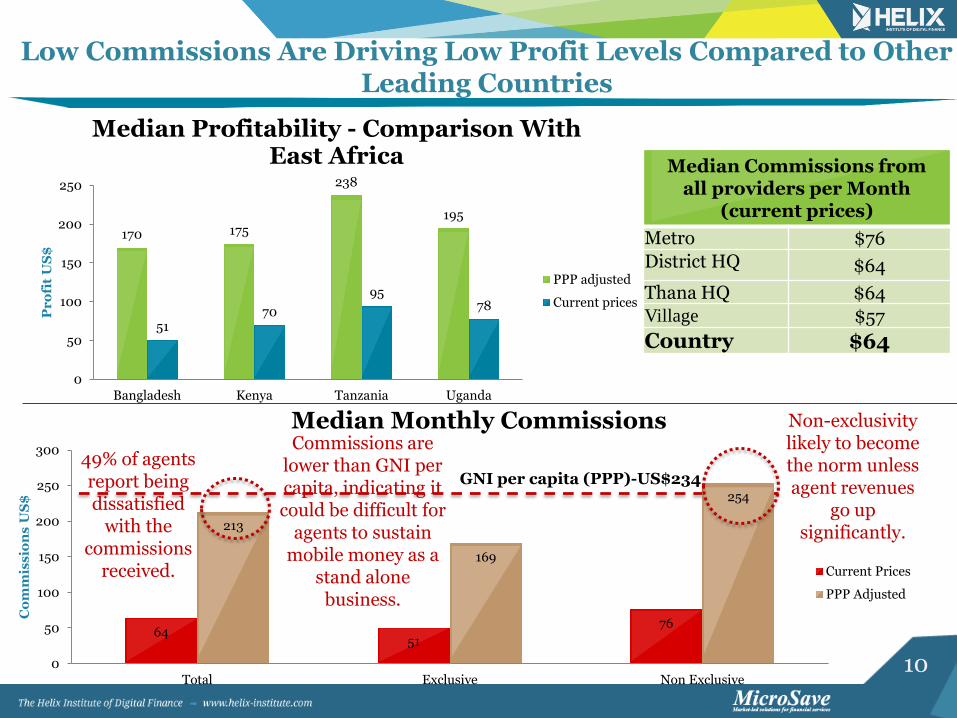
Low Commissions Are Driving Low Profit Levels Compared to Other Leading Countries
Median Commissions from all providers per Month
(current prices)
Metro $76
District HQ $64
Thana HQ $64
Village $57
Country $64
170 175
238
195
51 70
95 78
0
50
100
150
200
250
Bangladesh Kenya Tanzania Uganda
Pr
ofi
t U
S$
Median Profitability - Comparison With East Africa
PPP adjusted
Current prices
64 51
76
213
169
254
0
50
100
150
200
250
300
Total Exclusive Non Exclusive
Co
mm
iss
ion
s U
S$
Median Monthly Commissions
Current Prices
PPP Adjusted
Commissions are lower than GNI per capita, indicating it could be difficult for
agents to sustain mobile money as a
stand alone business.
Non-exclusivity likely to become the norm unless agent revenues
go up significantly.
49% of agents report being dissatisfied
with the commissions
received.
GNI per capita (PPP)-US$234
11
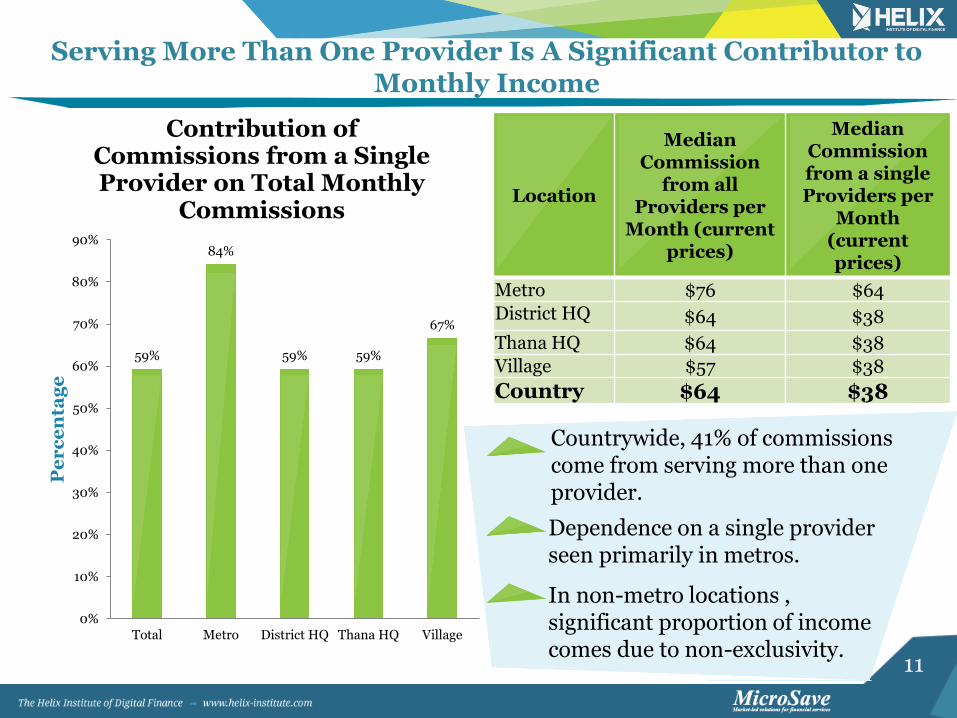
Serving More Than One Provider Is A Significant Contributor to Monthly Income
Location
Median Commission
from all Providers per
Month (current prices)
Median Commission from a single Providers per
Month (current prices)
Metro $76 $64
District HQ $64 $38
Thana HQ $64 $38
Village $57 $38
Country $64 $38
59%
84%
59% 59%
67%
0%
10%
20%
30%
40%
50%
60%
70%
80%
90%
Total Metro District HQ Thana HQ Village
Pe
rc
en
tag
e
Contribution of Commissions from a Single Provider on Total Monthly
Commissions
Dependence on a single provider seen primarily in metros.
In non-metro locations , significant proportion of income comes due to non-exclusivity.
Countrywide, 41% of commissions come from serving more than one provider.
12
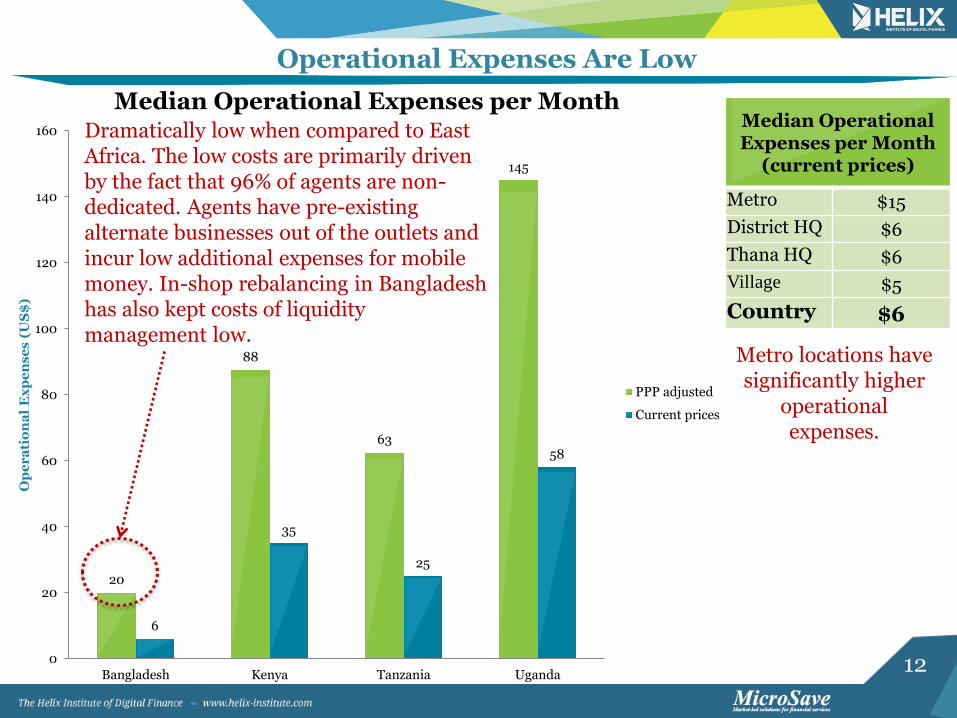
Operational Expenses Are Low
Median Operational Expenses per Month
(current prices)
Metro $15
District HQ $6
Thana HQ $6
Village $5
Country $6
Metro locations have significantly higher
operational expenses.
20
88
63
145
6
35
25
58
0
20
40
60
80
100
120
140
160
Bangladesh Kenya Tanzania Uganda
Op
er
ati
on
al
Ex
pe
ns
es
(U
S$
)
Median Operational Expenses per Month
PPP adjusted
Current prices
Dramatically low when compared to East Africa. The low costs are primarily driven by the fact that 96% of agents are non-dedicated. Agents have pre-existing alternate businesses out of the outlets and incur low additional expenses for mobile money. In-shop rebalancing in Bangladesh has also kept costs of liquidity management low.
13
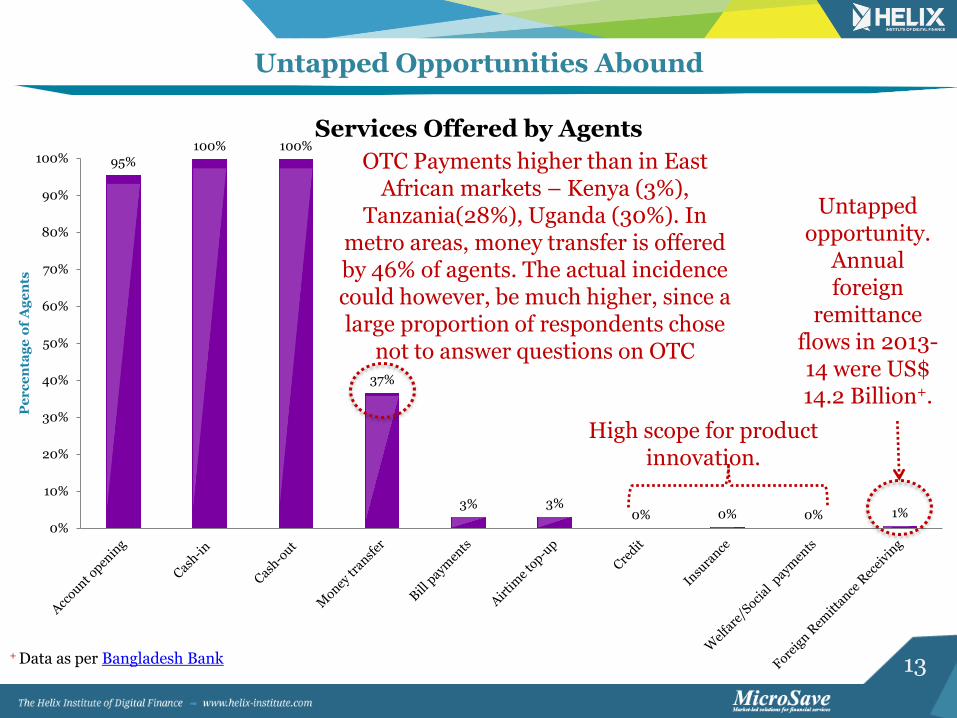
Untapped Opportunities Abound
95% 100% 100%
37%
3% 3% 0% 0% 0% 1%
0%
10%
20%
30%
40%
50%
60%
70%
80%
90%
100%
Pe
rc
en
tag
e o
f A
ge
nts
Services Offered by Agents
OTC Payments higher than in East African markets – Kenya (3%),
Tanzania(28%), Uganda (30%). In metro areas, money transfer is offered by 46% of agents. The actual incidence could however, be much higher, since a large proportion of respondents chose
not to answer questions on OTC
+ Data as per Bangladesh Bank
High scope for product innovation.
Untapped opportunity.
Annual foreign
remittance flows in 2013-14 were US$ 14.2 Billion+.
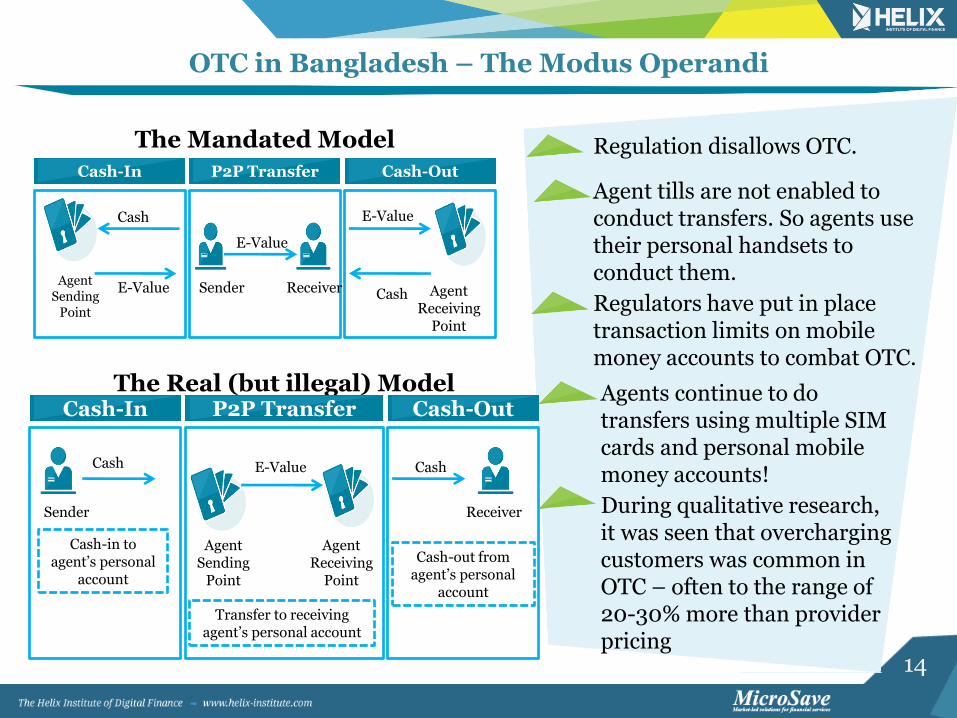
Regulation disallows OTC. Agent tills are not enabled to conduct transfers. So agents use their personal handsets to conduct them.
Regulators have put in place transaction limits on mobile money accounts to combat OTC.
Agents continue to do transfers using multiple SIM cards and personal mobile money accounts!
The Mandated Model
Cash-In
Agent Sending
Point
E-Value
Cash
P2P Transfer
Sender
E-Value
Receiver
Cash-Out
Agent Receiving
Point
E-Value
Cash
The Real (but illegal) Model Cash-In
Sender
Cash
Cash-in to agent’s personal
account
P2P Transfer
Agent Sending
Point
E-Value
Agent Receiving
Point
Transfer to receiving agent’s personal account
Cash-Out
Cash
Receiver
Cash-out from agent’s personal
account
During qualitative research, it was seen that overcharging customers was common in OTC – often to the range of 20-30% more than provider pricing
15
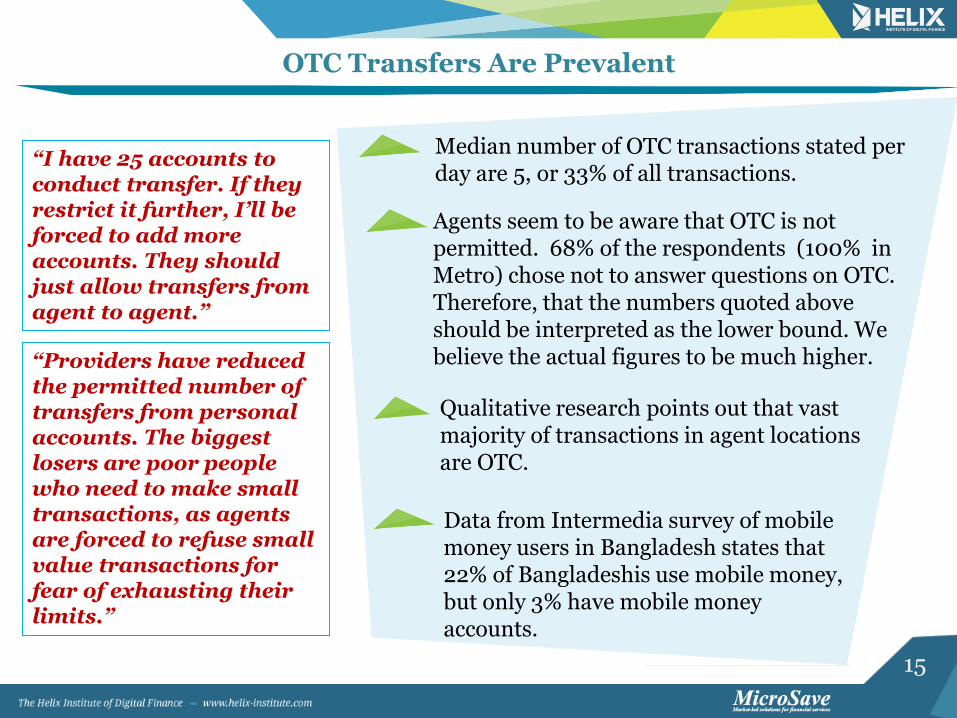
OTC Transfers Are Prevalent
“I have 25 accounts to conduct transfer. If they restrict it further, I’ll be forced to add more accounts. They should just allow transfers from agent to agent.”
Median number of OTC transactions stated per day are 5, or 33% of all transactions.
Agents seem to be aware that OTC is not permitted. 68% of the respondents (100% in Metro) chose not to answer questions on OTC. Therefore, that the numbers quoted above should be interpreted as the lower bound. We believe the actual figures to be much higher. Qualitative research points out that vast majority of transactions in agent locations are OTC.
Data from Intermedia survey of mobile money users in Bangladesh states that 22% of Bangladeshis use mobile money, but only 3% have mobile money accounts.
“Providers have reduced the permitted number of transfers from personal accounts. The biggest losers are poor people who need to make small transactions, as agents are forced to refuse small value transactions for fear of exhausting their limits.”
16
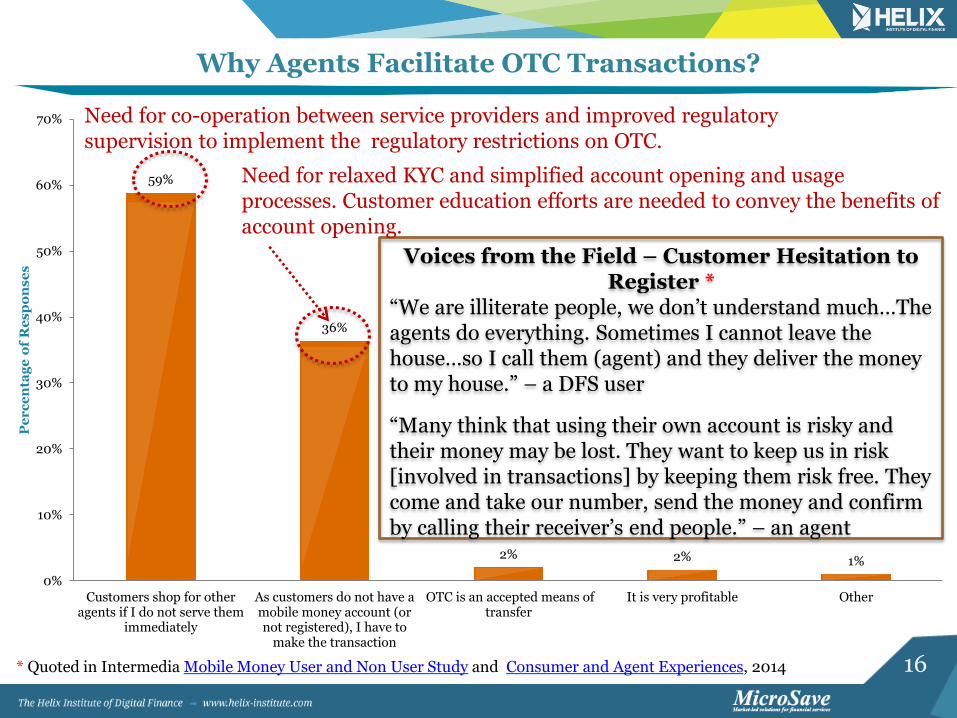
Why Agents Facilitate OTC Transactions?
59%
36%
2% 2% 1%
0%
10%
20%
30%
40%
50%
60%
70%
Customers shop for otheragents if I do not serve them
immediately
As customers do not have amobile money account (ornot registered), I have to
make the transaction
OTC is an accepted means oftransfer
It is very profitable Other
Pe
rc
en
tag
e o
f R
es
po
ns
es
Voices from the Field – Customer Hesitation to Register *
“We are illiterate people, we don’t understand much…The agents do everything. Sometimes I cannot leave the house…so I call them (agent) and they deliver the money to my house.” – a DFS user
“Many think that using their own account is risky and their money may be lost. They want to keep us in risk [involved in transactions] by keeping them risk free. They come and take our number, send the money and confirm by calling their receiver’s end people.” – an agent
Need for co-operation between service providers and improved regulatory supervision to implement the regulatory restrictions on OTC.
Need for relaxed KYC and simplified account opening and usage processes. Customer education efforts are needed to convey the benefits of account opening.
* Quoted in Intermedia Mobile Money User and Non User Study and Consumer and Agent Experiences, 2014
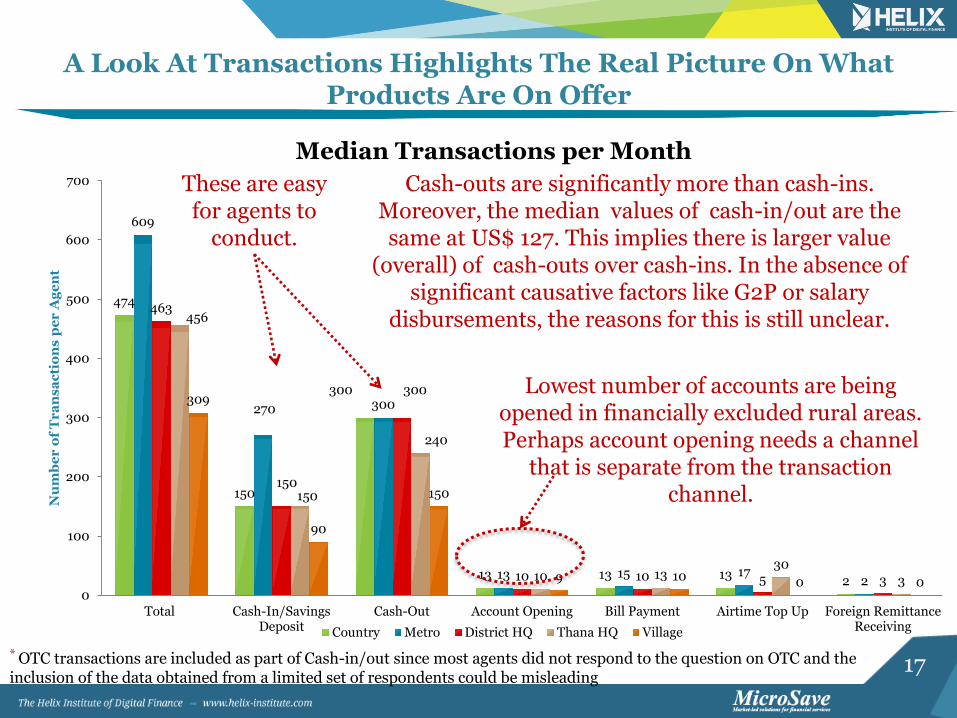
A Look At Transactions Highlights The Real Picture On What Products Are On Offer
474
150
300
13 13 13 2
609
270 300
13 15 17 2
463
150
300
10 10 5 3
456
150
240
10 13 30
3
309
90
150
9 10 0 0 0
100
200
300
400
500
600
700
Total Cash-In/SavingsDeposit
Cash-Out Account Opening Bill Payment Airtime Top Up Foreign RemittanceReceiving
Nu
mb
er
of
Tr
an
sa
cti
on
s p
er
Ag
en
t
Median Transactions per Month
Country Metro District HQ Thana HQ Village
These are easy for agents to
conduct.
Lowest number of accounts are being opened in financially excluded rural areas. Perhaps account opening needs a channel
that is separate from the transaction channel.
Cash-outs are significantly more than cash-ins. Moreover, the median values of cash-in/out are the same at US$ 127. This implies there is larger value
(overall) of cash-outs over cash-ins. In the absence of significant causative factors like G2P or salary
disbursements, the reasons for this is still unclear.
* OTC transactions are included as part of Cash-in/out since most agents did not respond to the question on OTC and the inclusion of the data obtained from a limited set of respondents could be misleading
18
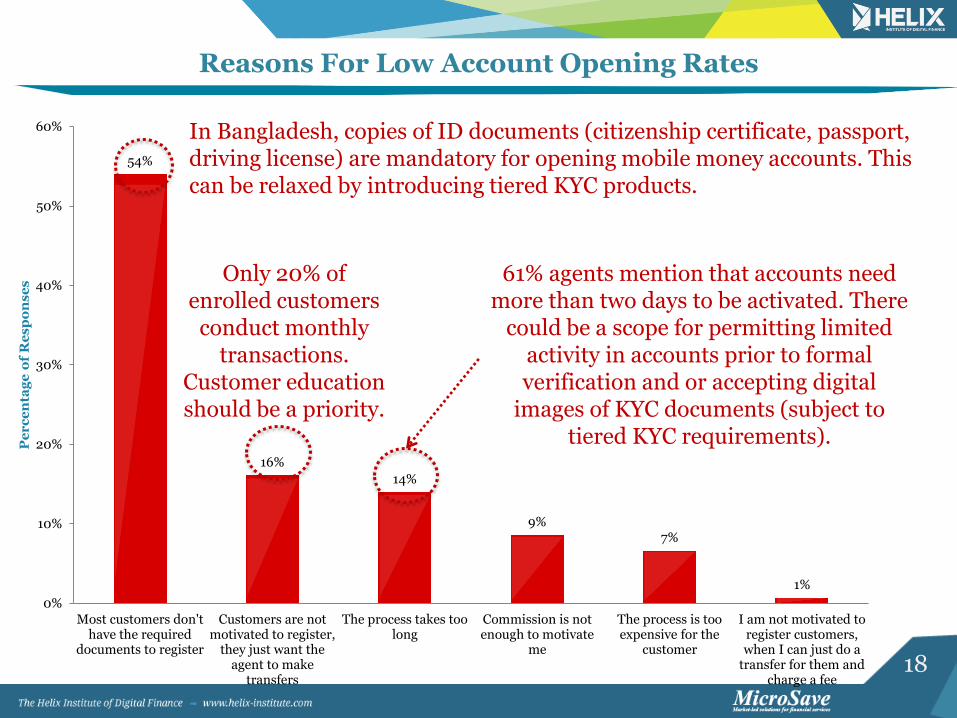
Reasons For Low Account Opening Rates
54%
16%
14%
9% 7%
1%
0%
10%
20%
30%
40%
50%
60%
Most customers don'thave the required
documents to register
Customers are notmotivated to register,
they just want theagent to make
transfers
The process takes toolong
Commission is notenough to motivate
me
The process is tooexpensive for the
customer
I am not motivated toregister customers,when I can just do a
transfer for them andcharge a fee
Pe
rc
en
tag
e o
f R
es
po
ns
es
In Bangladesh, copies of ID documents (citizenship certificate, passport, driving license) are mandatory for opening mobile money accounts. This can be relaxed by introducing tiered KYC products.
Only 20% of enrolled customers conduct monthly
transactions. Customer education should be a priority.
61% agents mention that accounts need more than two days to be activated. There
could be a scope for permitting limited activity in accounts prior to formal verification and or accepting digital
images of KYC documents (subject to tiered KYC requirements).
19
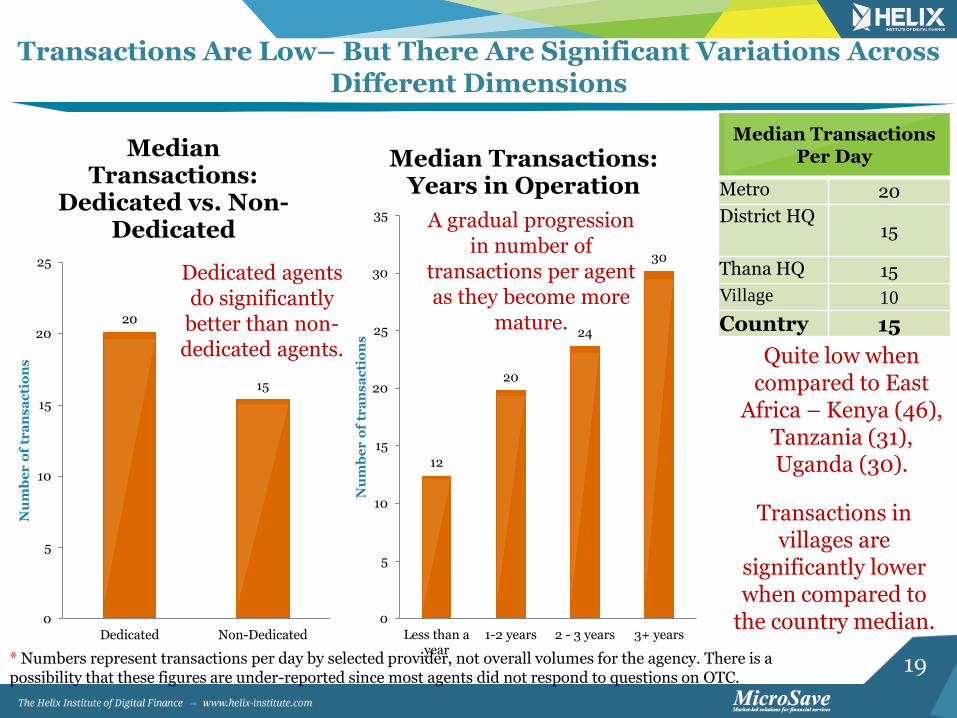
Transactions Are Low– But There Are Significant Variations Across Different Dimensions
Quite low when compared to East
Africa – Kenya (46), Tanzania (31), Uganda (30).
Median Transactions Per Day
Metro 20
District HQ 15
Thana HQ 15
Village 10
Country 15
Transactions in villages are
significantly lower when compared to
the country median.
* Numbers represent transactions per day by selected provider, not overall volumes for the agency. There is a possibility that these figures are under-reported since most agents did not respond to questions on OTC.
20
15
0
5
10
15
20
25
Dedicated Non-Dedicated
Nu
mb
er
of
tra
ns
ac
tio
ns
Median Transactions:
Dedicated vs. Non-Dedicated
12
20
24
30
0
5
10
15
20
25
30
35
Less than ayear
1-2 years 2 - 3 years 3+ years
Nu
mb
er
of
tra
ns
ac
tio
ns
Median Transactions: Years in Operation
A gradual progression in number of
transactions per agent as they become more
mature.
Dedicated agents do significantly
better than non-dedicated agents.
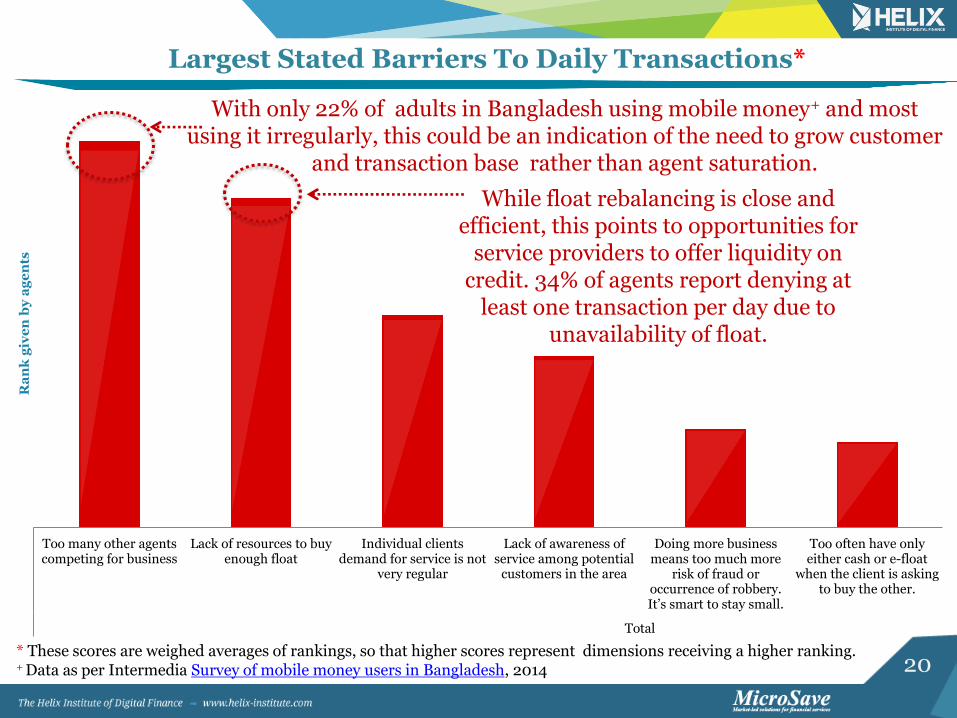
20
Largest Stated Barriers To Daily Transactions*
* These scores are weighed averages of rankings, so that higher scores represent dimensions receiving a higher ranking. + Data as per Intermedia Survey of mobile money users in Bangladesh, 2014
Too many other agentscompeting for business
Lack of resources to buyenough float
Individual clientsdemand for service is not
very regular
Lack of awareness ofservice among potential
customers in the area
Doing more business means too much more
risk of fraud or occurrence of robbery. It’s smart to stay small.
Too often have onlyeither cash or e-float
when the client is askingto buy the other.
Total
Ra
nk
giv
en
by
ag
en
ts
With only 22% of adults in Bangladesh using mobile money+ and most using it irregularly, this could be an indication of the need to grow customer
and transaction base rather than agent saturation.
While float rebalancing is close and efficient, this points to opportunities for
service providers to offer liquidity on credit. 34% of agents report denying at
least one transaction per day due to unavailability of float.
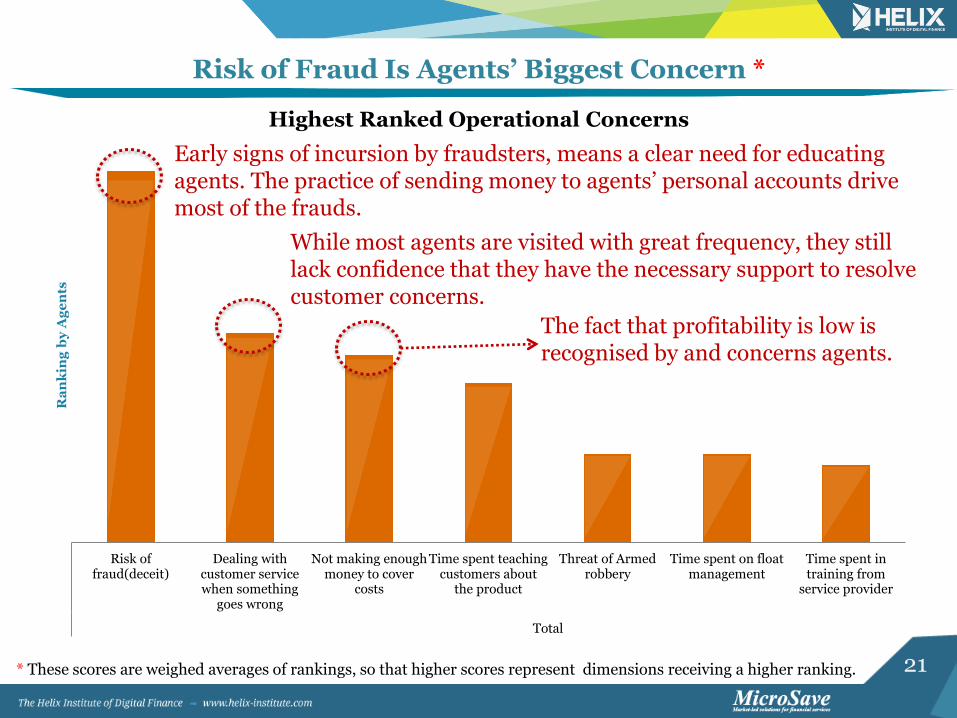
* These scores are weighed averages of rankings, so that higher scores represent dimensions receiving a higher ranking.
Early signs of incursion by fraudsters, means a clear need for educating agents. The practice of sending money to agents’ personal accounts drive most of the frauds.
While most agents are visited with great frequency, they still lack confidence that they have the necessary support to resolve customer concerns.
The fact that profitability is low is recognised by and concerns agents.
22
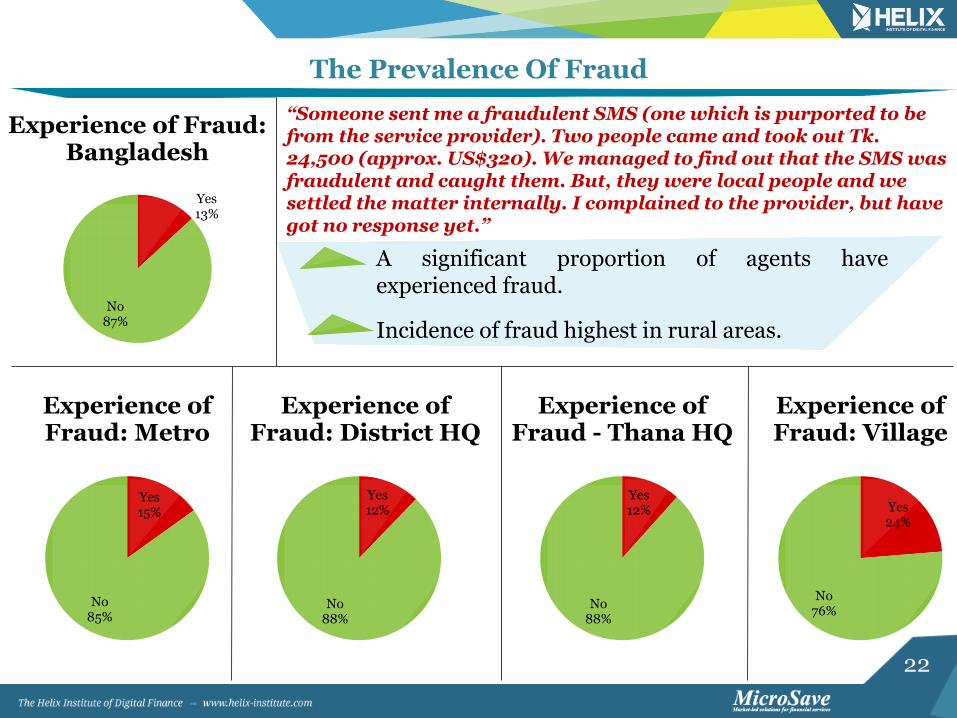
The Prevalence Of Fraud
Yes 13%
No 87%
Experience of Fraud: Bangladesh
Yes 15%
No 85%
Experience of Fraud: Metro
Yes 12%
No 88%
Experience of Fraud: District HQ
Yes 24%
No 76%
Experience of Fraud: Village
“Someone sent me a fraudulent SMS (one which is purported to be from the service provider). Two people came and took out Tk. 24,500 (approx. US$320). We managed to find out that the SMS was fraudulent and caught them. But, they were local people and we settled the matter internally. I complained to the provider, but have got no response yet.”
Yes 12%
No 88%
Experience of Fraud - Thana HQ
A significant proportion of agents have experienced fraud.
Incidence of fraud highest in rural areas.
23
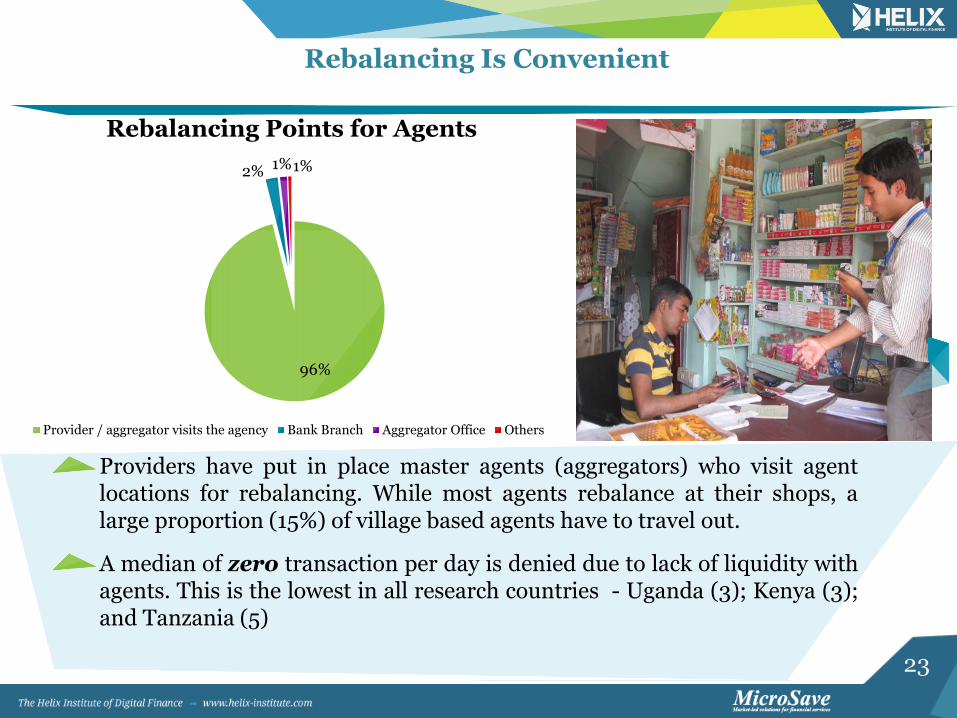
Rebalancing Is Convenient
Providers have put in place master agents (aggregators) who visit agent locations for rebalancing. While most agents rebalance at their shops, a large proportion (15%) of village based agents have to travel out.
A median of zero transaction per day is denied due to lack of liquidity with agents. This is the lowest in all research countries - Uganda (3); Kenya (3); and Tanzania (5)
96%
2% 1% 1%
Rebalancing Points for Agents
Provider / aggregator visits the agency Bank Branch Aggregator Office Others
24
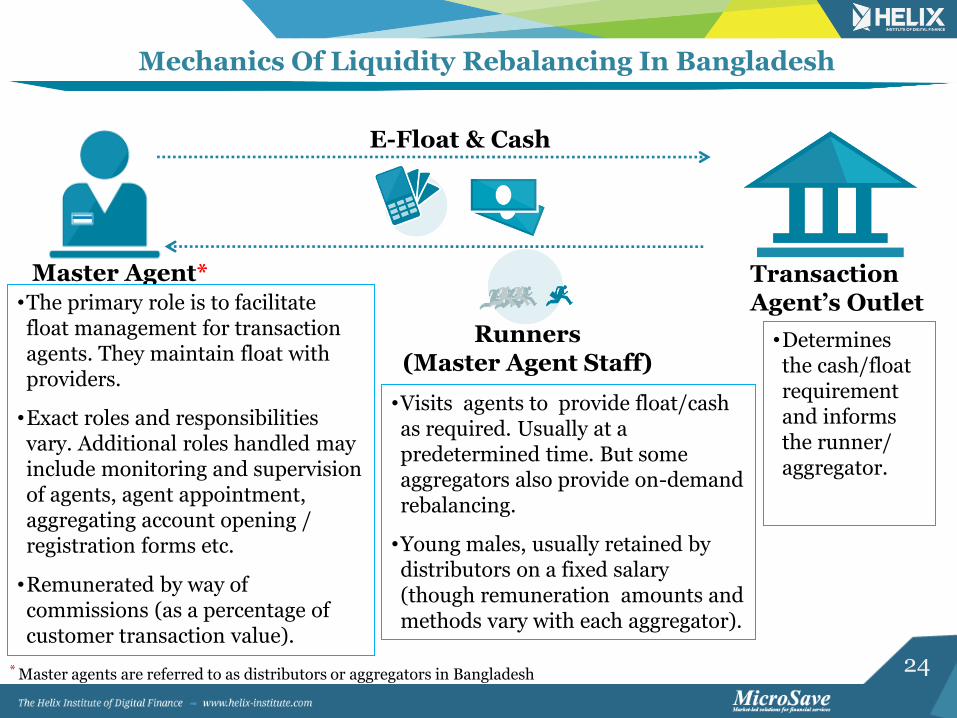
Mechanics Of Liquidity Rebalancing In Bangladesh
Master Agent* Transaction Agent’s Outlet
Runners (Master Agent Staff)
E-Float & Cash
•The primary role is to facilitate float management for transaction agents. They maintain float with providers.
•Exact roles and responsibilities vary. Additional roles handled may include monitoring and supervision of agents, agent appointment, aggregating account opening / registration forms etc.
•Remunerated by way of commissions (as a percentage of customer transaction value).
•Visits agents to provide float/cash as required. Usually at a predetermined time. But some aggregators also provide on-demand rebalancing.
•Young males, usually retained by distributors on a fixed salary (though remuneration amounts and methods vary with each aggregator).
•Determines the cash/float requirement and informs the runner/ aggregator.
* Master agents are referred to as distributors or aggregators in Bangladesh
25
Agents Require E-Float More Frequently
12
16 15
12
9 10 10 10 10 10
0
5
10
15
20
Country Metro District HQ Thana HQ Village
Fr
eq
ue
nc
y
Monthly Median Frequency of Cash Deposits Vs. Cash Withdrawals for Liquidity Management
High demand for e-float in Metro locations and a higher demand for physical cash in rural locations substantiate a send money home use case.
The frequency of rebalancing (both cash deposits and withdrawals), is higher than in East Africa. In Kenya, for example, agents do a median of just four cash deposits and three cash withdrawals per month (32% of the frequency in Bangladesh).
26
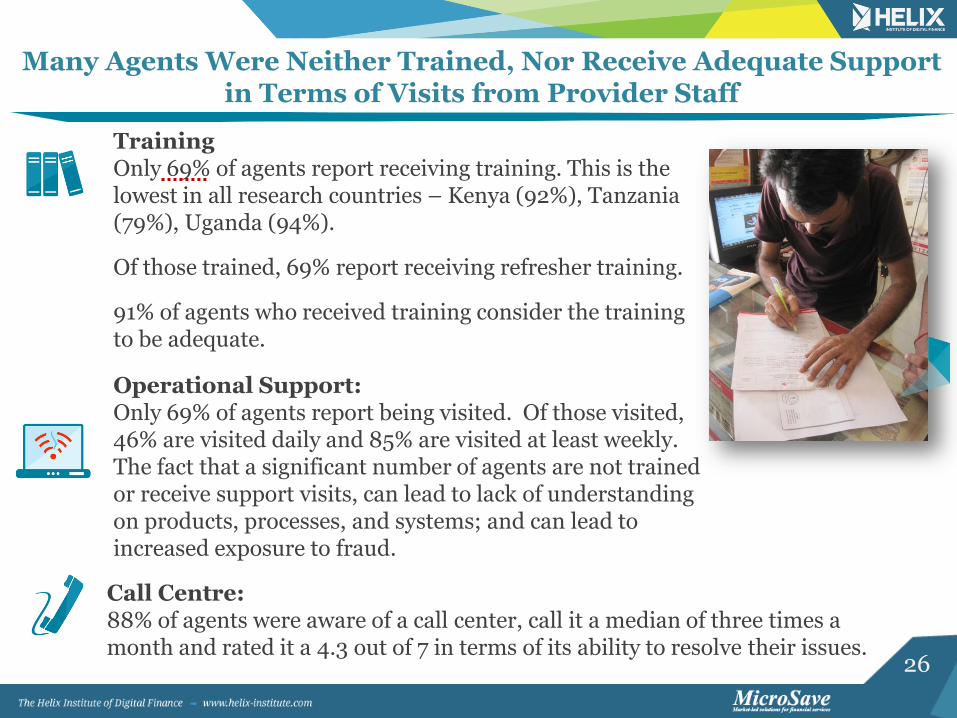
Training Only 69% of agents report receiving training. This is the lowest in all research countries – Kenya (92%), Tanzania (79%), Uganda (94%).
Of those trained, 69% report receiving refresher training.
91% of agents who received training consider the training to be adequate.
Operational Support: Only 69% of agents report being visited. Of those visited, 46% are visited daily and 85% are visited at least weekly. The fact that a significant number of agents are not trained or receive support visits, can lead to lack of understanding on products, processes, and systems; and can lead to increased exposure to fraud.
Many Agents Were Neither Trained, Nor Receive Adequate Support in Terms of Visits from Provider Staff
Call Centre: 88% of agents were aware of a call center, call it a median of three times a month and rated it a 4.3 out of 7 in terms of its ability to resolve their issues.
27
Recurrent Service Downtime Is Affecting Transaction Levels
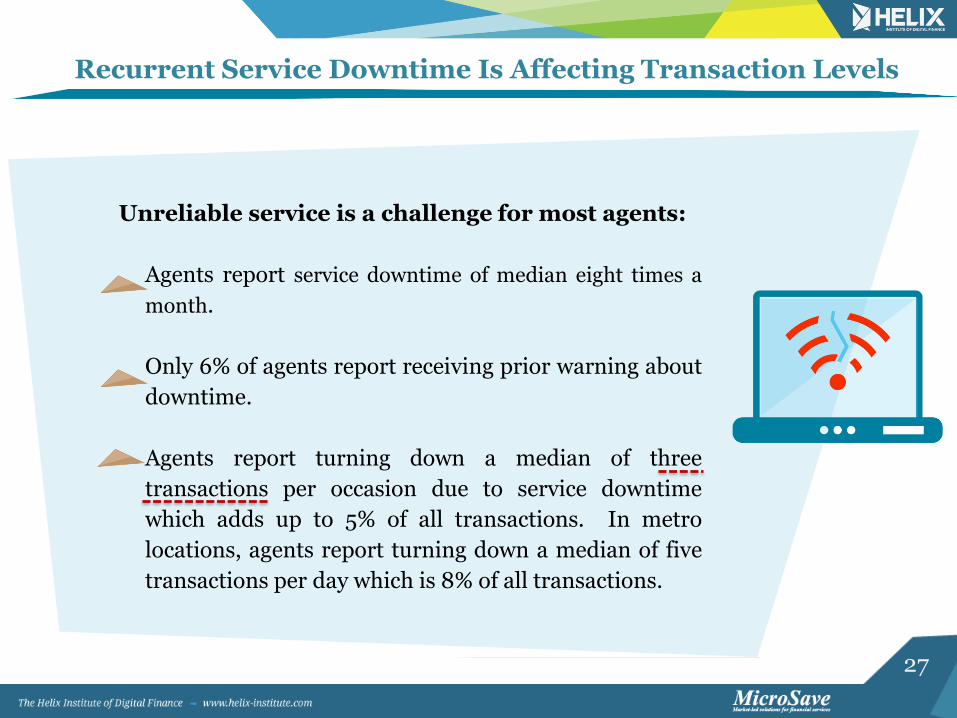
Unreliable service is a challenge for most agents:
Agents report service downtime of median eight times a
month.
Only 6% of agents report receiving prior warning about
downtime.
Agents report turning down a median of three
transactions per occasion due to service downtime
which adds up to 5% of all transactions. In metro
locations, agents report turning down a median of five
transactions per day which is 8% of all transactions.
28
Opportunities For Improvement
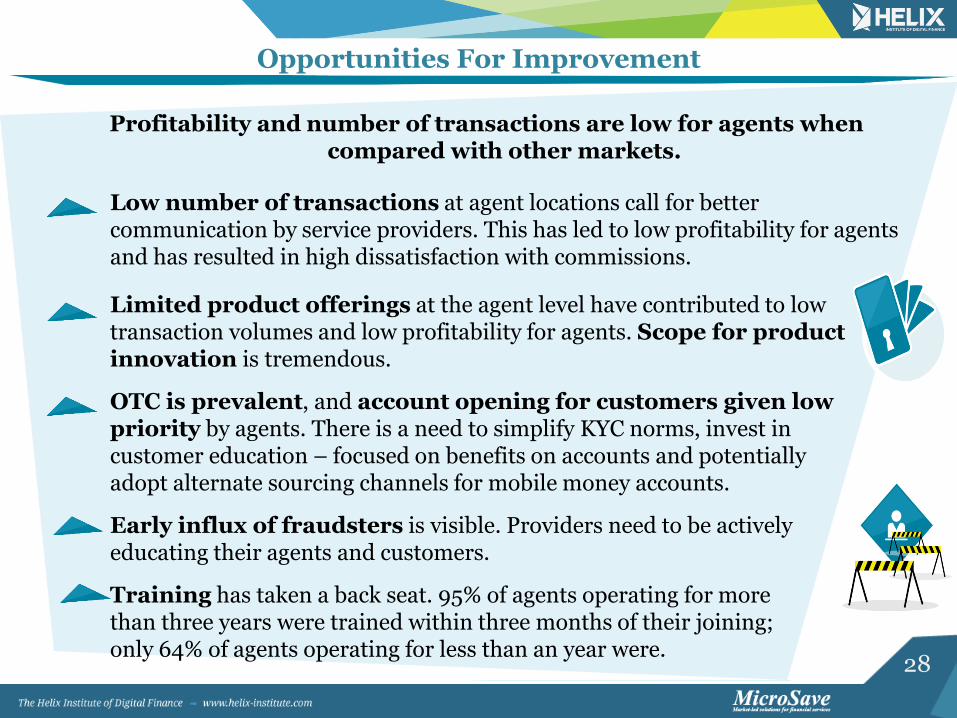
Profitability and number of transactions are low for agents when compared with other markets.
Low number of transactions at agent locations call for better communication by service providers. This has led to low profitability for agents and has resulted in high dissatisfaction with commissions.
Limited product offerings at the agent level have contributed to low transaction volumes and low profitability for agents. Scope for product innovation is tremendous.
OTC is prevalent, and account opening for customers given low priority by agents. There is a need to simplify KYC norms, invest in customer education – focused on benefits on accounts and potentially adopt alternate sourcing channels for mobile money accounts.
Early influx of fraudsters is visible. Providers need to be actively educating their agents and customers.
Training has taken a back seat. 95% of agents operating for more than three years were trained within three months of their joining; only 64% of agents operating for less than an year were.
29
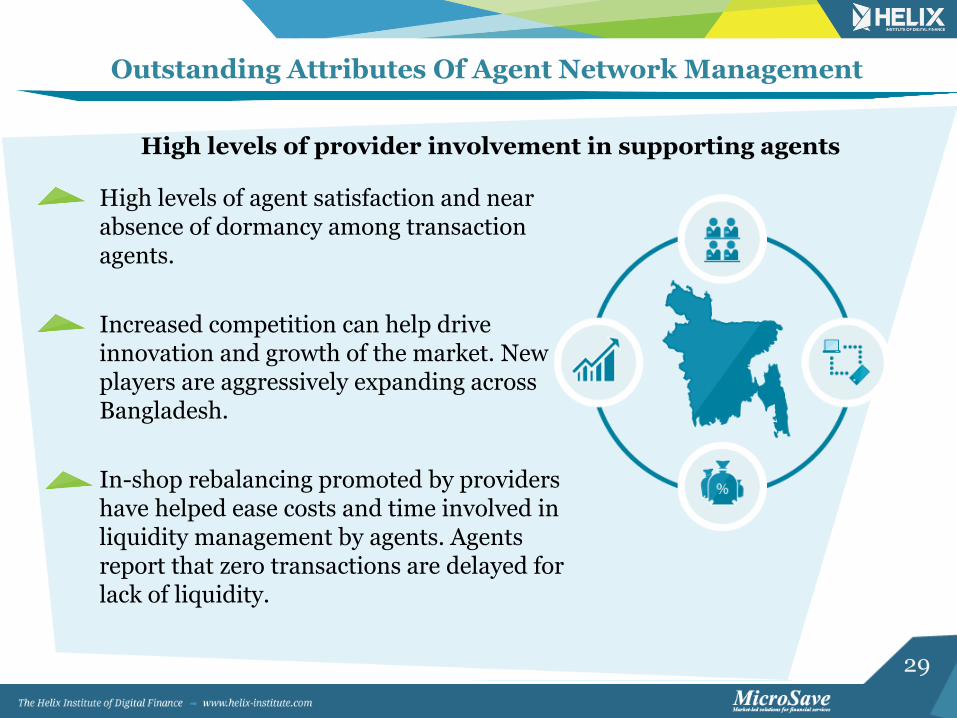
High levels of agent satisfaction and near absence of dormancy among transaction agents.
Increased competition can help drive innovation and growth of the market. New players are aggressively expanding across Bangladesh.
In-shop rebalancing promoted by providers have helped ease costs and time involved in liquidity management by agents. Agents report that zero transactions are delayed for lack of liquidity.
Outstanding Attributes Of Agent Network Management
High levels of provider involvement in supporting agents
30
Appendix
31
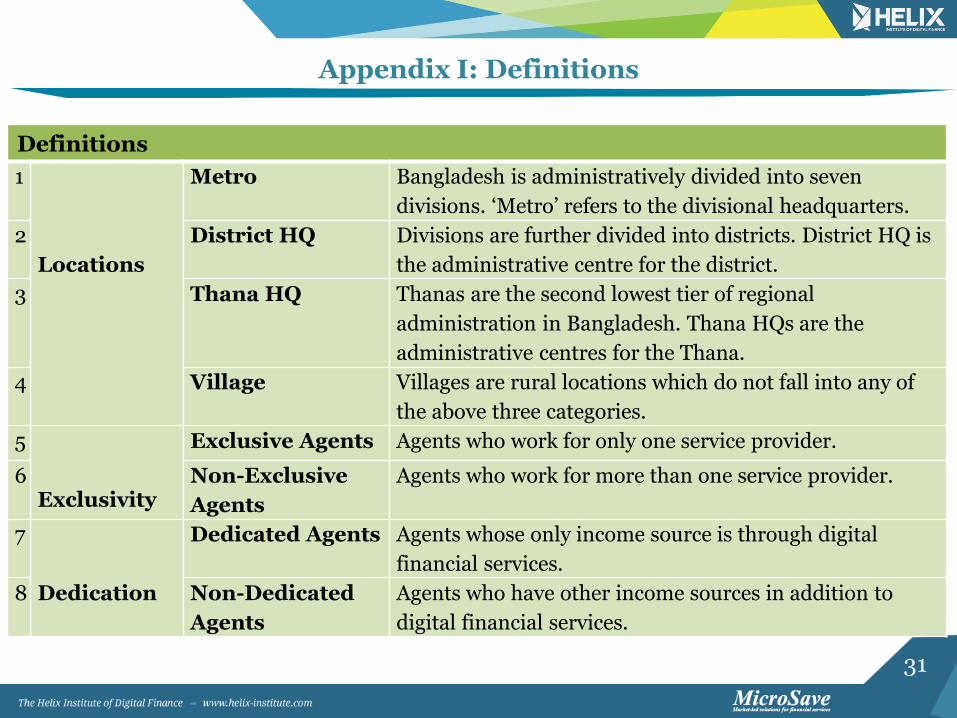
Appendix I: Definitions
Definitions
1
Locations
Metro Bangladesh is administratively divided into seven
divisions. ‘Metro’ refers to the divisional headquarters.
2 District HQ Divisions are further divided into districts. District HQ is
the administrative centre for the district.
3 Thana HQ Thanas are the second lowest tier of regional
administration in Bangladesh. Thana HQs are the
administrative centres for the Thana.
4 Village Villages are rural locations which do not fall into any of
the above three categories.
5
Exclusivity
Exclusive Agents Agents who work for only one service provider.
6 Non-Exclusive
Agents
Agents who work for more than one service provider.
7
Dedication
Dedicated Agents Agents whose only income source is through digital
financial services.
8 Non-Dedicated
Agents
Agents who have other income sources in addition to