25
Aggregate Supply Module 18
| Date post: | 30-Dec-2015 |
| Category: |
Documents |
| Upload: | sophie-holt |
| View: | 219 times |
| Download: | 0 times |
Aggregate Supply
Module 18
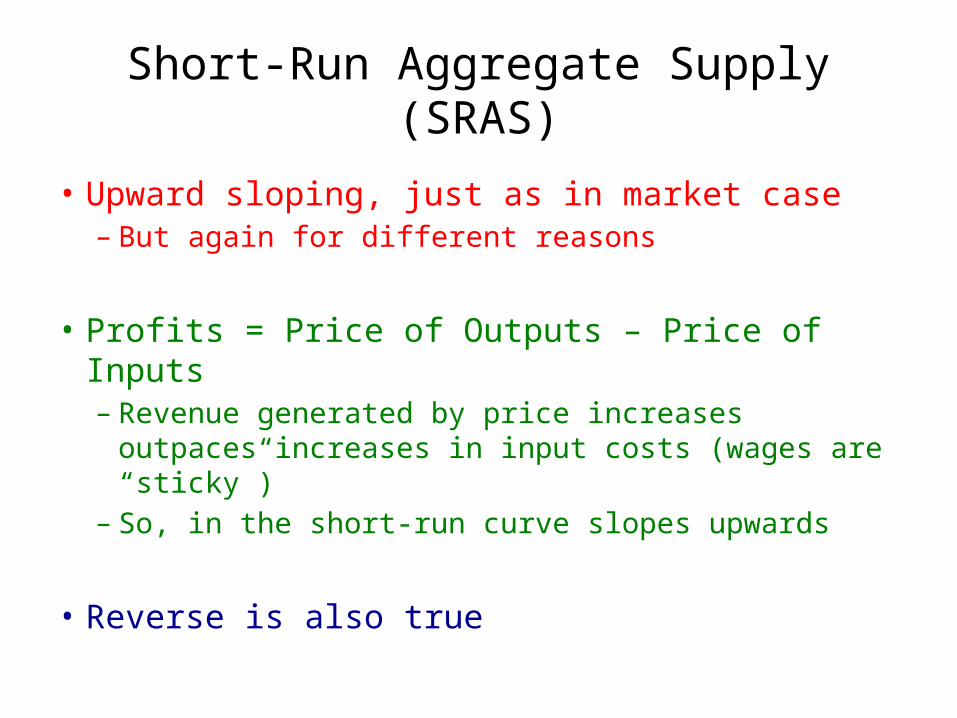
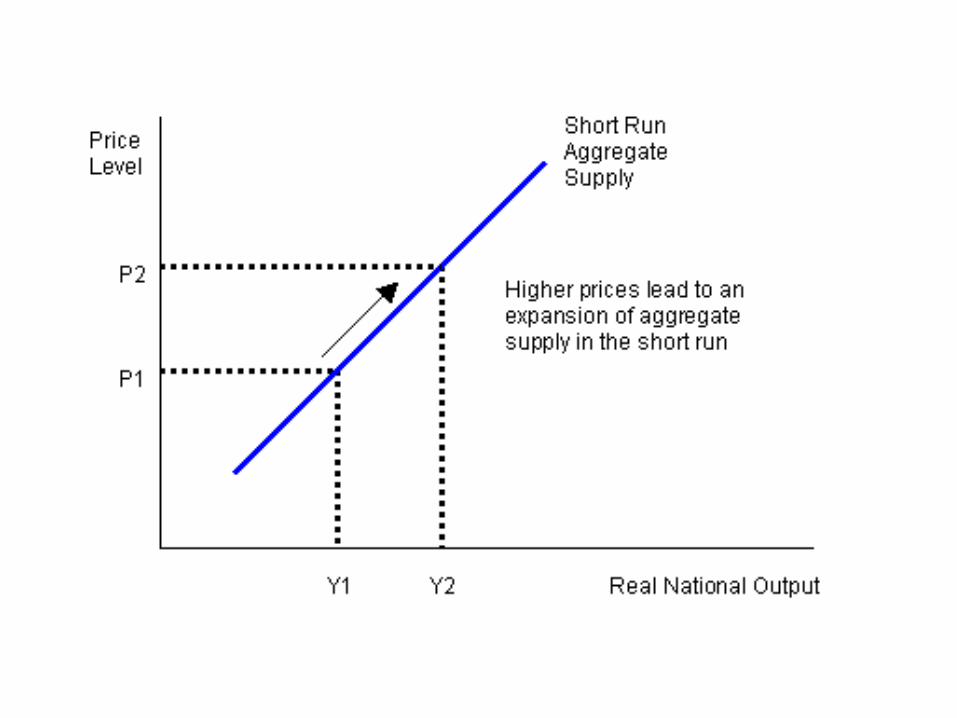
Short-Run Aggregate Supply(SRAS)
• Upward sloping, just as in market case– But again for different reasons
• Profits = Price of Outputs – Price of Inputs– Revenue generated by price increases outpaces
increases in input costs (wages are “sticky”)– So, in the short-run curve slopes upwards
• Reverse is also true
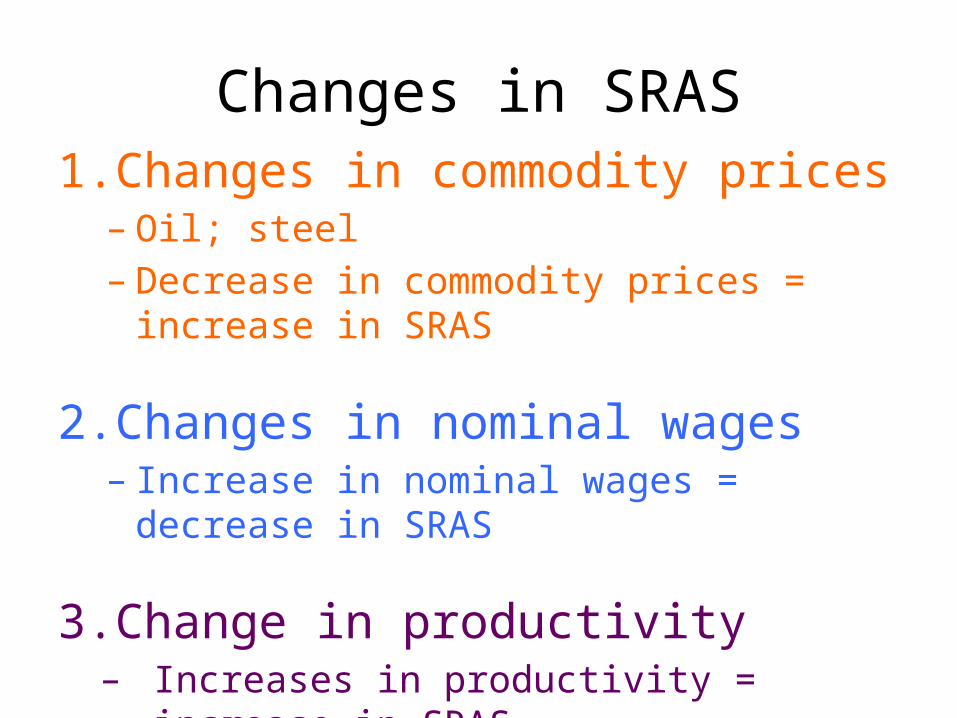
Changes in SRAS1. Changes in commodity prices
– Oil; steel– Decrease in commodity prices = increase in SRAS
2. Changes in nominal wages– Increase in nominal wages = decrease in SRAS
3. Change in productivity– Increases in productivity = increase in SRAS
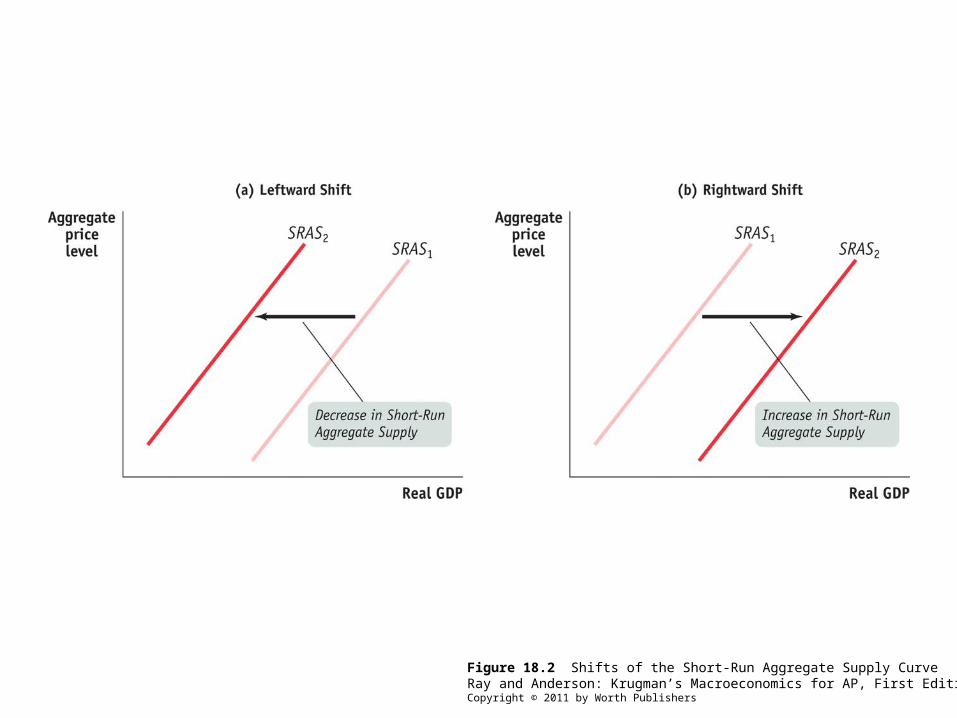
Figure 18.2 Shifts of the Short-Run Aggregate Supply CurveRay and Anderson: Krugman’s Macroeconomics for AP, First EditionCopyright © 2011 by Worth Publishers
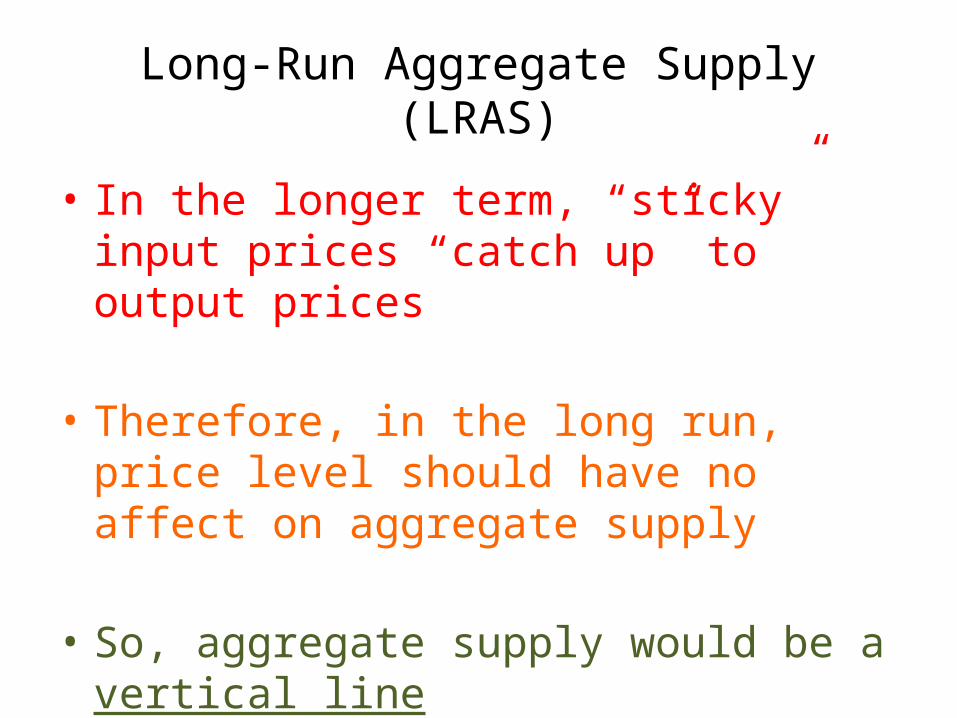
Long-Run Aggregate Supply(LRAS)
• In the longer term, “sticky” input prices “catch up” to output prices
• Therefore, in the long run, price level should have no affect on aggregate supply
• So, aggregate supply would be a vertical line
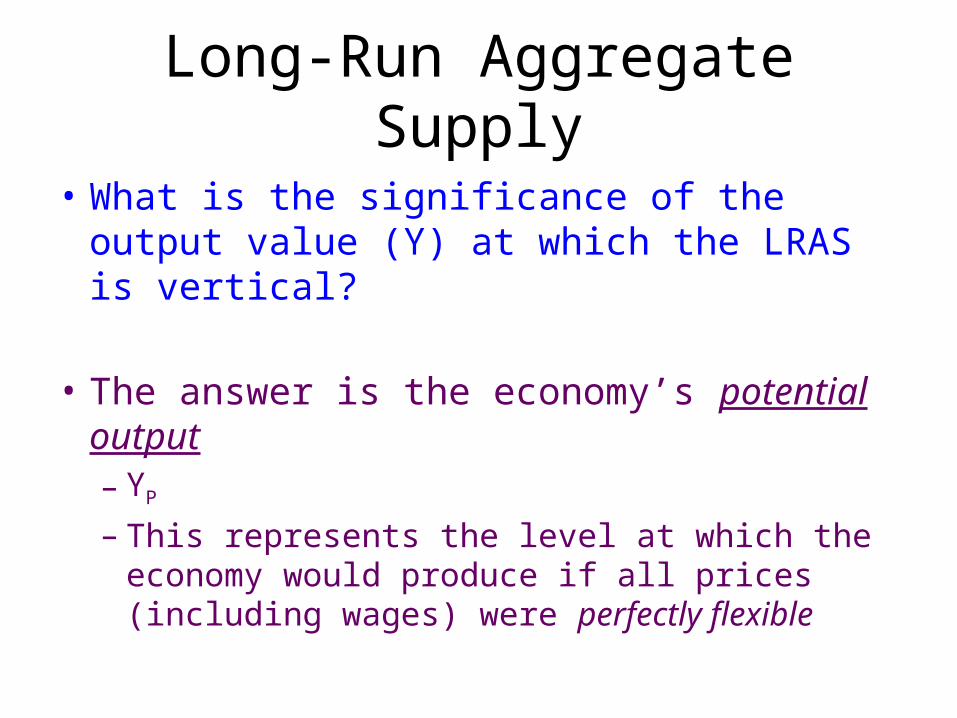
Long-Run Aggregate Supply
• What is the significance of the output value (Y) at which the LRAS is vertical?
• The answer is the economy’s potential output– YP
– This represents the level at which the economy would produce if all prices (including wages) were perfectly flexible
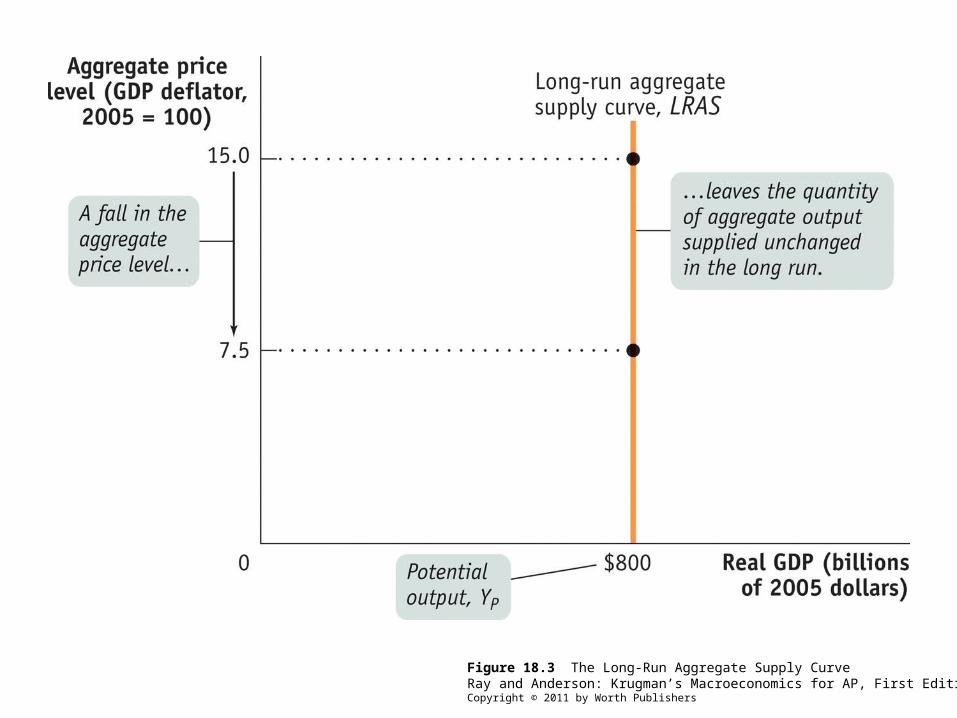
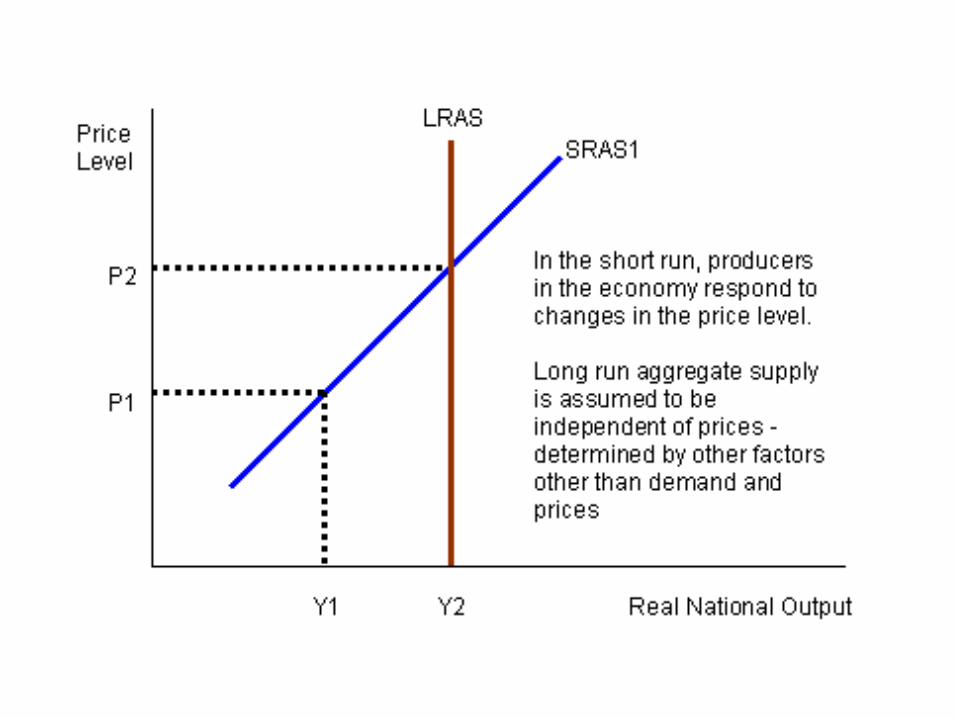
Figure 18.3 The Long-Run Aggregate Supply CurveRay and Anderson: Krugman’s Macroeconomics for AP, First EditionCopyright © 2011 by Worth Publishers
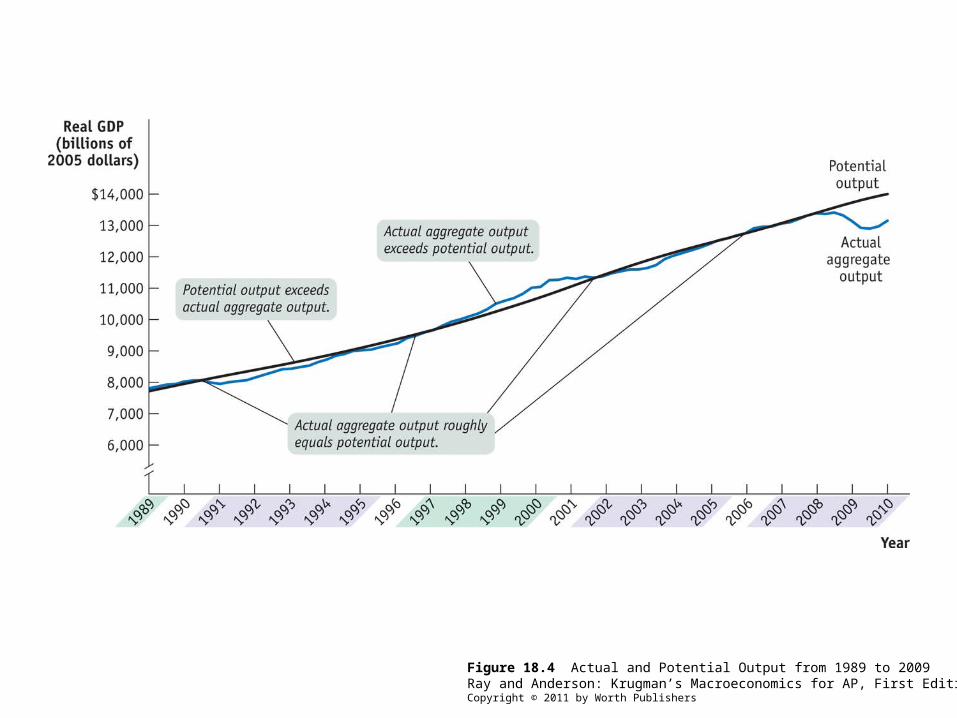
Figure 18.4 Actual and Potential Output from 1989 to 2009Ray and Anderson: Krugman’s Macroeconomics for AP, First EditionCopyright © 2011 by Worth Publishers
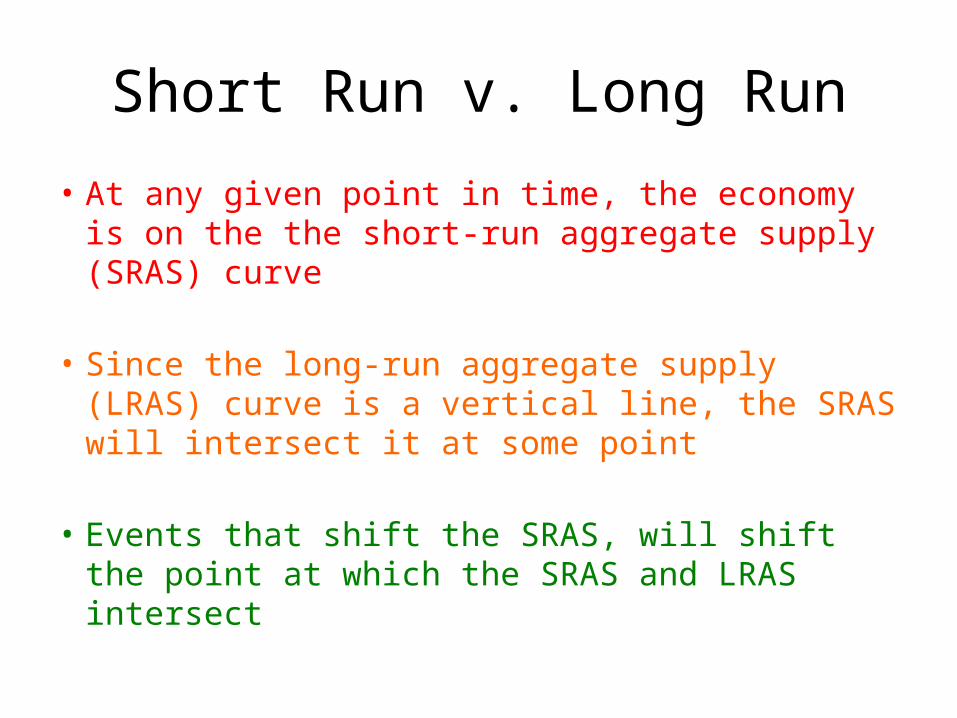
Short Run v. Long Run
• At any given point in time, the economy is on the the short-run aggregate supply (SRAS) curve
• Since the long-run aggregate supply (LRAS) curve is a vertical line, the SRAS will intersect it at some point
• Events that shift the SRAS, will shift the point at which the SRAS and LRAS intersect
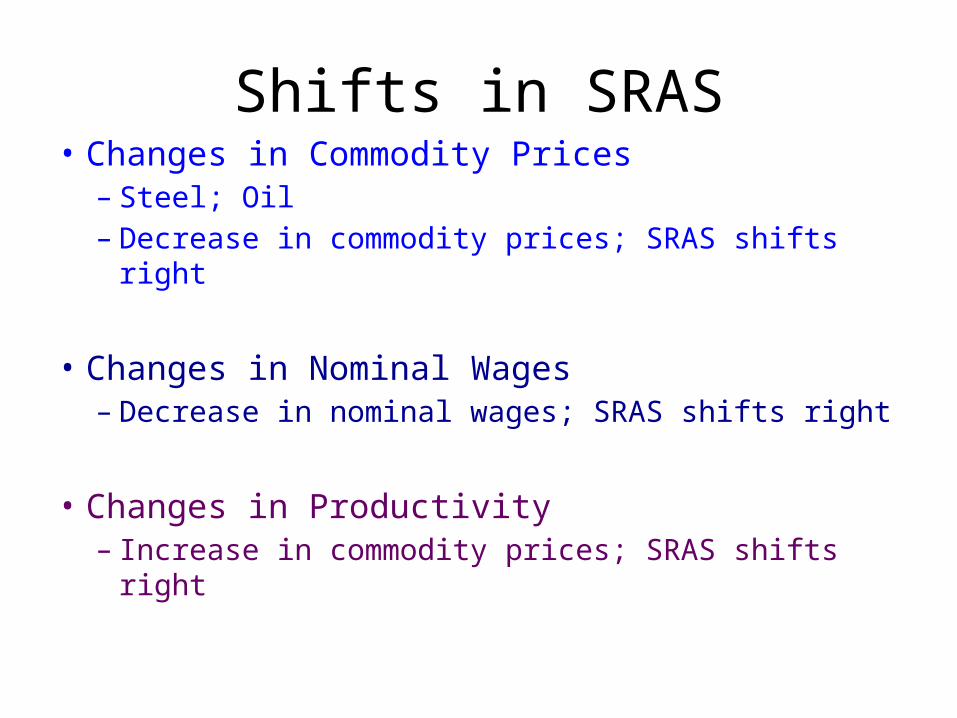
Shifts in SRAS• Changes in Commodity Prices
– Steel; Oil– Decrease in commodity prices; SRAS shifts right
• Changes in Nominal Wages– Decrease in nominal wages; SRAS shifts right
• Changes in Productivity– Increase in commodity prices; SRAS shifts right
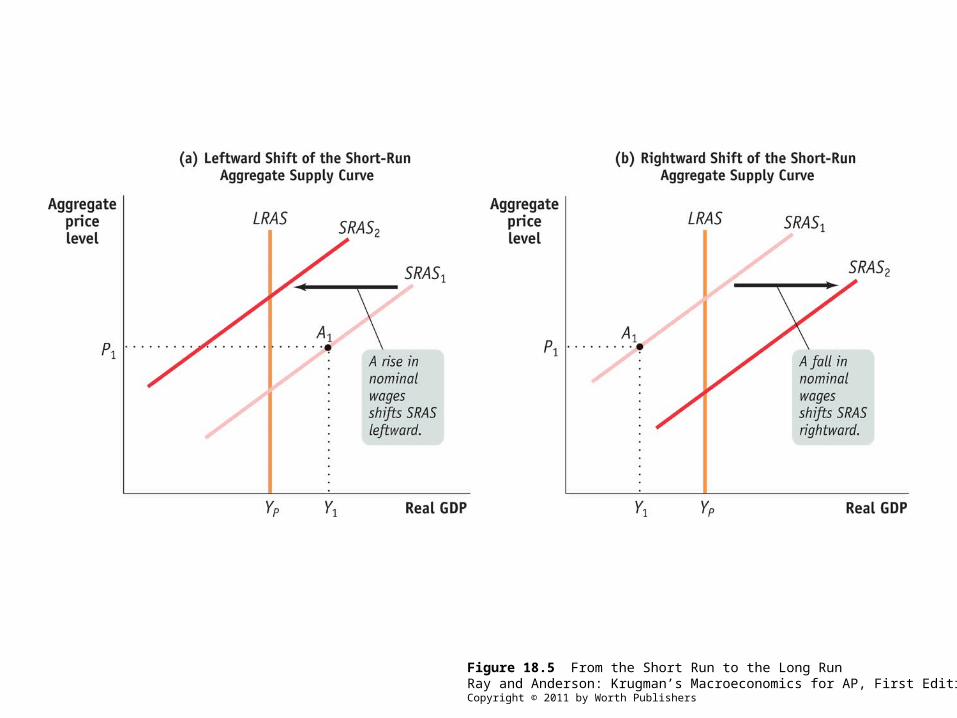
Figure 18.5 From the Short Run to the Long RunRay and Anderson: Krugman’s Macroeconomics for AP, First EditionCopyright © 2011 by Worth Publishers
Macroeconomic EquilibriumThe AD-AS Model
Module 18
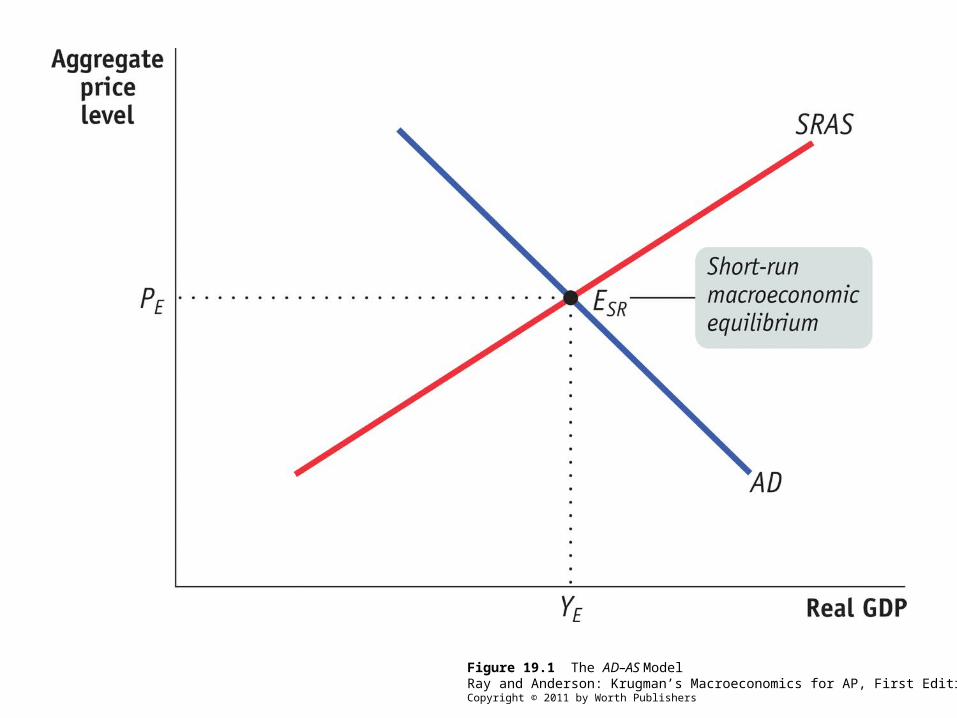
Figure 19.1 The AD–AS ModelRay and Anderson: Krugman’s Macroeconomics for AP, First EditionCopyright © 2011 by Worth Publishers
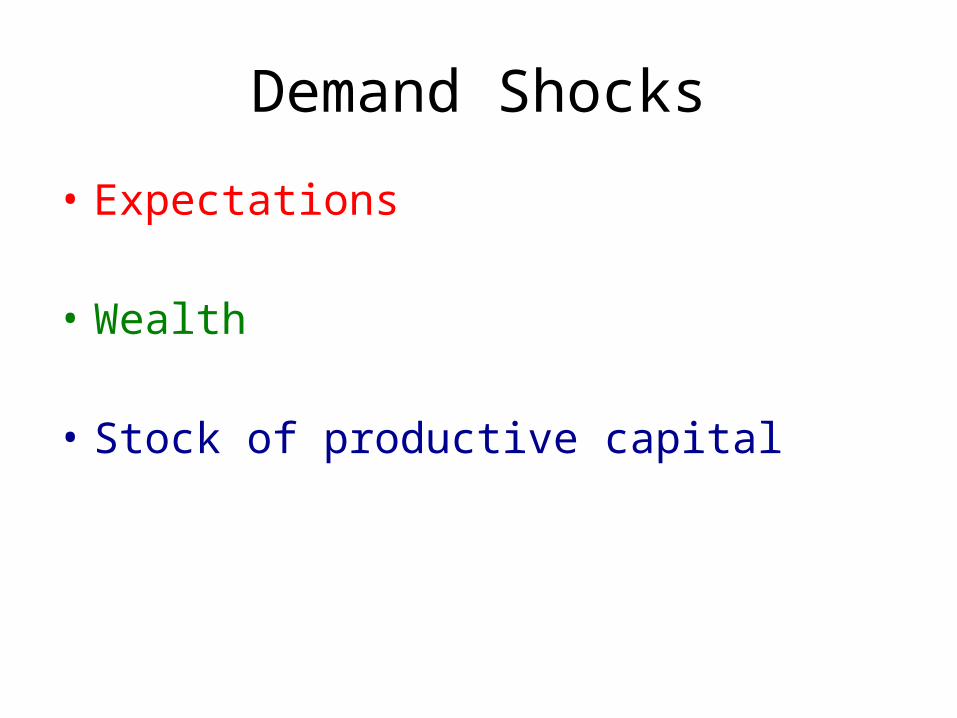
Demand Shocks
• Expectations
• Wealth
• Stock of productive capital
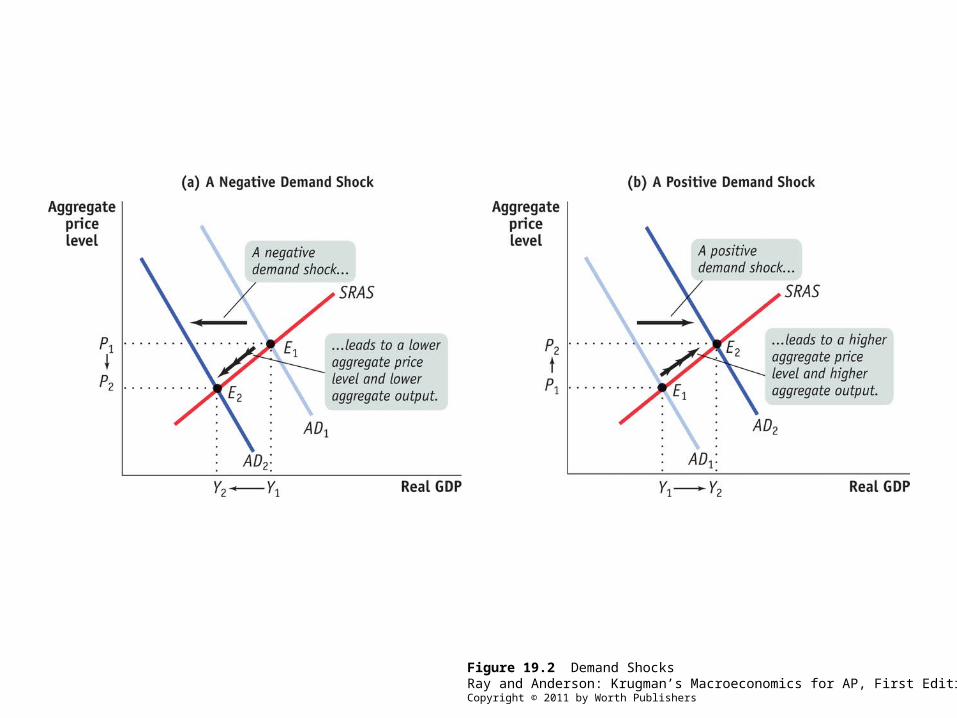
Figure 19.2 Demand ShocksRay and Anderson: Krugman’s Macroeconomics for AP, First EditionCopyright © 2011 by Worth Publishers
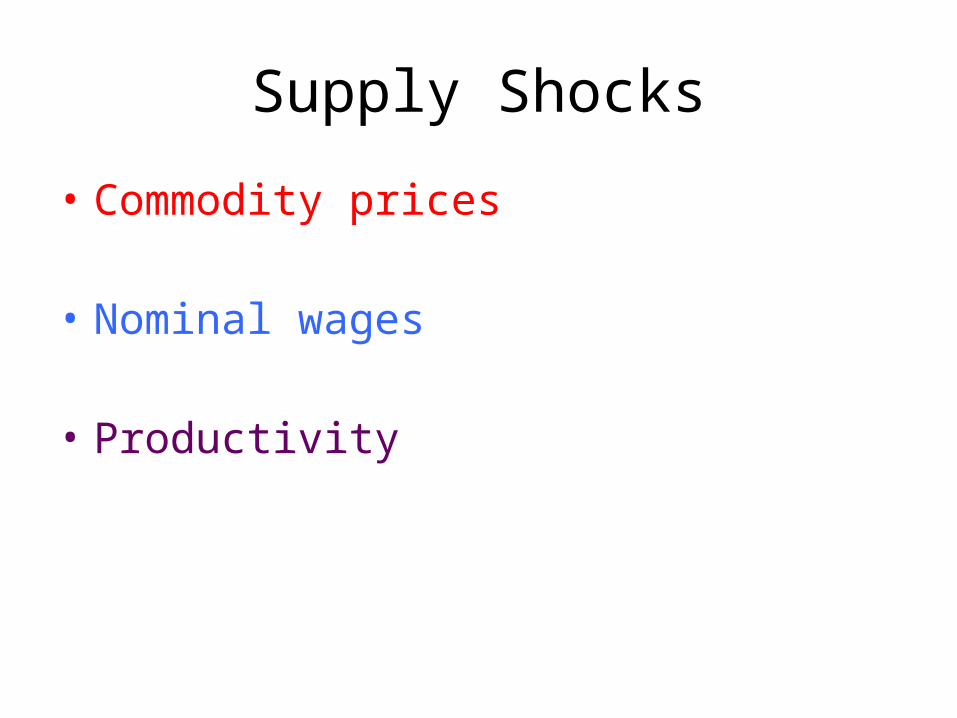
Supply Shocks
• Commodity prices
• Nominal wages
• Productivity
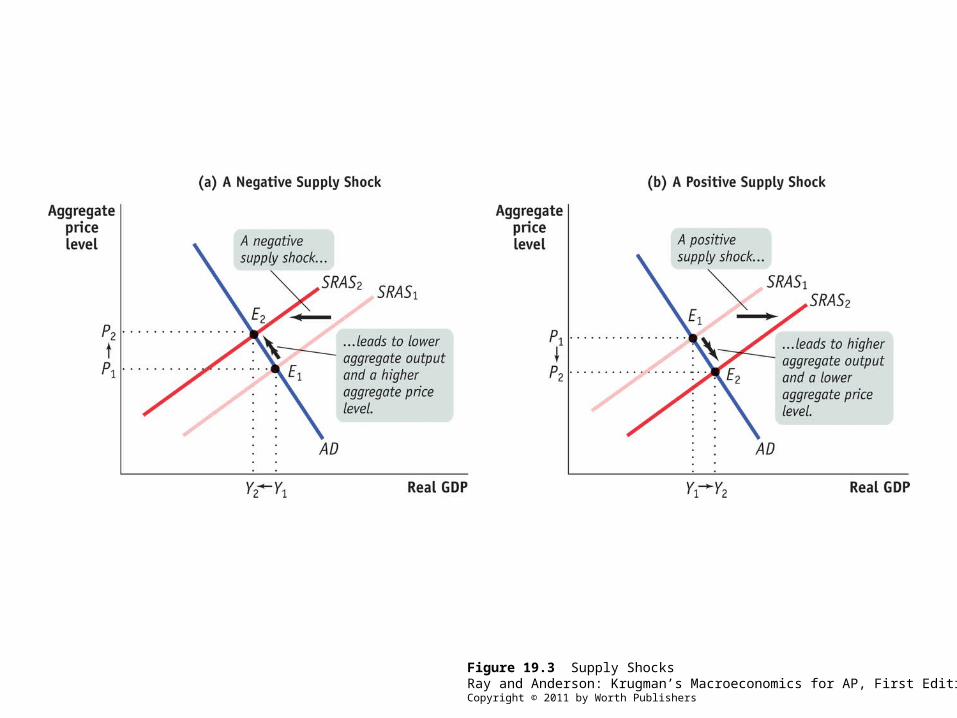
Figure 19.3 Supply ShocksRay and Anderson: Krugman’s Macroeconomics for AP, First EditionCopyright © 2011 by Worth Publishers
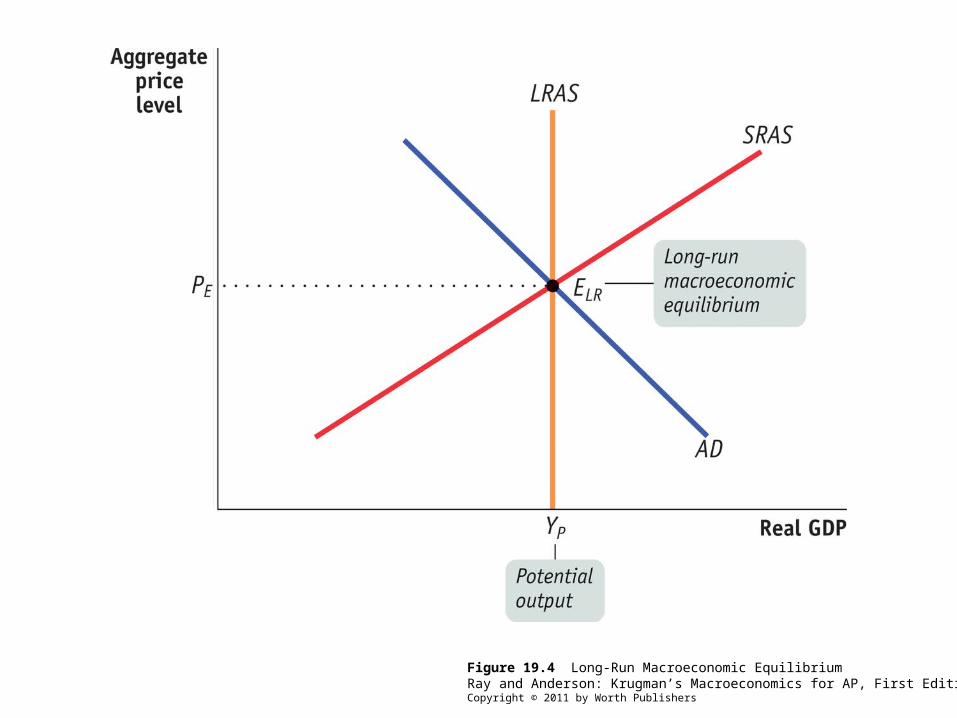
Figure 19.4 Long-Run Macroeconomic EquilibriumRay and Anderson: Krugman’s Macroeconomics for AP, First EditionCopyright © 2011 by Worth Publishers
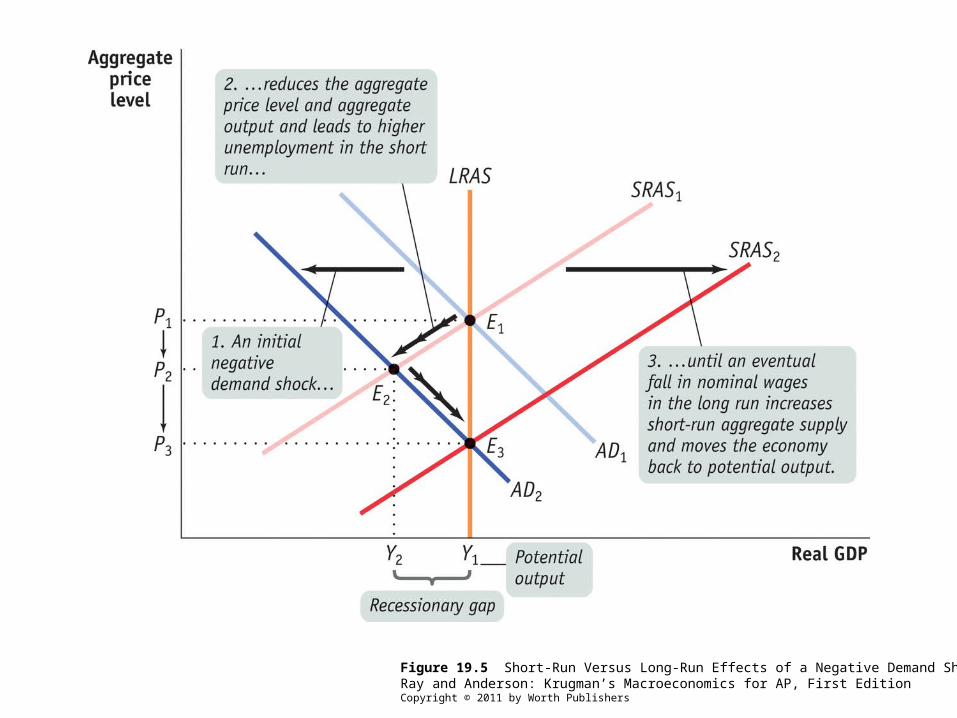
Figure 19.5 Short-Run Versus Long-Run Effects of a Negative Demand ShockRay and Anderson: Krugman’s Macroeconomics for AP, First EditionCopyright © 2011 by Worth Publishers
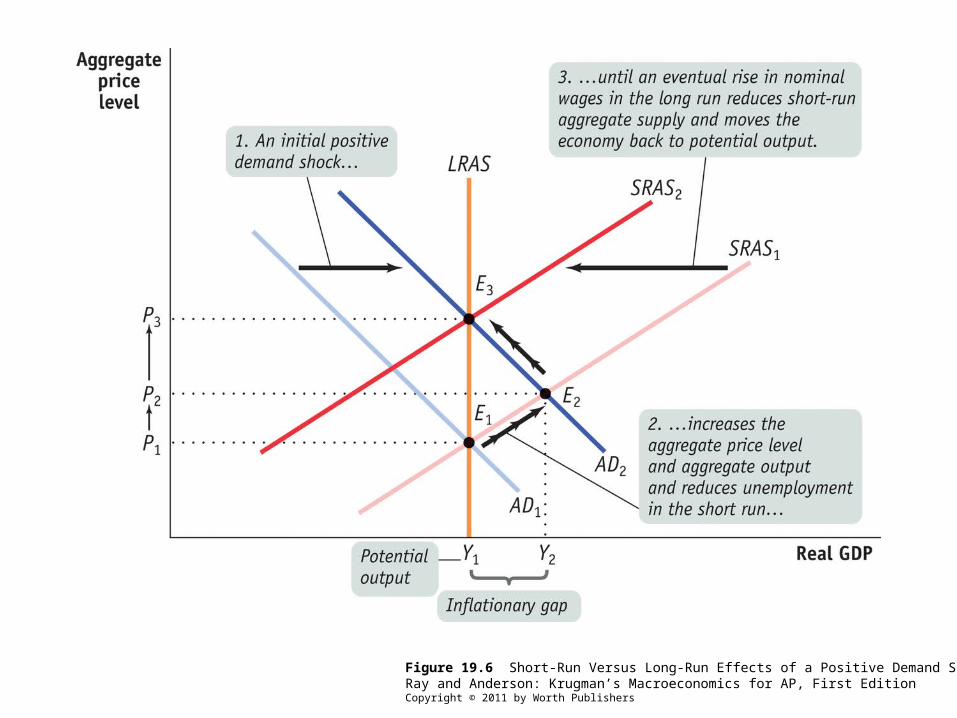
Figure 19.6 Short-Run Versus Long-Run Effects of a Positive Demand ShockRay and Anderson: Krugman’s Macroeconomics for AP, First EditionCopyright © 2011 by Worth Publishers
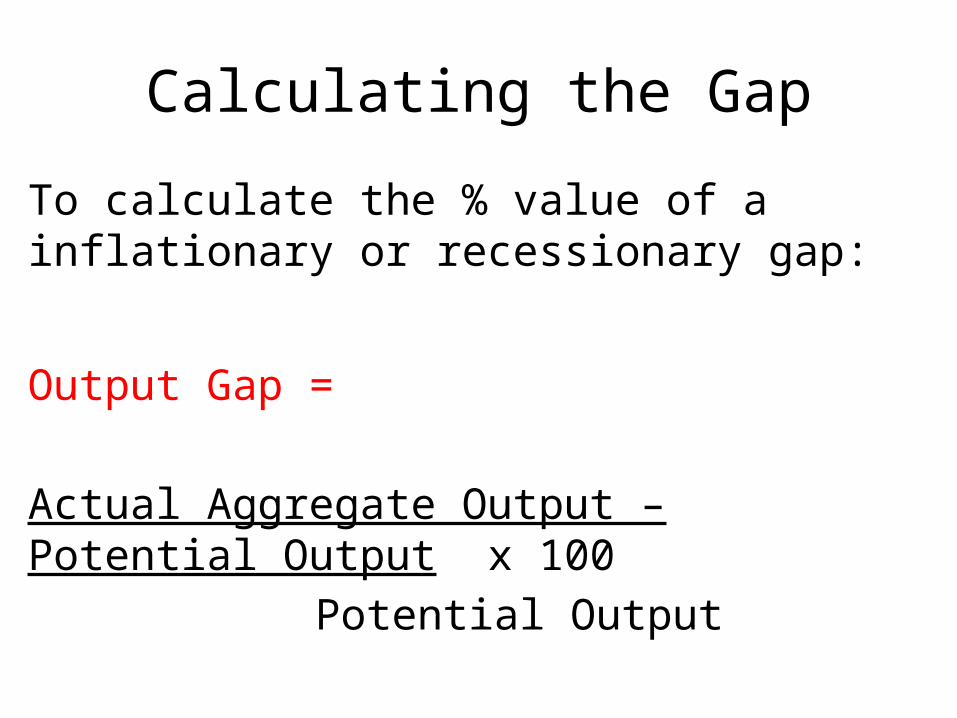
Calculating the Gap
To calculate the % value of a inflationary or recessionary gap:
Output Gap =
Actual Aggregate Output – Potential Output x 100Potential Output
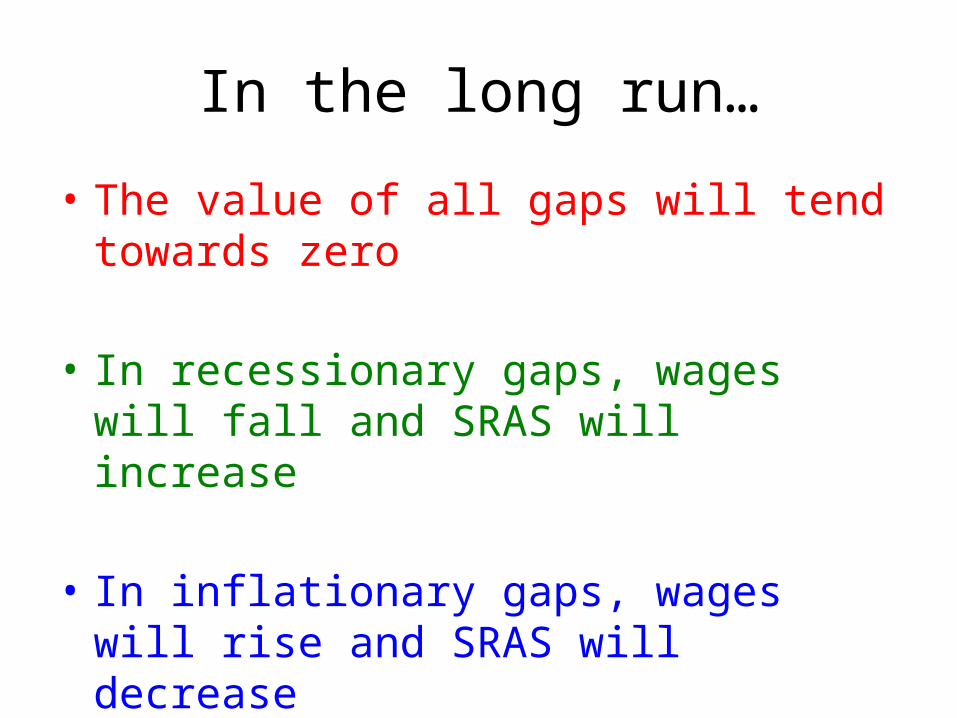
In the long run…
• The value of all gaps will tend towards zero
• In recessionary gaps, wages will fall and SRAS will increase
• In inflationary gaps, wages will rise and SRAS will decrease
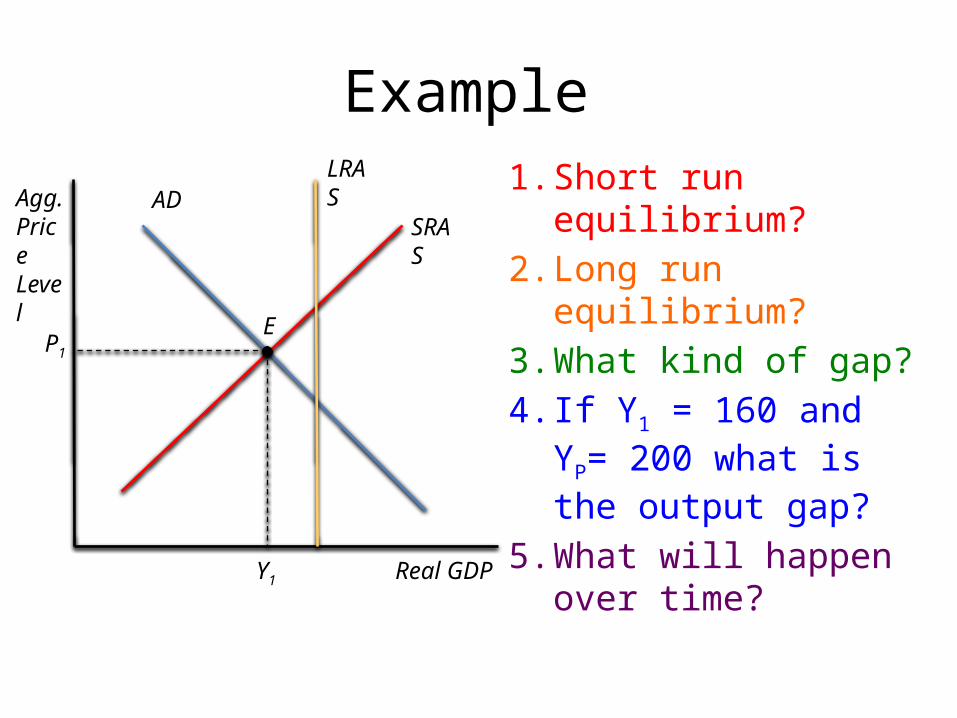
Example1. Short run equilibrium?2. Long run equilibrium?3. What kind of gap?4. If Y1 = 160 and YP= 200
what is the output gap?
5. What will happen over time?
LRAS
SRASAD
Real GDP
Agg.PriceLevel
EP1
Y1


