+ All Categories
Home > Documents > Agilent 89601B/BN-B7Y 802.16e Mobile and 802.16 … FDD, and H-FDD, both uplink and downlink...

Agilent 89601B/BN-B7Y 802.16e Mobile and 802.16 … FDD, and H-FDD, both uplink and downlink...

Date post: 14-May-2018
Category:
Upload: vannga
View: 216 times
Download: 1 times
Share this document with a friend
15
Key Features Analyze a wide variety of WiMAX formats Easily configure the 89600B, with complete control over mea- surement setup parameters Gather info on PHY layer performance and errors Choose where to focus analysis Analyze 2x2 matrix A or B STC/MIMO systems (Mobile WiMAX only) Gain 20:20 insight into your signal using 20 traces, sized the way you want, each with 20 markers 89601B/BN-B7Y 802.16e Mobile and 802.16 OFDM Fixed WiMAX TM Modulation Analysis 89600B VSA Software Technical Overview
Transcript

Key Features• Analyze a wide variety of WiMAX formats

• Easily confi gure the 89600B, with complete control over mea-

surement setup parameters

• Gather info on PHY layer performance and errors

• Choose where to focus analysis

• Analyze 2x2 matrix A or B STC/MIMO systems

(Mobile WiMAX only)

• Gain 20:20 insight into your signal using 20 traces, sized the way

you want, each with 20 markers

89601B/BN-B7Y 802.16e Mobile and

802.16 OFDM Fixed WiMAXTM Modulation Analysis

89600B VSA Software

Technical Overview

2

This high performance 89600B vec-

tor signal analysis (VSA) software

provides RF and baseband engineers

the industry’s most comprehensive

OFDMA and OFDM PHY layer analysis

tools for the IEEE-802.16 standard.

Perform time-selective, frequency-se-

lective, or modulation measurements

simultaneously to decompose a signal

and uncover anomalies you have

never been able to see before.

Option B7Y offers an advanced and

comprehensive toolset for evaluating

and troubleshooting the IEEE 802.16e-

2005 OFDMA PHY layer signaling

format. Perform analysis of uplink and

downlink signals, with all zone types,

all bandwidths, and all FFT lengths.

Analyze DL-PUSC signals using

2-antenna matrix A or B transmission

schemes for STC/MIMO.

The same option (B7Y) also supports

advanced modulation analysis of IEEE

802.16-2004 OFDM signals and pro-

vides key insights into those signals.

This toolset is capable of analyzing

all modulation types: BPSK, QPSK,

16QAM, 64QAM, all frame formats,

TDD, FDD, and H-FDD, both uplink and

downlink signals, burst and continu-

ous, plus all frame lengths, guard

intervals, and sampling factors. With

B7Y, you can demodulate your signal

down to the raw bit level.

IEEE 802.16d and 802.16e are 2 of

over 70 signal standards and modu-

lation types for which the 89600B

vector signal analysis software cre-

ates a window into what’s happening

inside your complex wireless devices.

The 89600B tools provide views of

virtually every facet of a problem,

helping you see the “why?” behind

signal problems. Whether you’re

working with emerging or established

standards, Agilent’s industry-leading

89600B VSA software helps you see

through the complexity.

Technology overviewThe IEEE 802.16-2004 and 802.16a-

2003 standards, often referred to as

Fixed WiMAX, defi ne the physical

layer (PHY) and medium access con-

trol (MAC) protocol that defi ne prod-

ucts that extend broadband wireless

access (BWA) from the local area

network to the metropolitan area net-

work. These standards contain speci-

fi cations for licensed and unlicensed

BWA networks operating between 2

and 11 GHz. In order to address the

international wireless market and

regional spectrum regulations, the

WiMAX standard includes varying

channel bandwidths, between 1.25 to

20 MHz. The 802.16-2004 standard,

sometimes referred to as 802.16d,

includes minor improvements over

the earlier 802.16a-2003 standard. The

802.16-2004 standard also provides

system profi les that can be used for

product compliance testing.

Mobile WiMAX is based on 802.16-

2004 and 802.16e-2005, now com-

bined into a single document. The

updated standard combines fi xed and

mobile services into network architec-

ture similar to a cellular system where

a single base station can support

fi xed, portable, and mobile terminals.

Unlike existing cellular systems,

Mobile WiMAX uses an all internet

protocol backbone. The standard

includes an OFDMA PHY layer with

sub-channelization that allows the

time and frequency resources to be

dynamically allocated among multiple

users across the downlink and uplink

sub-frames.

Adding user mobility features to the

conventional orthogonal frequency

division multiplexing (OFDM) signal

used for Fixed WiMAX introduced

substantially more fl exibility in

the way that the radio signals are

constructed. Mobility features give

the network operator the freedom to

adapt the operation of the base sta-

tion (BS) to specifi c requirements of

the physical location. It also intro-

duces many variables that need to

be understood and tested at several

levels- from basic parametric tests, to

end-to-end performance evaluation.

Try before you buy!

Download the 89600B soft-ware and use it free for 14 days to make measurements with your analysis hardware, or use our recorded demo signals by selecting File > Recall > Recall Demo > WiMax OFDMA (or WiMax Fixed) > on the software toolbar. Request your free

trial license today: (www.

agilent.com/find/89600B_

trial)

Option B7S was discontinued on

July 1 2011 and replaced with

Option B7Y, which provides both

Moible and Fixed WiMAX analysis.

WiMAX Modulation Analysis

Table of Contents

WiMAX Modulation Analysis .....................................................................3

Analysis and Troubleshooting ....................................................................4

Software Features ..........................................................................................7

Key Specifi cations ........................................................................................12

Additional Resources ..................................................................................20

3

WiMAX analysis offers important data burst, frame, and overall signal performance metrics in tabular

or trace formats. Gain 20:20 clarity into your signal’s performance using 20 screens, each with up to

20 markers each.

Appropriate use of color highlights the salient features for each format. In Fixed WiMAX, color rep-

resents the various modulation formats as each user transmit sequentially. In Mobile WiMAX color

represents different user bursts.

Compare the Format tabs for Fixed and Mobile WiMAX. Dynamic Help text provides information on

either format, as well as many other important analysis features.

Analysis and Troubleshooting

Thoroughly analyze signals Troubleshoot using a full suite of time,

frequency, and modulation domain

analysis tools that let you demodulate

and characterize errors down to the

bit level. Focus on a subset of the

symbols for time-selective analysis,

or on a single carrier for frequency-

selective analysis. Error traces provide

detailed information on pilot errors,

and signal RCE versus time and fre-

quency. Evaluate results using a wide

selection of measurement tools, in-

cluding compound constellations and

detected allocations (Mobile WiMAX),

with all measurements color-coded

for easy at-a-glance visualization.

Option B7Y summary tables provide

RCE/EVM and power metrics for data

burst, frame, and overall signal.

Analyze a wide range of WiMAX formats Option B7Y helps you measure Mobile

WiMAX signals from the frame down

to the bit level, and perform multi-

burst or selective burst analysis–even

MIMO. Use Option B7Y to completely

characterize the Fixed WiMAX DL/

UL PHY layer, including FDD, H-FDD,

and TDD modes using all modulation

formats, analysis bandwidths, frame

lengths, guard intervals, and sampling

factors.

4

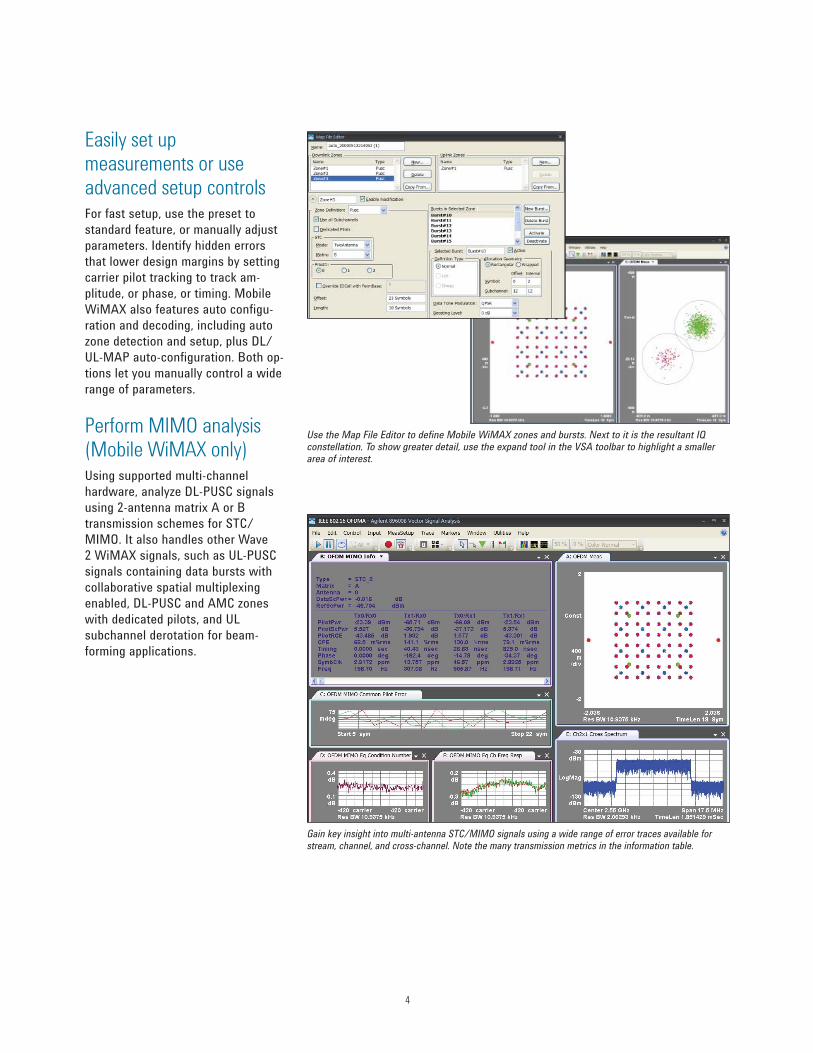
Use the Map File Editor to defi ne Mobile WiMAX zones and bursts. Next to it is the resultant IQ constellation. To show greater detail, use the expand tool in the VSA toolbar to highlight a smaller area of interest.

Gain key insight into multi-antenna STC/MIMO signals using a wide range of error traces available for stream, channel, and cross-channel. Note the many transmission metrics in the information table.

Easily set up measurements or use advanced setup controls For fast setup, use the preset to

standard feature, or manually adjust

parameters. Identify hidden errors

that lower design margins by setting

carrier pilot tracking to track am-

plitude, or phase, or timing. Mobile

WiMAX also features auto confi gu-

ration and decoding, including auto

zone detection and setup, plus DL/

UL-MAP auto-confi guration. Both op-

tions let you manually control a wide

range of parameters.

Perform MIMO analysis (Mobile WiMAX only)Using supported multi-channel

hardware, analyze DL-PUSC signals

using 2-antenna matrix A or B

transmission schemes for STC/

MIMO. It also handles other Wave

2 WiMAX signals, such as UL-PUSC

signals containing data bursts with

collaborative spatial multiplexing

enabled, DL-PUSC and AMC zones

with dedicated pilots, and UL

subchannel derotation for beam-

forming applications.

5

Take advantage of the 89600B’s rich set of time-domain capabilities, including triggering, time gating,

and powerful markers to analyze WiMAX signals.

Use the innovative cumulative history on error traces to gain important insight. Traces C and E are

both showing EVM spectrum data. The marker in Trace D is on an apparent outlying point, but it has

a 49% density, meaning that the signal landed on or transited through this point 49% of the time.

This is an important insight when evaluating design margins.

Helpful tools The 89600B VSA includes signal

capture and playback capabilities.

Use it to capture burst and transient

signals for analysis. Take advantage

of tools like overlap processing for

detailed “slow motion” analysis and

the spectrogram and cumulative

history traces for evaluating the

dynamic frequency and amplitude

behavior of your signal over time.

Get a complete view of complex

signals like WiMAX by using the

89600B’s 20:20 capability: display 20

measurement windows, each with up

to 20 markers each.

Choosing between 89600B VSA software and X-Series

measurement applications

89600B VSA is the industry-leading measurement software for evaluating

and troubleshooting wireless signals in R&D. PC-based, supporting numer-

ous measurement platforms, the 89600B provides the flexibility and sophis-

ticated measurement tools essential to finding and fixing signal problems .

X-Series measurement applications provide embedded format-specific,

one-button measurements for X-Series analyzers. With fast measurement

speed, pass/fail testing and simplicity of operation, these applications are

ideally suited for design verification and manufacturing. For more informa-

tion, visit www.agilent.com/find/X-Series_Apps.

6

Software Features

Measurement conditions

Signal acquisition

Standards supported IEEE Std 802.16-2009 (Mobile WiMAX)

Maximum demod span Max Span = BW * BWRatio * 4 /1.28

Auto-confi guration DLMAP-driven for downlink measurements; automatic DIUC0 detection; uplink subframe statistically

evaluated to determine permutation base and burst geometry for most mobile WiMAX default profi les;

auto-confi guration information from decoded MAPs may be copied to user MAPFile

Adjustable setup parameters

Formats setup

Preset to standard selections TTA-Phase 2 (Wibro), IEEE 802.16 OFDMA (5MHz), IEEE 802.16 OFDMA (10 MHz)

Subframe type Downlink, Uplink

Standard IEEE 802.16 OFDMA, P802.16 OFDMA (Cor1/D2)

Nominal bandwidth 1.25, 3.5, 4.375, 5, 7, 8.75, 10, 14, 15, 17.5, 20, 28 MHz

Guard interval 1/8 default, user settable from 0 to 1.0

Frame length User settable

Downlink frame ratio 0-1.00; defi nes start of uplink subframe

Preamble Index User settable

Override preamble defi nition Check box which allows manual setting of IDCell and Segment values

Subchannel group bitmask Specifi es which subchannel groups can be used to defi ne DL-PUSC data bursts

Zone defi nition

Enable bust analysis Yes, no

Enable defi ned burst boosting levels Yes/no; allows for using defi ned boosting level

Defi nition Source Selects source defi ning map fi le used for decoding signal

Auto-detect (from decoded DLMAP) Auto-confi gures the downlink subframe and uplink subframe zone defi nitions for the current downlink

measurement based on the decoded FCH,  DL-MAP, and UL-MAP messages of the downlink subframe

Zone index Selects which zone described in the DLMAP will be analyzed

Save map fi le Saves the auto-decoded map fi le to disk; downlink only

Map fi le

Name Select map fi le to use for decoding signal

Active zone Select which zone to activate and display

Edit map fi le Brings up map fi le editor which allows import, export of map fi le, or the ability to defi ne downlink/uplink

zones, and bursts

Manual zone defi nition Brings up detailed zone and burst editor to manually defi ne map for signal decoding

Zone name Enter zone name

Type PUSC, FUSC, AMC, OFUSC

Use all subchannels Checkbox to determines how the subchannels are allocated for the DL-PUSC zone analysis (DL only)

Dedicated pilots Specifi es whether the pilots are associated with each data burst, or whether common pilots are used by all

data bursts (Downlink zone only)

STC setup Determine STC parameters

Mode None, two antenna, three antenna, four antenna

Matrix A, B, C

Mobile WiMAX

7

PrbsID 0, 1, 2 (downlink only)

Override IDCell with PermBase Specifi es that Permbase is to be used for IDCell value

Offset Specifi es the symbol offset within the measurement frame the data analysis region begins relative to the

start of the subframe

Length Defi nes maximum data analysis region for the measurement zone specifi ed in symbols

Burst defi nition

Bursts in selected zone Names of bursts in zone, along with ability to create new burst, delete existing burst, and activate/deacti-

vate existing burst

New burst defi nition

Selected Burst Name of selected burst, and active yes/no

Defi nition type Normal, FCH, DLMap

Allocation geometry Shape of selected burst: rectangular, wrapped

Symbol Size/location of burst in symbols, listing # of symbols offset, and interval length

Subchannel Size/location of burst in subchannels, listing # of subchannels offset, and interval length

Data tone modulation QPSK, 16 QAM, 64 QAM

Boosting level Ratio of the RMS/subcarrier power level of the active preamble subcarriers compared to the

RMS/subcarrier power level of the active data subcarriers in the analysis zone; 9 to -12 dB in 3 dB steps

STC/MIMO setup

Measure input channel Select channel 1, 2

Matrix decoder Enable, select matrix stream to measure: stream 1/2

Transmit antenna pilot pattern override Enables override to sync to transmit antenna 0/1/2/3

Cyclic delay diversity (CDD) Applies "Cyclic-Delay Diversity" (CDD) measurement analysis

Include inactive antenna paths on

MIMO traces

Yes, no; includes inactive antenna paths into the STC/MIMO OFDMA analysis

Normalize each MIMO path in

frequency response

Yes, no; selects normalized or non-normalized MIMO channel frequency response trace data

Time Setup

Acquisition length Signal capture length in terms of contiguous OFDMA frames; used by the analyzer for demodulation and

signal analysis

Analysis offset Number of frames that are offset from the start of the data acquisition

Pulse search Allows the analyzer to demodulate 802.16 OFDMA signals that do not exhibit RF Burst characteristics

Override measurement region

(demodulation)

Allows manual specifi cation of "zoomed" measurement analysis region, and also allows change or addition

of additional time domain data to the Time trace and computed trace results; set offset, interval

Measurement region (non-demod) Allows selection of pre-defi ned region of the time record to include in the Time trace and therefore also

defi nes what Time domain data is used to compute the Spectrum and CCDF/PDF/CDF traces; demodulation,

frame, zone, preamble

Include transition regions Yes, no; adds additional time domain data before and after the pre-demod data region in the Time trace

Advanced setup

Enable additional demodulator settings Yes, no; enables/disable most advanced demodulator settings

Restrict bandwidth to standard values Yes, no

Data tone modulation Enable/disable data tone modulation autodetect (use burst defi nitions)

Pilot tracking Select from any/all of 3 channel estimation and error correction modes; Track Amplitude, Track Phase, and

Track Timing

8

Compensation

Compensate IQ mismatch Allows removal of IQ impairments

Mirror frequency spectrum Allows correct demodulation of frequency spectrums that are mirrored (fl ipped) about the center frequency

Enable multicarrier fi lter Specifi es whether to apply a fi lter to received signal to fi lter out adjacent carriers

Symbol time adjustment Allows adjustment of the “useful symbol time period” (TFFT) within the “OFDMA extended symbol time

period” (TS)

Display options

Burst power is per-subcarrier Selected, data burst power results computed as per-subcarrier power metric; cleared, data burst power

results computed as total power over measurement interval

Compensate modulation PRBS

(de-rotate)

Allows removal of the the modulation PRBS from the OFDM IQ traces

Normalize IQ traces If selected, IQ trace data results (including IQ Meas, IQ Ref, Error Vector Time and Error Vector Spectrum)

are normalized

Decoding

DL-MAP decoding Decodes DL-MAP messages of the downlink subframe and reports the interpreted results

UL-MAP decoding Decodes UL-MAP messages of the downlink subframe when a UL-MAP exists and reports the interpreted results

Decode to map Provides option to not replace the analyzer measurement state, which is saved to the setup fi le with current

measurement auto-decoded Map File; downlink only

Equalizer training

Preamble only Equalizer trained using the channel estimation sequence in the preamble of the OFDMA burst; downlink only

Preamble, pilots, and data Equalizer trained by analyzing entire OFDMA burst, including the channel estimation sequence

(contained in the preamble), the data symbols, and pilot symbol; downlink only

Preamble and pilots Equalizer trained by analyzing entire OFDMA burst, including the channel estimation sequence

(contained in the preamble) and pilot symbols; downlink only

Enable equalizer smoothing fi lter Applies fi lter to channel estimation frequency response

Burst profi les

Downlink burst profi les Provides a set of values for DIUC Index = 0 thru 12 , specifying a value for the burst profi le used

(modulation type, coding type and coding rate)

Uplink burst profi les Provides a set of values for UIUC Index = 1 thru 10, specifying a value for the burst profi le used

(modulation type, coding type and coding rate)

9

Measurement conditions

Signal acquisition Not all supported hardware is compatible with all bandwidths.

Supported standards IEEE 802.16-2004 (Fixed WiMAX)

Supported modes Uplink and downlink; continuous and burst; TDD, FDD, H-FDD

Modulation formats BPSK (pilots only), QPSK, 16QAM, 64QAM (auto detect, manual input)

Span Constrained to within approximately 10x signal bandwidth

Adjustable setup parameters

Format parameters

Preset to standard 1.25 MHz, 1.5 MHz, 1.75 MHz, 2.5 MHz, 3 MHz, 3.5 MHz, 5 MHz, 5.5 MHz, 6 MHz, 7 MHz, 10 MHz, 11 MHz,

12 MHz, 14 MHz, 15 MHz, 20 MHz, 24 MHz, 28 MHz

Bandwidth Settable, nominal per standard

Manual Fs/BW ratio Settable to 8/7, 57/50, 86/75, 144/1 25, 316/275, or arbitrary between 0.5 and 2.0

Data subcarrier modulation format Automatic, from FCH, or Manual: BPSK, QPSK, 16 QAM, 64 QAM

Guard Interval Settable, 1/32, 1/16, 1/8, 1/4, or other value between 0 and 1

Time parameters

Search length Adjustable, limits may depend on input hardware

Result length Auto-detected, from FCH, or manually adjustable

Measurement offset Settable between 0 and (result length - measurement interval)

Measurement interval Settable between 0 and result length

Advanced setup parameters

Normalize IQ traces Turns normalization on or off; on means each subcarrier is normalized so that the RMS level of the ideal

constellation is one

Mirror frequency spectrum Specifi es whether to do frequency inversion before attempting to synchronize to and demodulate the signal

Subchannel index 1 to 31 (for uplink signal analysis)

Symbol timing Adjustable from –(guard interval)/100 to 0

Sub carrier selection Selectable all; or single sub carrier # –100 to +100 (0 not allowed); or pilot sub carriers only

Pilot sub carrier tracking Amplitude, phase, timing

Equalizer training Via channel estimation sequence in preamble; or estimation sequence plus data

OFDM trace results

CCDF Complementary cumulative distribution function of time trace; extra time data before start and after end of

burst not included

CDF Cumulative distribution function of time trace; extra time data before start and after end of burst not

included

Equalizer channel frequency response One point per sub carrier; frequency response shown dependent on equalizer training value selected; also

instantaneous trace available

Equalizer channel frequency response

differential

Shows the adjacent subcarrier power difference in dB

Common pilot error Shows the difference between the measured and ideal pilot subcarrier symbols; one point analyzed per

OFDM symbol

Correction Frequency domain correction applied to raw measured time data

Equalizer impulse response Impulse response of the equalization fi lter; impulse response result length = 4 x FFT length

Error vector spectrum EVM at one point per sub carrier per analyzed OFDM symbol time

Fixed WiMAX

10

Error vector time EVM at one point per sub carrier per analyzed OFDM symbol time

Instantaneous spectrum Frequency spectrum of the time trace, without averaging

IQ measured data IQ data; one point per sub carrier per analyzed OFDM symbol time; all modulation formats shown

IQ reference data IQ data used as ideal; one point per sub carrier per analyzed OFDM symbol time; all modulation formats

shown

Marker data Detailed OBW or ACP tables

PDF Probability density function of time trace

Preamble frequency error Frequency error vs. time, during the preamble (including during all the long preamble)

Raw main time Block data acquired by hardware, including extra data for fi lter settling

RMS averaged error vector spectrum RMS averaged EVM; one point per sub carrier

RMS averaged error vector time EVM time; one point per OFDM symbol analyzed

Search time Block data acquired and searched for an RF burst

Spectrum Frequency spectrum of time trace, or averaged time if averaging on

Subframe information Summarizes entire subframe data and power characteristics, including: modulation types used, their rela-

tive power, number of symbols and RCE for each one, preamble type, header checksum validation, frame

number, and confi guration change bit value

Symbols/error Error summary with raw OFDM detected symbols

CPE RMS RMS level of (CPE-1), where CPE is the complex correction value detected during pilot tracking

RCE (Relative Constellation Error)

(EVM)

RMS level of the relative constellation error vector, % or dB

RCE peak Peak level of the relative constellation error vector, % or dB

RCE peak symbol OFDM symbol number where RCE peak was detected

Frequency error Averaged measured carrier frequency minus analyzer center frequency

IQ gain imbalance Ratio of I (in-phase) to Q (quadrature phase), dB

IQ offset Carrier leakage measured during channel estimation sequence portion of preamble, dB

IQ quadrature error Quadrature skew, degrees

Pilot RCE RMS EVM level for pilot sub carriers, averaged over all analyzed OFDM symbols

Symbol clock error Timing error, ppm

Sync correlation Correlation coeffi cient between measured and ideal preamble

Time Block data detected by pulse search

11

This technical overview provides nominal performance specifi cations for the software when making measurements with

the specifi ed platform. Nominal values indicate expected performance, or describe product performance that is useful in

the application of the product, but is not covered by the product warranty. For a complete list of specifi cations refer to

the measurement platform literature.

Key Specifi cations1

X-Series signal analyzers

Mobile WiMAX

PXA MXA

Includes Option BBA as noted

EXA

Includes Option B25 as noted

Measurement conditions

Range Input range within one input attenuator step (2 dB) of total signal power

Input range ≥ –30 dBm, within 2 dB of full scale

Input range ≥ –30 dBm, within 2 dB of full scale

FFT size 128, 512, 1024, 2048 128, 512, 1024, 2048 128, 512, 1024, 2048

Bandwidth 1.25 MHz, 3.5 MHz, 4.375 MHz, 5 MHz, 7 MHz, 8.75 MHz, 10 MHz, 14 MHz2, 15 MHz2, 17.5 MHz2, 20 MHz2, 28 MHz3

1.25 MHz, 3.5 MHz, 4.375 MHz, 5 MHz, 7 MHz, 8.75 MHz, 10 MHz, 15 MHz2, 17.5 MHz2, 20 MHz2

1.25 MHz, 3.5 MHz, 4.375 MHz, 5 MHz, 7 MHz, 8.75 MHz, 10 MHz, 15 MHz2, 17.5 MHz2, 20 MHz2

Signal playback

Result Length 15 frames, 5 msec frame length and span = 10 MHz

Capture Length (Gap-free analysis) 21.4 s (10 MHz span) 80 msec (17.5 MHz span)2 80 msec (17.5 MHz span)2

11.9s (17.5 MHz span) with Opt. B25

260 msec (10 MHz span) with Opt. BBA (BBIQ only):11.8 sec (17.5 MHz span)5 sec (80 MHz span-requires Opt. S40, BBA)

260 msec (10 MHz span)

Accuracy2, 3, 4, 5

Center frequency 2.7 GHz, 3.5 GHz 2.7 GHz, 3.5 GHz 2.7 GHz, 3.5 GHz

Residual EVM 20 averages; RCE and Data RCE; Range = –10 dBm

20 averages; RCE and Data RCE 20 averages; RCE and Data RCE;

Downlink

Signal BW5 MHz10 MHz20 MHz

ZonePUSC, FUSCPUSC, FUSCPUSC, FUSC

–51 dB–50 dB–49 dB

≤ –46 dB (≤ 50 dB)6

≤ –45 dB (≤ 48 dB)6

≤ –44 dB (≤ 45 dB)6

≤ –44 dB≤ –43 dB≤ –42 dB

Uplink With equalizer = chan est seq and pilots or equalizer = chan est seq and data. Span = BW. Uniform analysis or burst analysis with > 25 % subchannels occupied.

Signal BW5 MHz

10 MHz

20 MHz

ZonePUSCOPUSCPUSCOPUSCPUSCOPUSC

–51 dB–50 dB–50 dB–49 dB–49 dB–48 dB

≤ –45 dB (≤ –50 dB)6

≤ –44 dB (≤ –50 dB)6

≤ –44 dB (≤ –48 dB)6

≤ –43 dB (≤ –48 dB)6

≤ –43 dB (≤ –45 dB)6

≤ –42 dB (≤ –45 dB)6

≤ –42 dB (–40 db for freq > 3.0 GHz) ≤ –42 dB (–40 db for freq > 3.0 GHz)≤ –42 dB (–40 db for freq > 3.0 GHz) ≤ –42 dB (–40 db for freq > 3.0 GHz) ≤ –42 dB (–40 db for freq > 3.0 GHz) ≤ –42 dB (–40 db for freq > 3.0 GHz)

1. Data subject to change.

2. Option B25 required for spans > 10 MHz and < 25 MHz.

3. Option B40 required for spans > 25 MHz.

4. Using < 20 kHz phase optimization mode.

5. RCE/Data RCE/Unmodulated RCE computer per IEEE 802.16e 8.4.12.3.1 (for DL), IEEE 802.16e 8.4.12.3.2 (for UL).

6. Results apply to MXA with Option BBA.

12

Frequency error (relative to frequency standard)

Lock range Lock range depends on zone type, BW, BW Ratio, and FFT Size

UL-PUSC, UL-OPUSC ± 1.45 x Subcarrier spacing1, 2 = ± 16 kHz, BW = 10 MHz

DL-PUSC, DL-FUSC, DL/UL AMC ± 4.35 x Subcarrier spacing1 = ± 48 kHz, BW = 10 MHz

Accuracy

Uniform analysis or burst analysis with > 25% subchannels occupied

± 0.5 ppm (relative to signal bandwidth)

± 0.5 ppm (relative to signal bandwidth)

± 0.5 ppm (relative to signal bandwidth)

1. Subcarrier spacing = (BW * BW Ratio)/FFT Size.

2. Reduced to ± 0.5 x subcarrier spacing if any data bursts use Collaborative Spatial Multiplexing.

MXA1 EXA1

Accuracy measurement conditions

Center frequency 2.5 GHz, –10 dBm range

Residual EVM conditions Data RCE, 10 symbol DL-PUSC zone with 2-antenna STC/MIMO; Span = BW = 10 MHz; Default parameters; Matrix decoder enabled or disabled; 100% subchannels occupied with 64 QAM data; Single Matrix A or Matrix B burst; 10 averages

Confi guration Dual slaved

Measurements performed on zone #2 and zone #3. Zone #1 and the preamble were transmitted by Antenna 0, while zone #2 and zone #3 were transmitted by both Antenna 0 and Antenna 1

Pre

ambl

e

FCH

DL-

MA

P/U

L-M

AP

(co

ntin

ued)

DL-

MA

P/U

L-M

AP

(co

ntin

ued)

Burst #1 (Matrix A) Burst #2 (Matrix B)

DL-

MA

P/U

L-M

AP

Zone #1 (6 symbols) Zone #2 (10 symbols) Zone #3 (10 symbols)

Accuracy

Residual data RCE < –45 dB < –42 dB

Ant-1 time offset deviation2, 3 ± < 15 ns ± < 15 ns

Ant-1 phase offset deviation2, 3 N/A N/A

Ant-1 freq offset deviation2 ± < 1 Hz ± < 1 Hz

Pilot subcarrier power deviation2 ± < 0.1 dB ± < 0.1 dB

Data subcarrier power deviation2 ± < 0.05 dB ± < 0.05 dB

Frequency error (relative to frequency standard)

Lock range ± 4.35 x subcarrier spacing = ± 48 kHz @ BW = 10 MHz

Accuracy ± 0.5 ppm (relative to signal BW)

1. MXA and EXA are in dual slaved confi guration.

2. Deviation metrics are nominal variation observed for above confi guration with 10 acquisitions per averaged measurement.

3. MXA and EXA 2-channel RF confi guration has channel 2 to channel 1 delay jitter of ± < 60 ns on acquisition-by-acquisition basis.

2-Channel MIMO

13

90000 Series Infi niium oscilloscopes1

Accuracy measurement conditions

Center frequency 2.5 GHz, –10 dBm range

Residual EVM conditions Data RCE, 10 symbol DL-PUSC zone with 2-antenna STC/MIMO; Span = BW = 10 MHz; Default parameters; Matrix decoder enabled or disabled; 100 % subchannels occupied with 64 QAM data; Single Matrix A or Matrix B burst; 10 averages

Confi guration 2 channel

Measurements performed on zone #2 and zone #3. Zone #1 and the preamble were transmitted by Antenna 0, while zone #2 and zone #3 were transmitted by both Antenna 0 and Antenna 1

Pre

ambl

e

FCH

DL-

MA

P/U

L-M

AP

(co

ntin

ued)

DL-

MA

P/U

L-M

AP

(co

ntin

ued)

Burst #1 (Matrix A) Burst #2 (Matrix B)

DL-

MA

P/U

L-M

AP

Zone #1 (6 symbols) Zone #2 (10 symbols) Zone #3 (10 symbols)

Accuracy

Residual data RCE < –37 dB

Ant-1 time offset deviation2 ± < 50 ps

Ant-1 phase offset deviation2 N/A

Ant-1 freq offset deviation2 ± < 2 Hz

Pilot subcarrier power deviation2 ± < 0.05 dB

Data subcarrier power deviation2 ± < 0.05 dB

Frequency error (relative to frequency standard)

Lock range ± 4.35 x subcarrier spacing = ± 48 kHz @ BW = 10 MHz

Accuracy ± 0.5 ppm (relative to signal BW)

1. For a list of supported scopes, see Infi niium Oscilloscopes with 89600B VSA, Literature part number 5990-6819EN.

2. Deviation metrics are nominal variation observed for above confi guration with 10 acquisitions per averaged measurement.

2-Channel MIMO

Keep your 89600B VSA up-to-date

With rapidly evolving standards and continuous advancements in signal analysis, the 89601BU/BNU software update and subscription service offers you the advantage of immediate ac-cess to the latest features and enhancements available for the

89600B VSA software. www.agilent.com/find/89600B

14

X-Series signal analyzers

1. Data subject to change

2. Span > 10 MHz requires Option B25.

3. With Opt. BBA and Opt. B25 or S40 (BBIQ only)

4. Results apply to MXA with Option BBA.

5. Degraded by up to 3 dB for 3.0 GHz < frequency < 3.6 GHz.

6. Degraded by up to 4 dB for 3.0 GHz < frequency < 3.6 GHz.

PXA MXA

Includes Option BBA, B25 as noted

EXA

Includes Option B25 as noted

Center frequency 2.7 GHz, 3.5 GHz, 5.8 GHz 2.7 GHz, 3.5 GHz, 5.8 GHz 2.7 GHz, 3.5 GHz, 5.8 GHz

Signal playback

Result Length 15 frames, 5 msec frame length and span = 10 MHz BW = span Result length BW = span Result length

7 MHz10 MHz20 MHz2

1105 symbol times 1594 symbol times 1745 symbol times

7 MHz10 MHz20 MHz2

1105 symbol times 1594 symbol times 1745 symbol times

Capture length

(Gap free analysis at 0 % overlap ) Span Max length Span Max length Span Max length

12.5 MHz18 MHz36 MHz

16.7 s11.6 s5.8 s

7 MHz, 10 MHz > 20 MHz2 50 MHz3

266 msec88 msec8.2 sec

7 MHz, 10 MHz20 MHz2

266 msec88 msec

Accuracy

Residual EVM 20 averages; input range within 2 dB of full scale. Range ≥ –20 dBm.

20 averages; input range within 2 dB of full scale; using > 30 kHz phase noise optimization mode

Equalizer training = chan est.

seq. and data Signal bandwidth EVM Signal bandwidth EVM Signal bandwidth EVM

20 MHz ≤ –48 dB 20 MHz2 ≤ –45 dB4 20 MHz2 ≤ –45 dB

7 MHz ≤ –49 dB 7 MHz ≤ –48 dB4, 5 7 MHz ≤ –48 dB

Equalizer training = chan est.

seq. and data Signal bandwidth EVM Signal bandwidth EVM Signal bandwidth EVM

20 MHz7 MHz

≤ –46 dB≤ –47 dB

20 MHz2

7 MHz≤ –45 dB (≤ –42 dB)4

≤ –47 dB6 (≤ –45 dB)4

20 MHz2

7 MHz≤ –45 dB≤ –47 dB

Frequency error

Lock range Signal bandwidth EVM Signal bandwidth EVM Signal bandwidth EVM

20 MHz7 MHz

± 135 kHz± 47.25 kHz

20 MHz2 7 MHz

± 135 kHz± 47.25 kHz

10 MHz7 MHz

± 67.5 kHz± 47.25 kHz

Frequency accuracy ± 10 Hz ± 10 Hz ± 10 Hz

Mobile WiMAX

You can upgrade!

All 89600B options can be added after your initial purchase and are license-key enabled. For more information please refer to

www.agilent.com/find/89600B_upgrades

UPGRADE

www.agilent.com/quality

Agilent Email Updates

www.agilent.com/find/emailupdates

Get the latest information on the

products and applications you select.

Agilent Channel Partners

www.agilent.com/find/channelpartners

Get the best of both worlds: Agilent’s

measurement expertise and product

breadth, combined with channel

partner convenience.

For more information on Agilent Technologies’ products, applications or services, please contact your local Agilent

office. The complete list is available at:

www.agilent.com/find/contactus

AmericasCanada (877) 894 4414 Brazil (11) 4197 3500Mexico 01800 5064 800 United States (800) 829 4444

Asia PacificAustralia 1 800 629 485China 800 810 0189Hong Kong 800 938 693India 1 800 112 929Japan 0120 (421) 345Korea 080 769 0800Malaysia 1 800 888 848Singapore 1 800 375 8100Taiwan 0800 047 866Other AP Countries (65) 375 8100

Europe & Middle EastBelgium 32 (0) 2 404 93 40 Denmark 45 70 13 15 15Finland 358 (0) 10 855 2100France 0825 010 700* *0.125 €/minute

Germany 49 (0) 7031 464 6333 Ireland 1890 924 204Israel 972-3-9288-504/544Italy 39 02 92 60 8484Netherlands 31 (0) 20 547 2111Spain 34 (91) 631 3300Sweden 0200-88 22 55United Kingdom 44 (0) 131 452 0200

For other unlisted Countries: www.agilent.com/find/contactusRevised: June 8, 2011

Product specifications and descriptions in this document subject to change without notice.

© Agilent Technologies, Inc. 2011Printed in USA, June 17, 20115990-6390EN

www.agilent.com

Agilent Advantage Services is com-

mitted to your success throughout

your equipment’s lifetime. We share

measurement and service expertise

to help you create the products that

change our world. To keep you com-

petitive, we continually invest in tools

and processes that speed up calibra-

tion and repair, reduce your cost of

ownership, and move us ahead of

your development curve.

www.agilent.com/find/advantageservices

Additional Resources

Literature89600B Vector Signal Analysis Soft-

ware, Brochure, literature number

5990-6553EN

89600B Vector Signal Analysis Soft-

ware, Confi guration Guide, literature

number 5990-6386EN

89600B Opt 200 Basic VSA and Opt

300 Hardware Connectivity, Technical

Overview, literature number 5990-

6405EN

Agilent 89600A and 89600B Vector

Signal Analysis Software for Wave 2

Mobile WiMAX Measurements, Dem-

onstration Guide, literature number

5989-7484EN

Mobile WiMAX PHY Layer (RF) Opera-

tion and Measurement, Application

Note, literature number 5989-8309EN

Agilent WiMAX Signal Analysis,

Part 3: Troubleshooting Symbols and

Improving Demodulation, Application

Note, literature number 5989-3039EN

Webwww.agilent.com/find/89600B

www.agilent.com/find/wimax

“WiMAX,” “Fixed WiMAX,” “Mobile WiMAX,”

“WiMAX Forum,” the WiMAX Forum logo,

“WiMAX Forum Certifi ed,” and the WiMAX

Forum Certifi ed logo are trademarks of the

WiMAX Forum. All other trademarks are the

properties of their respective owners.

www.lxistandard.org

LAN eXtensions for Instruments puts

the power of Ethernet and the Web

inside your test systems. Agilent is a

founding member of the LXI consortium.


Recommended