Agilent ICP-MS Fundamentals of ICP-MS Analysis and Its Applications for Low Level Elemental Determination in Cannabis High Sample Matrix Tolerance Superior & Simple Interference Removal Ultra Wide Linear Range for Trace and Percent Level Elemental Concentration Determinations
Transcript
Agilent ICP-MS Fundamentals of ICP-MS Analysis and Its Applications for Low Level Elemental Determination in Cannabis
High Sample Matrix Tolerance
Superior & Simple Interference Removal
Ultra Wide Linear Range for Trace and Percent
Level Elemental Concentration Determinations
Agilent products and solutions are intended to be used for cannabis quality control and safety testing in laboratories where such use is permitted under state/country law.
Page 3
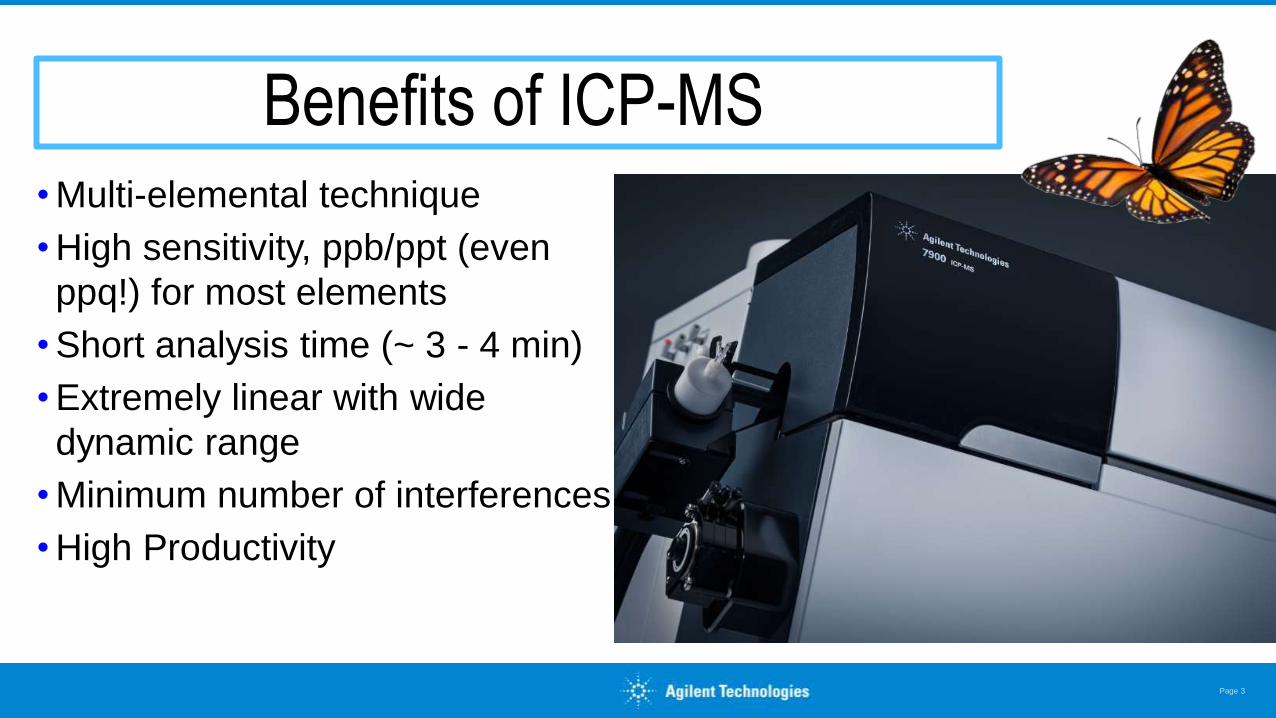
Benefits of ICP-MS • Multi-elemental technique
• High sensitivity, ppb/ppt (even
ppq!) for most elements
• Short analysis time (~ 3 - 4 min)
• Extremely linear with wide
dynamic range
• Minimum number of interferences
• High Productivity
Page 4
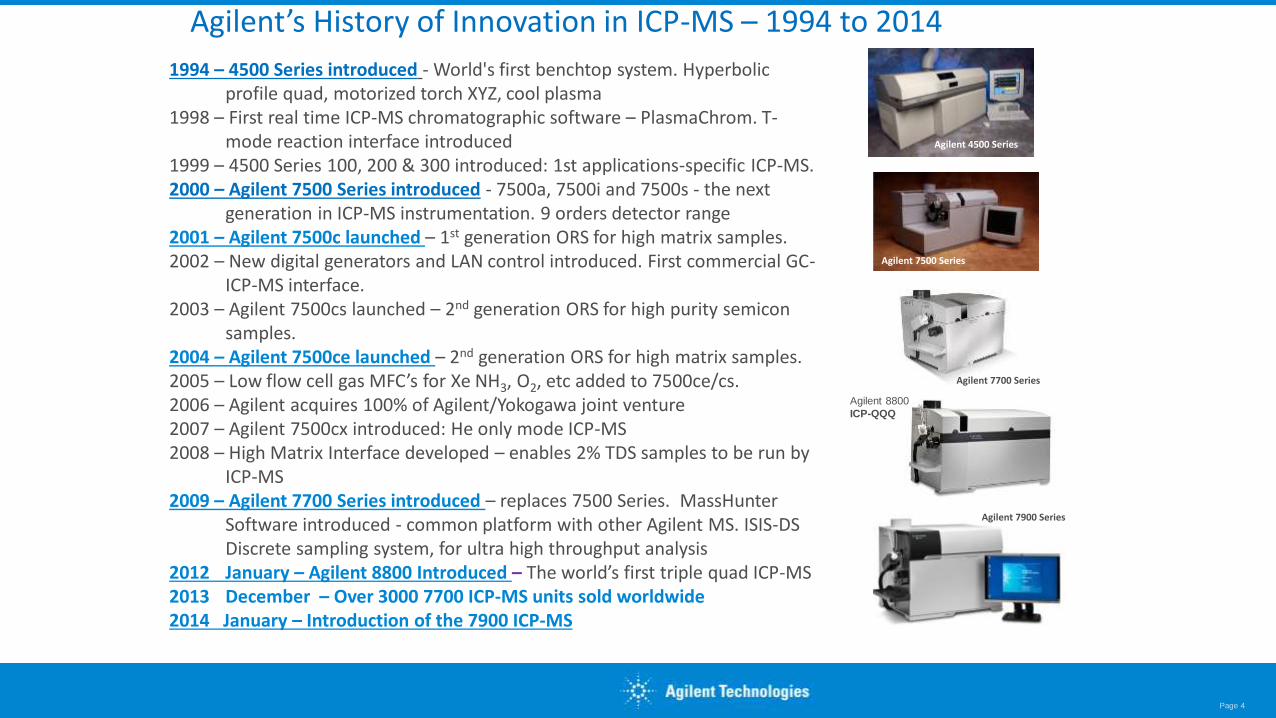
1994 – 4500 Series introduced - World's first benchtop system. Hyperbolic profile quad, motorized torch XYZ, cool plasma
1998 – First real time ICP-MS chromatographic software – PlasmaChrom. T-mode reaction interface introduced
1999 – 4500 Series 100, 200 & 300 introduced: 1st applications-specific ICP-MS. 2000 – Agilent 7500 Series introduced - 7500a, 7500i and 7500s - the next
generation in ICP-MS instrumentation. 9 orders detector range 2001 – Agilent 7500c launched – 1st generation ORS for high matrix samples. 2002 – New digital generators and LAN control introduced. First commercial GC-
ICP-MS interface. 2003 – Agilent 7500cs launched – 2nd generation ORS for high purity semicon
samples. 2004 – Agilent 7500ce launched – 2nd generation ORS for high matrix samples. 2005 – Low flow cell gas MFC’s for Xe NH3, O2, etc added to 7500ce/cs. 2006 – Agilent acquires 100% of Agilent/Yokogawa joint venture 2007 – Agilent 7500cx introduced: He only mode ICP-MS 2008 – High Matrix Interface developed – enables 2% TDS samples to be run by
Software introduced - common platform with other Agilent MS. ISIS-DS Discrete sampling system, for ultra high throughput analysis
2012 January – Agilent 8800 Introduced – The world’s first triple quad ICP-MS 2013 December – Over 3000 7700 ICP-MS units sold worldwide 2014 January – Introduction of the 7900 ICP-MS
Agilent 4500 Series
Agilent’s History of Innovation in ICP-MS – 1994 to 2014
Agilent 7700 Series
Agilent 7500 Series
Agilent 8800
ICP-QQQ
Agilent 7900 Series
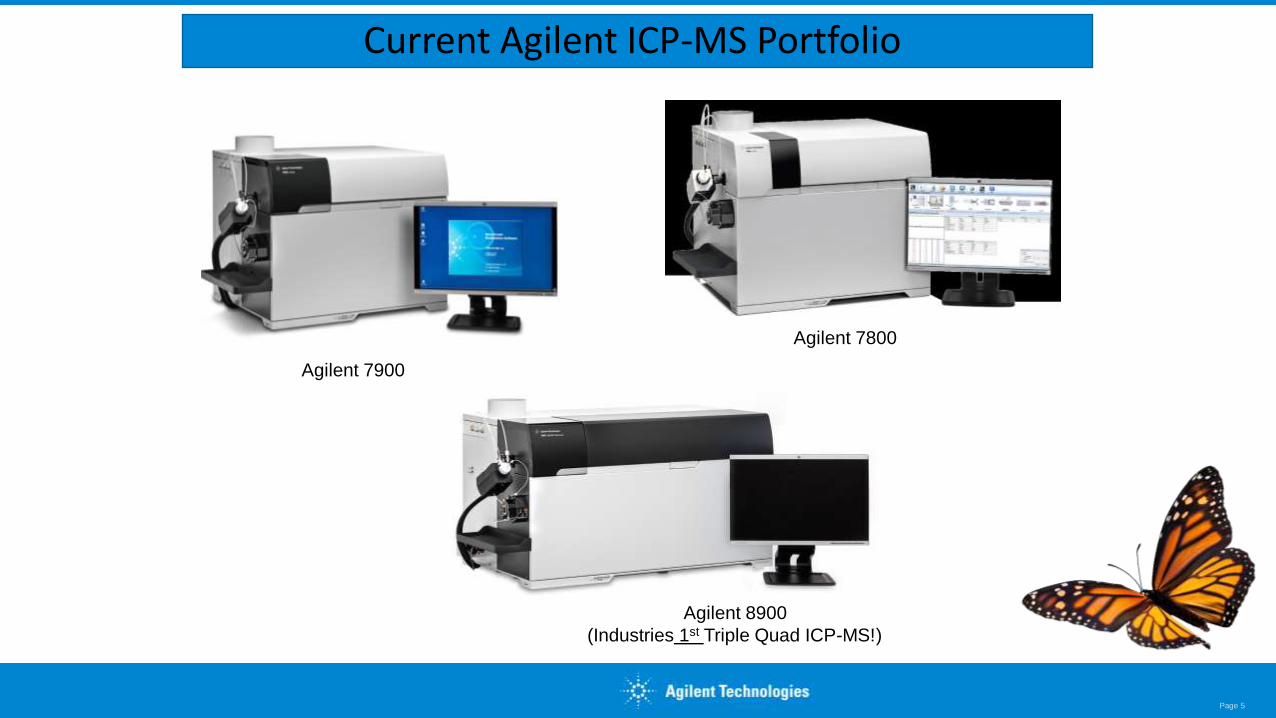
Current Agilent ICP-MS Portfolio
Page 5
Agilent 7900
Agilent 7800
Agilent 8900
(Industries 1st Triple Quad ICP-MS!)
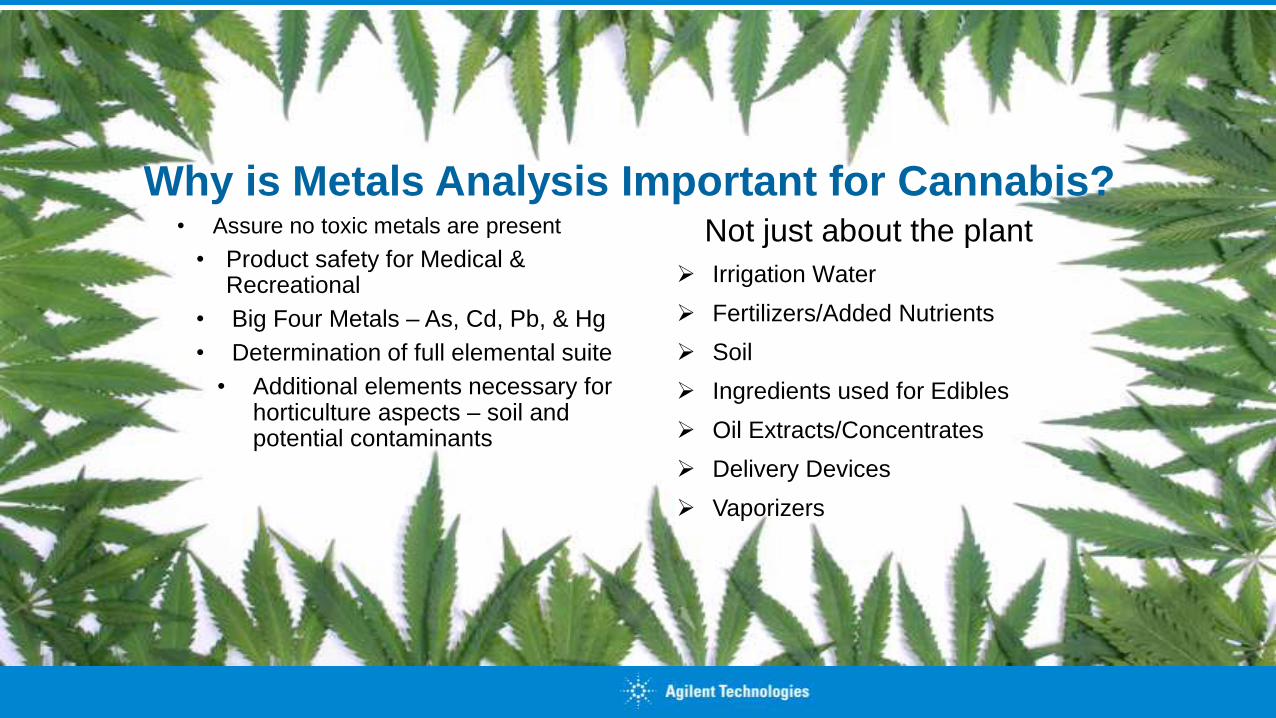
Why is Metals Analysis Important for Cannabis? • Assure no toxic metals are present
• Product safety for Medical & Recreational
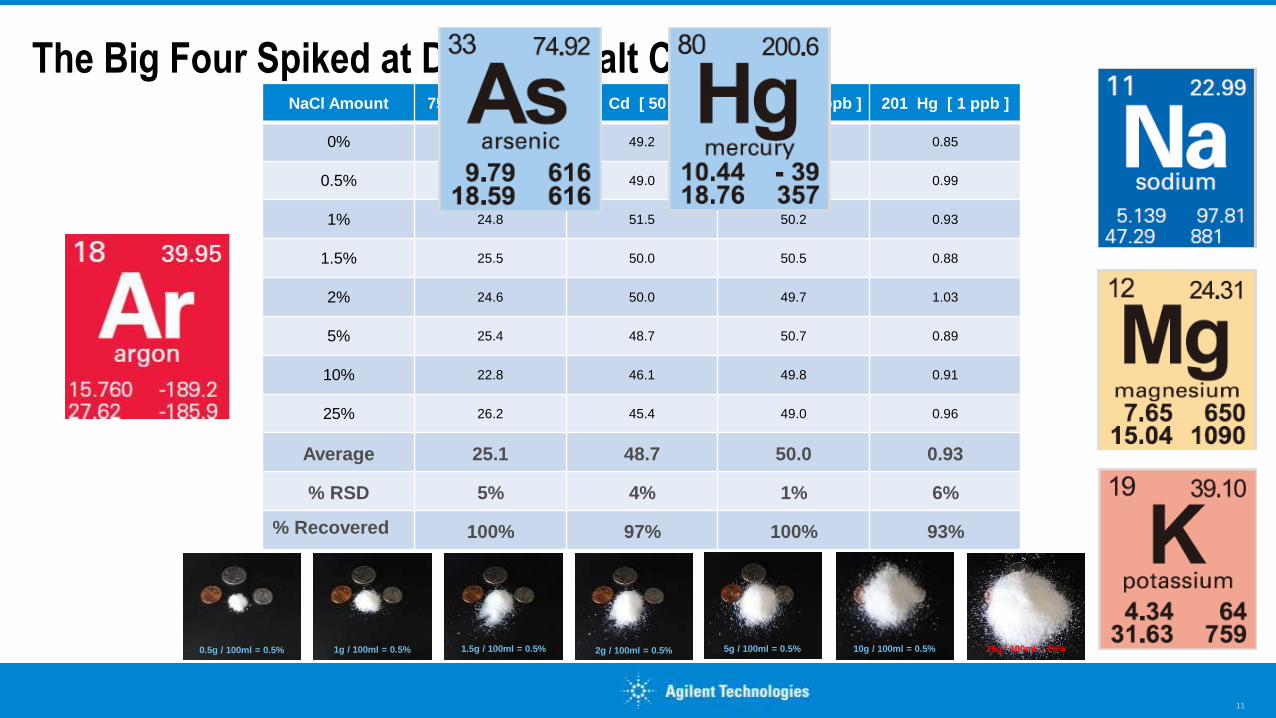
• Big Four Metals – As, Cd, Pb, & Hg
• Determination of full elemental suite
• Additional elements necessary for horticulture aspects – soil and potential contaminants
Not just about the plant
Irrigation Water
Fertilizers/Added Nutrients
Soil
Ingredients used for Edibles
Oil Extracts/Concentrates
Delivery Devices
Vaporizers
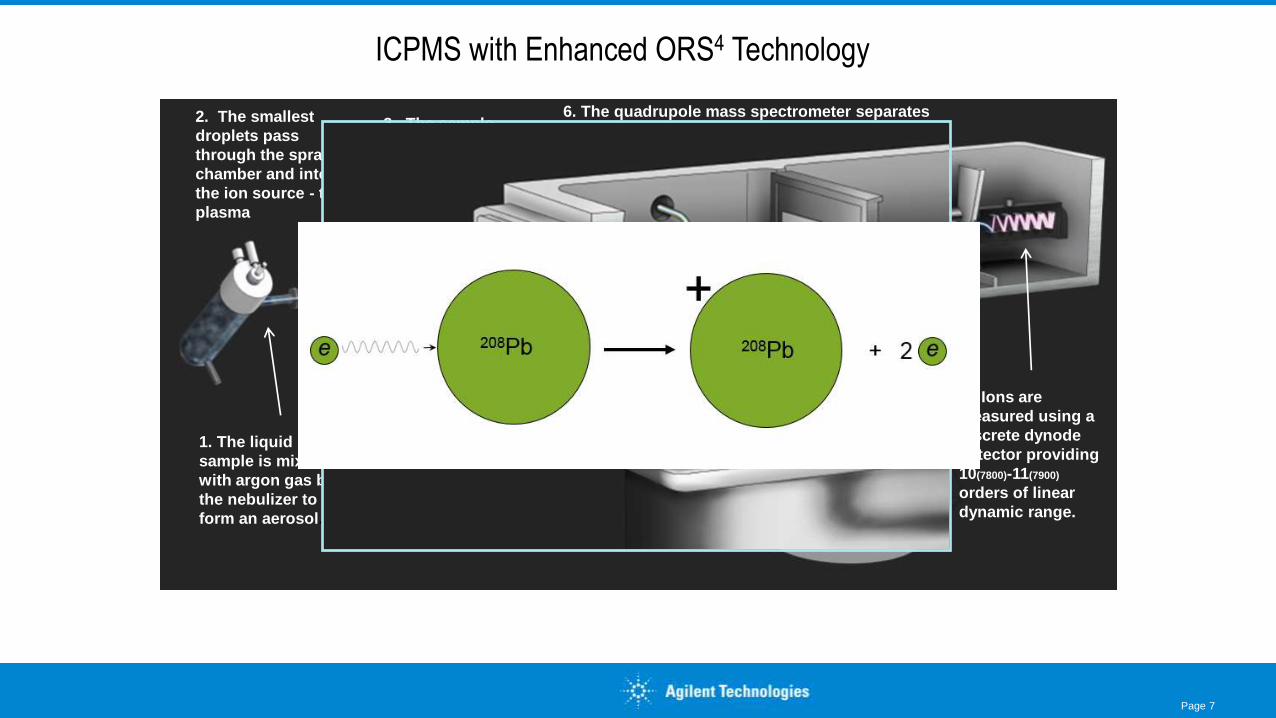
ICPMS with Enhanced ORS4 Technology
Page 7
1. The liquid
sample is mixed
with argon gas by
the nebulizer to
form an aerosol..
2. The smallest
droplets pass
through the spray
chamber and into
the ion source - the
plasma
3. The sample
is desolvated
and ionized in
the plasma
4. Ions are extracted
from the plasma by
Sampler /Skimmer
cones and extraction
lenses in the interface
region
5. Ion beam is
deflected and then
focused in Octopole.
Gases can be used to
remove interferences
6. The quadrupole mass spectrometer separates
ions based on their mass to charge ratio. The
selected ions continue on to the detector
7. Ions are
measured using a
discrete dynode
detector providing
10(7800)-11(7900)
orders of linear
dynamic range.
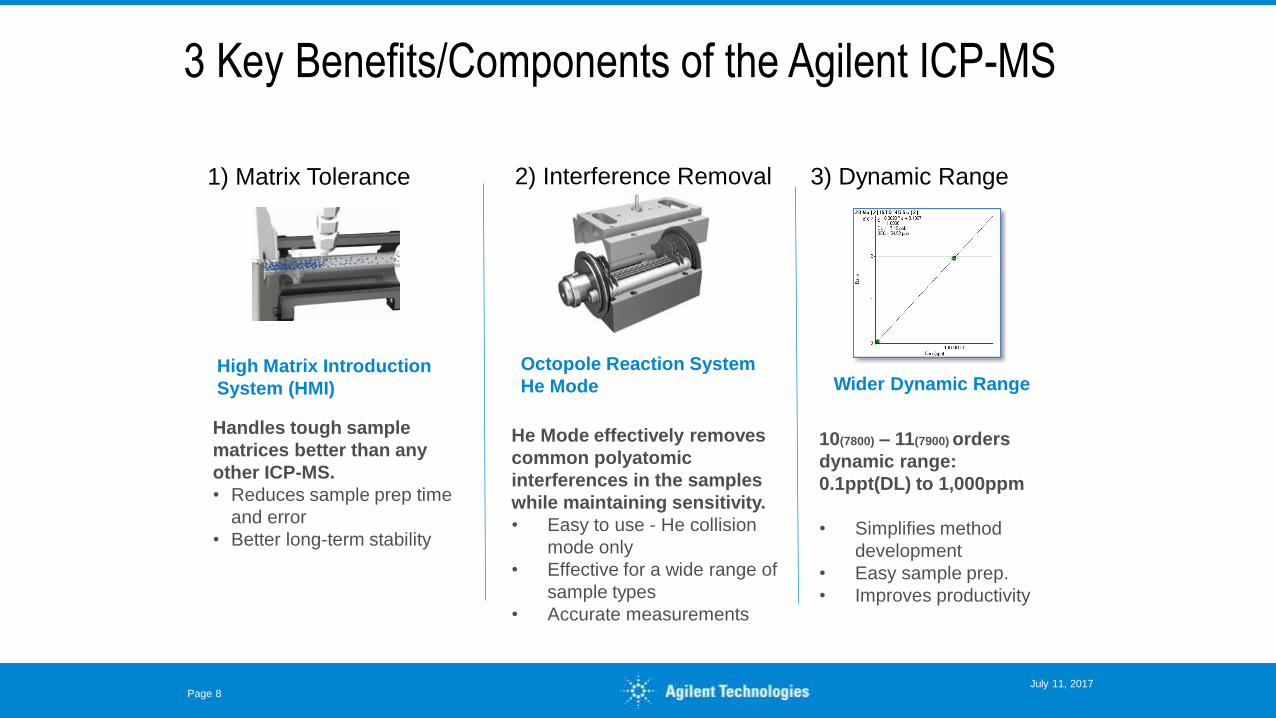
3 Key Benefits/Components of the Agilent ICP-MS
1) Matrix Tolerance 2) Interference Removal
3) Dynamic Range
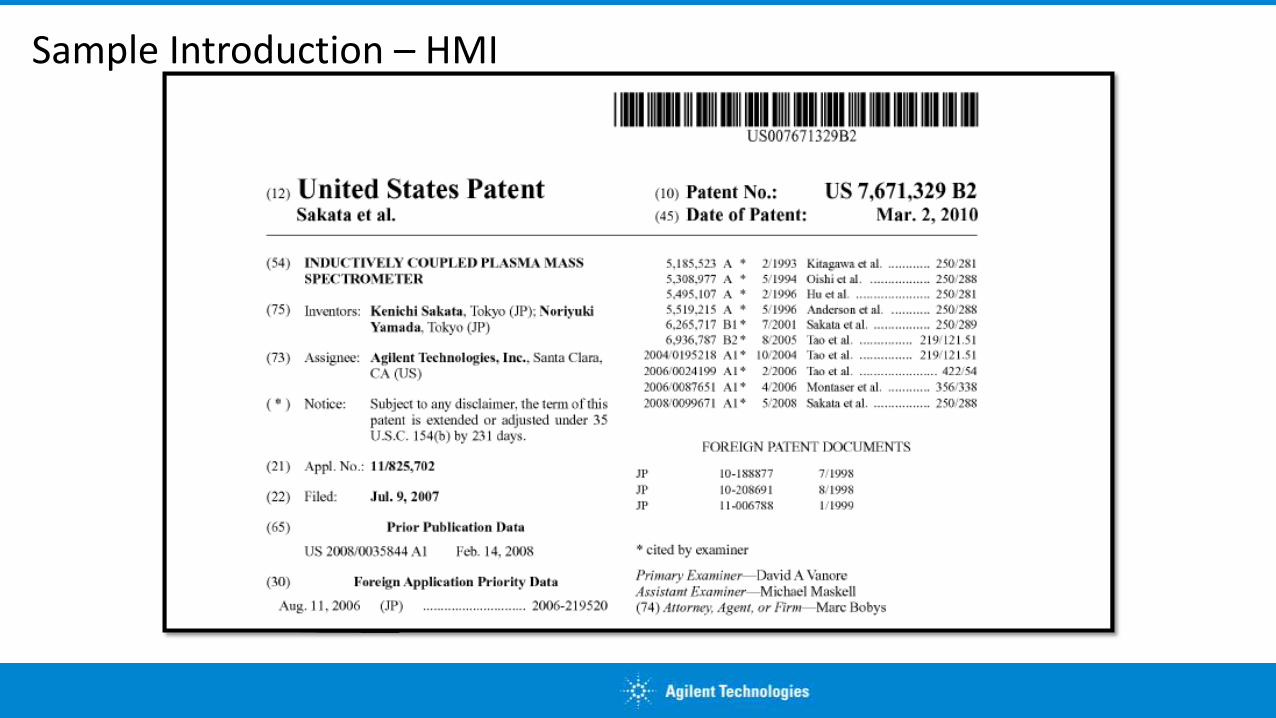
High Matrix Introduction
System (HMI)
Handles tough sample
matrices better than any
other ICP-MS.
• Reduces sample prep time
and error
• Better long-term stability
Octopole Reaction System
He Mode
He Mode effectively removes
common polyatomic
interferences in the samples
while maintaining sensitivity.
• Easy to use - He collision
mode only
• Effective for a wide range of
sample types
• Accurate measurements
Wider Dynamic Range
10(7800) – 11(7900) orders
dynamic range:
0.1ppt(DL) to 1,000ppm
• Simplifies method
development
• Easy sample prep.
• Improves productivity
Page 8 July 11, 2017
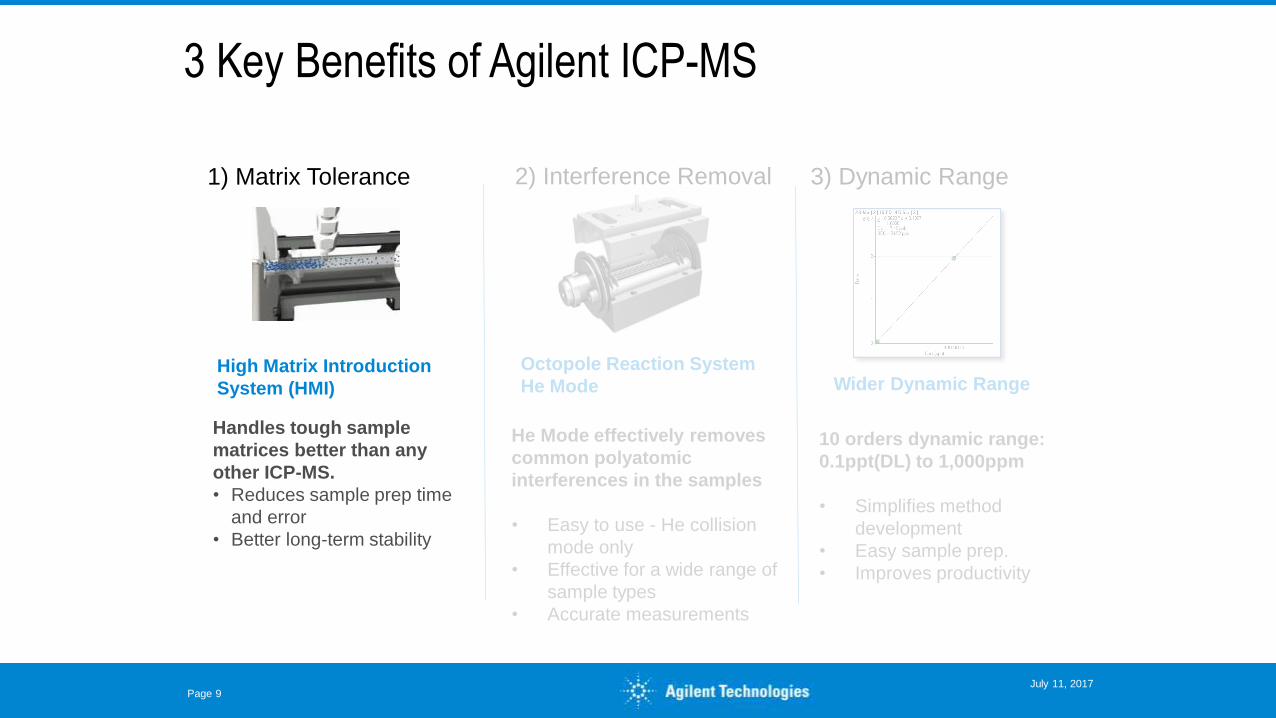
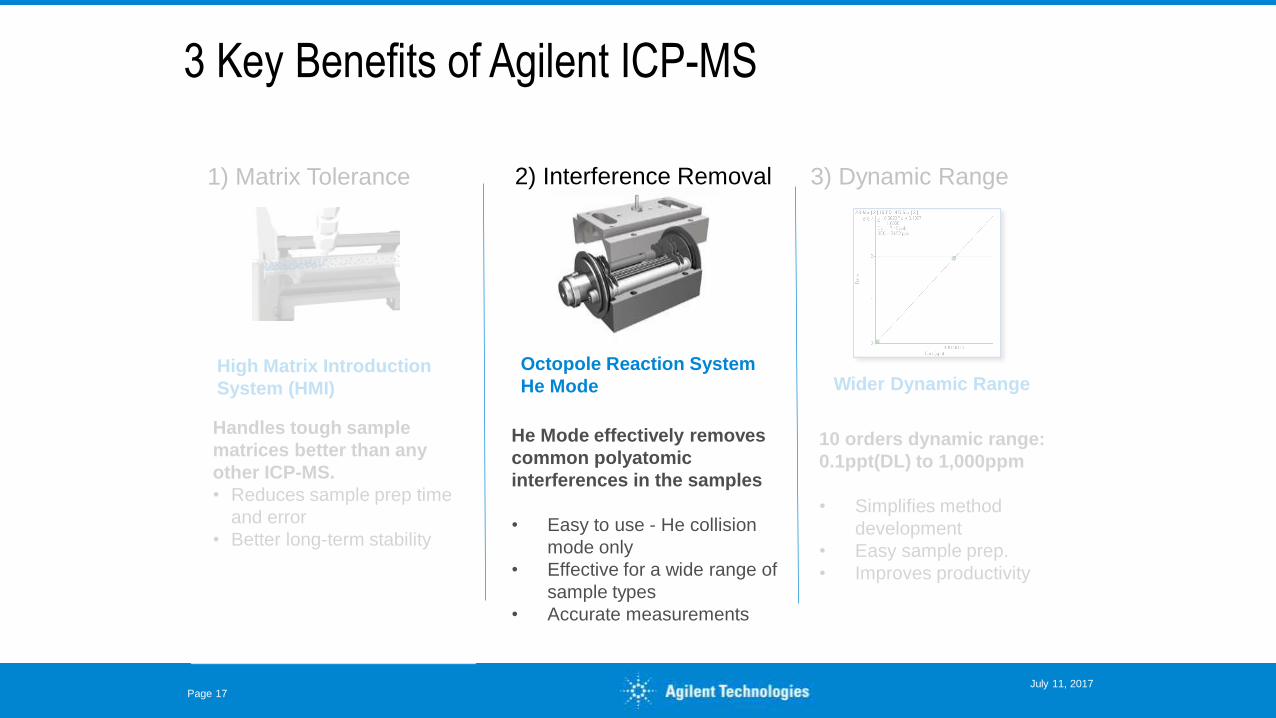
3 Key Benefits of Agilent ICP-MS
1) Matrix Tolerance 2) Interference Removal
3) Dynamic Range
High Matrix Introduction
System (HMI)
Handles tough sample
matrices better than any
other ICP-MS.
• Reduces sample prep time
and error
• Better long-term stability
Octopole Reaction System
He Mode
He Mode effectively removes
common polyatomic
interferences in the samples
• Easy to use - He collision
mode only
• Effective for a wide range of
sample types
• Accurate measurements
Wider Dynamic Range
10 orders dynamic range:
0.1ppt(DL) to 1,000ppm
• Simplifies method
development
• Easy sample prep.
• Improves productivity
Page 9 July 11, 2017
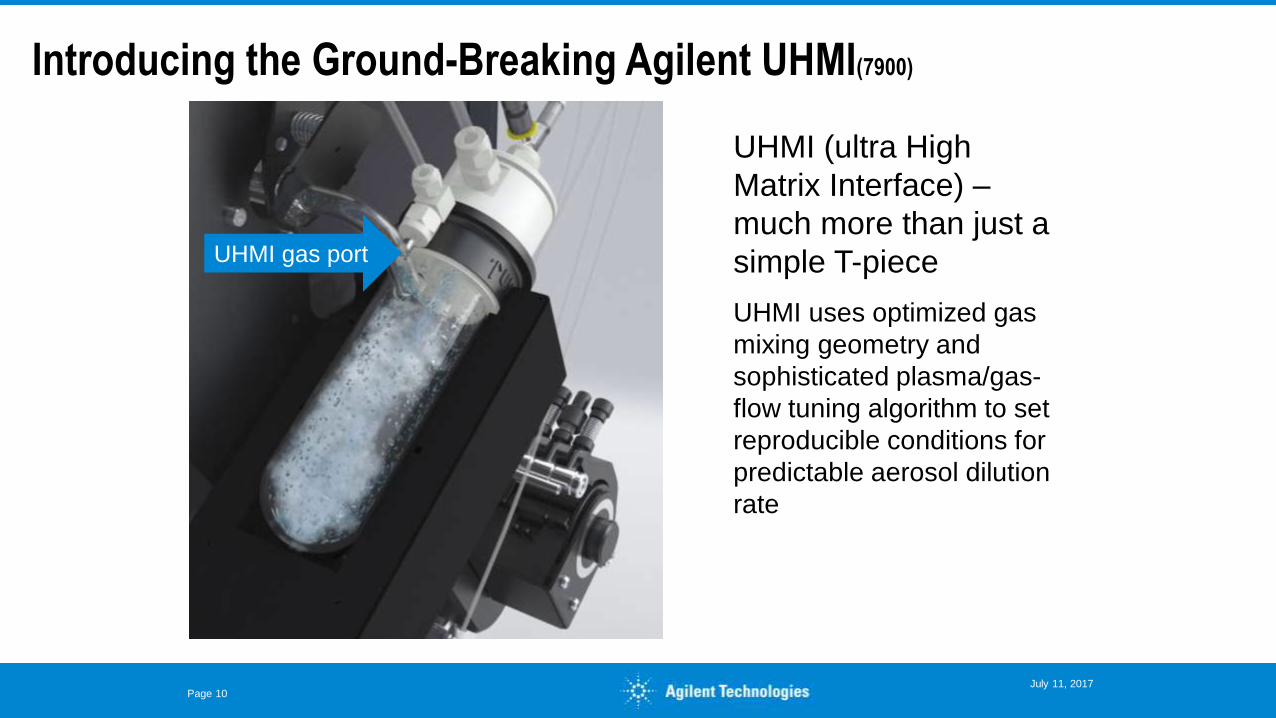
Introducing the Ground-Breaking Agilent UHMI(7900)
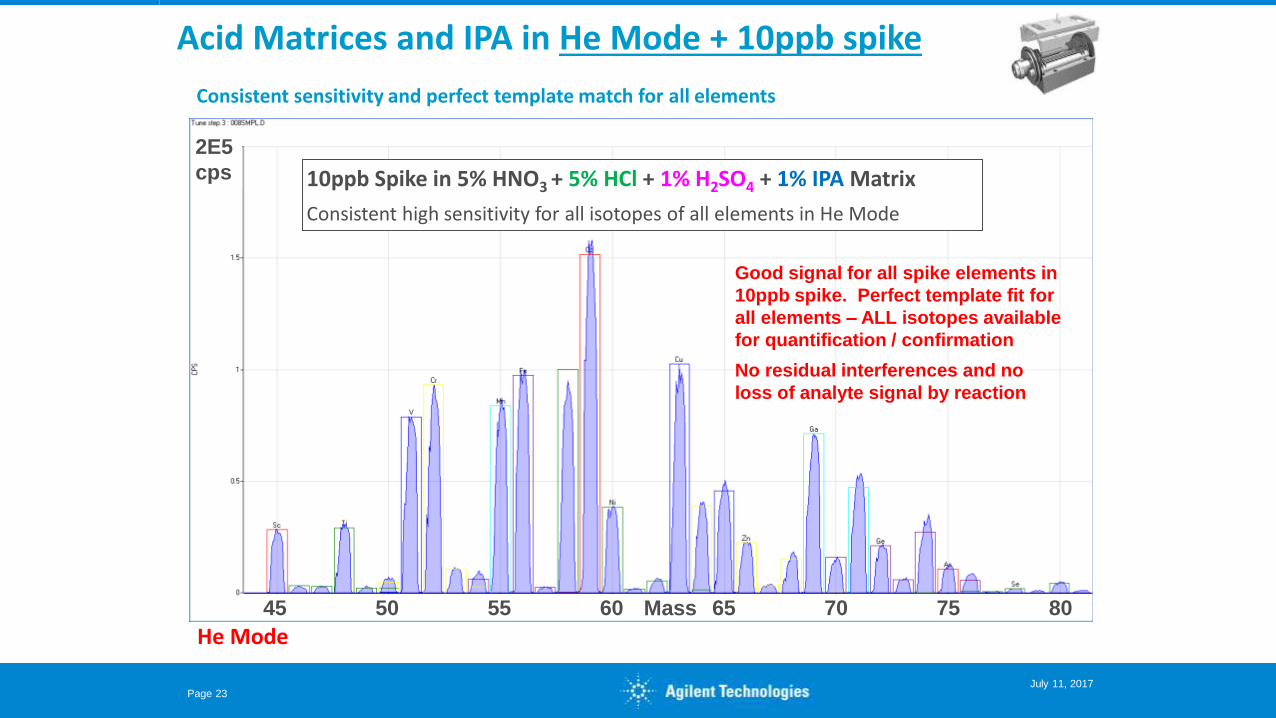
Consistent high sensitivity for all isotopes of all elements in He Mode
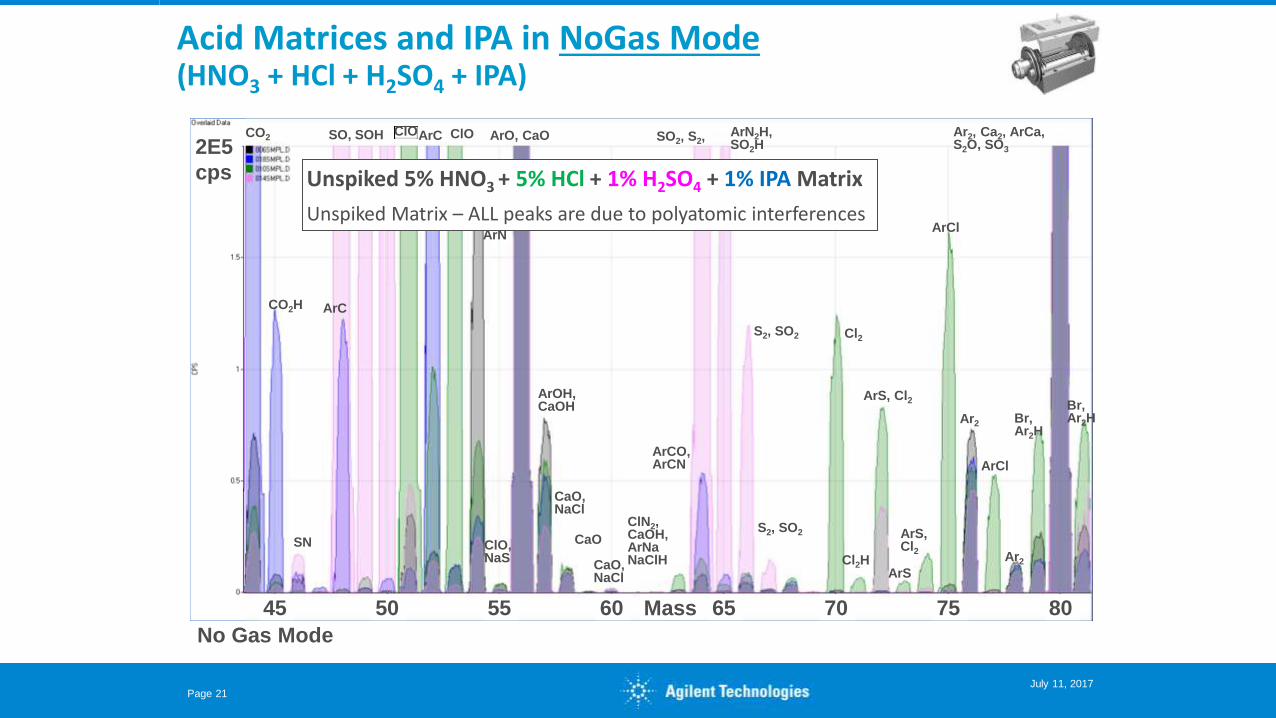
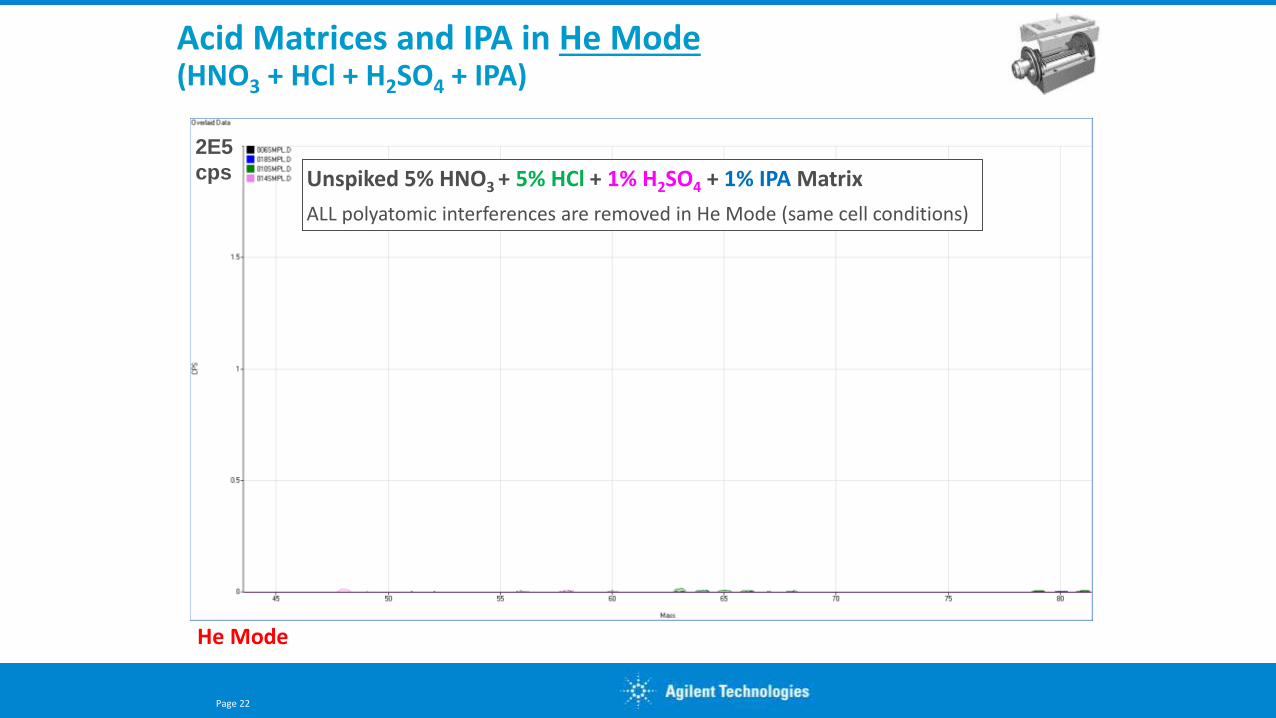
He Mode
Acid Matrices and IPA in He Mode + 10ppb spike
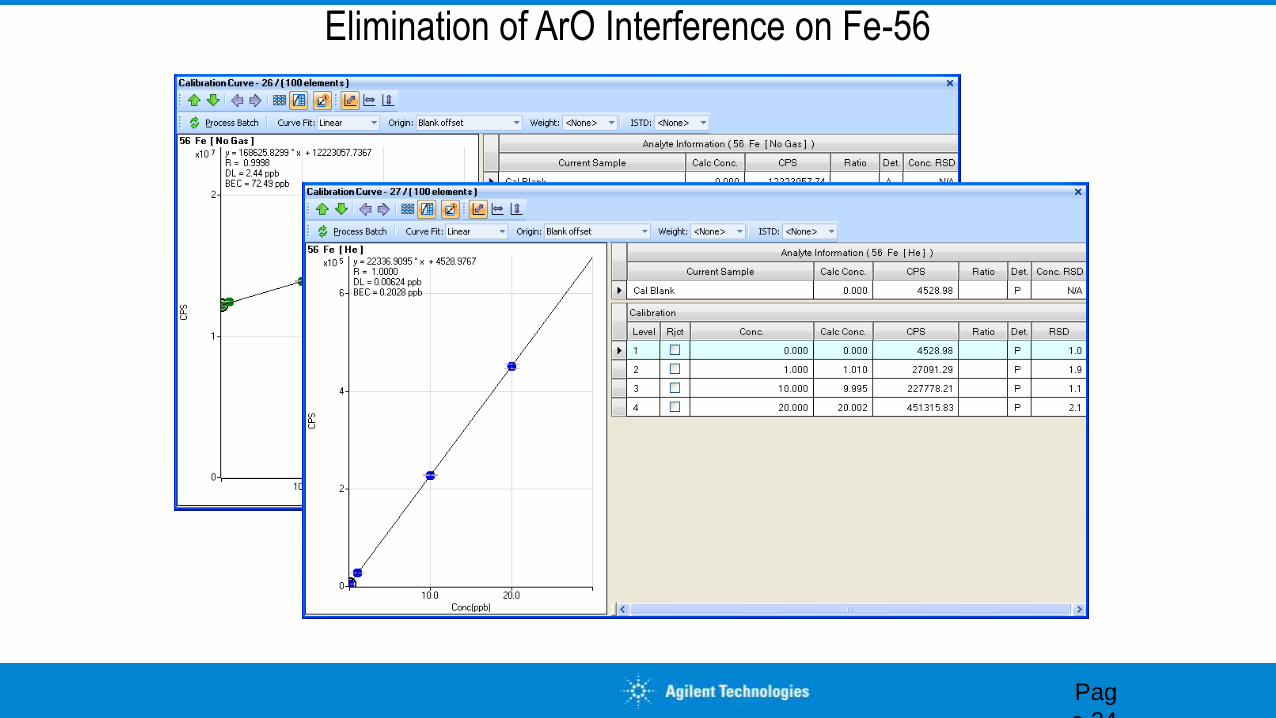
Elimination of ArO Interference on Fe-56
Pag
e 24
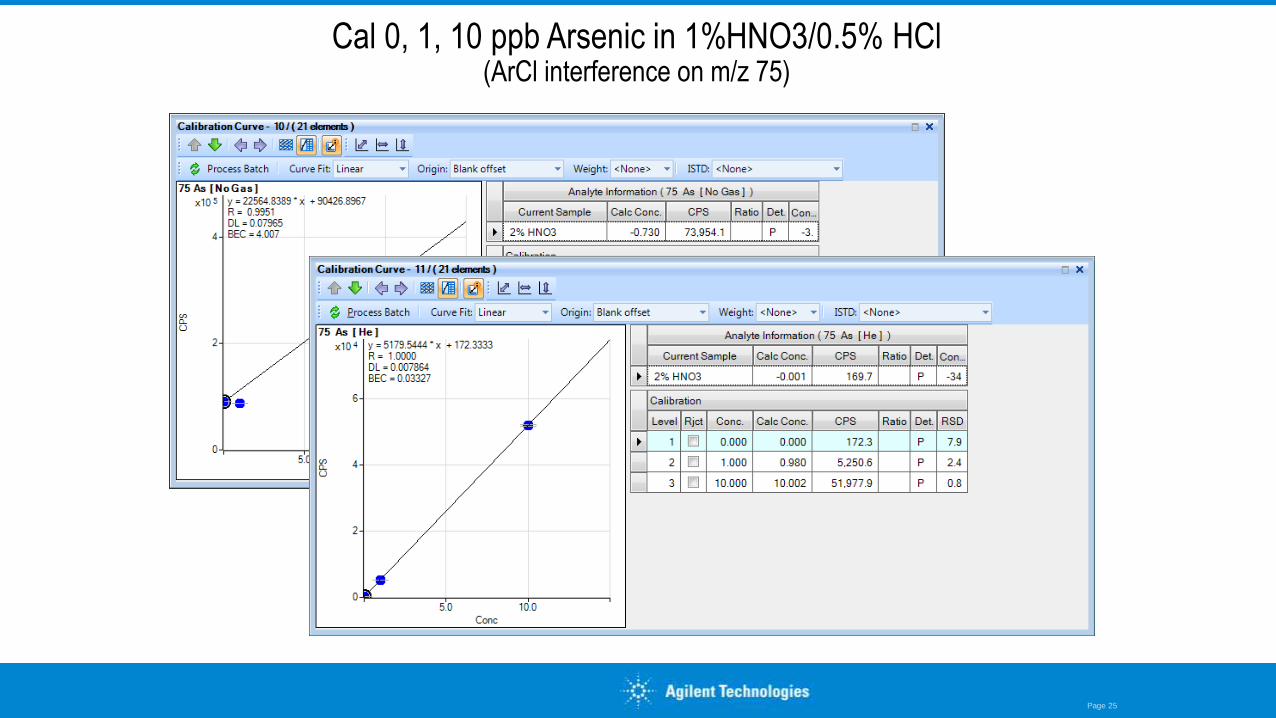
Cal 0, 1, 10 ppb Arsenic in 1%HNO3/0.5% HCl (ArCl interference on m/z 75)
Page 25
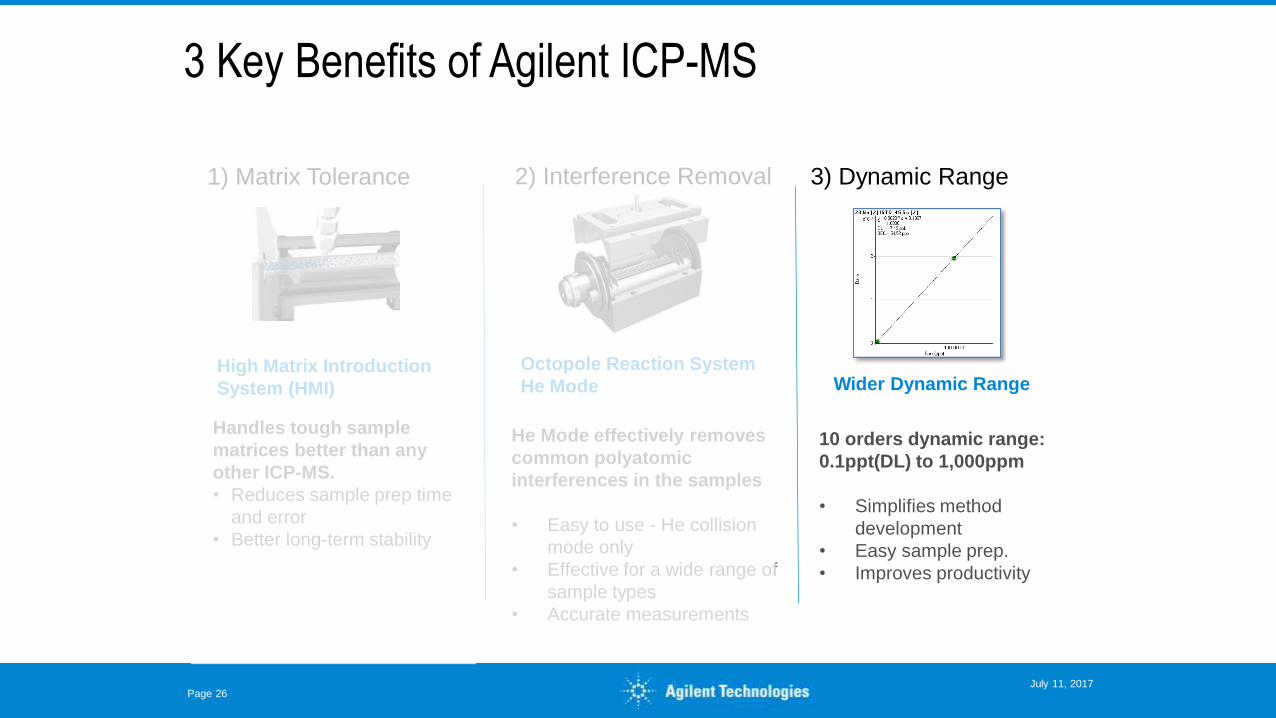
3 Key Benefits of Agilent ICP-MS
1) Matrix Tolerance 2) Interference Removal
3) Dynamic Range
High Matrix Introduction
System (HMI)
Handles tough sample
matrices better than any
other ICP-MS.
• Reduces sample prep time
and error
• Better long-term stability
Octopole Reaction System
He Mode
He Mode effectively removes
common polyatomic
interferences in the samples
• Easy to use - He collision
mode only
• Effective for a wide range of
sample types
• Accurate measurements
Wider Dynamic Range
10 orders dynamic range:
0.1ppt(DL) to 1,000ppm
• Simplifies method
development
• Easy sample prep.
• Improves productivity
Page 26 July 11, 2017
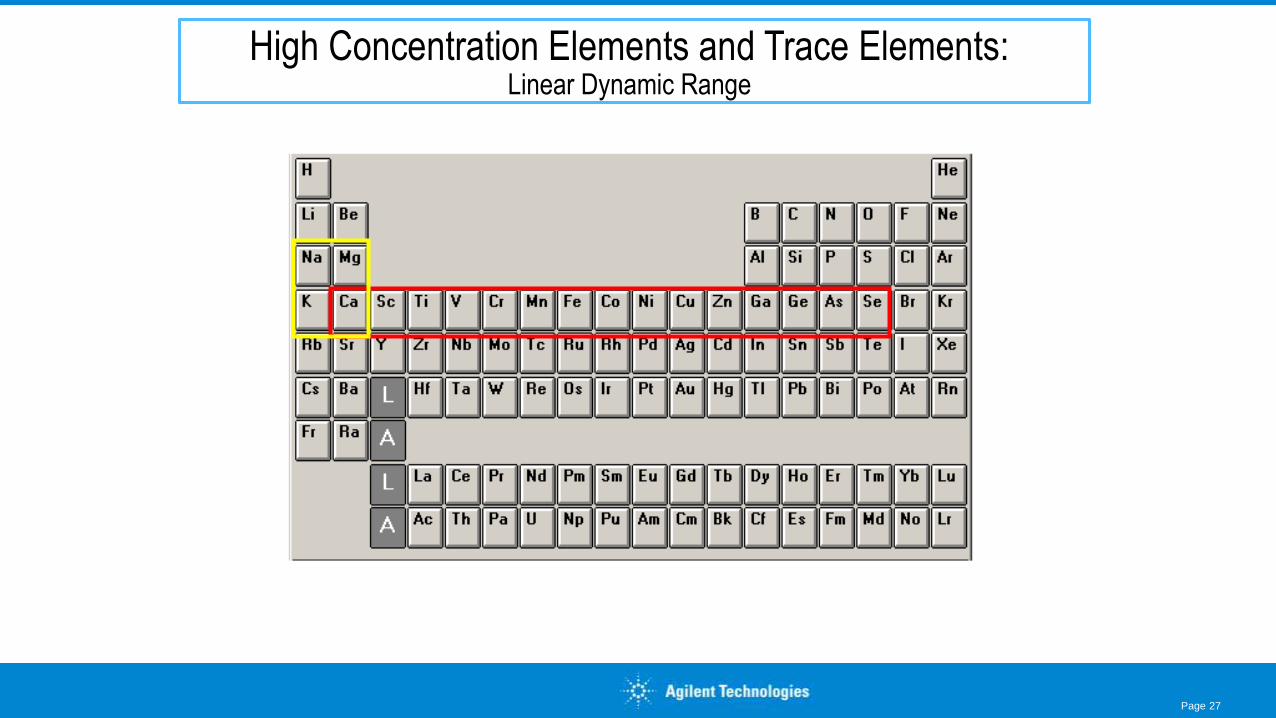
High Concentration Elements and Trace Elements: Linear Dynamic Range
Page 27
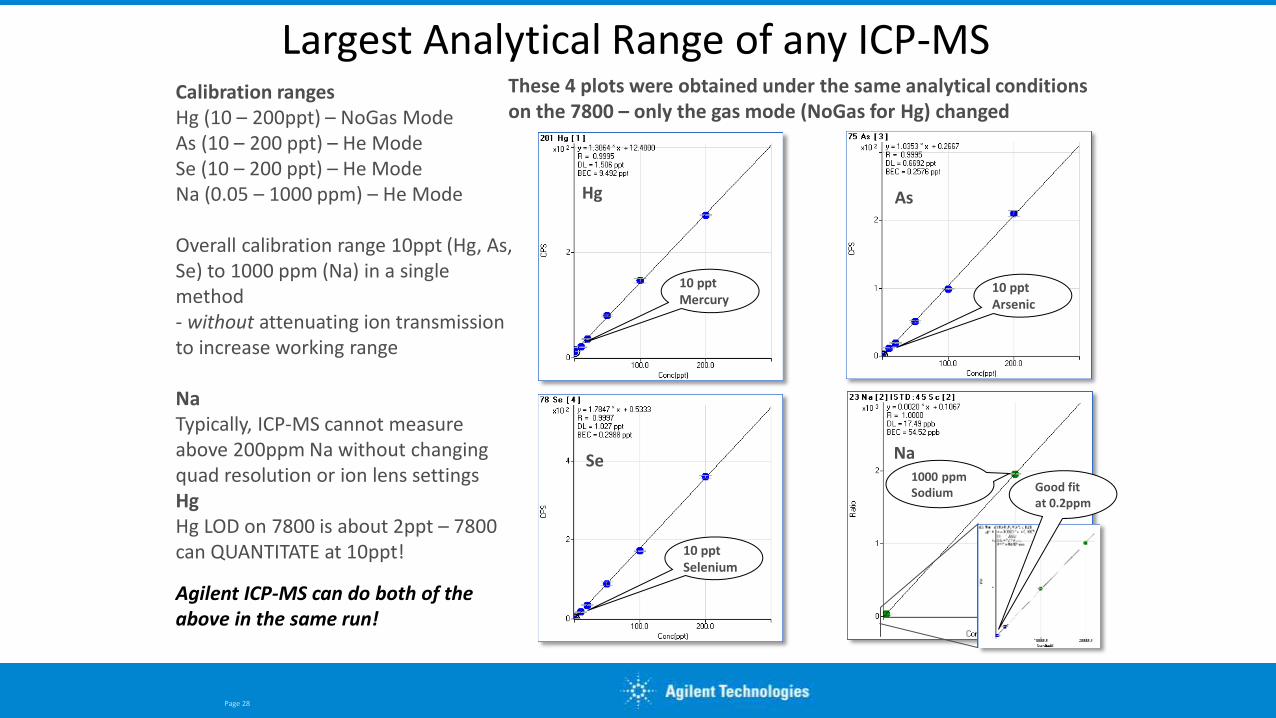
Largest Analytical Range of any ICP-MS
Page 28
Calibration ranges Hg (10 – 200ppt) – NoGas Mode As (10 – 200 ppt) – He Mode Se (10 – 200 ppt) – He Mode Na (0.05 – 1000 ppm) – He Mode Overall calibration range 10ppt (Hg, As, Se) to 1000 ppm (Na) in a single method - without attenuating ion transmission to increase working range Na Typically, ICP-MS cannot measure above 200ppm Na without changing quad resolution or ion lens settings Hg Hg LOD on 7800 is about 2ppt – 7800 can QUANTITATE at 10ppt!
Agilent ICP-MS can do both of the above in the same run!
1000 ppm Sodium
As
Se
Hg
Na
10 ppt Mercury
These 4 plots were obtained under the same analytical conditions on the 7800 – only the gas mode (NoGas for Hg) changed
As
10 ppt Arsenic
Se
10 ppt Selenium
Good fit at 0.2ppm
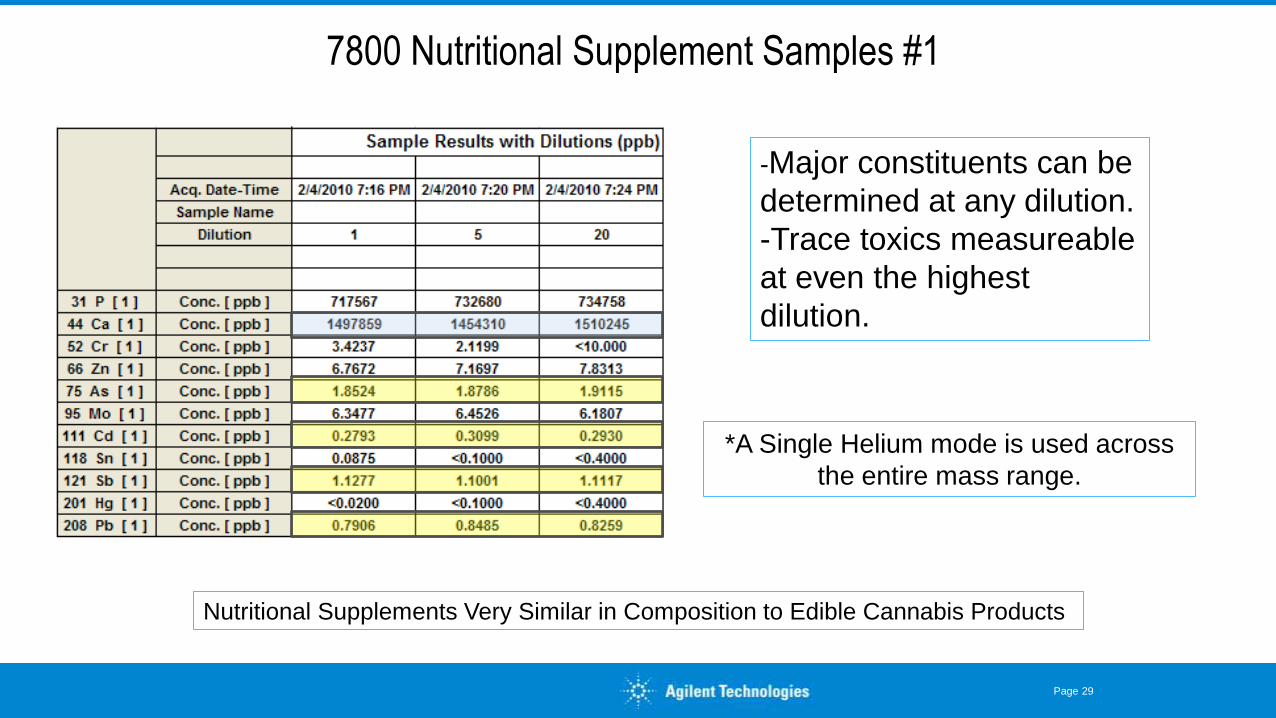
7800 Nutritional Supplement Samples #1
Page 29
-Major constituents can be
determined at any dilution.
-Trace toxics measureable
at even the highest
dilution.
*A Single Helium mode is used across
the entire mass range.
Nutritional Supplements Very Similar in Composition to Edible Cannabis Products
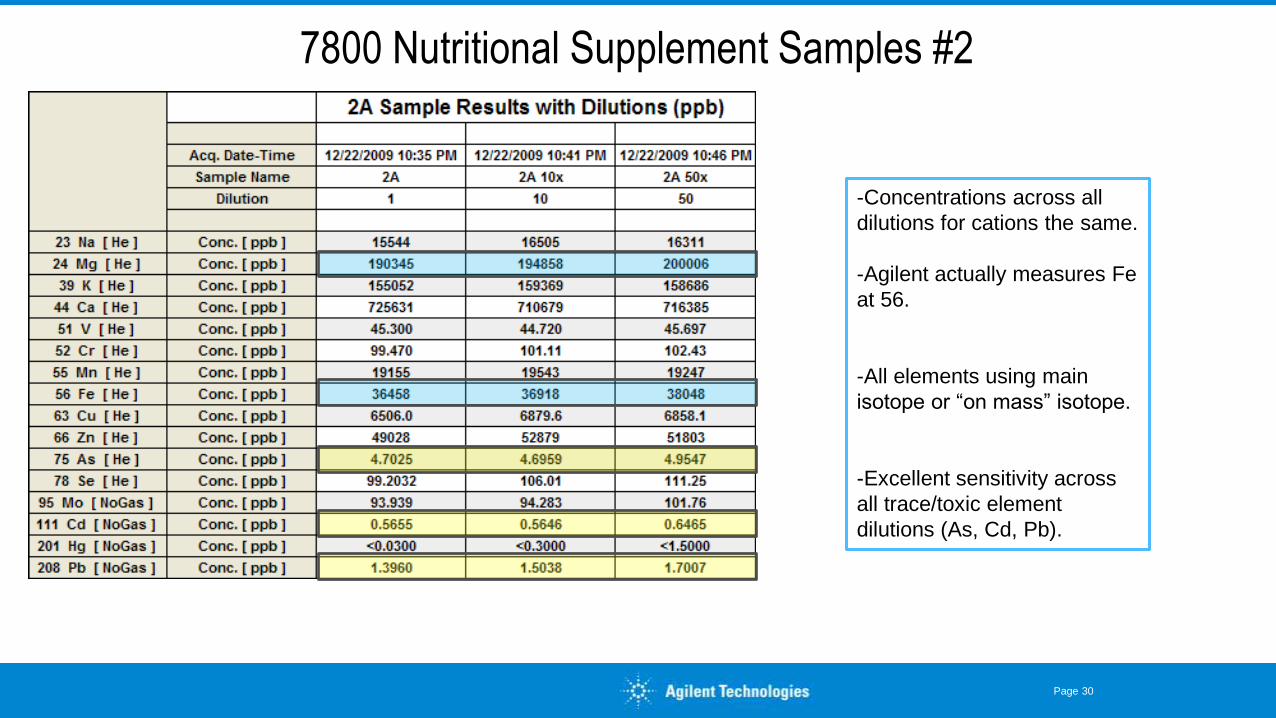
7800 Nutritional Supplement Samples #2
Page 30
-Concentrations across all
dilutions for cations the same.
-Agilent actually measures Fe
at 56.
-All elements using main
isotope or “on mass” isotope.
-Excellent sensitivity across
all trace/toxic element
dilutions (As, Cd, Pb).
Page 31
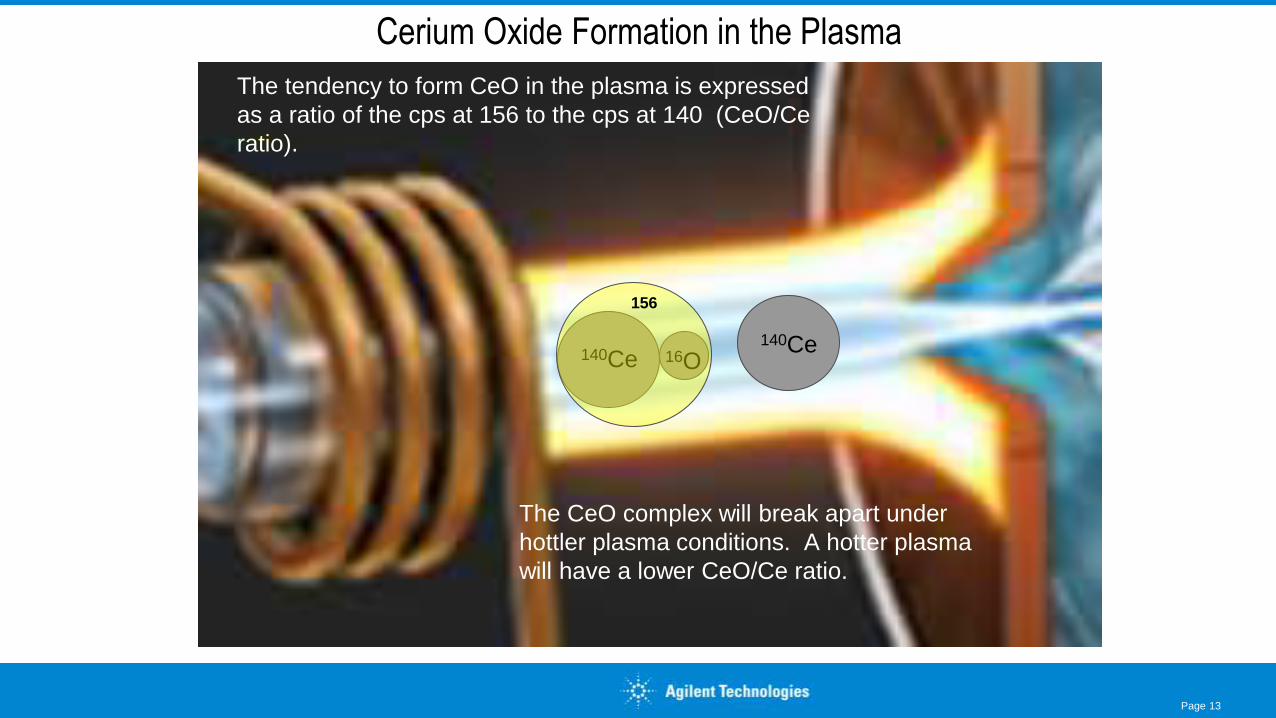
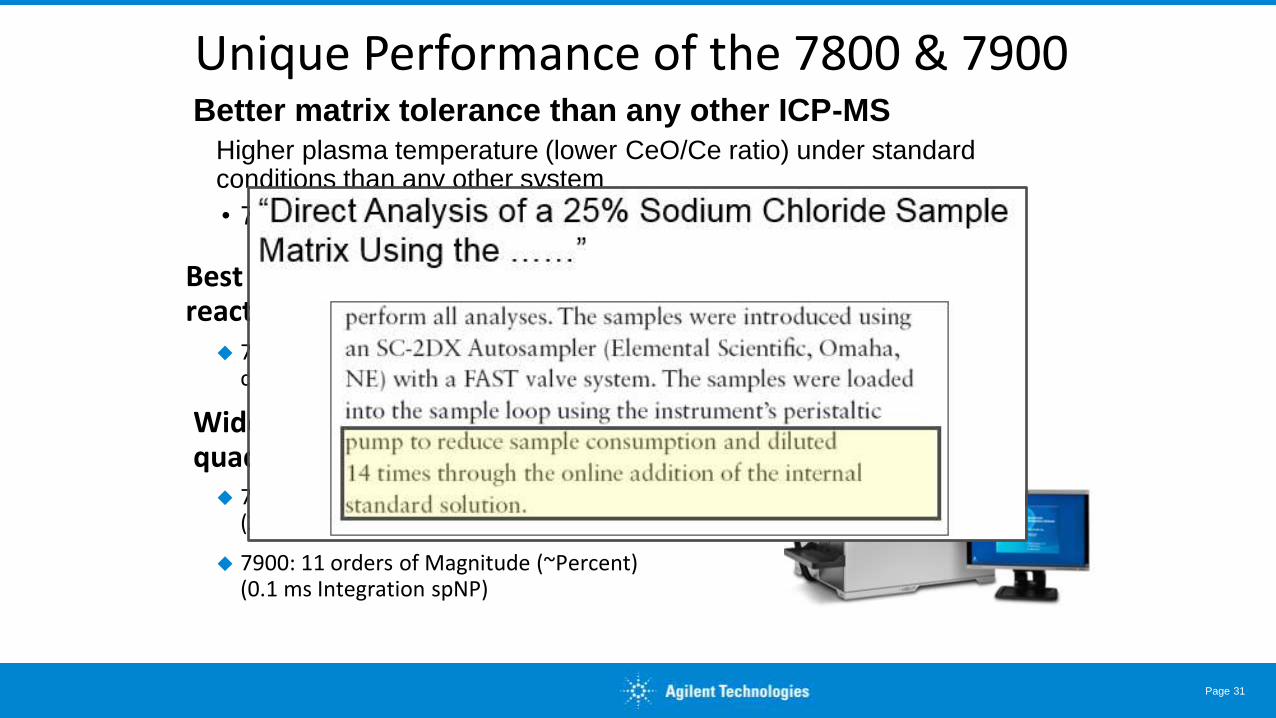
Unique Performance of the 7800 & 7900 Better matrix tolerance than any other ICP-MS
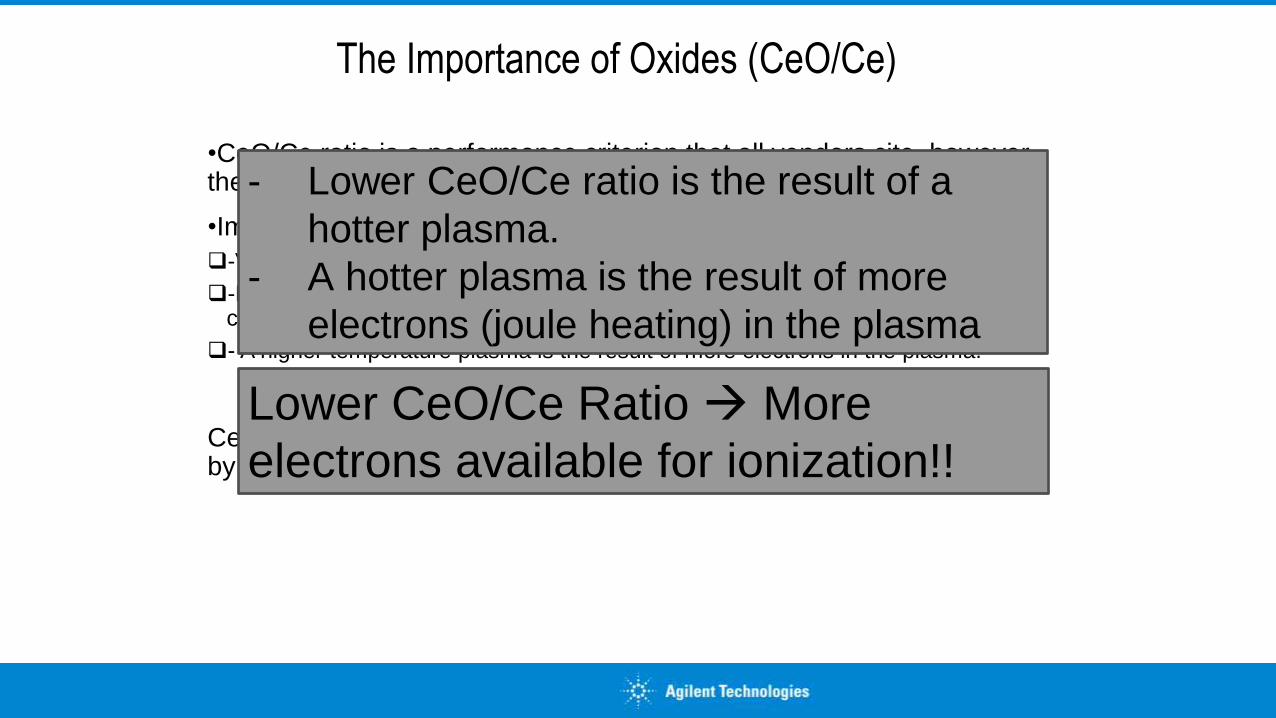
Higher plasma temperature (lower CeO/Ce ratio) under standard conditions than any other system
• 7800 with HMI: ~2-3% TDS & 7900 with UHMI: ~25% TDS
Best performance with Helium cell gas – eliminates need for reaction gases in all common applications
7800/7900 ORS4 – removes polyatomic interferences in complex matrices while maintaining excellent sensitivity.
Wider dynamic range than any other quadrupole ICP-MS 7800: 10 orders of Magnitude (~1000s ppm)
(3 ms Integration)
7900: 11 orders of Magnitude (~Percent) (0.1 ms Integration spNP)
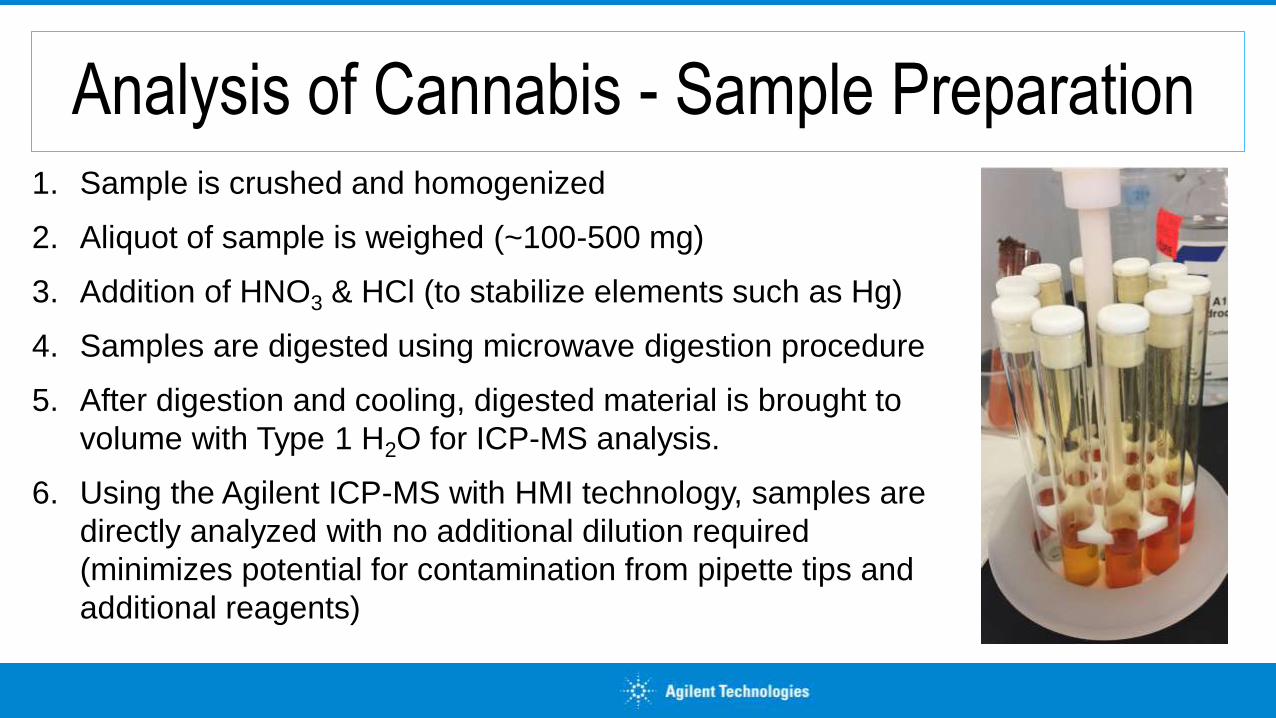
Analysis of Cannabis - Sample Preparation 1. Sample is crushed and homogenized
2. Aliquot of sample is weighed (~100-500 mg)
3. Addition of HNO3 & HCl (to stabilize elements such as Hg)
4. Samples are digested using microwave digestion procedure
5. After digestion and cooling, digested material is brought to
volume with Type 1 H2O for ICP-MS analysis.
6. Using the Agilent ICP-MS with HMI technology, samples are
directly analyzed with no additional dilution required
(minimizes potential for contamination from pipette tips and
additional reagents)
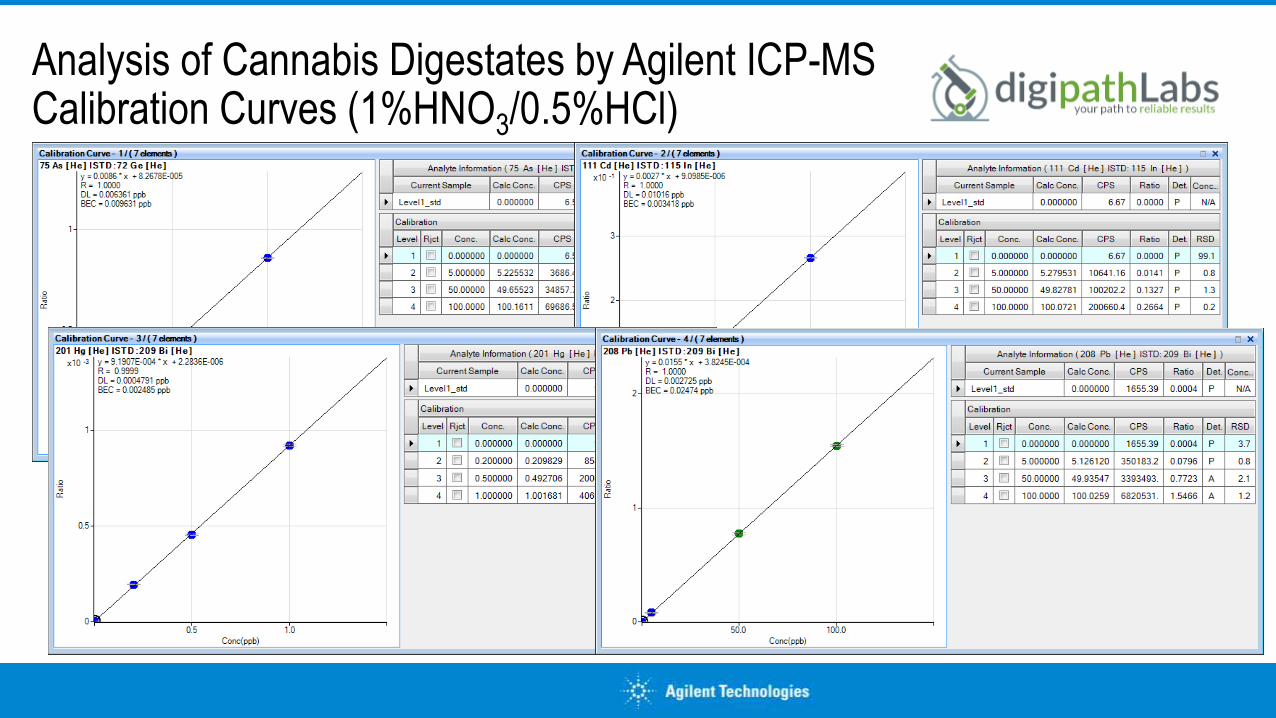
Analysis of Cannabis Digestates by Agilent ICP-MS Calibration Curves (1%HNO3/0.5%HCl)
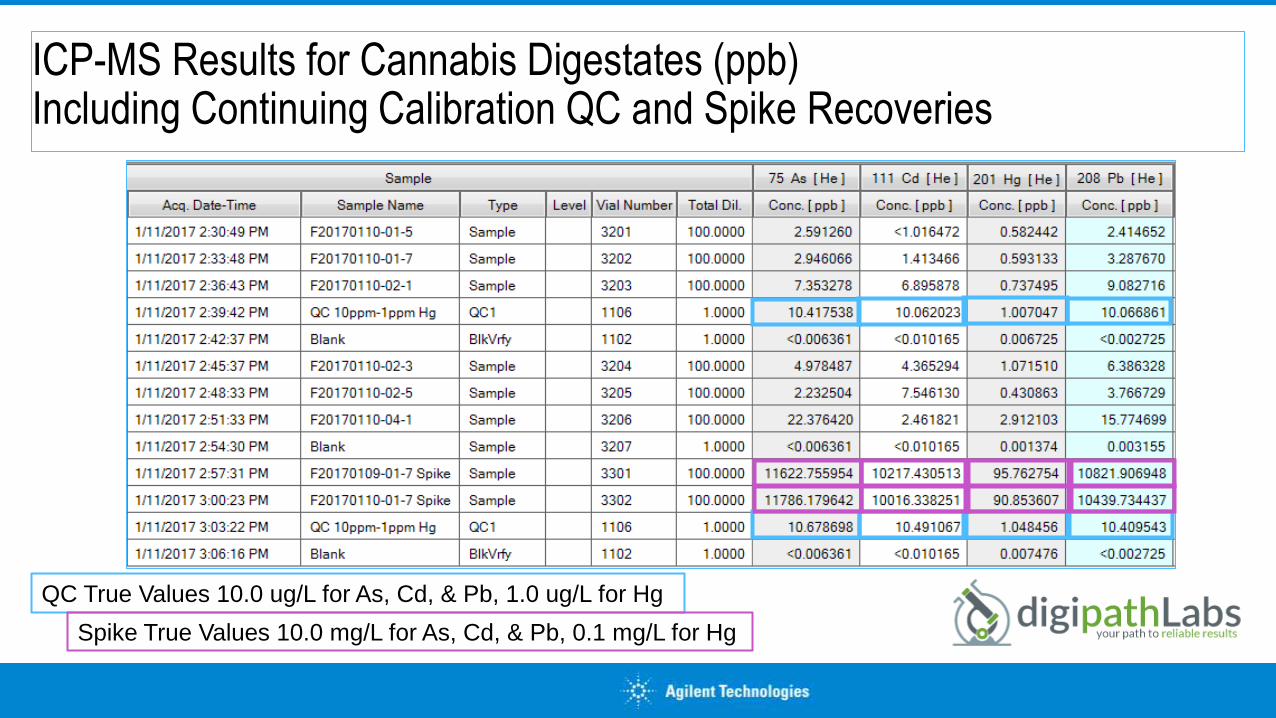
ICP-MS Results for Cannabis Digestates (ppb) Including Continuing Calibration QC and Spike Recoveries
QC True Values 10.0 ug/L for As, Cd, & Pb, 1.0 ug/L for Hg
Spike True Values 10.0 mg/L for As, Cd, & Pb, 0.1 mg/L for Hg
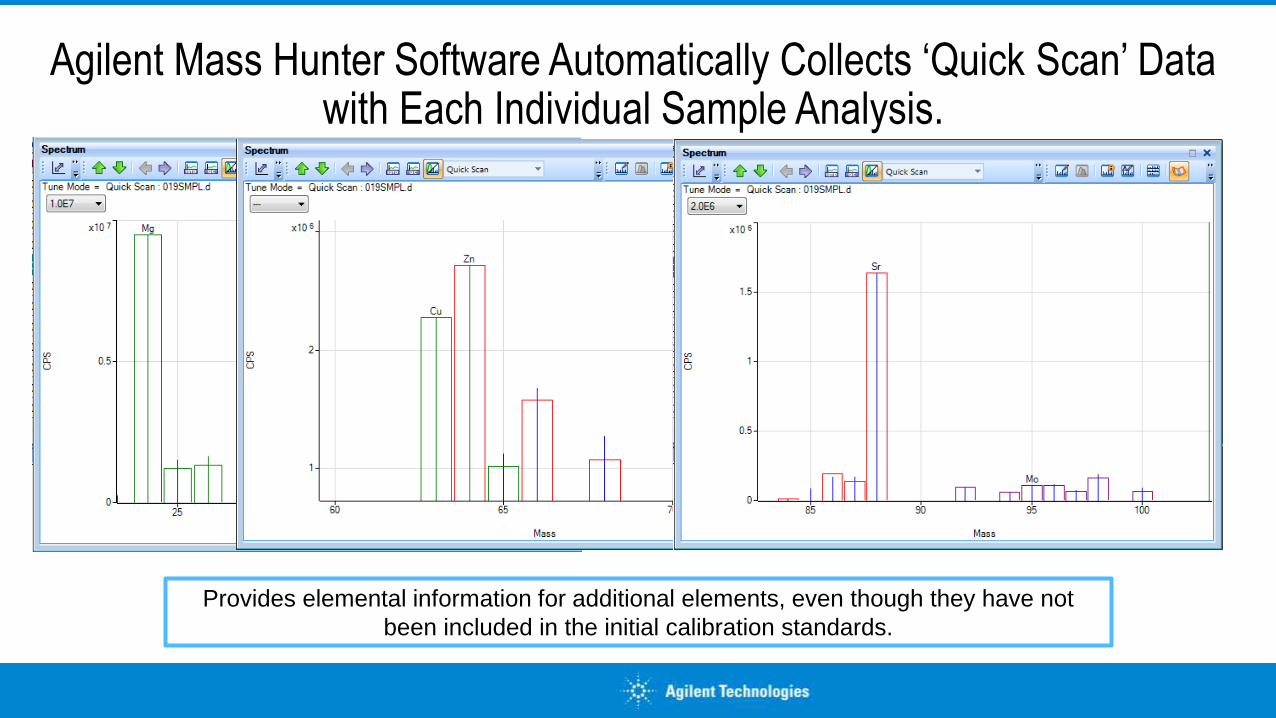
Agilent Mass Hunter Software Automatically Collects ‘Quick Scan’ Data with Each Individual Sample Analysis.
Provides elemental information for additional elements, even though they have not
been included in the initial calibration standards.
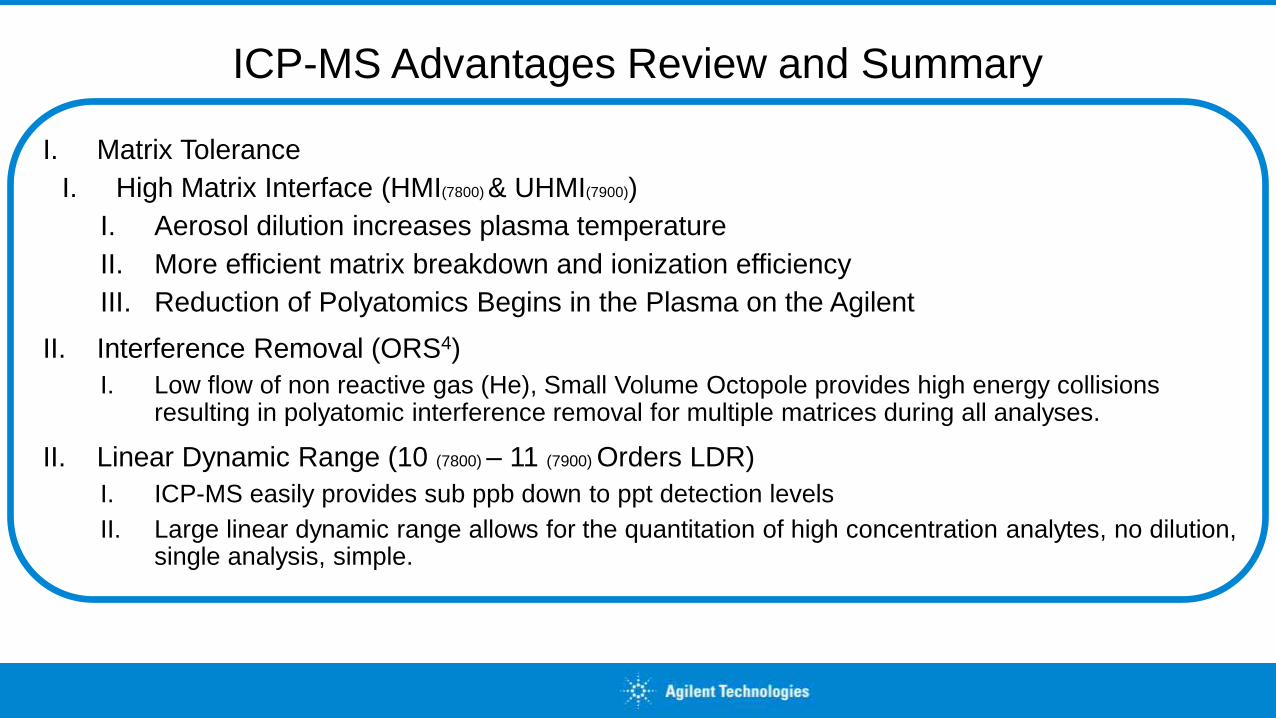
I. Matrix Tolerance
I. High Matrix Interface (HMI(7800) & UHMI(7900))
I. Aerosol dilution increases plasma temperature
II. More efficient matrix breakdown and ionization efficiency
III. Reduction of Polyatomics Begins in the Plasma on the Agilent
II. Interference Removal (ORS4)
I. Low flow of non reactive gas (He), Small Volume Octopole provides high energy collisions resulting in polyatomic interference removal for multiple matrices during all analyses.
II. Linear Dynamic Range (10 (7800) – 11 (7900) Orders LDR)
I. ICP-MS easily provides sub ppb down to ppt detection levels
II. Large linear dynamic range allows for the quantitation of high concentration analytes, no dilution, single analysis, simple.