Agilent Technologies Agilent MassHunter Protein Deconvolution Software Quick Start Guide What is Agilent MassHunter Protein Deconvolution Software? 2 Agilent MassHunter Protein Deconvolution Software Installation 3 Deconvolution UI elements 4 Getting Started 5 To deconvolute selected spectra 6 Deconvolution Parameters 7 To integrate chromatograms and deconvolute spectra 9 To view protein deconvolution results 11 To view deconvolution compounds 14 To print a report with deconvolution results 15 To automate protein confirmation 16 Familiarization Tutorial 17 Exercise 1. Deconvolute an MS spectrum 17 Exercise 2. View compound information 23 This guide describes how to install and use the Agilent MassHunter Protein Deconvolution Software. Where to find more information Use the online help for in-depth information not given in this Quick Start Guide. Display online help in either of the following ways: • Select either Contents, Index, or Search from the Qualitative Analysis software Help menu. • Press the F1 key to get more information about a window or dialog box.
Transcript
Agilent MassHunter Protein Deconvolution Software
Quick Start Guide
What is Agilent MassHunter Protein Deconvolution Software? 2
Agilent MassHunter Protein Deconvolution Software Installation 3
Deconvolution UI elements 4
Getting Started 5
To deconvolute selected spectra 6
Deconvolution Parameters 7
To integrate chromatograms and deconvolute spectra 9
To view protein deconvolution results 11
To view deconvolution compounds 14
To print a report with deconvolution results 15
To automate protein confirmation 16
Familiarization Tutorial 17
Exercise 1. Deconvolute an MS spectrum 17
Exercise 2. View compound information 23
This guide describes how to install and use the Agilent MassHunter Protein Deconvolution Software.
Where to find more informationUse the online help for in-depth information not given in this Quick Start Guide. Display online help in either of the following ways:
• Select either Contents, Index, or Search from the Qualitative Analysis software Help menu.
• Press the F1 key to get more information about a window or dialog box.
Agilent Technologies
What is Agilent MassHunter Protein Deconvolution Software?
What is Agilent MassHunter Protein Deconvolution Software?
Agilent MassHunter Protein Deconvolution Software provides the industry-standard software for automated and interactive protein confirmation for TOF and Q-TOF MS-only data, including the following features for this release:
• Support for MassHunter TOF MS data and Q-TOF MS-only data.
• Full integration of intact protein UI functionality into MassHunter Qualitative Analysis, most notably the visualization of ion sets and showing deconvoluted spectra in a separate window.
• Automated acquisition.
• Automated report generation.
• Compound-centric navigation for proteins.
• Two different measures of the relative protein level for more flexibility: height from the deconvoluted spectrum and height/area of EIC using all ion set peaks.
• Protein compound quality filters, which prevent “noise” peaks from the deconvoluted spectrum being considered a compound, by requiring sufficient evidence in the m/z spectrum.
2 Agilent MassHunter Protein Deconvolution Software Quick Start Guide
Agilent MassHunter Protein Deconvolution Software Installation
Agilent MassHunter Protein Deconvolution Software Installation
If the G3298AA Agilent MassHunter Protein Deconvolution Software is not already installed on your system, install it as follows.
1 Verify that version B.01.03 of Agilent MassHunter Qualitative Analysis software is installed.
2 Insert the CD-ROM labeled G3298AA into the CDROM drive.
3 Click the Start button and select Run.
4 Type x:\setup.exe, where x is the letter of the CDROM drive, and click OK.
5 Follow the instructions on the screen to install the software.
Agilent MassHunter Protein Deconvolution Software features are accessible in the Qualitative Analysis software. See “Deconvolution UI elements” on page 4 for more information.
To remove the software
Agilent MassHunter Protein Deconvolution Software becomes part of the Qualitative Analysis software. It is removed when Qualitative Analysis software is removed from the system.
Agilent MassHunter Protein Deconvolution Software Quick Start Guide 3
Deconvolution UI elements
Deconvolution UI elements
The following features are available in Agilent Qualitative Analysis Software when Agilent MassHunter Protein Deconvolution Software is installed:
Method Explorer: Spectrum > Deconvolute (MS) Displays the Deconvolute (MS) section in the Method Editor
Method Editor: Deconvolute (MS) section Allows you to view and edit the deconvolution parameters; see “Deconvolution Parameters” on page 7.
Chromatograms menu > Integrate And Deconvolute Peak Spectra,Actions menu > Integrate And Deconvolute Integrate each selected chromatogram, extract m/z peak spectra for each chromatogram peak, deconvolute each m/z spectrum separately. See “To integrate chromatograms and deconvolute spectra” on page 9.
Spectra menu > Deconvolute,Actions menu > Deconvolute Start deconvolution of the selected spectra. See “To deconvolute selected spectra” on page 6.
View menu > Deconvolution Results,Deconvolution Results toolbar button Toggle the display of the Deconvolution Results window
Deconvolution Results window Displays deconvoluted mass spectra; see “To view protein deconvolution results” on page 11.
Plot Display Options dialog box Deconvoluted Spectra tab allows you to change the appearance of deconvoluted spectra, such as the number of significant digits.
MS Spectrum Peak List window
Columns for deconvoluted spectra Peak, Mass, Abund, Abund%, Fit, Max Abund, and Width. See “To view protein deconvolution results” on page 11.
Columns for compound ion set mass spectra Peak, m/z, Abund., Abund%, Charge, Max Abund, Calc Mass, Expected m/z, Cpd Mass, Diff (ppm), Diff (m/z), Diff (Da). See “To view deconvolution compounds” on page 14.
4 Agilent MassHunter Protein Deconvolution Software Quick Start Guide
Getting Started
Getting Started
The following list shows the steps to get started with Agilent MassHunter Protein Deconvolution Software. This guide and the online help explain these steps.
“To deconvolute selected spectra” on page 6
“To integrate chromatograms and deconvolute spectra” on page 9
“To view protein deconvolution results” on page 11
“To view deconvolution compounds” on page 14
“To print a report with deconvolution results” on page 15
“To automate protein confirmation” on page 16
Agilent MassHunter Protein Deconvolution Software Quick Start Guide 5
Getting Started
To deconvolute selected spectra
Use this procedure to deconvolute selected m/z spectra and create a protein list.
1 Open the data file that contains the spectra of interest as described in online help.
2 Select one or more spectra as described in online help.
3 Display the Deconvolute section in the Method Editor in one of the following ways:
• Select Deconvolute (MS) from the Spectrum section of the Method Explorer.
• Select Deconvolute from the Method Items list in the Method Editor.
4 Set parameters on the Method Editor: Deconvolute (MS) section. These parameters are described on the following page.
5 Click the button on the Method Editor toolbar to start processing.
Tip You can also initiate deconvolution in any of the following ways:
• Right-click on a user spectrum in the Spectrum Results or Navigator window and select Deconvolute from the shortcut menu.
• Select Deconvolute from the Spectra menu.
• Select Deconvolute from the Actions menu.
6 Review results in the Deconvolution Results window. If this window is not currently displayed, display it in one of the following ways:
• Select Deconvolution Results from the View menu
• Click the Deconvolution Results button on the main toolbar
See “To view protein deconvolution results” on page 11 for more information.
7 View deconvolution compounds as described in “To view deconvolution compounds” on page 14.
6 Agilent MassHunter Protein Deconvolution Software Quick Start Guide
Getting Started
Deconvolution Parameters
The following parameters appear on the Deconvolution tab of the Method Editor: Deconvolute (MS) section:
Mass range Starting and ending values to set an expected range for deconvoluted protein masses. A default range of 10,000 - 17,000 Daltons is supplied.
Mass step The resolution of the deconvoluted protein mass range (default value is 1.0 Daltons). For small proteins, consider using a lower value for improved mass measurement accuracy.
S/N threshold Deconvoluted protein peaks that fall below this value are not reported.
Use limited m/z range Marking this option restricts the range used for deconvolution to the specified m/z range.
Adduct The expected ion species (Proton, Ammonium, Potassium, Sodium, or Proton Loss) that acts as the charge carrier for the protein.
Average Mass The % peak height to use for calculating the mass of a peak (25, 50, 75, or 90%). For example, the default value of 90% means that the mass is calculated by averaging the data points along the curve of the top 90% of the peak. An Average Mass value of 90% works well for low molecular weight, well-separated peaks, such as those in insulin. An Average Mass value of 25% works well for high molecular weight, overlapped mass peaks or when there are many m/z ions available to average.
Using a lower value such as 25% for a protein such as insulin, the contribution to the mass from other isotopes is missed. Consider testing other values to get a better estimate of the molecular weight.
Isotope width The expected full-width at half-maximum height of the target protein or other large molecule mass in Da from the following choices:
• Automatic - predicts the isotope width using the mass directly in the middle of the specified Mass range. For example, if the Mass range is set to 10,000-30,000, an estimate of the isotopic width for a protein with mass 20,000 Da is used.
Agilent MassHunter Protein Deconvolution Software Quick Start Guide 7
Getting Started
• Unspecified - uses the resolution in the mass spectrum to estimate the peak width. This mode always produces wider peaks in the deconvoluted spectrum, but is useful for a very broad mass range, such as 10,000-180,000 Da, since the isotope width varies greatly across this range.
• Specified - allows you to enter a specific value in Daltons
Compound Filters Determine whether a peak in the deconvoluted spectrum produces a compound from the following choices:
• Minimum consecutive charge states (default value of 5) - Requires that the raw m/z spectrum has at least 5 peaks in a row that differ in charge by only 1. For example, if the minimum is set to 5, a compound is created if the 15+, 14+, 13+, 12+ and 11+ charge states are found for a given protein. A compound is not created if the 15+, 14+, 13+, and 11+ charge states are found, but the 12+ is not present.
• Minimum protein fit score (default value of 8) - Sets a fit score threshold for acceptance of a peak as a possible compound. Fit scores between 0 and 10 are assigned to peaks in the deconvoluted spectrum by the maximum entropy algorithm.
Tip Fit values are reported in the MS Peak List window for the deconvolution spectrum.
Deconvolution Results tab
The following parameters appear on the Results tab of the Method Editor: Deconvolute (MS) section:
Delete previous compounds Determines whether the previous compounds are removed before integration and deconvolution are performed again.
New results Determines whether all compounds or only the first compound is highlighted in the Deconvolution Results window.
8 Agilent MassHunter Protein Deconvolution Software Quick Start Guide
Getting Started
To integrate chromatograms and deconvolute spectra
Use this procedure to integrate each selected chromatogram, extract m/z peak spectra for each chromatogram peak, deconvolute each m/z spectrum separately, display deconvoluted mass spectra, and create a protein list.
1 Open the data files that contain the chromatograms of interest as described in online help.
2 Select one or more chromatograms as described in online help. The selected chromatograms can come from different data files.
3 Display the Deconvolute section in the Method Editor in one of the following ways:
• Select Deconvolute (MS) from the Spectrum section of the Method Explorer.
• Select Deconvolute from the Method Items list in the Method Editor.
4 Set parameters on the Method Editor: Deconvolute (MS) section. See “Deconvolution Parameters” on page 7.
5 Display the Integrate section in the Method Editor in either of the following ways:
• Select Integrate (MS) from the Chromatogram section of the Method Explorer.
• Select Integrate (MS) from the Method Items list in the Method Editor.
6 Set parameters on the following tabs of the Method Editor: Integrate section:
• Integrator
• Peak Filters
• Results
See the Qualitative Analysis online help for descriptions of these tabs.
Agilent MassHunter Protein Deconvolution Software Quick Start Guide 9
Getting Started
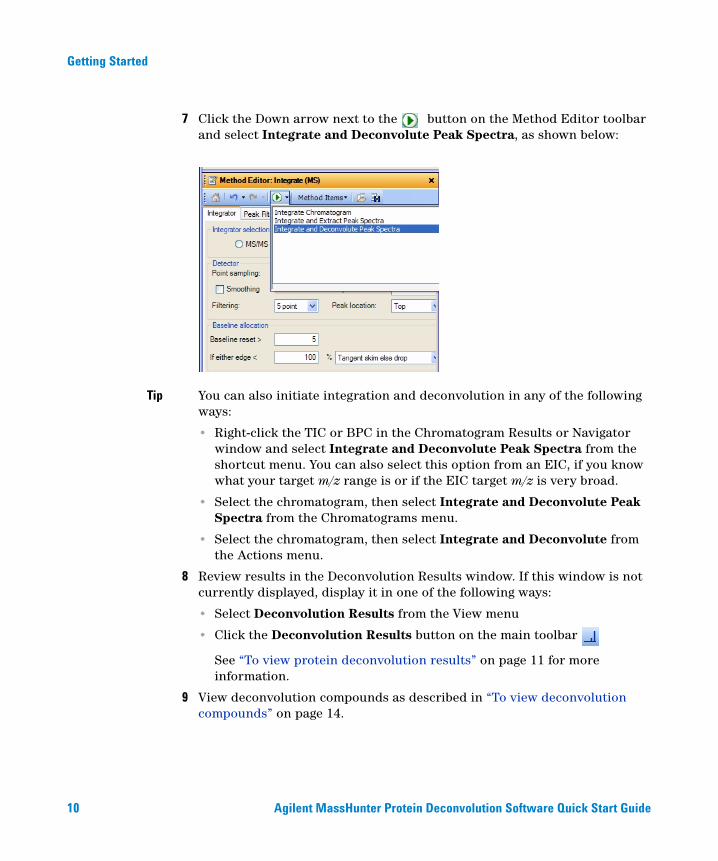
7 Click the Down arrow next to the button on the Method Editor toolbar and select Integrate and Deconvolute Peak Spectra, as shown below:
Tip You can also initiate integration and deconvolution in any of the following ways:
• Right-click the TIC or BPC in the Chromatogram Results or Navigator window and select Integrate and Deconvolute Peak Spectra from the shortcut menu. You can also select this option from an EIC, if you know what your target m/z range is or if the EIC target m/z is very broad.
• Select the chromatogram, then select Integrate and Deconvolute Peak Spectra from the Chromatograms menu.
• Select the chromatogram, then select Integrate and Deconvolute from the Actions menu.
8 Review results in the Deconvolution Results window. If this window is not currently displayed, display it in one of the following ways:
• Select Deconvolution Results from the View menu
• Click the Deconvolution Results button on the main toolbar
See “To view protein deconvolution results” on page 11 for more information.
9 View deconvolution compounds as described in “To view deconvolution compounds” on page 14.
10 Agilent MassHunter Protein Deconvolution Software Quick Start Guide
Getting Started
To view protein deconvolution results
Use this procedure to review the results from either of the following deconvolution processes:
• “To integrate chromatograms and deconvolute spectra” on page 9
• “To deconvolute selected spectra” on page 6
1 If the Deconvolution Results window is not currently displayed, display it in one of the following ways:
• Select Deconvolution Results from the View menu
• Click the Deconvolution Results button on the main toolbar
Tip There is a layout that automatically opens the Deconvolution Results and Compound List windows and reformats the compound list to show the appropriate information for a deconvolution operation. To select this layout, select Window Layouts > Load Layout from the View menu, then select Layout5-ProteinDeconvolution and click the Open button.
2 Use the following mouse actions to change the display of data:
• Click to select a single m/z in the spectrum.
• Drag to select an m/z range in the spectrum.
• Ctrl+drag to select another area and keeps the previous area/time selected.
• Drag axes to scroll the axes in the direction you are moving the mouse.
• Right-drag to expand the selected area. The area you define is shown as a rectangle outlined in black. The Y-scale of the zoomed in display is controlled by the Auto-Scale Y-axis mode.
• Right-drag axes to scale the axis. Dragging to the right (x-axis) or to the top (y-axis) zooms in on that axis. Dragging to the left (x-axis) or to the bottom (y-axis) zooms out on that axis. Select Unzoom from the shortcut menu to return to the previous display scale.
Tip To return to the previous display scale, click the Unzoom toolbar button or select Unzoom from the shortcut menu.
Agilent MassHunter Protein Deconvolution Software Quick Start Guide 11
Getting Started
3 Use the following toolbar buttons to change the display of data:
Toolbar button Action/Meaning
Scales the x-axis and y-axis automatically to fit the displayed data.
Scales the x-axis automatically to fit the displayed data.
Scales the y-axis automatically to fit the displayed data.
Returns to the previous display scale (undoes last zoom operation).
When this mode is on and you zoom with the mouse, the vertical plot range is automatically scaled to fit the data contained in the horizontal range you specify. When the Autoscale y-axis during Zoom mode is off, the vertical plot range is set to the limits you specify by dragging the mouse.
Toggles whether to scale the y-axis of all spectra to the same scale when you zoom in on the x-axis.
Plots each spectrum separately. The spectra share the same x-axis, but each spectrum has a separate y-axis.
Overlays all spectra. The spectra are shown with the same x- and y-axes.
Switches to previous plot for overlaid spectra.
Switches to next plot for overlaid spectra.
Sets the number of spectra that are shown together. A scroll bar will appear for additional spectra beyond this number.
12 Agilent MassHunter Protein Deconvolution Software Quick Start Guide
Getting Started
4 Right-click in the graph to display the following shortcut menu options:
• Subtract Any Spectrum - Subtracts the next spectrum you select from the currently selected spectra. The new spectrum is displayed in the plot and table windows, and the Data Navigator window is updated. Select this menu item again to exit Subtract Any Spectrum mode without subtracting any spectra.
• Add Any Spectrum - Adds the next spectrum you select to the currently selected spectra. The new spectrum is displayed in the plot and table windows, and the Data Navigator window is updated. Select this menu item again to exit Add Any Spectrum mode without adding any spectra.
• View MS Peak List 1 - Toggles the display of the MS Spectrum Peak List window, called MS Peaks One, showing the first peak selected. One of the columns in the peak list is Fit. This is a score between 0 and 10 to assess the peak shape in the deconvoluted spectrum. Higher numbers indicate better peak shape.
• View MS Peak List 2 - Toggles the display of the MS Spectrum Peak List window, called MS Peaks Two, showing the second peak selected.
• Assign Ranges to > Exclude Masses - not used in this release
• Assign Ranges to > Find by Molecular Feature - not used in this release
• Unzoom - Undoes the last zoom operation (returns to the previous display scale).
• Assign Random Colors - Changes the color of the selected spectrum.
• Choose Defined Color - Changes the color of the selected spectrum to the specified color.
• Copy to Clipboard - Copies spectra that are currently visible in the Deconvolution Results window to the Clipboard for use with other applications.
• Print - Allows you to print the Deconvolution Results window.
• Export - Allows you to export data and graphics.
5 (optional) To change the number of significant digits in the deconvoluted spectrum, select Plot Display Options from the Tools menu and click the Deconvoluted Spectra tab on the Plot Display Options dialog box. Set the Digits after the decimal value and click OK.
6 (optional) To move the window, drag it to a new position on the screen. To return it to its default position, right-click in the title bar and clear the check mark for the Floating menu item.
Agilent MassHunter Protein Deconvolution Software Quick Start Guide 13
Getting Started
To view deconvolution compoundsIf the correct mass range is selected in the Method Editor: Deconvolute (MS) section, compounds are created for proteins that are confidently found. You can view these compounds as follows:
1 Show the Compound List by selecting Compound List from the View menu or by clicking the button on the main toolbar.
Tip There is a layout that automatically opens the Compound List and Deconvolution Results windows and reformats the compound list to show the appropriate information for a deconvolution operation. To select this layout, select Window Layouts > Load Layout from the View menu, then select Layout5-ProteinDeconvolution and click the Open button.
2 Click on a compound of interest. If linked navigation is turned on, associated data in the following windows are automatically displayed and selected:
• Deconvolution Results window
• An EIC in the Chromatogram Results window
• A compound spectrum that displays all the different peaks in the raw m/z spectrum that indicate the presence of the deconvoluted protein mass in the MS Spectrum Results window
3 Display the MS Peak List window in any of the following ways:
• Right-click in the Deconvolution Results graph and select View MS Peak List 1 from the shortcut menu.
• Click the button on the main toolbar.
• Select MS Spectrum Peak List 1 from the View menu.
4 View the following information for the ion set spectrum in the MS Peak List window:
• Peak • Charge • Cpd Mass • Diff (ppm)
• m/z • Max Abund • Calc Mass • Diff (m/z)
• Abund • Abund% • Expected m/z • Diff (Da)
14 Agilent MassHunter Protein Deconvolution Software Quick Start Guide
Getting Started
To print a report with deconvolution results
1 Display the General > Compound Report section in the Method Editor by selecting Compound Report from the General section in the Method Editor or by selecting Compound Report from the Method Items menu in the Method Editor toolbar.
2 Review the options in this section. Verify that the sections that you want included in the report are marked.
3 Display the General > Common Reporting Options section in the Method Editor by selecting Common Reporting Options from the General section in the Method Editor or by selecting Common Reporting Options from the Method Items menu in the Method Editor toolbar.
4 Review the parameters in both the Templates and Options tabs.
The CompoundReport.xlt template is designed to work with the parameters in the General > Compound Report section. You may change which template is used, but if you do, the parameters you enter in the Compound Report section may no longer work. You can modify the CompoundReport.xlt template.
5 Select Print > Compound Report from the File menu to print the report.
Tip To print deconvolution spectra, right-click in the graph area of the Deconvolution Results window and select Print from the shortcut menu.
Agilent MassHunter Protein Deconvolution Software Quick Start Guide 15
Getting Started
To automate protein confirmation
Use this procedure to automatically perform protein confirmation for samples in a worklist.
1 Display the Assign Actions on Execution from Worklist section in the Method Editor in one of the following ways:
• Select Assign Worklist Actions from the Worklist Automation section of the Method Explorer.
• Select Assign Worklist Actions from the Method Items list in the Method Editor.
2 Select from the following items for protein deconvolution in the Available actions list:
• Integrate and Deconvolute - Integrates each selected chromatogram, extracts m/z peak spectra for each chromatogram peak, deconvolutes for each m/z spectrum separately, displays deconvoluted mass spectra and displays/creates a protein list, according to the parameters set in the Method Editor.
• Deconvolute - Deconvolutes all of the selected m/z spectra. Displays the deconvoluted mass spectra and creates a protein list, according to the parameters set in the Method Editor.
3 Click the Down arrow to move the selected actions to the Actions to be run list. You can also double-click actions to move them to the other list. New items are added to the end of the list.
4 (optional) The items in the Actions to be run list can be reordered using the Up and Down arrows to the right of the list. The actions will be executed in the order they appear in the list. Click the X button to remove unwanted items from the list.
5 Test the list of actions in either of the following ways:
• Select Run the Worklist Actions from the Actions menu.
• Click the button on the Method Editor toolbar.
6 Save the method in any of the following ways:
• Select Save or Save As from the Method menu.
• Click the Save button in the Method Editor toolbar.
• Select Save Method from Method Editor shortcut menu (right-click).
7 Assign this method to samples of interest when setting up a worklist as described in the online help for your instrument.
16 Agilent MassHunter Protein Deconvolution Software Quick Start Guide
Familiarization Tutorial
Familiarization Tutorial
This section includes the following familiarization exercises:
• “Exercise 1. Deconvolute an MS spectrum” (below)
• “Exercise 2. View compound information” on page 23
Exercise 1. Deconvolute an MS spectrumThis exercise shows you how to open a data file, integrate the chromatogram, extract spectra, deconvolute and view results.
Steps Detailed Instructions Comments
1 Copy the myoglobin.d data file from the Data directory on the Qualitative Analysis CD to your computer hard drive.
2 Make sure you have both read and write permissions for the myoglobin.d folder you just created on your computer.
a In Windows Explorer, right-click the myoglobin.d folder and select Properties.
b Clear the Read-only Attributes check box if it is marked.
c In the Confirm Attribute Changes dialog, click Apply changes to this folder, subfolders, and files, then click OK.
This step is required if you want to save results.
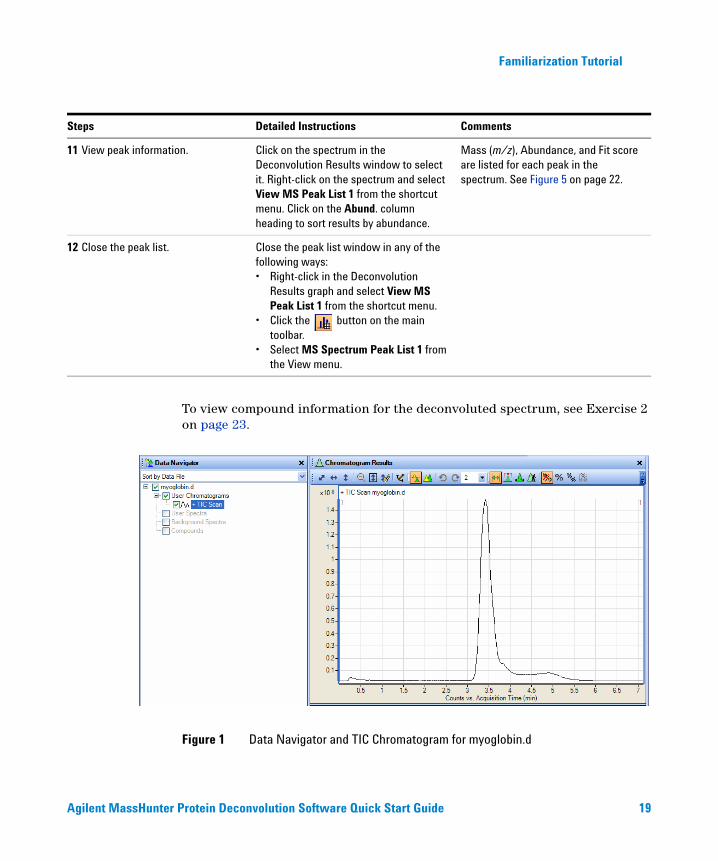
3 Open the myoglobin.D data file. a Select Open Data File from the File menu.
b Locate the myoglobin.d folder and click the Open button.The TIC is automatically displayed is the Chromatogram Results window.
See Figure 1 on page 19.
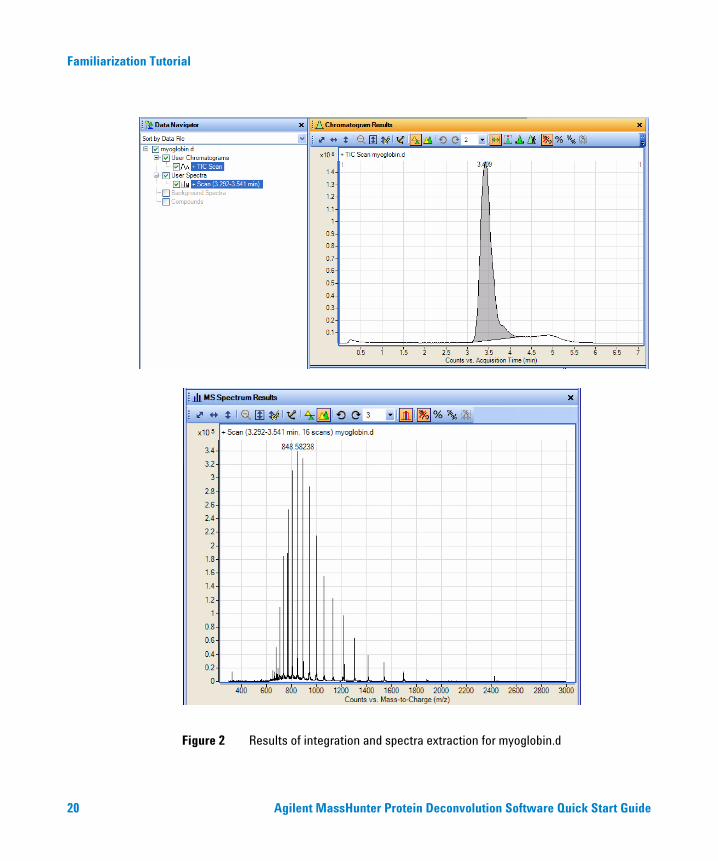
4 Integrate and extract peak spectra. Right-click on the TIC and select Integrate and Extract Peak Spectra from the shortcut menu.Alternate method: Select Integrate and Extract Peak Spectra from the Actions menu.
See Figure 2 on page 20.
Agilent MassHunter Protein Deconvolution Software Quick Start Guide 17
Familiarization Tutorial
5 Open up the Deconvolute Method Editor section.
Display the Deconvolute section in the Method Editor in one of the following ways:• Select Deconvolute (MS) from the
Spectrum section of the Method Explorer.
• Select Deconvolute from the Method Items list in the Method Editor.
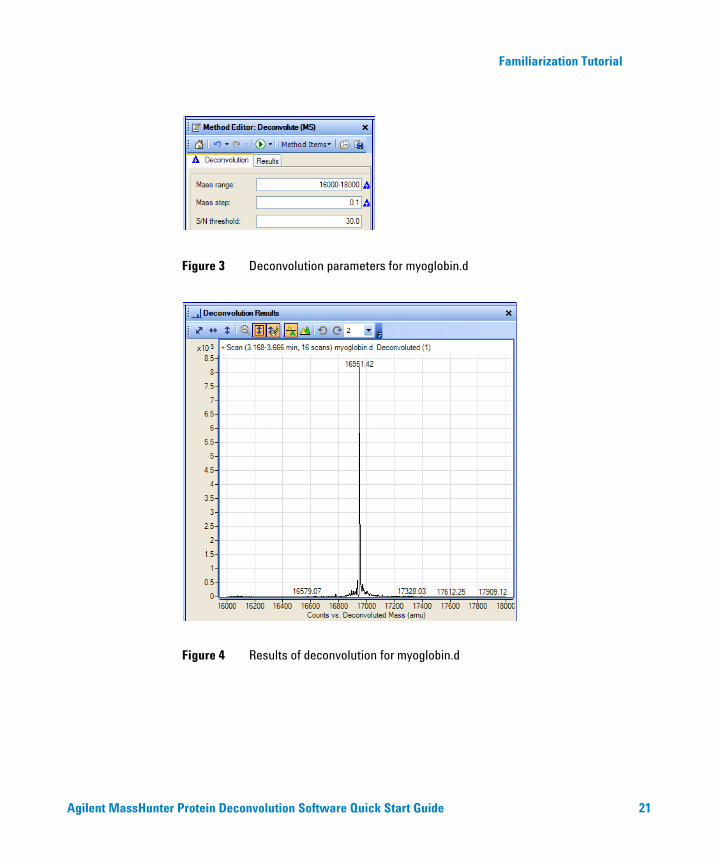
6 Change the deconvolution range to 16000-18000 Da.
On the Deconvolution tab of the Method Editor: Deconvolute (MS) section, enter 16000-18000 for Mass range.
See Figure 3 on page 21.
7 Change the mass step to 0.1 Da. On the Deconvolution tab of the Method Editor: Deconvolute (MS) section, enter 0.1 for Mass step.
See Figure 3 on page 21.
8 Select the extracted MS peak spectrum.
Click on the spectrum in the MS Spectrum Results window.
9 Deconvolute the spectrum. Start the deconvolution process in any of the following ways:• Click the button on the Method
Editor toolbar.• Right-click on the spectrum and select
Deconvolute from the shortcut menu.• Select Deconvolute from the Spectra
menu.• Select Deconvolute from the Actions
menu.
The results appear in the Deconvolution Results window. See Figure 4 on page 21.
For information on changing the display of data in the Deconvolution Results window, see “To view protein deconvolution results” on page 11.
10 Close the Method Editor. Close the Method Editor in any of the following ways:• Click the button on the main
toolbar.• Select Method Editor from the View
menu.• Click the X button in the upper right
corner of the Method Editor window.
This allows more room for the display of data in the Qualitative Analysis application window.
Steps Detailed Instructions Comments
18 Agilent MassHunter Protein Deconvolution Software Quick Start Guide
Familiarization Tutorial
To view compound information for the deconvoluted spectrum, see Exercise 2 on page 23.
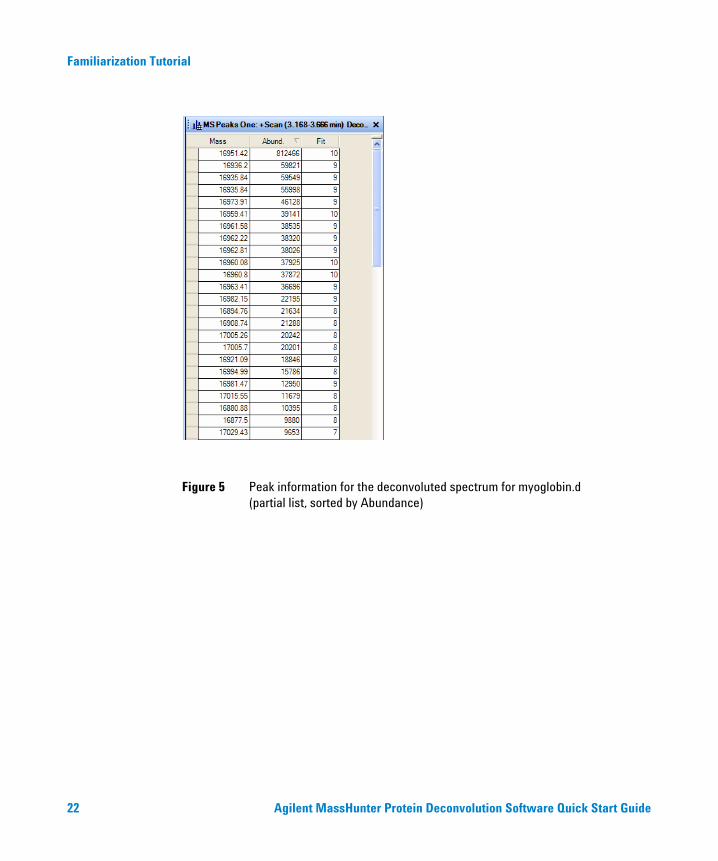
11 View peak information. Click on the spectrum in the Deconvolution Results window to select it. Right-click on the spectrum and select View MS Peak List 1 from the shortcut menu. Click on the Abund. column heading to sort results by abundance.
Mass (m/z), Abundance, and Fit score are listed for each peak in the spectrum. See Figure 5 on page 22.
12 Close the peak list. Close the peak list window in any of the following ways:• Right-click in the Deconvolution
Results graph and select View MS Peak List 1 from the shortcut menu.
• Click the button on the main toolbar.
• Select MS Spectrum Peak List 1 from the View menu.
Steps Detailed Instructions Comments
Figure 1 Data Navigator and TIC Chromatogram for myoglobin.d
Agilent MassHunter Protein Deconvolution Software Quick Start Guide 19
Familiarization Tutorial
Figure 2 Results of integration and spectra extraction for myoglobin.d
20 Agilent MassHunter Protein Deconvolution Software Quick Start Guide
Familiarization Tutorial
Figure 3 Deconvolution parameters for myoglobin.d
Figure 4 Results of deconvolution for myoglobin.d
Agilent MassHunter Protein Deconvolution Software Quick Start Guide 21
Familiarization Tutorial
Figure 5 Peak information for the deconvoluted spectrum for myoglobin.d (partial list, sorted by Abundance)
22 Agilent MassHunter Protein Deconvolution Software Quick Start Guide
Familiarization Tutorial
Exercise 2. View compound information
This exercise shows you how to view compound information for deconvoluted spectra.
Steps Detailed Instructions Comments
1 Deconvolute myoglobin.d spectrum.
See “Exercise 1. Deconvolute an MS spectrum” on page 17.
You do not to repeat the deconvolution steps if you have performed them already in Exercise 1.
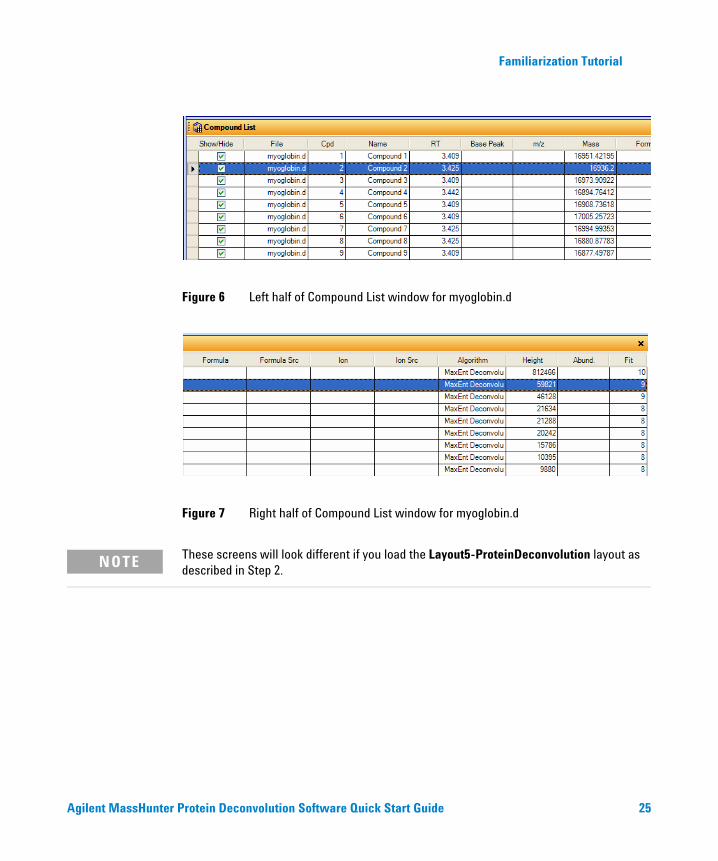
2 View the compound list. Display the Compound List window in any of the following ways:• Select Compound List from the View
menu • Click the button on the main
toolbar• Select Window Layouts > Load
Layout from the View menu, then select Layout5-ProteinDeconvolution and click the Open button. This opens the Compound List and reformats it to show the appropriate information for a deconvolution operation.
See Figure 6 and Figure 7 on page 25.
Note that loading Layout5-ProteinDeconvolution changes the columns in the MS Peak Lists and the Compound List in Figures 6, 7, 8, 11 and 12 (in addition to changing the layout of the chromatograms and spectra).
3 Click on mass 16936.2 in the compound list.
If linked navigation is turned on, associated data in the following windows are automatically displayed and selected:• Deconvolution Results window• An EIC in the Chromatogram
Results window• A compound spectrum that
displays all the charge states from the original m/z data for that specific protein mass in the MS Spectrum Results window
4 Select the ion set spectrum in the Spectrum Results window for the mass 16936.2.
Agilent MassHunter Protein Deconvolution Software Quick Start Guide 23
Familiarization Tutorial
5 View the charge states found for the protein along with their ppm error in the MS Peak List 2 window.
Open the MS Peak List 2 window in any of the following ways after clicking on the spectrum to select it:• Right-click in the Deconvolution
Results graph and select View MS Peak List 2 from the shortcut menu.
• Click the button on the main toolbar.
• Select MS Spectrum Peak List 2 from the View menu.
The following information is displayed for the ion set spectrum:
• Mass• Abundance• Charge state• Diff (ppm)
See Figure 8 on page 26.
6 Switch from List mode to Overlay mode in the MS Spectrum Results window.
Click the button on the toolbar in the MS Spectrum Results window.
See Figure 9 on page 26.
7 Zoom in on the m/z 848.5 peak in the raw data
Right-drag to expand the area around m/z 848.5 in the MS Spectrum Results window.
See Figure 10 on page 27.
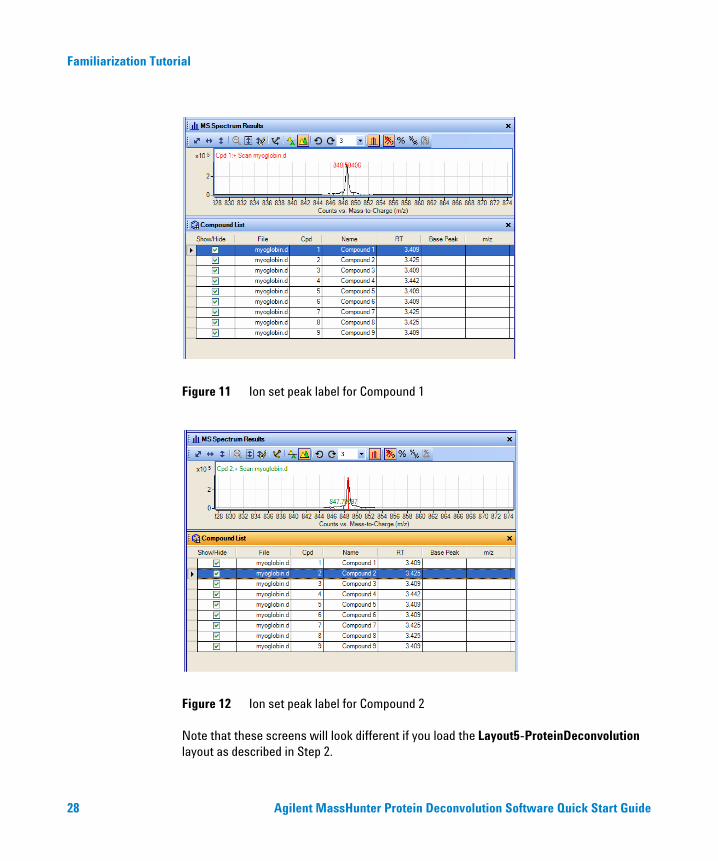
8 Select compound 1 in the compound list.
Click on the first line of the Compound List table.
Notice that the ion set peak for that mass shows a peak label. See Figure 11 on page 28
9 Select compound 2 in the compound list.
Click on the second line of the Compound List table.
Notice that the ion set peak for another peak is highlighted. See Figure 12 on page 28
10 Print a compound report. See “To print a report with deconvolution results” on page 15.
Steps Detailed Instructions Comments
24 Agilent MassHunter Protein Deconvolution Software Quick Start Guide
Familiarization Tutorial
Figure 6 Left half of Compound List window for myoglobin.d
Figure 7 Right half of Compound List window for myoglobin.d
NOTE These screens will look different if you load the Layout5-ProteinDeconvolution layout as described in Step 2.
Agilent MassHunter Protein Deconvolution Software Quick Start Guide 25
Familiarization Tutorial
Figure 8 MS Peaks Two window for myoglobin.d
Figure 9 MS Spectrum Results window for myoglobin.d (Overlay Mode)
26 Agilent MassHunter Protein Deconvolution Software Quick Start Guide
Familiarization Tutorial
Figure 10 MS Spectrum Results window for myoglobin.d (zoomed)
Agilent MassHunter Protein Deconvolution Software Quick Start Guide 27
Familiarization Tutorial
Figure 11 Ion set peak label for Compound 1
Figure 12 Ion set peak label for Compound 2
Note that these screens will look different if you load the Layout5-ProteinDeconvolution layout as described in Step 2.
28 Agilent MassHunter Protein Deconvolution Software Quick Start Guide