24
Agilent Measurement Wizard Assistant (MWA) Software for the ENA Application Note
Agilent
Measurement Wizard Assistant (MWA)
Software for the ENA
Application Note

2
Introduction ......................................................................................................... 2
Product Overview ............................................................................................. 3
Front-End Application - Create the Spec Sheet ........................................ 4
Step 1. Multiport Test Set setup .................................................................. 5
Step 2. DUT setup ........................................................................................... 6
Step 3. Mode setup ........................................................................................ 7
Step 4. GPIB setup ......................................................................................... 8
Step 5. Spec Sheet setup .............................................................................. 9
Step 6. Output setup .................................................................................... 10
Step 7. System setup ................................................................................... 11
Back-End Application.................................................................................... 12
Step 1. Import a spec sheet to the ENA for measurement setup ........ 12
Step 2. Perform calibration with the calibration wizard ........................ 14
Step 3. Confi rm connection between test system and DUT ................. 16
Step 4. Start measurements ....................................................................... 17
Step 5. Analyze of measurement results ................................................. 18
Measurement Example ................................................................................. 20
Summary ............................................................................................................ 23
Required Hardware and Software for the ENA Multiport Solution ... 23
References ......................................................................................................... 23
Related Literature ........................................................................................... 23
In today’s fast-paced testing environments, with increasing functionality supported
in devices under test (DUTs), network analysis is becoming more and more
complicated. Many components have multiple RF input and/or output ports
making multiport measurement a requirement for total device characterization.
Complex multiport devices also have more parameters that need to be measured
requiring engineers to spend a lot of time setting up the measurement system, an
expenditure that leads to a loss of efficiency in product development and
manufacturing test. To accelerate time to market, device manufacturers need easy-to-
use software that guides them through whole measurement procedure and minimizes
the time spent on setup and measurements. Agilent Measurement Wizard Assistant
(MWA) software for the Agilent ENA network analyzer simplifies measurement
procedures. MWA software supports multiport measurement on the 4-port ENA using
the E5092A configurable multiport test set(s).
This application note explains how using MWA software on the ENA simplifies
measurements and reduces the setup time of complicated measurements. It provides
you with a step-by-step guide to the MWA and useful measurement tips for using the
software.
Introduction
Table of Contents

3
Figure 1 shows the overall concept of MWA software1. MWA consists of two main
applications - the Front-End application handles complex parameter settings input
with a PC and the Back-End application loads the setup file into the ENA and
automatically sets the measurement parameters.
The Front-End application, running on the Microsoft® Excel, enables you to easily
set up complex measurements. After you enter the parameters, the software
automatically generates a setup file for the ENA that includes all parameters for
network analysis such as power level, frequency range, IFBW or number of points.
This application software is provided as a VBA macro on Excel and can be operated
on any PC with Excel installed. Measurement parameters can now be entered
using a PC, which reduces operating time and increases productivity.
The Back-End application runs on the ENA as a VBA macro. This macro provides
the functions of spec sheet loading, calibration wizard, and limit test monitoring.
The Back-End application imports the setup file (.mwa) generated by the Front-End
application and uses it to automatically set up measurements on the ENA. The
Calibration Wizard 2 takes you through the calibration steps necessary for all mea-
surements. This wizard minimizes the number of required connections between the
device under test (DUT) and calibration standards during the calibration procedure,
eliminates the possibility of connecting to wrong ports, and saves operating time
during calibration. Measurement procedures are fully controlled by the Back-End
application. The software provides you with a wide variety of functions that allow
you to customize your measurements for your applications. The Back-End applica-
tion also provides detailed measurement results. You can view reports and get a
detailed snapshot of your DUT’s characteristics using a simple operation.
The following sections provide more details on the MWA’s advanced functionality.
Figure 1. Overview of the Measurement Wizard Assistant software
Product Overview
Setup file
(.mwa)
Front-End Application
• Software based on Microsoft Excel.
• Operates on any PC with Microsoft Excel installed.
• Software based on a Microsoft VBA Macro
working in the ENA.
• Option E5071C-790 for the ENA is required for
full operation capability.
Features• Easy and fast measurement setup of the ENA.
• Generates one setup file (.mwa) that includes all
measurement parameters.
• Step-by-step setup wizard with Excel-based user
interface.
Back-End Application
Features• Recalls the .mwa setup file and sets all the
parameters on the ENA automatically.
• Calibration wizard minimizes operation time.
• Automatic test procedures with go/no go limit test.
1. ENA Option E5071C-790 ENA is required to
enable full MWA software capability. Upgrade
product (E5005A) is available as well. An
evaluation version of the MWA software can be
downloaded at: www.agilent.com/find/mwa
2. When using an ECal module with calibration
wizard of the MWA, the 4-port ECal module
(i.e. N4431B or N4433A) is required.

4
Before performing a measurement with the ENA, you must create a setup file.
MWA software uses Excel spreadsheets to create this file via the Front-End
application. When the Front-End application is opened, you will see that there are
seven spreadsheets:
1. Multiport Test Set
2. DUT
3. Mode
4. GPIB
5. Spec Sheet
6. Output
7. System
This application note will go through these seven spreadsheets in succession
starting with the Multiport Test Set sheet.
Front-End Application -
Create the Spec Sheet

5
Step 1. Multiport Test Set setup
The Multiport Test Set sheet lets you select the appropriate instrument and
measurement configuration (Figure 2).
1) Select configuration of the multiport test set1 to be used for multiport network
analysis (Figure 2a). Test set configurations can be customized for your
application.
2) You can cascade two test sets for characterization of devices with a large
number of ports (Figure 2b). In this case, port 1 to port 4 of the second test
set are connected to the ports on the first test set by inputting each port
number in the Link cell of the spreadsheet.
3) The available measurement paths are automatically displayed in the
measurement connectivity matrix (Figure 2c). This provides the combination of
ports on the ENA or the test set that is available for measurements. Note that
measurements between ports cannot be performed if they share the same
source or receiver port on the ENA. MWA software checks the internal
architecture of the test set and automatically eliminates any configuration
setup with this limitation.
Figure 2. Multiport Test Set sheet (Front-End application)
(a) Select test set configuration
(b) Select second test set (optional)
(c) Measurement connectivity matrix
1. The Z5623A K64 and K66 multiport test sets only
work with PNA-L Option 245.

6
Step 2. DUT setup
1) The DUT sheet provides information on the device under test (DUT),
connection to the ENA or multiport test set(s) ports, and testing parameters
(Figure 3). You can assign names to the ports of the DUT (Figure 3a). When
testing a component with differential ports, select Differential instead of
Single. Use Sub Label to name each single-ended port of a differential pair
(Figure 3b).
2) Select connection to the corresponding ports on the ENA or test set using the
Test Set Port cells (Figure 3c).
3) All the parameters related to the Fixture Simulator functions of the ENA need
be entered in this spreadsheet. These parameters are used to characterize the
device ports or fixtures used in testing. Selecting the correct port impedance
or port matching circuit of each port to increases the accuracy of DUT and
fixture characterization. (Figure 3d).
Figure 3. DUT sheet (Front-End application)
(a) Assign port name of DUT
(b) Name differential ports(c) Assign ports of test set connected to DUT
(d) Set parameters of the Fixture Simulator

7
Step 3. Mode setup
Components with integrated active devices require DC control line voltage
to select the active path of the device for testing. The Mode sheet defines
the operation mode of the DUT (Figure 4). The E5092A multiport test set has
4 independent DC sources that can supply DC control line voltage to a device
through a 15-pin or 25-pin D-sub connector on the front panel. Select L (low) or
H (high) voltage for each control bit in the spreadsheet to define the operating
mode of the DUT. ENA MWA software enables synchronized measurement of up
to 40 independent operation modes.
1) Assign a preferred mode name (Figure 4a). Test results for each mode are
generated by the Back-End application after the measurements are performed.
Turn the mode ON or OFF (Figure 4b). When a mode is turned off in this
spreadsheet, you cannot set parameters in the Spec Sheet and measurements
are not performed.
2) Set the Control Line Voltage for each control line. You can set up to 20 bits
with the 4-independent DC sources (Group A to D) of the E5092A (Figure 4c).
3) Set the DC voltage for each Group (Figure 4d). DC control voltage is applied to
the DUT from the internal DC sources of the E5092A.
Figure 4. Mode sheet (Front-End application)
(a) Assign mode name
(b) Turn mode on/off
(c) Set control bits (d) Specify DC voltage
8
Step 4. GPIB setup
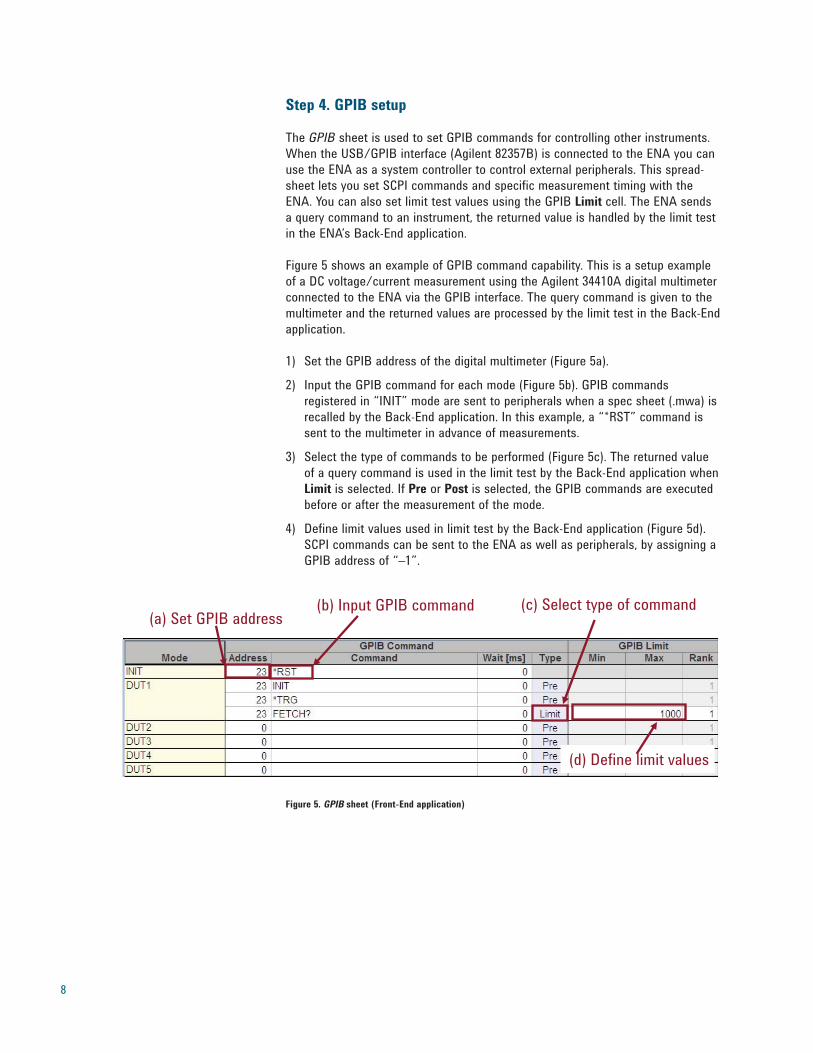
The GPIB sheet is used to set GPIB commands for controlling other instruments.
When the USB/GPIB interface (Agilent 82357B) is connected to the ENA you can
use the ENA as a system controller to control external peripherals. This spread-
sheet lets you set SCPI commands and specific measurement timing with the
ENA. You can also set limit test values using the GPIB Limit cell. The ENA sends
a query command to an instrument, the returned value is handled by the limit test
in the ENA’s Back-End application.
Figure 5 shows an example of GPIB command capability. This is a setup example
of a DC voltage/current measurement using the Agilent 34410A digital multimeter
connected to the ENA via the GPIB interface. The query command is given to the
multimeter and the returned values are processed by the limit test in the Back-End
application.
1) Set the GPIB address of the digital multimeter (Figure 5a).
2) Input the GPIB command for each mode (Figure 5b). GPIB commands
registered in “INIT” mode are sent to peripherals when a spec sheet (.mwa) is
recalled by the Back-End application. In this example, a “*RST” command is
sent to the multimeter in advance of measurements.
3) Select the type of commands to be performed (Figure 5c). The returned value
of a query command is used in the limit test by the Back-End application when
Limit is selected. If Pre or Post is selected, the GPIB commands are executed
before or after the measurement of the mode.
4) Define limit values used in limit test by the Back-End application (Figure 5d).
SCPI commands can be sent to the ENA as well as peripherals, by assigning a
GPIB address of “–1”.
Figure 5. GPIB sheet (Front-End application)
(a) Set GPIB address(b) Input GPIB command (c) Select type of command
(d) Define limit values

9
Step 5. Spec Sheet setup
All the measurement parameters on the ENA and specified values for the limit
test should be input into this spreadsheet. A detailed explanation for each
parameter is given below.
1) Specify measurement paths by selecting input and output ports of the DUT
(Figure 6a). The port names of the DUT were previously assigned in the DUT
sheet. You can add more measurement paths to the mode of interest by
double-clicking in the Mode cell.
2) Select the format type of measurement parameters (Figure 6b). You can select:
Transmission: IL (insertion loss), Ripple, ATT (attenuation), and Isolation
Reflection: RL (return loss) and VSWR (voltage standing wave ratio)
Transmission/reflection: Phase, Group Delay, Lin Mag (linear magnitude),
Real, and Imag (imaginary)
Balanced (for differential): BalAmp (amplitude difference between balanced
ports) and BalPhase (phase difference between balanced ports)
3) Set stimulus parameters such as frequency range, number of points, power
level or IFBW on the ENA1 (Figure 6c). Use the ENA frequency-offset mode
when you need different frequency ranges for the source and receiver ports of
the ENA. Enter the frequency range of the receiver in the Rcvr Freq cell.2
4) Enter the minimum and maximum threshold levels for limit test (Figure 6d). The
Back-End application uses these limit values (DUT specifications) to perform
the limit test returning measurement results for each path. If limit test
measurements aren’t required, these cells can be left blank. Blank cells are
automatically interpreted as either –999 (MIN) or 999 (MAX).
Figure 6. Spec Sheet (Front-End application)
(a) Set measurement paths (b) Select format type (c) Set stimulus parameters (d) Define limit values
1. If the value is out of the ENA's setting range,
the Back-End application automatically sets it
to the closet allowable value.
2. ENA Option E5071C-008 or upgrade product
E5003A are required for this operation.
10
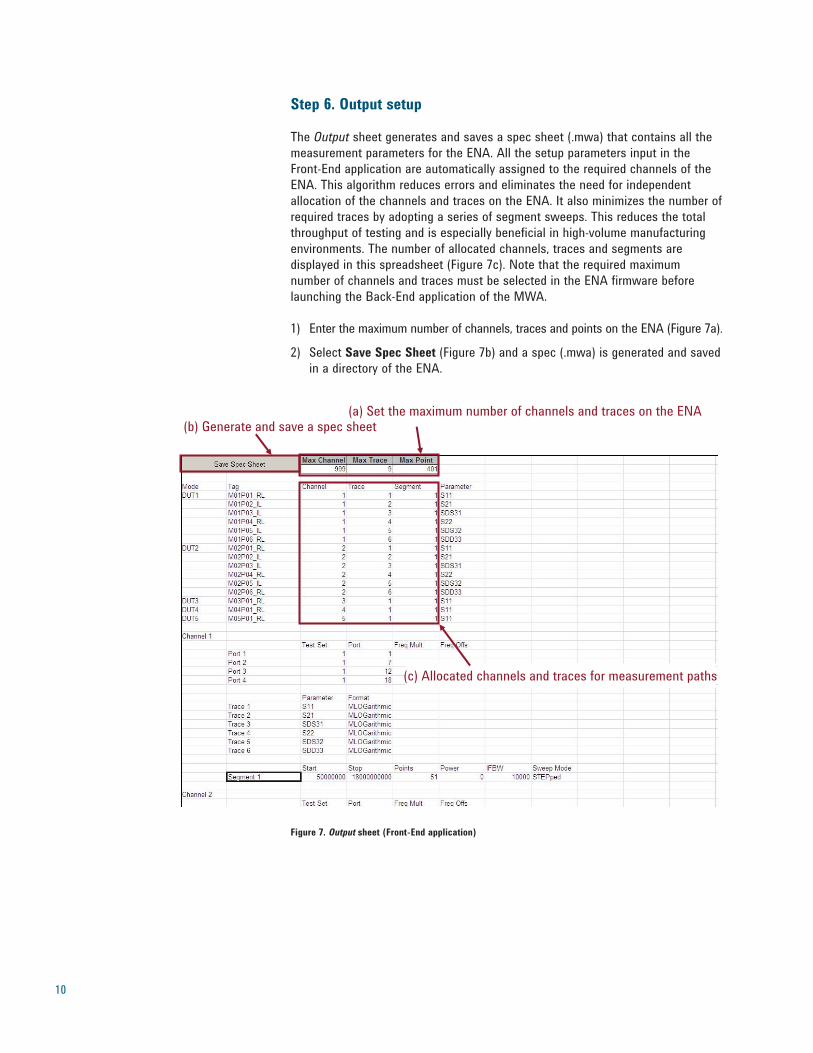
Step 6. Output setup
The Output sheet generates and saves a spec sheet (.mwa) that contains all the
measurement parameters for the ENA. All the setup parameters input in the
Front-End application are automatically assigned to the required channels of the
ENA. This algorithm reduces errors and eliminates the need for independent
allocation of the channels and traces on the ENA. It also minimizes the number of
required traces by adopting a series of segment sweeps. This reduces the total
throughput of testing and is especially beneficial in high-volume manufacturing
environments. The number of allocated channels, traces and segments are
displayed in this spreadsheet (Figure 7c). Note that the required maximum
number of channels and traces must be selected in the ENA firmware before
launching the Back-End application of the MWA.
1) Enter the maximum number of channels, traces and points on the ENA (Figure 7a).
2) Select Save Spec Sheet (Figure 7b) and a spec (.mwa) is generated and saved
in a directory of the ENA.
Figure 7. Output sheet (Front-End application)
(b) Generate and save a spec sheet(a) Set the maximum number of channels and traces on the ENA
(c) Allocated channels and traces for measurement paths
11
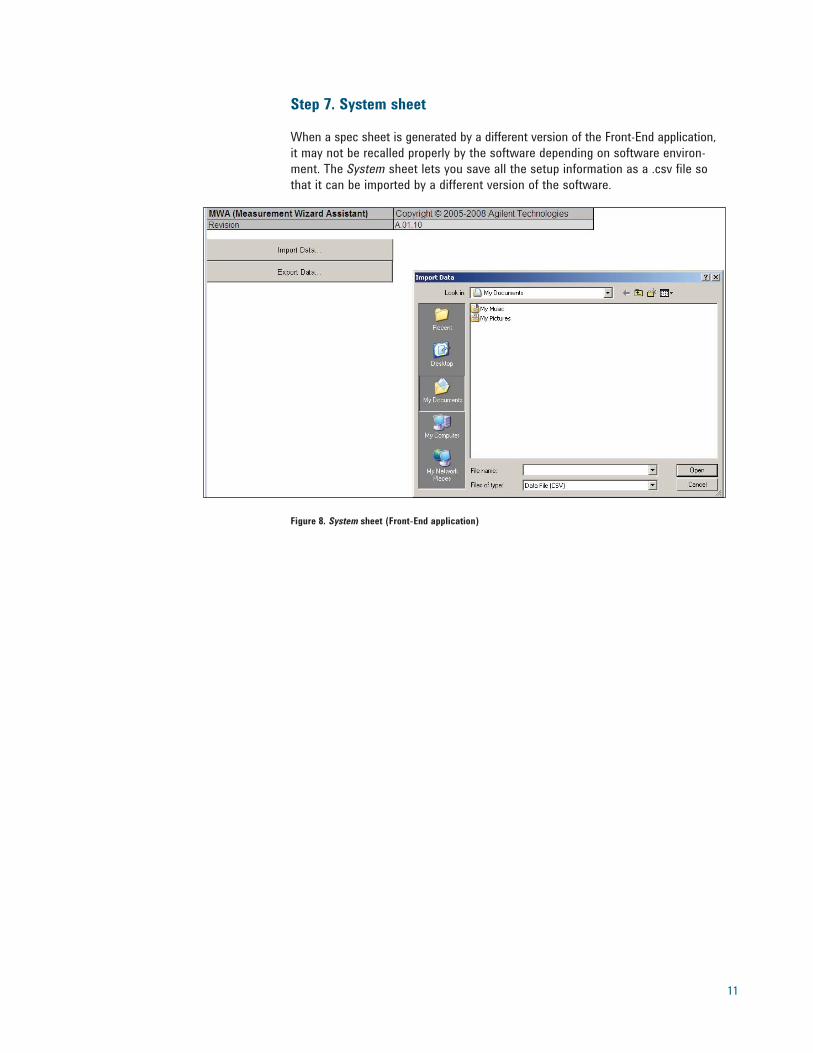
Step 7. System sheet
When a spec sheet is generated by a different version of the Front-End application,
it may not be recalled properly by the software depending on software environ-
ment. The System sheet lets you save all the setup information as a .csv file so
that it can be imported by a different version of the software.
Figure 8. System sheet (Front-End application)

12
The Back-End application runs on the ENA as a VBA macro program. This
provides the following functionalities:
1. Import a spec sheet to the ENA for measurement setup
2. Perform calibration with the calibration wizard
3. Confirm connection between test system and DUT
4. Start measurements
5. Display measurement results
The necessary steps for measurements with the Back-End application will be
described in detail in the following section.
Step 1. Import a spec sheet to the ENA for measurement setup
You must import a spec sheet (.mwa) to the Back-End application in advance of
all measurement procedures.
1) Launch the Back-End application on the ENA by selecting [Macro Setup] >
Load Project > select the latest version of MWA > [Marco Run]. The main
MWA window appears on the ENA’s display (Figure 9).
Figure 9. Main MWA window (Back-End application)
2) Click on Add Spec Sheet Group in the main window to select the spec sheet
settings (Figure 9a).
(a) Import a spec sheet
(c) Launch calibration wizard
(d) Confirm connection of test system to DUT
(f) Start measurement
(b) List of recalled spec sheets and allocated
measurement channels
(e) Save a state file
Back-End Application
13
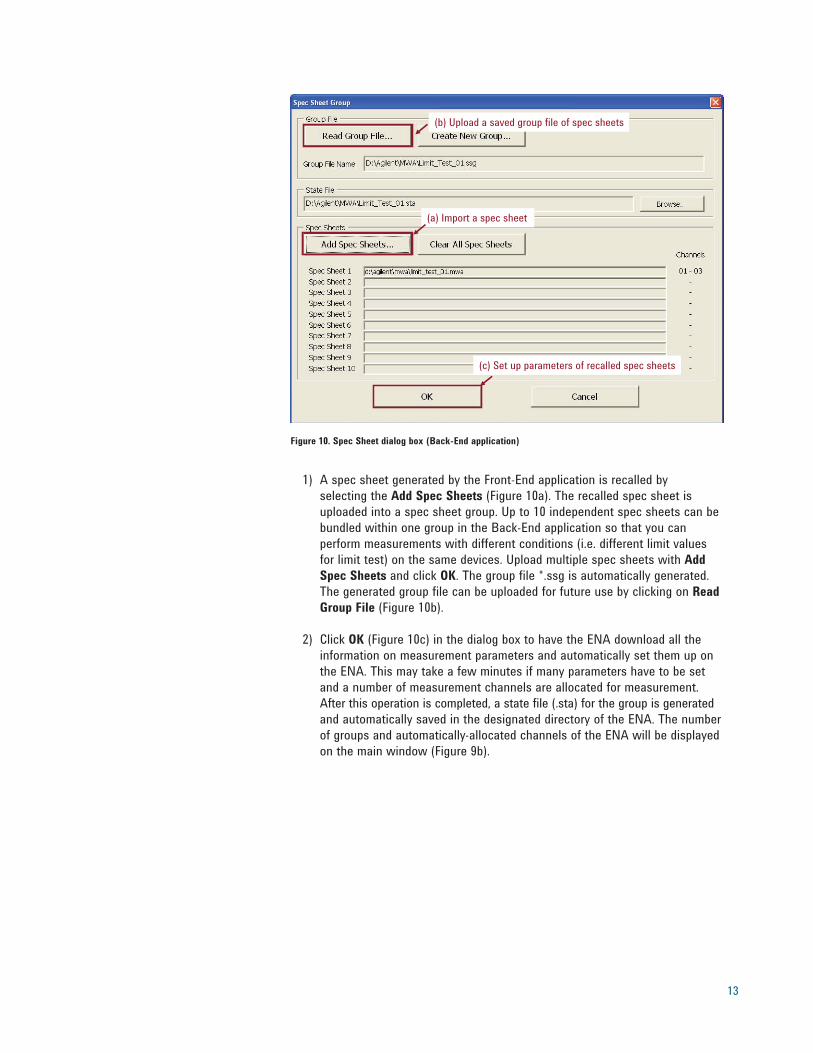
Figure 10. Spec Sheet dialog box (Back-End application)
1) A spec sheet generated by the Front-End application is recalled by
selecting the Add Spec Sheets (Figure 10a). The recalled spec sheet is
uploaded into a spec sheet group. Up to 10 independent spec sheets can be
bundled within one group in the Back-End application so that you can
perform measurements with different conditions (i.e. different limit values
for limit test) on the same devices. Upload multiple spec sheets with Add
Spec Sheets and click OK. The group file *.ssg is automatically generated.
The generated group file can be uploaded for future use by clicking on Read
Group File (Figure 10b).
2) Click OK (Figure 10c) in the dialog box to have the ENA download all the
information on measurement parameters and automatically set them up on
the ENA. This may take a few minutes if many parameters have to be set
and a number of measurement channels are allocated for measurement.
After this operation is completed, a state file (.sta) for the group is generated
and automatically saved in the designated directory of the ENA. The number
of groups and automatically-allocated channels of the ENA will be displayed
on the main window (Figure 9b).
(a) Import a spec sheet
(b) Upload a saved group file of spec sheets
(c) Set up parameters of recalled spec sheets

14
Step 2. Perform calibration using the calibration wizard
The calibration wizard function provided by the Back-End application gives
instructions for the calibration procedure and computes all the error coefficients
on all the allocated channels on the ENA. A software algorithm optimizes the
sequence of connections between the ports and calibration standards reducing
the number of required connections.
1) Select Cal Wizard in the main window (Figure 9b) and the Cal Wizard dialog
box is displayed (Figure 11).
2) Select the type of calibration and the calibration standard: Mechanical Cal
Kit, 4 Port ECal, Power Cal or Receiver Cal (Figure 11a). A number of
Agilent Technologies mechanical calibration standards can be used with the
calibration wizard on the ENA. Agilent’s electronic calibration module, 4 Port
ECal, allows you customize the calibration procedure with user-defined
characteristics (User 1 to 5). This ECal module enables accurate characterization
of devices with different types of connectors.
3) Click on Next for the next step of the calibration procedure (Figure 11b). After
clicking Next, this procedure may need to be repeated in order to assure that
all necessary calibrations1 have been performed.
Figure 11. Calibration wizard dialog box (Back-End application)
(b) Select Next to continue
(a) Select type of calibration
1. Calibration of the ENA is limited to 4 ports at one
time.
15
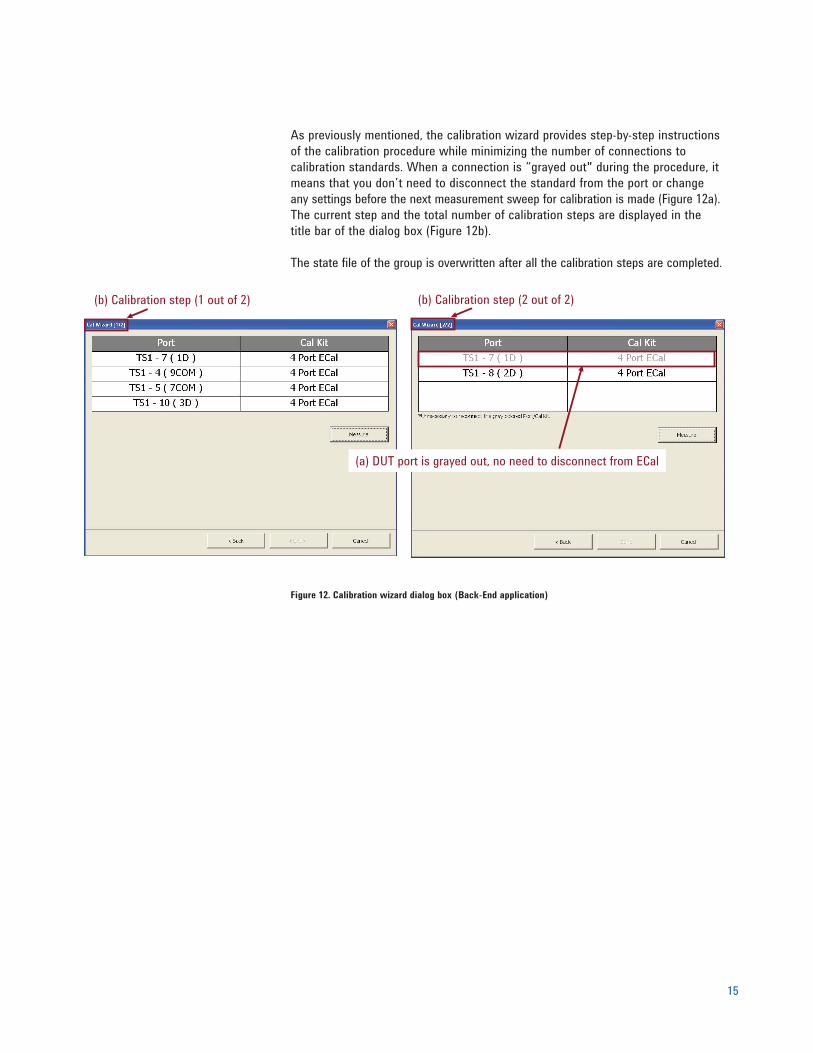
As previously mentioned, the calibration wizard provides step-by-step instructions
of the calibration procedure while minimizing the number of connections to
calibration standards. When a connection is “grayed out" during the procedure, it
means that you don’t need to disconnect the standard from the port or change
any settings before the next measurement sweep for calibration is made (Figure 12a).
The current step and the total number of calibration steps are displayed in the
title bar of the dialog box (Figure 12b).
The state file of the group is overwritten after all the calibration steps are completed.
Figure 12. Calibration wizard dialog box (Back-End application)
(a) DUT port is grayed out, no need to disconnect from ECal
(b) Calibration step (1 out of 2) (b) Calibration step (2 out of 2)

16
Step 3. Confirm connections between the test system and the DUT
The Back-End application offers a unique functionality which confirms correct
connection between the DUT and the instrument ports. Select Connection
Information on the main window (Figure 9d), to display connection information
in the dialog box (Figure 13). This dialog box shows the ENA and multiport test set
connected correctly (In this figure, “NA” stands for the ENA network Analyzer and
“TS1” stands for the E5092A configurable multiport test set). This eliminates the
possibility of connection between incorrect ports, and facilitates multiple
connections for multiport network analysis.
Once all the steps have been completed, the state file for the group can be
overwritten using Save State button in the main window (Figure 9e). This should
be completed before testing begins.
Figure 13. Connection Information dialog box (Back-End application)
(a) Connection between ENA and test set ports
(b) Connection between test set ports and DUT

17
Step 4. Start measurements
The Back-End application controls the overall measurement sequence of spec
sheets. The software features a wide variety of measurement functionalities
allowing you to easily customize measurement conditions for your application in
the spec sheets.
1) Select Measurement on the main window of the Back-End application (Figure 9f)
to start the measurement sequence and display the measurement window for
all spec sheets (Figure 14). Measurement results for each spec sheet including
overall pass/fail results, yield rates and approximate total testing time are
summarized in measurement window (Figure 14a).
2) Select Manual Trigger to initiate the measurement using a manual trigger
(Figure 14b). The summary of measurement results (Figure 14a) is updated
after the measurement is performed.
Figure 14. Measurement window for all spec sheets (Back-End application)
(a) Summary of measurement results for a spec sheet
(b) Start measurement with manual trigger
(c) Allocate a portion of the display window for the Back-End application

18
Step 5. Analyze measurement results
The Back-End application provides you with detailed measurement reports for
more accurate analysis of DUTs. You can analyze the result of each measurement
path of the DUT with different specifications using multiple spec sheets, and cap-
ture all the characteristics of the device with a single measurement.
1) Select the name of the spec sheet (Figure 15a), and the dialog box which is
used for measurement by the spec sheet is displayed (Figure 15).
2) Select Manual Trigger (Figure 15b) to initiate measurement of the mode
sheets. The total pass/fail result for the spec sheet is highlighted at the top of
the dialog box (Figure 15c), and a detailed report is given for each operation
mode.
3) Select a mode (Figure 15d) to display a detailed analysis report of the mode
(result verification by mode). This contains the pass/fail result for each
measurement path in the selected mode. Note that the limit test is performed
with parameters retrieved from external peripherals as well.
Figure 15. Measurement analysis with MWA software
Dialog box for measurement Measurements of all
spec sheets by spec sheetDialog box for
result verification
(a) Select a spec sheet
(b) Start measurement by mode
(c) Total pass/fail result for the spec sheet
(d) Select a mode

19
In order to evaluate an actual trace of the DUT, there are Half and Minimize
keys on top of the measurement window for all spec sheets (Figure 14c). This
function allows you to re-arrange the measurement channel locations on the
ENA. This provides you with better visibility of measurement traces and easy
access to them for further investigation. When you select the Half button, the
window of the Back-End application is located at the bottom half of the ENA
display (Figure 16a). You can view the behavior of measured traces on the ENA
display and easily examine the margin of the limit line tests. (Note you need to
customize and define the channel scale on the ENA as this function is not
supported by the MWA.) The bottom half of the window displays the number of
channels and traces of failed measurement paths (Figure 16b), which you can
refer to for more detailed information. If the check box of Disp Enable (Figure 16c)
is selected in the dialog box, the display update function is activated; this updates
images on the display of the ENA. This function should be disabled when fast
testing speeds are required.
Figure 16. Half (left) and minimized (right) display window of the Back-End application
(b) Failed result of measurement paths
(c) Checkbox of Display Enable function
(a) Half window of Back-End application
(d) Minimized window of Back-End application

20
A measurement example of the MWA Front-End application is provided in this section.
In this example, the DUT is an RF SP9T (single-pole, nine-throw) multiport switch
(Figure 17). These switches are typically installed in cellular handsets with multi-
band functionality. S-parameter measurements are performed on all paths out of
the 10 ports while switching the output port of the DUT. The connected output
port is determined by 4-bit logic control signals to Vc1 to Vc4 inputs. Power supply
voltage is applied to the Vdd pin of the DUT. Both DC control voltages and power
supply voltage are applied from the E5092A via a control line connector.
Figure 17. Block diagram of an SP9T multiport switch
(1) Configuration setup
A full crossbar measurement is required for this DUT, so the 10-port full crossbar
configuration of the E5092A (E5092A X10-Port) should be selected in Multiport
Test Set sheet of the Front-End application. The block diagram of the configuration is
indicated in Figure 18. This configuration lets you make any 2-port measurement
between the 10 ports of the DUT. See the measurement connectivity matrix (Figure 19).
Figure 18. Block diagram of a 10-port full crossbar configuration
ANT
Tx1
Tx2
TRx1
TRx2
TRx3
Rx1
Rx2
Rx3
Rx4
V c4 V c3 V c2 V c1
Switch control
V dd
SW6 6A 6B
6COM
SW7 7A 7B
7COM
SW5 5A
5COM
5B
SW1
1A 1B 1C 1D
PORT 1SW4
4A 4B 4C 4D
PORT 4
7 91 3 5
SW8 8A 8B
8COM
SW9 9A 9B
9COM
SW10 10A 10B
10COM
SW2
2A 2B 2C 2D
PORT 2SW3
3A 3B 3C 3D
PORT 3
8 102 4 6
Measurement Example
21
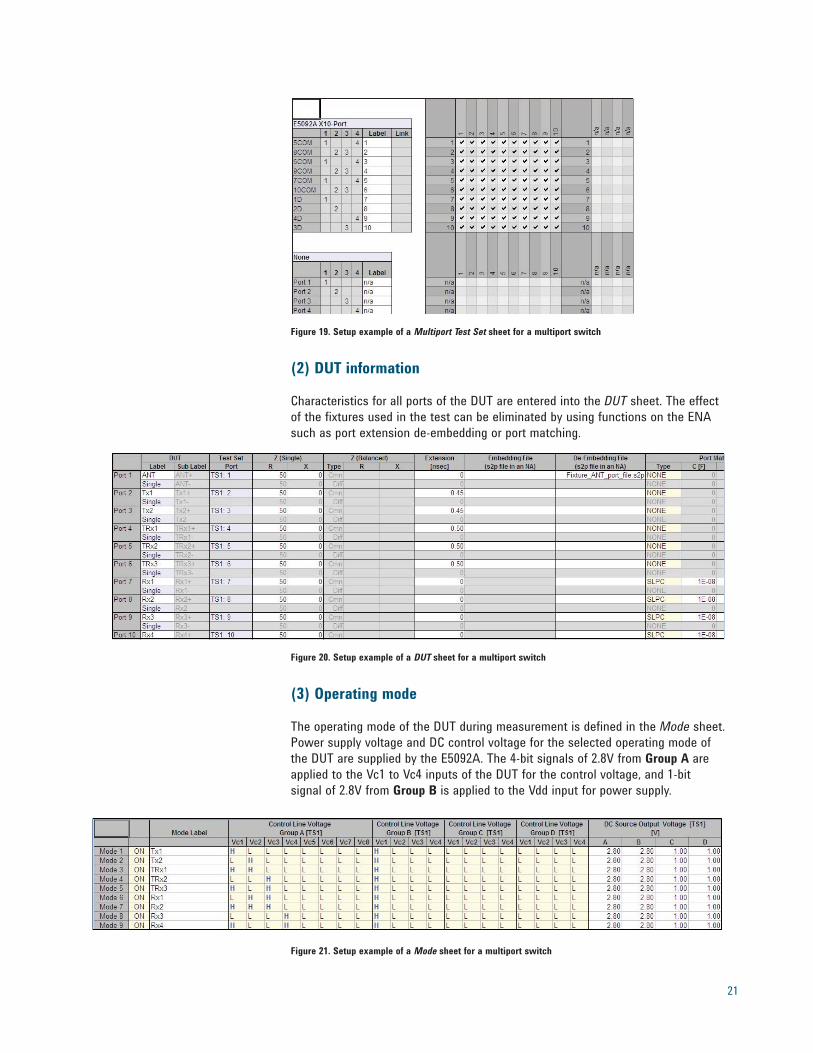
Figure 19. Setup example of a Multiport Test Set sheet for a multiport switch
(2) DUT information
Characteristics for all ports of the DUT are entered into the DUT sheet. The effect
of the fixtures used in the test can be eliminated by using functions on the ENA
such as port extension de-embedding or port matching.
Figure 20. Setup example of a DUT sheet for a multiport switch
(3) Operating mode
The operating mode of the DUT during measurement is defined in the Mode sheet.
Power supply voltage and DC control voltage for the selected operating mode of
the DUT are supplied by the E5092A. The 4-bit signals of 2.8V from Group A are
applied to the Vc1 to Vc4 inputs of the DUT for the control voltage, and 1-bit
signal of 2.8V from Group B is applied to the Vdd input for power supply.
Figure 21. Setup example of a Mode sheet for a multiport switch

22
(4) GPIB command setup
SCPI commands registered in the GPIB sheet are sent to a digital voltmeter at GPIB
address 7 during measurement on the ENA. Returned query values are used for
limit tests by the Back-End application.
Figure 22. Setup example of a GPIB sheet for a multiport switch
(5) Parameter setup
All the stimulus parameters for the measurement including frequency range,
number of points, output power level and IFBW are set up in the Spec Sheet
spreadsheet. Specification values of the DUT are entered for the limit tests in the
Back-End application.
Figure 23. Setup example of a Spec Sheet spreadsheet for a multiport switch

23
This application note showed you how to simplify multiport measurements using
MWA software with the ENA network analyzer and multiport test set. In most
cases, measurement speed of the network analyzer is not the only factor in
increasing throughput in testing. The time spent connecting the devices to
measurement instruments, calibrating the instrument and setting up of the
measurement parameters is much longer than actual measurement time of
the network analyzer. Using the MWA software saves you a lot of setup and
calibration time and eliminates many of the operator errors that can result in net-
work analysis failure.
E5071C ENA network analyzer
E5092A Configurable multiport test set
E5071C-790 or Measurement Wizard Assistant softwareE5005A Measurement Wizard Assistant software (upgrade product)
ENA Series Web page: www.agilent.com/find/ena
Multiport test sets Web page: www.agilent.com/find/multiport
MWA Web page: www.agilent.com/find/mwa
ENA Network Analyzers and E5092A Configurable Multiport Test Set Brochure,
Literature number 5989-5478EN
ENA Network Analyzers and E5092A Configurable Multiport Test Set Data Sheet,
Literature number 5989-5479EN
ENA Network Analyzers and E5092A Configurable Multiport Test Set
Configuration Guide, Literature number 5989-5480EN
Comprehensive Multiport Solution for the ENA Network Analyzer Application Note,
Literature number 5989-8737EN
Summary
Required Hardware
and Software for the
ENA Multiport Solution
References
Related Literature
Remove all doubt
Our repair and calibration services will get
your equipment back to you, performing
like new, when promised. You will get
full value out of your Agilent equipment
throughout its lifetime. Your equipment
will be serviced by Agilent-trained techni-
cians using the latest factory calibration
procedures, automated repair diagnostics
and genuine parts. You will always have the
utmost confidence in your measurements.
Agilent offers a wide range of additional
expert test and measurement services for
your equipment, including initial start-up
assistance onsite education and training,
as well as design, system integration, and
project management.
For more information on repair and
calibration services, go to
www.agilent.com/find/removealldoubt
www.agilent.com/find/emailupdates
Get the latest information on the products
and applications you select.
www.agilent.com/find/agilentdirect
Quickly choose and use your test
equipment solutions with confidence.
www.agilent.com/find/open
Agilent Open simplifies the process of
connecting and programming test systems
to help engineers design, validate and
manufacture electronic products. Agilent
offers open connectivity for a broad range
of system-ready instruments, open industry
software, PC-standard I/O and global
support, which are combined to more
easily integrate test system development.
www.lxistandard.org
LXI is the LAN-based successor to
GPIB, providing faster, more efficient
connectivity. Agilent is a founding
member of the LXI consortium.
www.agilent.comwww.agilent.com/fi nd/ena
For more information on Agilent Technologies’
products, applications or services, please
contact your local Agilent office. The
complete list is available at:
www.agilent.com/fi nd/contactus
Americas
Canada (877) 894-4414
Latin America 305 269 7500
United States (800) 829-4444
Asia Pacifi c
Australia 1 800 629 485
China 800 810 0189
Hong Kong 800 938 693
India 1 800 112 929
Japan 0120 (421) 345
Korea 080 769 0800
Malaysia 1 800 888 848
Singapore 1 800 375 8100
Taiwan 0800 047 866
Thailand 1 800 226 008
Europe & Middle East
Austria 01 36027 71571
Belgium 32 (0) 2 404 93 40
Denmark 45 70 13 15 15
Finland 358 (0) 10 855 2100
France 0825 010 700*
*0.125 €/minute
Germany 07031 464 6333**
**0.14 €/minute
Ireland 1890 924 204
Israel 972-3-9288-504/544
Italy 39 02 92 60 8484
Netherlands 31 (0) 20 547 2111
Spain 34 (91) 631 3300
Sweden 0200-88 22 55
Switzerland 0800 80 53 53
United Kingdom 44 (0) 118 9276201
Other European Countries:
www.agilent.com/fi nd/contactus
Revised: July 17, 2008
Product specifi cations and descriptions
in this document subject to change
without notice.
© Agilent Technologies, Inc. 2008
Printed in USA, September 30, 2008
5989-4855EN


