12
Aging Environments of Fear Nestor Rodriguez The University of Texas at Austin Jacqueline Hagan The University of North Carolina at Chapel Hill
| Date post: | 13-Apr-2017 |
| Category: |
Healthcare |
| Upload: | university-of-texas-at-san-antonio |
| View: | 162 times |
| Download: | 0 times |

Aging Environments of Fear
Nestor RodriguezThe University of Texas at Austin
Jacqueline HaganThe University of North Carolina at Chapel Hill

Paper’s thesis• Restrictive immigration policies implemented since the mid-1990s
have created fear and stress in immigrant environments that negatively affect the quality of life for older immigrants age 50 and older.

IIRIRA and PRWORA, 1996, Etc.1) Placed older migrants at risk for arrest,
detention, and deportation
2) Created instability, fear, and tension in households that support older migrants,
3) Restricted access to health-care resources
State and Local Restrictive Measures
Figure 1. Outcome of Local Restrictive Policy Proposals by Quarter, 2000 to 2009(Migration Policy Institute 2010)

IIRIRAFacilitates deportations
• Increases number of deportable offenses
• Makes most detention mandatory
• Makes deportations retroactive
• Section 287(g) authorizes training for state and local police to inspect immigration status
• Increases deportation cancelation criteria
• Budget for construction of border barrier
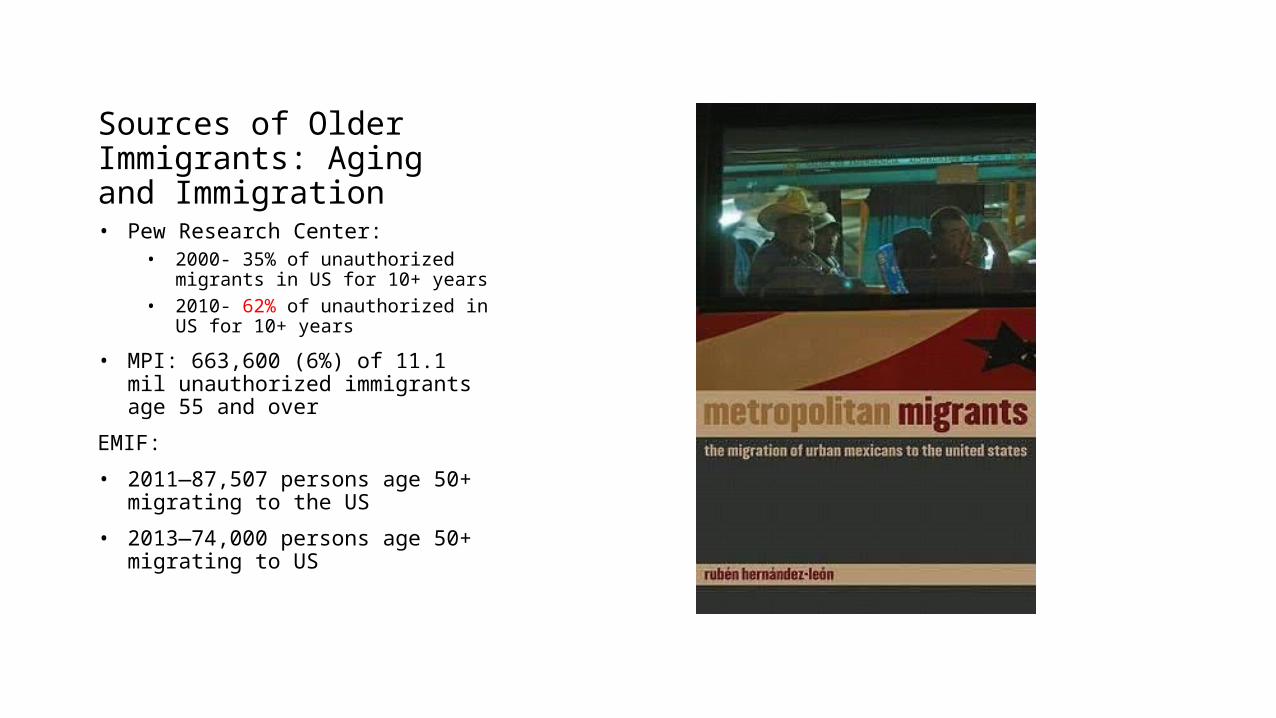
Sources of Older Immigrants: Aging and Immigration• Pew Research Center:
• 2000- 35% of unauthorized migrants in US for 10+ years
• 2010- 62% of unauthorized in US for 10+ years
• MPI: 663,600 (6%) of 11.1 mil unauthorized immigrants age 55 and over
EMIF:
• 2011—87,507 persons age 50+ migrating to the US
• 2013—74,000 persons age 50+ migrating to US

Data Sources• Encuestas Sobre la Migracion en las Fronteras Norte y Sur de Mexico (EMIF) • 1989 Legalized Population Survey (LPS1) of the US Department of Labor • The Pew Research Center National Survey of Latinos in 2007, 2008, 2010
and 2013 Other:• Arbona et al. 2010. “Predictors of Acculturative Stress among Documented
and Undocumented Latino Immigrants.” Hispanic Journal of Behavioral Sciences, 32 (3): 362-384. • Rodriguez, N., and J. Hagan. 2004. “Fractured Families and Communities:
Effects of Immigration Reform in Texas, Mexico, and El Salvador.” Latino Studies, 2 (3): 328-351.
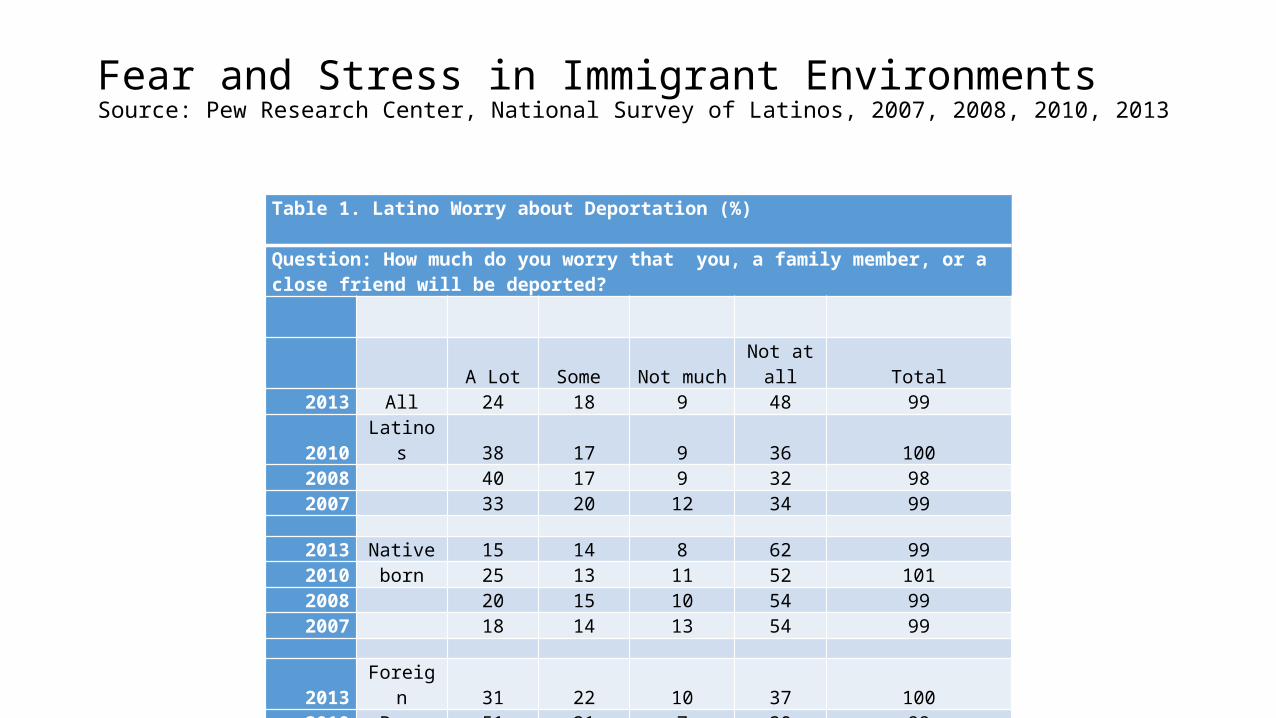
Fear and Stress in Immigrant EnvironmentsSource: Pew Research Center, National Survey of Latinos, 2007, 2008, 2010, 2013
Table 1. Latino Worry about Deportation (%)
Question: How much do you worry that you, a family member, or a close friend will be deported?
A Lot Some Not much Not at all Total2013 All 24 18 9 48 992010 Latinos 38 17 9 36 1002008 40 17 9 32 982007 33 20 12 34 99
2013 Native 15 14 8 62 992010 born 25 13 11 52 1012008 20 15 10 54 992007 18 14 13 54 99
2013 Foreign 31 22 10 37 1002010 Born 51 21 7 20 992008 53 19 8 18 982007 43 24 11 20 98

Latino Immigrant Worry Responses, Age 50+, 2013 Source: Pew Research Center
Table 2. Latino immigrants, age 50+, worry about Deportation, by citizen/noncitizen, 2013Question: How much do you worry that you, a family member, or a close friend will be deported?
Citizen (n= 136)
Noncitizen (n = 54)
Worry a lot or some 41% 53%
Worry not much or not at all 59% 40%
No response 1% 6%101% 99%
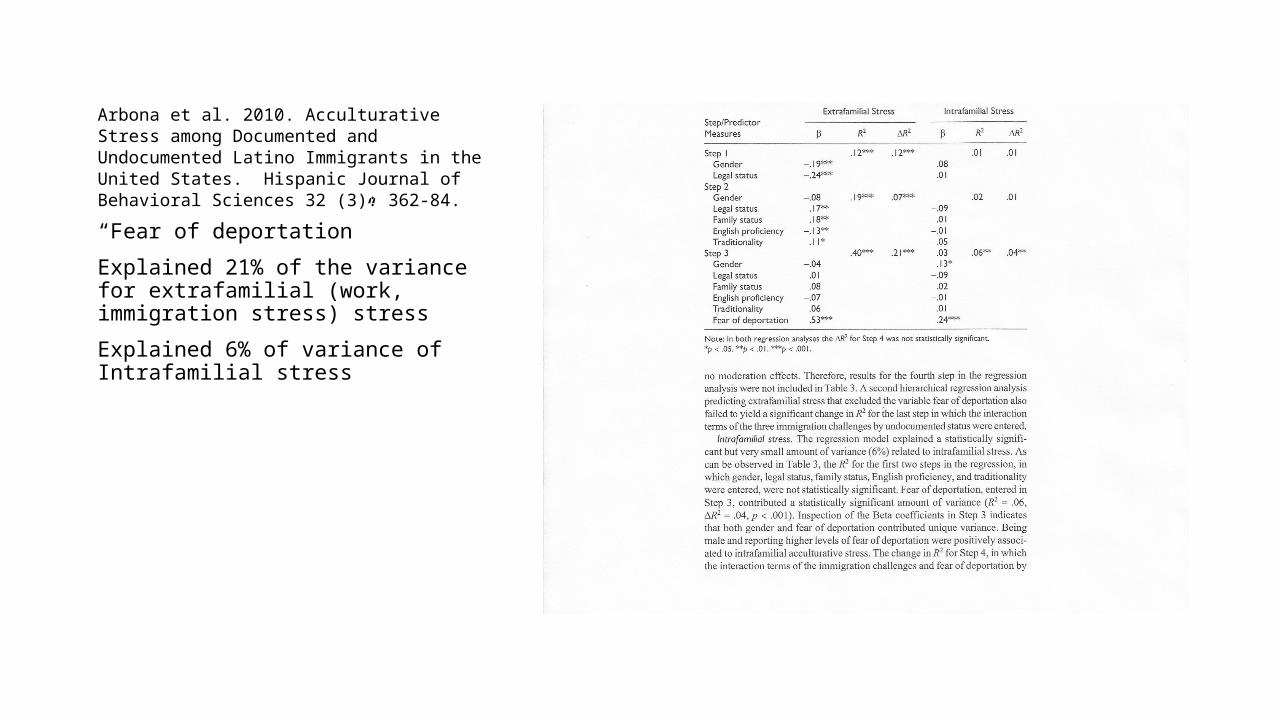
Arbona et al. 2010. Acculturative Stress among Documented and Undocumented Latino Immigrants in the United States. Hispanic Journal of Behavioral Sciences 32 (3): 362-84.“Fear of deportation”
Explained 21% of the variance for extrafamilial (work, immigration stress) stress
Explained 6% of variance of Intrafamilial stress

Increased risk of deportationSource: Trac, 2014, ICE Deportations: Gender, Age, and Country of Citizenship. Syracuse University
ICE Deportations by AgeFY 2012 FY 2013 FY2012 FY2013
All 409,849 368,644Age Provided 326,434 368,607 100% 100%0-4 50 44 0% 0%5-9. 52 62 0% 0%10-14. 311 207 0% 0%15-19 17,651 19,502 5% 5%20-24 68,256 74,256 21% 20%25-29 73,622 80,717 23% 22%30-39 108,494 124,297 33% 34%40-49 45,090 53,577 14% 15%50-59 11,147 13,786 3% 4%60-69 1,588 1,982 0% 1%70+ 172 177 0% 0%

Risk of Household Collapse: “Deporting Social Capital”
Salvadoran Deported Migrant Sample, 2002 (N=300):• 25% of total sample lived in
multigenerational households with older generation
• 70% of those who lived 5+ years in US had an older generational member in household in US
(Rodriguez & Hagan 2004)

Restrictions to Health Care The New England Journal of
Medicine“Undocumented Injustice? Medical Repatriation and the Ends of Health Care”Michael J. Young, M.Phil., and Lisa Soleymani Lehmann, M.D., Ph.D.N Engl J Med 2014; 370:669-673February 13, 2014DOI: 10.1056/NEJMhle1311198
Health care needs of older immigrants
• Eight percent of IRCA applicants hospitalized in US (LPS1)
• Main usual places of health care for IRCA applicants were “doctor’s office” and family clinics for 11% of women applicants (LPS1)
• Texas public hospitals offer lists to federal officials of unauthorized immigrants who did not pay hospital bill
• 800 documented cases of hospital repatriations (Young & Lehmann 2014)


