Growers’ Guide to Grafted Tomatoes First Edition Michael Grieneisen 1 , Brenna Aegerter 2 , Scott Stoddard 3 , Minghua Zhang 1 1 Department of Land, Air & Water Resources, University of California, Davis 2 University of California Cooperative Extension, San Joaquin County, Stockton, CA 3 University of California Cooperative Extension, Merced County, Merced, CA
Transcript
Growers’ Guide to Grafted TomatoesFirst Edition
Michael Grieneisen1, Brenna Aegerter2, Scott Stoddard3, Minghua Zhang1
1Department of Land, Air & Water Resources, University of California, Davis2University of California Cooperative Extension, San Joaquin County, Stockton, CA3University of California Cooperative Extension, Merced County, Merced, CA
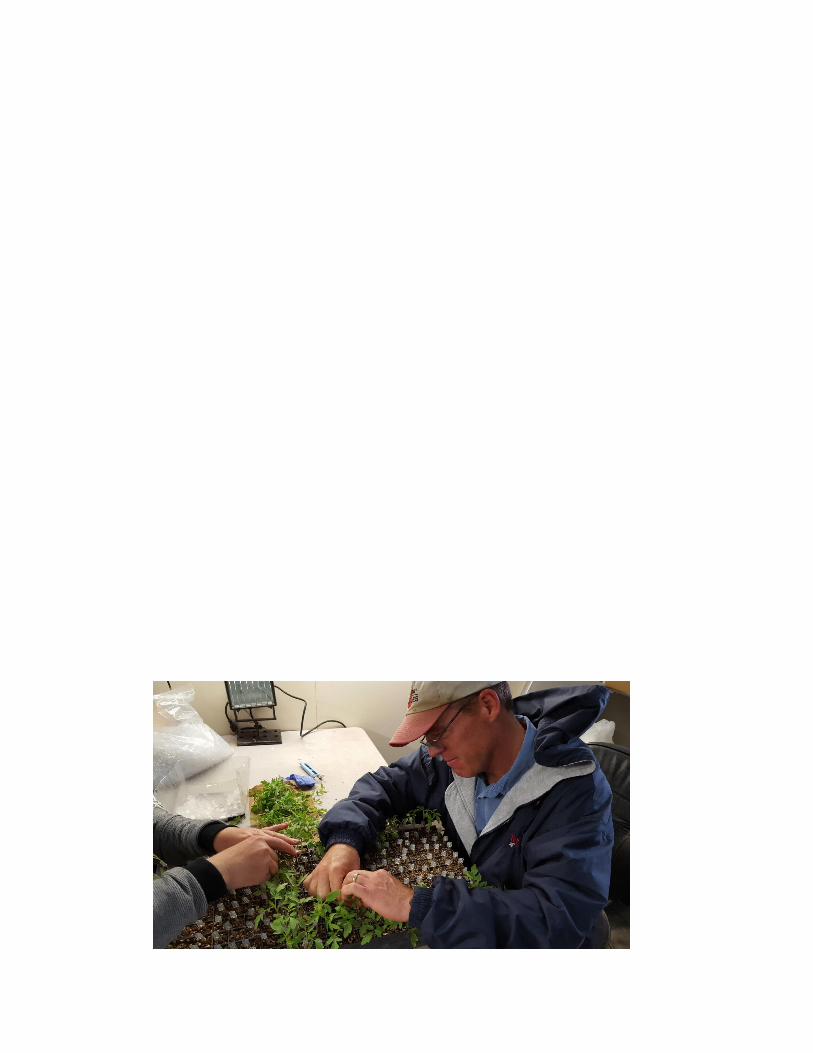
Cover image sources: (top) http://www.horticulturablog.com/2012/06/en-tomates-las-variedades-si-que.html; (bottom) Scott Stoddard performing the tomato plant grafting for our field trials.
Note: The Department of Pesticide Regulation (DPR) provided partial funding for this project but does not necessarily agree with any opinions expressed, nor endorse any commercial product or trade name mentioned.
This Guide Introduces the reader to grafted tomatoes Describes a commonly used method for producing grafted tomato plants Describes the potential benefits of using grafted tomatoes Summarizes the data from our 2016 field trials with grafted tomatoes in commercial California fields in San
Joaquin and Merced Counties A PDF version of this guide is available at http://agis.ucdavis.edu/Research/Grafting/Main.html
1. Grafted tomato basics 1.1 What are grafted tomatoes?Grafting of tomato plants involves the splicing together of different plants of different varieties, with one serving as the rootstock and the other as the scion (the “top” part of the grafted plant, Fig. 1). Grafting allows the grower to benefit from the best traits of both plant varieties. In many countries in Latin America, Europe and Asia, grafted tomatoes represent a large percentage of the tomato industry. For example, in Spain ~50-70 million grafted plants annually account for 40% of all tomato production (Miguel, et al., 2011; Raymond, 2013).
Only way to gauge performance of a given scion/rootstock combination is trial-and-error. Optimal production requires meeting the horticultural needs of both rootstock and scion varieties. Due to the physiological interactions between the rootstock and scion, the only way to know how well a particular combination will perform, in terms of yield, is through field trials.
Plant and fruit characteristics are determined by the scion variety. The rootstock does not affect plant determinism, tomato shape, or flavor characteristics.
The lack of data on commercial California tomato varieties as scions. Fresh market tomato production in California differs from that in other regions, including the use of varieties unique to CA. Therefore, despite the recent grafted tomato research in states such as Florida, North Carolina, and Kansas, it is necessary to conduct field trials with grafted plants under California commercial conditions to see whether they offer a profitable option to growers.
1.2.How to produce grafted tomatoes. For non-woody plants like tomatoes, several different methods of grafting exist (see: http://aggie-
Reducing the labor costs of producing grafted plants by the use of automation is still largely in the experimental phase.
Brenna Aegerter and Scott Stoddard participated in producing the grafted plants for our fresh market tomato field trials. Grafting was performed at Growers Transplanting, Inc. (Salinas, CA), and used a standard “clip grafting” method (Figure 2).
Figure 1. Schematic of a grafted plant. From: http://anpsa.org.au/grafting.html
Two main sources of grafted transplants in California are Plug Connection (Vista, CA) and Growers Transplanting, Inc. (Salinas, CA).
For do-it-yourself grafting, about 20 companies offer seeds for the ~50 commercial rootstocks, and these sources are listed at http://www.vegetablegrafting.org/tomato-rootstock-table/.
Figure 2. Production of the grafted tomato plants for our field trials. Step 1. Scion and rootstock shoots, with stems of about the same diameter, are cut at 45° angles.
Step 2. The scions are placed onto the rootstocks, aligning the 45° angle cuts, and secured with a soft plastic clip. Plant survival rates are highest when the diameters of the two stems to be joined are similar.
Step 3. The plants are then transferred to a “healing chamber” with high humidity for about a week to allow the graft union to heal. The plants are then transferred and grown in the greenhouse for several weeks as with conventional seedlings.
1.3.Potential benefits of grafted tomatoes: Higher yields, pathogen resistance and reduced pesticide use1.3.1. Rootstock vigor drives higher yields. One benefit of grafted tomatoes is a characteristic typically described
as “vigor”. The commercial rootstocks produce a larger root system than typical commercial tomato varieties (Fig. 3), improving water and nutrient uptake and increasing yields. Some studies have found increased yields at lower-than-normal planting densities, and suggested that the larger root structures of grafted plants need more space to avoid competing with each other.
Figure 3. Tomato plant root structures of varieties that are optimized for both biomass production (B) and water usage efficiency (W), a non-optimized variety (bw), and their grafted combinations. The non-grafted optimized “BW” variety clearly shows a more robust root structure than the others. Source: Cantero-Navarro, et al., 2016.
1.3.2. Pathogen resistance. Grafted plants often use rootstocks that are resistant to some of the most serious soil pathogens.
Website http://www.vegetablegrafting.org/tomato-rootstock-table/ lists ~50 different commercially available tomato rootstocks and their resistances (Fig. 4).
Many rootstocks are hybrids between the commercial tomato species and a wild tomato species, the latter of which have evolved to grow under a wide range of environmental conditions. Some are resistant to 6 to 8
different soil-borne pathogens, such as Fusarium wilt and corky root rot. However, none of the current rootstocks are resistant to Fusarium wilt race 3 or Verticillium wilt race 2, which are often found in California.
Plants with rootstocks that are “highly resistant” (“HR” in Fig. 4) can be used as “non-host” rotation crops, rather than the small grains or corn, which are currently recommended by UCIPM as rotation crops for limiting the proliferation of soil-borne pathogens in tomato fields across multiple years (http://ipm.ucanr.edu/PMG/r783900611.html).
Figure. 4. Portion of an alphabetical list of commercial tomato rootstocks and the soil-borne pathogens to which they are resistant. The full list includes about 50 rootstocks available from 20 different seed companies. Source:
1.3.3. Reduced pesticide use. Grafted plants using “highly resistant” (“HR” in Fig. 4) rootstocks may also be able to be used in fields infested
with diseases or nematodes without the need for additional pest management practices, such as fumigation.
1.4.Economics of using grafted versus non-grafted plants Grafted plants cost more than non-grafted plants due to increased seed costs and the labor required to do the
grafting (Rivard, et al., 2010). Several studies have tracked the total life-cycle costs of grafted and non-grafted tomato plants in actual field trials. A study in Florida has shown yield increases of 25-42% using certain grafting combinations, but year-to-year variability also increased as compared to non-grafted plants (Djidonou et al., 2013). This variation underscores the importance of considering multiple years’ worth of data to determine the feasibility of grafted tomatoes in a given agricultural system.
The amount of yield increase required to pay for the extra expense of grafted plants depends on two things: The cost of the grafted plants and crop value. The Florida study (Djidonou, et al., 2013) found grafted plants to be economically advantageous based on costs of $0.67 per grafted plant and $0.15 for non-grafted plants, and a crop value of $10.95-$11.95 per 25-lb carton of tomatoes.
In California, however, the value per 25-lb carton is typically much lower, in the range of $6-$9. Thus far, grafted tomato plants are only available from a few sources in California (such as Plug Connection in Vista, CA and Growers Transplanting, Inc., Salinas, CA), and we won’t know what the cost for grafted plants will be until they are being produced in larger volumes here, perhaps with automation of the grafting process.
Using figures from the Fresh Market Tomato Production Cost Study published by University of California Cooperative Extension (Stoddard et al., 2007), we can consider a hypothetical economic analysis of grafted plants using figures more appropriate for our production system. Assuming a hypothetical 23% yield increase with grafting (from 1,300 to 1,600 25-lb boxes/acre) and a grafted plant price of $0.40 each, an increase in net revenue with grafting could be achieved when the price per box is between $8 and $9 (Table 1). If the grafted plants are more expensive (e.g., $0.60 versus $0.40) or the price per box is lower, then an increase in net revenue with grafting would be much harder to achieve.
Table 1. Effect of grafted plant cost and crop value on potential profitability of grafted tomato plants in California.
Cost per grafted plant
Conventional $0.60 each $0.40 eachYield 25 lb boxes/A
Conventional Grafted $0.60 each Net revenue $0.40 each Net revenueBox $ Gross $/A Net $/A Gross $/A Net $/A difference Net $/A difference$5.00 $6,500 -$300 $8,000 -$2,184 -$1,884 -$1,312 -$1,012
$9.00 $11,700 $4,900 $14,400 $4,216 -$684 $5,088 $188All dollar amounts are rounded to the nearest dollar. Estimates are based on plant densities of 5,808 per acre for conventional (18" spacing), and 4,356 per acre for grafted (24" spacing), and the conventional cost of establishment (materials only): plants $31 per 1000, seed $43 per 1000 = $74 per 1000.
2. Grafted tomato trials in commercial California tomato fields2.1.Description of our field trialsFresh market tomato production in California differs from other regions in several respects: Fields in California are typically harvested only once, while fruit are green; whereas in other parts of the US fruit
are often picked ripe and harvesting continues until plant senescence.
The commercial varieties used in California are not grown elsewhere.
In California, plants are grown in open fields, while in the eastern US ‘high tunnels’ are more common, and in other parts of the world a high proportion of all tomato production occurs in protected culture (greenhouse or shadehouse).
Experimental design. The treatments included the 16 combinations of the scions and rootstocks listed in Table 2. These varieties were selected based on the performance of various rootstocks in the published literature as well as conversations with seed companies and our grower-cooperators. The trials were conducted in commercial fields at two locations, one near Vernalis in San Joaquin County, and the other in Le Grand, Merced County.
Scion varieties Rootstock varietiesBobcat BS01543756Dixie Red DR0137TX*Galilea MaxifortHM1794 Non-grafted
Table 2. Scion and rootstock varieties used in our 2016 field trials. All combinations of the 4 scions with 3 rootstocks, in addition to non-grafted scion varieties, were included in the trials. *Note: Galilea is a roma fruit type, while the other three are round fruit types.
The plots were laid out using a randomized complete-block design with 4 replicate plots for each grafted and non-grafted treatment. The participating growers managed the experimental plots along with the rest of the commercial field with respect to pest control, fertilization, irrigation, and other management practices. Plants were transplanted using mechanical transplanters into prepared beds at 4-5’’ depth.
The issue of planting depth. To realize the maximum benefit of rootstock pathogen resistance, the graft union (Fig. 1) should remain above the soil line to minimize contact between the scion tissues and the soil. In greenhouse and high tunnel production systems with plant support, the graft union is typically kept above ground. However, in our open-field system, the transplant plugs were planted with the graft union below the soil surface. In this situation, soilborne pathogens may attack adventitious roots or the susceptible crown. Due to the lack of significant pathogen pressure in our fields, we believe this was not an issue for these trials.
2.2.Field trial results from San Joaquin and Merced counties.
Table 3. Yield data from San Joaquin County and Merced County field trials in 2016.San Joaquin County Merced County Combined
SCION Total yieldv Market yieldv Total yield Market yield Market yieldROOTSTOCK yield % diffw yield % diff N yield yield % diff yield % diff
NON-GRAFTED 1663 d 1399 bc 4 3469 2516 1958BS01543756 1541 d -7% 1282 c (-8) 4 3873 2525 0% 1904 -3%
Values represent the means of 4 observations in San Joaquin and either 3 or 4 in Merced as indicated. Means in the same column followed by the same letter are not significantly different according to Tukey's HSD test.
v Yields in 25 lb-boxes/A. Total yield includes culls and undersize fruit, while marketable yield excludes these two categories.w Percentage difference in yield of grafted plants compared to the non-grafted controls.
Marketable yields in the San Joaquin trial.o Marketable yields ranged from 1399-2240 boxes/acre, and almost all of the grafted combinations
provided higher marketable yields than the corresponding non-grafted plants at the San Joaquin site (Table 3).
o Each scion/rootstock combination acted like a unique crop variety, and good performance requires compatibility between the two parts. Grafting increased marketable yield very little for some combinations, but up to 23% for Galilea/Maxifort, 27-31% for the grafted Dixie Red combinations, 36% for Bobcat/DR0138TX, and 60% for Bobcat/Maxifort.
Marketable yields in the Merced trial.
o Marketable yields were much higher than in the San Joaquin trial, ranging from 2099-3864 boxes/acre (Table 3). Unlike the San Joaquin trial, in many cases grafted plants produced lower marketable yields than the corresponding non-grafted varieties in the Merced trial. For example, the yield for Dixie Red/Maxifort was only slightly more than half the yield for non-grafted Dixie Red; while in the San Joaquin trial Dixie Red/Maxifort gave 24% higher yield than non-grafted Dixie Red.
o In the Merced trial, some of the plots were lost to either gophers or some type of rapid vine decline or collapse. No pathogenic organisms could be isolated from the collapsed plants, so the cause is not known.
Combined marketable yield data for both trial locations, and economic considerations.
o Averaged across both trials, marketable yield increased 12-20% when grafting with Bobcat as the scion. Based on the economic analysis presented in Table 1, the highest level of average yield increase (20%) would only become economically viable when the crop price exceeds about $9 per 25-lb carton and grafted plant cost is no more than around $0.40 per plant.
o While the results for a few of the combinations in the San Joaquin trial are encouraging, it is difficult to extrapolate the significance of data from a single year of field trials.
o Many published field trials indicate that the yield advantages of grafted plants are greatest under sub-optimal growing conditions—such as those with pathogen pressure or low nutrient levels. The fact that the data from the San Joaquin trial looked more promising in 2016 may be due to the lower overall yields in that region, relative to Merced.
Table 4. Fruit size distribution, maturity and vine health in San Joaquin and Merced County field trials in 2016.San Joaquin County Merced County
SCIONSize distribution (% fruit by wt)x Maturity Vine health
x Size distribution of marketable fruit based on USDA sizing standards. Note that cv. Galilea is a Roma-type, which follows different sizing standards than round-fruit types.y Vigor of the vines evaluated visually just before harvest and rated based on a scale from 1 to 5. 1 = vines small, fruit coverage poor, new growth little to none. 2 = vines medium sized, covering bed, fruit coverage weak, new growth little to some. 3 = vines medium to large, fruit coverage good, new growth good. 4 = vines large, fruit coverage excellent, new growth very good. 5 = Vines huge, fruit coverage excellent, new growth significant.z Normalized difference vegetation index (NDVI) measurements made with a handheld meter held over the bed (Trimble Greenseeker)
Fruit size distribution.o Many published studies have found that grafted plants produce a higher percentage of fruit in larger size
classes than those produced by the non-grafted scion varieties.
o Each of the graft combinations in the San Joaquin trials, with the exception of HM1794/BS01543756, produced more large-sized fruit compared to the corresponding non-grafted scion varieties.
o Unlike the San Joaquin trial, no consistent relationship was found between fruit size and grafting in the Merced trial.
Maturity.
o The maturity index (% of red fruit by weight) did not differ between the grafted and non-grafted plants in either county.
Plant vigor.
o In the San Joaquin trial, plant vigor was assessed using a subjective scale from 1 to 5 based on visual inspection of plant size and fruit coverage.
o In the absence of dramatic disease pressure in our trials, rootstocks Maxifort and DR0138TX produced slightly higher plant vigor than the non-grafted plants for all 4 scion varieties, while vigor ratings for rootstock BS01543756 were similar to or lower than the non-grafted scion plants.
o The hand-held NDVI meter measures how much of the crop row is occupied by foliage. NDVI values were consistently higher for the grafted plants than the non-grafted plants—indicating more robust plant growth in grafted plants.
o No consistent relationship was apparent between plant vigor and grafting status in the Merced trial.
Fruit quality.
o Some published studies provide measures of fruit quality, such as dissolved sugars, pH, total dissolved solids, vitamin C, lycopene (the primary red pigment), or even “taste-test” data.
o Those studies indicate that the quality of fruit from grafted plants seems to be slightly less good, though still quite acceptable, than fruit from the non-grafted scion variety plants.
o Our first year field trials focused on yields, and we did not measure any fruit quality data.
2.3.Additional trials will be conducted in same fields in 2017 and 2018
Field trial performance is always subject to the prevailing weather and field conditions, which make results variable from year-to-year. It is not clear why the dramatic differences existed in the performance of the grafted plants in the two counties in 2016. Therefore, it is important to demonstrate the consistency and reliability of results before making specific recommendations for implementation. We have funding to perform additional trials in 2017 and 2018. This guide will be updated to include new data after both the 2017 and 2018 trials.
3. Acknowledgements.
We would like to thank California Department of Food and Agriculture (SCBG 14027) and California Department of Pesticide Regulation (Pest Management Research Grant 16–PML–R004) for funding this research. The Department of Pesticide Regulation (DPR) provided partial funding for this project but does not necessarily agree with any opinions expressed, nor endorse any commercial product or trade name mentioned. We also thank our grower-cooperators (Live Oak Farms and Pacific Triple E), Growers Transplanting Inc., and the following companies that supplied the seeds: Seminis Vegetable Seeds, Gowan Seed Company, Harris Moran Seed Company, and Syngenta Vegetable Seeds.
4. References
Cantero-Navarro, E.; et al. (2016) Improving agronomic water use efficiency in tomato by rootstock-mediated hormonal regulation of leaf biomass. Plant Science 251: 90-100
Djidonou, D.; et al. (2013) Economic analysis of grafted tomato production in sandy soils in northern Florida. HortTechnology 23: 613-621
Miguel, A.; et al. (2011) Improving the affinity of tomato grafted on Solanum torvum using and intermediate rootstock. Acta Horticulturae 898: 291-296
Raymond, G. (2013) Grafting market developments. Rijk Zwaan USA, Salinas, CA, 26 pp. Available at: http://www.vegetablegrafting.org/wp/wp-content/uploads/2013/11/session-4-raymond-scri-vege-grftg-symp-nov13.pdf
Rivard, C.L.; et al. (2010) An economic analysis of two grafted tomato transplant production systems in the United States. HortTechnology 20: 795-803
Stoddard, C.S.; et al. (2007) Sample Costs to Produce Fresh Market Tomatoes, San Joaquin Valley, 2007. UCCE Publication TM-SJ-07