AGM Chairman’s Address 1 Ellerston Asian Investments Limited ACN 606 683 729 2017 Annual General Meeting Thursday, 19 October 2017 On behalf of the Board, I'd like to welcome all Ellerston Asian Investments (EAI) shareholders, invited guests and other visitors present to our second Annual General Meeting. As we have a quorum, I now declare the annual general meeting open. [Slide 2] Before we start may I ask members of the audience to please switch off their mobiles. To begin, let me introduce myself and the people with me on the floor. [Slide 4] My name is Ashok Jacob and I'm Chairman of Ellerston Asian Investments Limited. Our Board and Management here today include Sam Brougham, Stuart Robertson and Paul Dortkamp. Ellerston CEO, Brian O’Sullivan is also present together with EAI’s Portfolio Manager, Mary Manning. Also present today is our auditor for the 2017 financial year, Rohit Khanna from Ernst & Young. Rohit is available to take questions relevant to the conduct of the audit and the preparation and content of the Independent Audit Report. The Corporations Act requires that the Company make copies of relevant questions of the Company’s auditors received available. No written questions were received. Please direct any questions that you have of our auditor through me. Chairman’s Address [Slide 5] EAI listed in September 2015. Shortly after the listing, Asian markets fell sharply primarily due to concerns about China. The benchmark fell by approximately 10% between mid-September 2015 and mid-February 2016. Since then, Asian markets have performed very well, particularly in calendar year 2017. Asia remains the highest growth region in the world. China and India continue on their path to become two of the largest economies in the world. A new political era has dawned in China with more power concentrated in fewer hands but the system is becoming a lot less corrupt. China jitters have stabilized and the underlying economy is motoring along pretty well. The early stages of any dictatorship can be very good for equity markets and we definitely see signs of that. China currently has a very attractive risk-reward profile. If 10 years ago China was a no go market and 3 years ago a maybe, today it is a must have in any equity portfolio. India remains, in our view, the best long term market in Asia and possibly in the world. It has exceptional structural advantages such as favourable demographics, a large domestic market and low energy prices. Within the parameters of normal valuation cycles, it is an exceptional long term structural growth story. For personal use only
Transcript
AGM Chairman’s Address
1
Ellerston Asian
Investments Limited
ACN 606 683 729
2017 Annual General Meeting Thursday, 19 October 2017
On behalf of the Board, I'd like to welcome all Ellerston Asian Investments (EAI) shareholders, invited
guests and other visitors present to our second Annual General Meeting. As we have a quorum, I
now declare the annual general meeting open.
[Slide 2]
Before we start may I ask members of the audience to please switch off their mobiles.
To begin, let me introduce myself and the people with me on the floor.
[Slide 4]
My name is Ashok Jacob and I'm Chairman of Ellerston Asian Investments Limited. Our Board and
Management here today include Sam Brougham, Stuart Robertson and Paul Dortkamp. Ellerston
CEO, Brian O’Sullivan is also present together with EAI’s Portfolio Manager, Mary Manning.
Also present today is our auditor for the 2017 financial year, Rohit Khanna from Ernst & Young. Rohit is available to take questions relevant to the conduct of the audit and the preparation and
content of the Independent Audit Report. The Corporations Act requires that the Company make
copies of relevant questions of the Company’s auditors received available. No written questions were
received. Please direct any questions that you have of our auditor through me.
Chairman’s Address
[Slide 5]
EAI listed in September 2015. Shortly after the listing, Asian markets fell sharply primarily due to
concerns about China. The benchmark fell by approximately 10% between mid-September 2015 and
mid-February 2016. Since then, Asian markets have performed very well, particularly in calendar
year 2017.
Asia remains the highest growth region in the world. China and India continue on their path to become
two of the largest economies in the world.
A new political era has dawned in China with more power concentrated in fewer hands but the system
is becoming a lot less corrupt. China jitters have stabilized and the underlying economy is motoring
along pretty well.
The early stages of any dictatorship can be very good for equity markets and we definitely see signs
of that. China currently has a very attractive risk-reward profile.
If 10 years ago China was a no go market and 3 years ago a maybe, today it is a must have in any equity
portfolio.
India remains, in our view, the best long term market in Asia and possibly in the world. It has
exceptional structural advantages such as favourable demographics, a large domestic market and low
energy prices. Within the parameters of normal valuation cycles, it is an exceptional long term
structural growth story.
For
per
sona
l use
onl
y
AGM Chairman’s Address
2
Ellerston Asian
Investments Limited
ACN 606 683 729
Mary will elaborate on this and other Asian markets later.
Ellerston Capital as a house believes that the world is seeing a Global Synchronised Economic Recovery
for the first time since the GFC. We are currently enjoying the best economic growth environment
since prior to the financial crisis with modest inflation.
This environment will definitely be good for Asian markets as a whole as the underlying fundamentals,
growth profile and valuation are superior to those of developed markets. As a result of these factors,
Asian markets are significantly outperforming developed markets.
The MSCI Asia ex Japan Index (in AUD) is up 22.5% from inception to 30 September 2017 with over
18% of that performance occurring in calendar year 2017. Despite all the negative press about China
and Korea, the Hang Seng Index is up over 25% year to date and Korea’s KOSPI Index is up over 20%
year to date in 2017.
[Slide 6]
Buoyant market conditions have been good for Ellerston Asian Investments (EAI) as well. Our NTA
has increased 17% year to date, from $0.957 on December 31 2016 to $1.12 (as of October 13 2017)
and our stock price is up from $0.8663 to $1.00 in 2017 (as of October 17 2017).
There are a number of reasons for the outstanding performance of Asian markets:
Asian economies are posting strong growth and this is translating into earnings growth.
Average GDP growth in Asia is over 5%. This is more than twice as high as GDP growth in
Australia, the US and Europe.
Both monetary and fiscal policies remain accommodative across the region. We expect this
to continue in the medium term.
Asia is a post-GFC laggard. Between March 2009 and the beginning of 2017, MSCI World rose
over 100% (in AUD terms) while the MSCI Asia Ex Japan Index was up “only” 81%. Asia is now
catching up and both passive and active funds are flowing into the region.
Valuations remain attractive, particularly when incorporating growth metrics. Despite the
fact that earnings growth in Asia is much higher than in Australia, the PE of the Australian
market remains higher than for Asia (14x PE versus 16x PE). The Price to Book ratio for Asia is
1.7x versus almost 2.0x for the Australian market.
Stand out performance by Asian mega-cap tech stocks. Like in the US, the rally in some Asian
markets has been concentrated in a few key stocks. We like to refer to the STAT stocks
(Samsung, Tencent, Alibaba and TSMC) as the Asian version of FAANG. Over 35% of
benchmark gains year to date are from the STAT stocks.
Now we will turn to the results for the fiscal year ending 30 June 2017. [Slide 7]
For
per
sona
l use
onl
y
AGM Chairman’s Address
3
Ellerston Asian
Investments Limited
ACN 606 683 729
[Slide 8]
Item 1
Results for the year ended 30 June 2017
The first item of business is the results for the period to 30 June 2017. The Company recorded a pre-
tax profit of $13,118,456 and a net profit after income tax expense of $9,094,644.
As at 30 June 2017, the Company’s Net Tangible Assets had increased to $1.0540 (before all taxes),
from $0.9320 as at 30 June 2016.
From inception (15th September 2016) to the period ending 30 June 2017, the EAI portfolio returned
8.6% Net (before all taxes) versus our benchmark, the MSCI AC Asia Ex-Japan Index (AUD) which
returned 18.5%. When we analyse the returns in local currency, EAI has returned 22.2% for the same
period.
[Slide 9]
Narrowing the discount
In September of 2016, EAI announced a share buyback of up to 10% of issued ordinary shares. As of
June 30, 2017 EAI had bought back 8.3 million shares. From the day prior to the buy back
announcement, until 17 October 2017, the discount has closed from approximately 19% to 10.7%. The
buyback has been accretive to shareholders and has had no impact on scale as our earnings for the
period were $9.1 million, while we spent $7.3 million buying back the shares. Ellerston’s interests are
aligned with our shareholders as a significant number of shares are held by key management
personnel of the Company.
We are committed to reducing the discount further and to achieve this, have taken 3 concrete steps:
1. The Board has passed a resolution to be able to buy back up to 10% of total shares outstanding over the next 12 months. Note, this is not simply an extension of the existing buyback that expired on September 26, 2017 but a resolution to buy back new shares in the coming 12 months.
2. EAI did not declare a dividend for the Fiscal Year Ending June 2017 due to the lack of available franking credits. However, we have subsequently transferred $2.2 million to a dividend profit reserve which equates to approximately 2 cents per share. EAI aims to deliver a regular stream of dividends as the company matures.
3. From October 31 to November 2 2017, EAI is embarking on a roadshow in Brisbane, Melbourne and Sydney to meet with investors and provide a detailed update of the portfolio and the outlook for Asia 2018.
As part of the initial capital raising, investors were also issued options under the general and priority
offer.
Under the general offer, investors were issued one loyalty option for every two shares issued. Under
the priority offer, investors were issued two options for every three shares issued.
For
per
sona
l use
onl
y
AGM Chairman’s Address
4
Ellerston Asian
Investments Limited
ACN 606 683 729
We are pleased that of the 68.9m options issued under the prospectus, 65.1 million vested in February
2016. The options can be exercised into ordinary shares at the exercise price of $1.00 up until the 28th
February, 2019. The options were trading at $0.03 as at 30 June 2017.
[Slide 12] Resolutions We will now turn to the formal business of the meeting.
The Notice of Meeting was posted to shareholders and copies are available from the registration desk.
I propose that the Notice of Meeting be taken as read. Is there anyone who objects to this?
Thank you
The proxy and voting procedures for this meeting are as follows: A show of hands will be taken for
the three resolutions proposed.
When shareholders vote can they please raise their green card. If you hold an orange card you have
already voted or are a joint holder. If there are any shareholders who are eligible to vote at the
meeting and who have not received their green voting card, please see a representative from Link
Market Services at the registration desk. If you hold a pink card you are a visitor and not eligible to
vote or speak at the meeting.
Following discussion on each item, the proxy results will be displayed on the screen behind me.
I would also like to highlight that Ellerston Asian Investments directors and executives identified as
key management personnel will not be voting undirected proxy votes given to them for item 1, the
Remuneration Report.
On all other items of business, where undirected proxies have been given in favour of the Chairman, I
will be voting those proxies in favour of all items. I have been informed by my fellow directors and
the company secretary that they will also vote any undirected proxies given to them in the same
manner with the exception of item 1, the Remuneration Report.
When it comes to asking questions, would speakers from the floor please make themselves known to
Nina and a microphone will be made available to you.
Please note that only persons holding green or orange admission cards are entitled to ask questions
at this meeting. Visitors holding a pink card are not eligible to vote or speak, but are welcome to
listen.
We will now move onto the items of business for this meeting as set out in the Notice of Meeting.
For
per
sona
l use
onl
y
AGM Chairman’s Address
5
Ellerston Asian
Investments Limited
ACN 606 683 729
Item 2 RESOLUTION 1 - REMUNERATION REPORT
The Corporations Act requires that a resolution that the remuneration report be adopted must be put
to the vote at the Company’s annual general meeting. The vote on this resolution is advisory only and
does not bind the directors of the Company. The Remuneration Report to shareholders is contained
on pages [13 to 15] of the 2017 Annual Report.
This item gives you the opportunity to ask questions about or make comment on EAI’s remuneration
policies.
Is there any discussion on this item?
On the screen behind me are the details of the total valid proxies for this item. [Slide 13]
All those in favour, please raise your green voting cards.
All those against, please raise your green voting cards.
The Resolution has carried.
Item 3 RESOLUTION 2 - ELECTION OF DIRECTOR The next item of business to consider and if thought fit to pass the following resolution
”That Paul Dortkamp, who retires as a Director pursuant to the requirement in ASX Listing Rule 14.5
and section 63 of the Company’s Constitution and being eligible be elected as a Non-executive
Director”.
The Board (with Mr Dortkamp abstaining in respect of this resolution) recommends the election of Mr
Dortkamp.
Is there any discussion on this item?
On the screen behind me are the details of the total valid proxies for this item. [Slide 14]
All those in favour, please raise your green voting cards.
All those against, please raise your green voting cards.
The Resolution has carried.
[Slide 15]
I will now hand over to the Portfolio Manager, Mary Manning.
For
per
sona
l use
onl
y
AGM Chairman’s Address
6
Ellerston Asian
Investments Limited
ACN 606 683 729
[Slide 16]
Market Outlook
Asia remains the highest growth region in the world and we continue to find high quality, high growth, large cap stocks in which to invest. China and India are the largest economies in Asia and they are growing at almost 7%. Other smaller Asian economies like the Philippines (6.5% GDP growth) and Indonesia (5.2% growth) get less attention than China and India, but they are also high growth economics with significant macroeconomic and demographic tailwinds. Despite strong performance year to date, we remain constructive on the outlook for Asian markets going forward. We are monitoring the following situations closely:
China: October 18 marked the start of the 19th Party Congress in China. It is widely agreed that
President Xi will use this twice a decade event to cement his already strong control over the
Party and the Standing Committee. Following the Party Congress we expect a continued focus
on structural reform and are confident that policy makers can continue to strike a balance
between stable growth and deleveraging. The upcoming inclusion of Chinese A shares into
MSCI Indicies in May of 2018 will also be an important catalyst for the Chinese market.
India: Prime Minster Modi continues to enjoy high popularity despite implementing
beneficial, but short term disruptive, policies like the GST and demonetization. Indian
elections are coming up in 2019 and we are confident that voters will return Modi to power.
In the run up to the election we are expecting pro-voter policies including a push to increase
rural incomes and a focus on infrastructure and affordable housing. We continue to find high
growth and attractively valued stock picks in the Indian market.
North Korea: The situation on the Korean Peninsula is obviously very critical to Asian markets.
Our base case is that the situation continues to be characterized by escalating brinkmanship
but no attack. The EAI team has travelled to Korea twice this year and there seems to be much
more concern from foreigners than from locals. Year to date in 2017 the Korean market is up
over 20% and Samsung, the largest company in Korea, is at an all-time high. That said, we have
protected the portfolio from a worst case scenario by being underweight Korea and by using
an option strategy to hedge the KOPSI and other Asian markets.
Technology: Technology is the largest sector weighting in EAI’s portfolio and we think Asia is
the best way to play tech globally. Approximately 21% of EAI’s portfolio is in the Asian mega-
cap tech stocks and we have invested in a number of companies that are part of the global
technology supply chain. We are also excited about disruptive technologies in Asia such as
robotics, Artificial Intelligence and Virtual Reality and hold a number of stocks that are plays
on each of these sub-thematics.
US Interest Rates, Tax Reform and Trade: The trajectory for US interest rates and the
dismantling of years of Quantitative Easing (QE) has implications for all markets, including
Asia. Specifically, we hold a number of financial stocks (banks and insurance) that are
beneficiaries of higher interest rates in the US. In addition, higher US rates have implications
for Asian currencies and the cross rate between USD pegged or linked currencies in Asia (HKD,
For
per
sona
l use
onl
y
AGM Chairman’s Address
7
Ellerston Asian
Investments Limited
ACN 606 683 729
RMB) and the Australian dollar (AUD). On tax reform, during November 2016 to February 2017
tax reform fever led to a significant sector shift into cyclicals and we are mindful that this could
happen again. On trade, we are closely watching the NAFTA renegotiations as it hold
implications for the long term trade relationship between the US and China.
Portfolio Comment
Since listing we have maintained a deliberate and measured approach with regards to the construction
of the portfolio. The average EPS growth of the portfolio is 18% versus the ASX 200 which is growing
at approximately 4%. The PEG ratio remains less than 1x which implies the price EAI is paying for Asian
growth is significantly less than in other markets.
EAI is focused on large cap stocks and the portfolio has an average market cap of over $90 billion.
There are 50 stocks in the portfolio. Note that earlier in 2017 we increased the maximum number of
stocks from 40 to 50 due to increases in the number of stocks in the benchmark and to reflect the
upcoming inclusion of China A shares into the MSCI Asia ex Japan Index.
EAI’s geographic positioning remains consistent: we are overweight India and underweight Korea. We
have no investments in countries where we can’t find stocks that meet our strict investment criteria
(Malaysia, Pakistan). From a sector perspective, we remain primarily invested in 3 core sectors,
technology, financials and consumer, but the portfolio is more diversified that in the past. This is
because a resurgent reflation trade may cause sector rotation into cyclicals and more value oriented
sectors.
On currency, the portfolio is hedged as per the benchmark for all currencies with a weight of greater
than 10%. Cash is approximately 5%.
[Slide 20]
Q&A
This now concludes the business section of the AGM and we now call for general questions from the
audience.
Following question time, the AGM will be formally announced as closed. The Ellerston Global
Investments AGM immediately follows this AGM and we invite you to attend. Following the Ellerston
Global Investments AGM, we welcome you to join the Board for tea and coffee.
For
per
sona
l use
onl
y
Ellerston Asian Investments
October 2017
Ellerston Asian InvestmentsANNUAL GENERAL MEETING
For
per
sona
l use
onl
y
2
ANNUAL GENERAL MEETING OCTOBER 2017
AGM Agenda
1. Chairman's Welcome & Address
2. Results
3. Resolutions
4. Portfolio Overview and Market Outlook
For
per
sona
l use
onl
y
1. Welcome & Chairman’s Address
For
per
sona
l use
onl
y
4
INTRODUCTION
Board
Name Position Independence Prior experience
Ashok JacobChairman & Non-Executive Director
Not IndependentConsolidated Press Holding Ltd , Thorney Holdings. Current directorships include MRF Ltd, Thorney Opportunities Ltd and EGI.
Sam Brougham Non-Executive DirectorIndependent Ceres Capital, Structured Asset Management,
JBWere and Price Waterhouse
Paul DortkampNon-Executive Director Independent Rivergum investors, First State Fund Managers
Ltd ( now CFS Investments) and the RBA
Stuart Robertson Non-Executive DirectorIndependent
BT Funds Management and Zurich Australia.
Name Position Prior experience
Mary Manning Portfolio Manager Oaktree Capital, Soros Fund Management and Citigroup
Brian O’SullivanChief Executive Officer Ellerston Capital Limited
Zurich Australia and BT Funds Management.
Personnel
For
per
sona
l use
onl
y
5
CHAIRMAN’S REMARKS
The MSCI Asia ex Japan Index is up 18.6% YTD as at 30 September in 2017. Drivers of this strong performance include:
• High growth. Average GDP growth in Asia is twice as high as in developed markets.
• Monetary and fiscal policies remain accommodative.
• Asia is a post-GFC laggard and is now catching up.
• Valuations remain attractive.
• Stand out performance by Asian mega cap tech stocks.
2.2%
2.3%
5.9%
6.8%
6.7%
USA
Australia
Asia ex Japan
India
China
2017E GDP Growth
Asian Markets are Performing Well in 2017
18%
81%
5%
108%
2017 YTD
2009 to 2017
MSCI Asia ex J vs MSCI World Since the GFC*
MSCI World (AUD) MSCI Asia Ex Japan (AUD)* Returns are in AUD terms. Post GFC period is March 1, 2009 to Dec 31, 2016. 2017 YTD is until Oct 11, 2017 .
For
per
sona
l use
onl
y
6
CHAIRMAN’S REMARKS
• The NTA is up 17% in 2017, from $0.9573 at 31 December 2016 to $1.12 as of Friday October 13, 2017.
• Due to the combination of a higher NTA and a lower discount, EAI’s stock price is up 22% from $0.8202 the day prior to the buy back announcement to $1.00.
• The buy back has been accretive for EAI shareholders and has not reduced the scale of EAI. Our interests are aligned with shareholders.
• In Sept 2016 we announced a 10% share buy back.
• Since initiation of the buy back the discount has closed from 19% to approximately 10.7%.
* LIC Universe includes 43 ASX listed LICs, 11 international strategy LICs and 32 Australian or specialist strategy LICs. Time frame for this chart is Sept 12, 2016 to Oct 11. 2017.
$0.80
$0.82
$0.84
$0.86
$0.88
$0.90
$0.92
$0.94
$0.96
$0.98
$1.00
Sep2016
Oct2016
Nov2016
Dec2016
Jan2017
Feb2017
Mar2017
Apr2017
May2017
Jun2017
Jul2017
Aug2017
Sep2017
Oct2017
3%
10%
17%
All LICs Average
International LICsAverage
EAI
EAI Stock Price Performance vs LIC Universe Since Buy Back Announcement*
For
per
sona
l use
onl
y
2. Results
For
per
sona
l use
onl
y
8
FINANCIAL RESULTS
Financial Results for the year ended 30 June 2017
30 June 2017
Pre Tax Profit $13,118,456
After Tax profit $9,094,644
Earnings per share (a) 7.77
Final dividend per share Nil
Dividend profit reserve $2.2m
Pre Tax Net tangible assets $117,629,969
Pre Tax Net tangible asset backing per share $1.0540
(a) EPS on an undiluted basis
For
per
sona
l use
onl
y
9
SHARE BUY BACK & DIVIDEND
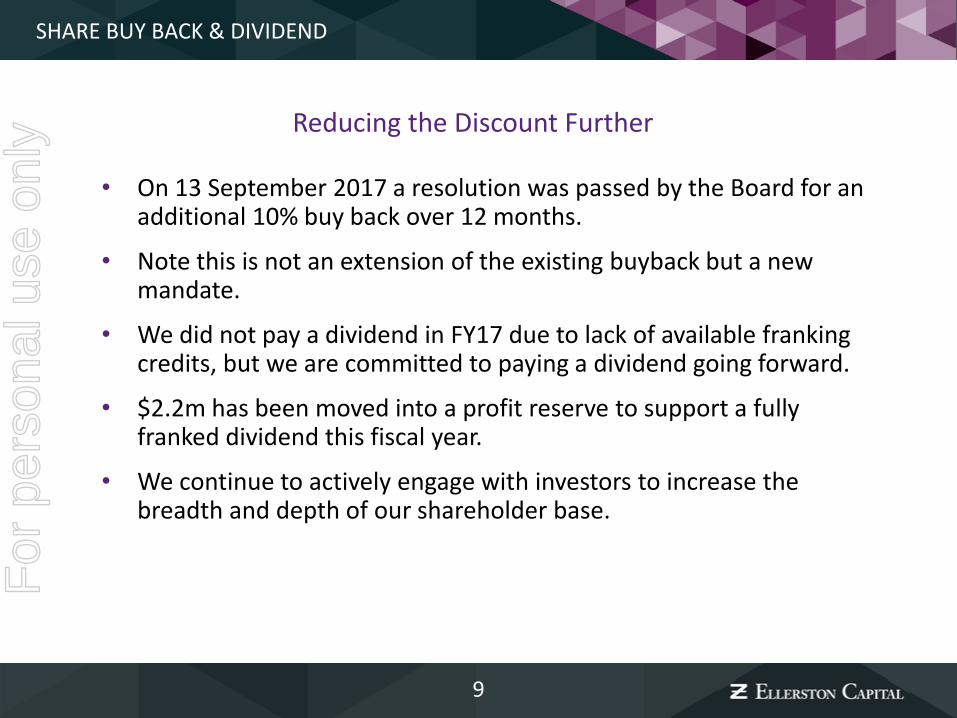
• On 13 September 2017 a resolution was passed by the Board for an additional 10% buy back over 12 months.
• Note this is not an extension of the existing buyback but a new mandate.
• We did not pay a dividend in FY17 due to lack of available franking credits, but we are committed to paying a dividend going forward.
• $2.2m has been moved into a profit reserve to support a fully franked dividend this fiscal year.
• We continue to actively engage with investors to increase the breadth and depth of our shareholder base.
Reducing the Discount Further
For
per
sona
l use
onl
y
10
CURRENCY IMPACTS
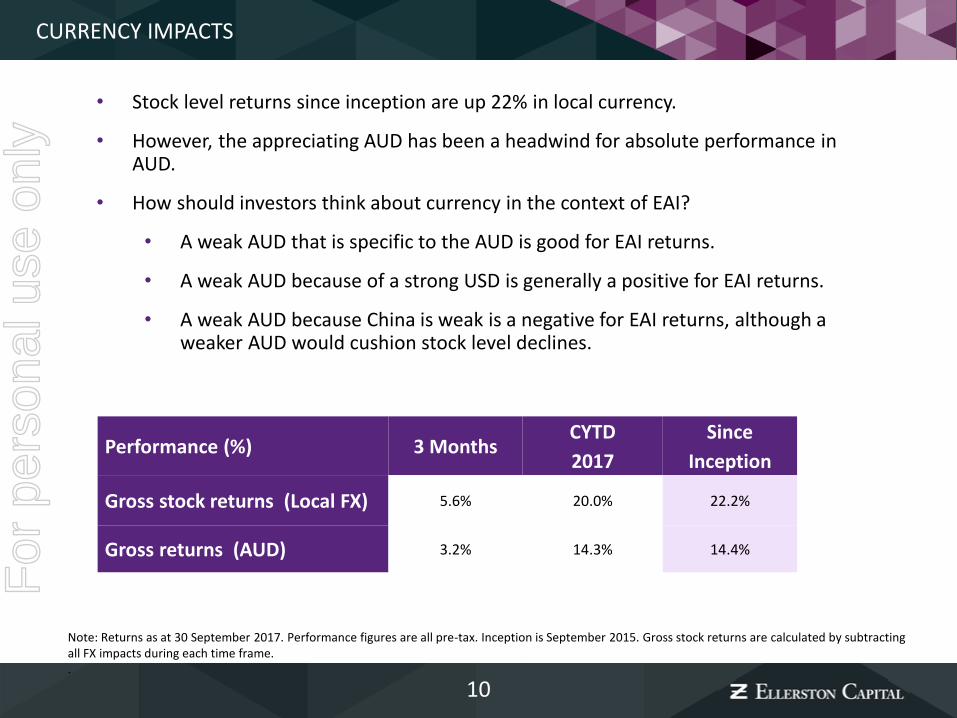
Note: Returns as at 30 September 2017. Performance figures are all pre-tax. Inception is September 2015. Gross stock returns are calculated by subtracting all FX impacts during each time frame. .
Performance (%) 3 MonthsCYTD
2017
Since
Inception
Gross stock returns (Local FX) 5.6% 20.0% 22.2%
Gross returns (AUD) 3.2% 14.3% 14.4%
• Stock level returns since inception are up 22% in local currency.
• However, the appreciating AUD has been a headwind for absolute performance in AUD.
• How should investors think about currency in the context of EAI?
• A weak AUD that is specific to the AUD is good for EAI returns.
• A weak AUD because of a strong USD is generally a positive for EAI returns.
• A weak AUD because China is weak is a negative for EAI returns, although a weaker AUD would cushion stock level declines.
For
per
sona
l use
onl
y
11
EAI PERFORMANCE
Note: Data as at 30 September 2017. Performance figures are all pre-tax. Net performance since Sept 2016 also includes the effect of the buy back. Inception is September 2015.
Performance %3 Months 6 Months
CYTD
2017
FY
2017
Since
Inception
Gross returns 3.2% 9.6% 14.3% 14.5% 14.4%
Net returns 2.9% 8.9% 13.3% 13.1% 11.7%
MSCI AC Asia Ex Japan
(AUD)3.3% 10.4% 18.6% 20.5% 22.5%
For
per
sona
l use
onl
y
3. Resolutions
For
per
sona
l use
onl
y
13
ANNUAL GENERAL MEETING OCTOBER 2017
Resolution 1 – Remuneration Report
“To adopt the Remuneration Report of the Company
for the year ended 30 June 2017.”
Proxy Voting Results - Resolution 1
NUMBER PERCENTAGE
FOR16,192,691 96.79%
AGAINST196,000 1.17%
OPEN341,200 2.04%F
or p
erso
nal u
se o
nly
14
ANNUAL GENERAL MEETING OCTOBER 2017
Resolution 2 – Election of Director
“That Paul Dortkamp, who retires as a Director pursuant to the requirement in ASX Listing Rule 14.5 and section 63 of the Company’s Constitution and being eligible be elected as a Non-executive Director”.
Proxy Voting Results - Resolution 2
NUMBER PERCENTAGE
FOR16,344,691 97.67%
AGAINST15,000 0.09%
OPEN375,200 2.24%F
or p
erso
nal u
se o
nly
4. Portfolio Overview and Market Outlook
For
per
sona
l use
onl
y
16
High Growth
• Asia is a high growth region and remains attractively valued.
• The EAI portfolio has average EPS growth of 18% and a PEG ratio of <1x.
Large Cap
• Large cap stocks offer the best risk reward in Asia.
• The average market cap of the EAI portfolio is over $90 billion and the average of the top 10 holdings is over $130 billion.
Concentrated
• Only 50 stocks.
Diversified
• We are invested in 9 different Asian countries.
• Technology, a sector with very little representation domestically, is the largest sector weight in EAI.
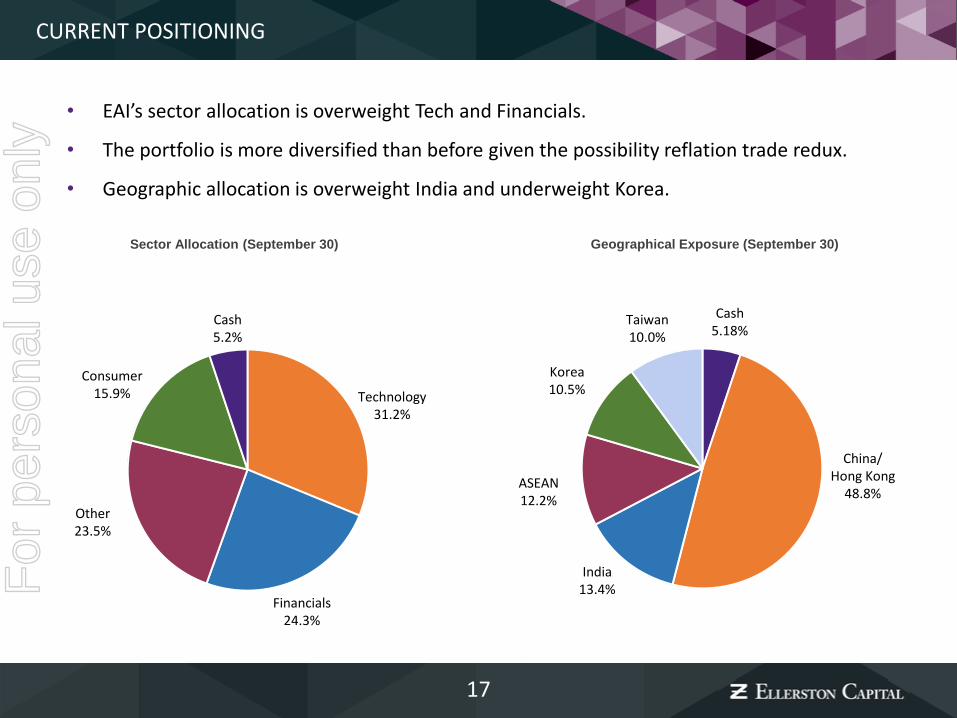
• EAI’s sector allocation is overweight Tech and Financials.
• The portfolio is more diversified than before given the possibility reflation trade redux.
• Geographic allocation is overweight India and underweight Korea.
Technology31.2%
Cash5.2%
Financials24.3%
Other23.5%
Consumer15.9%
Korea 10.5%
Taiwan 10.0%
Cash5.18%
ASEAN 12.2%
India 13.4%
China/Hong Kong
48.8%
For
per
sona
l use
onl
y
18
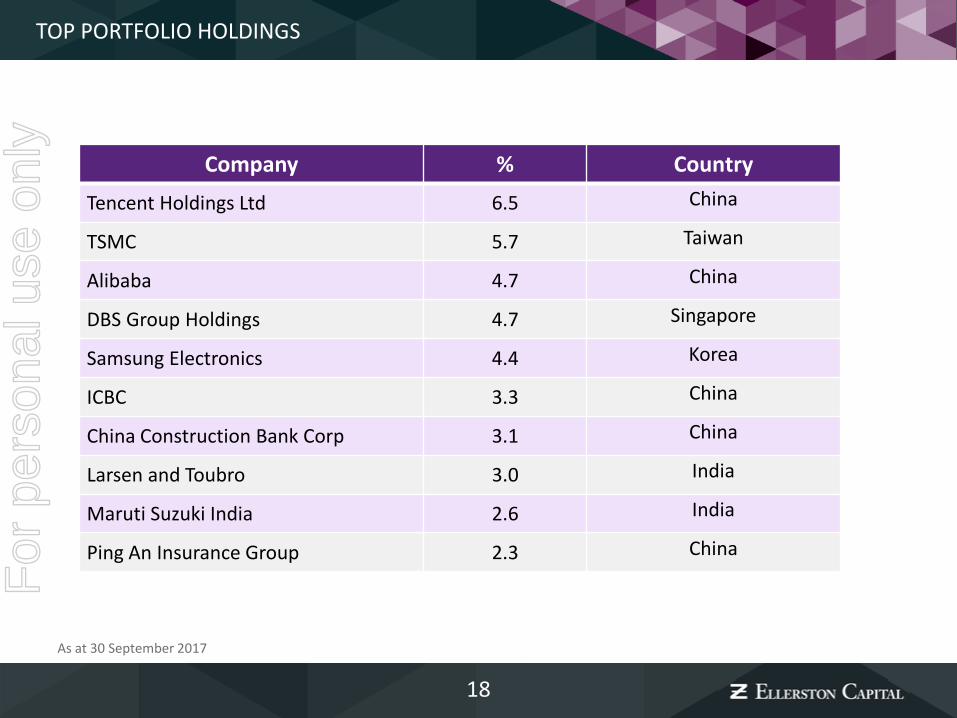
TOP PORTFOLIO HOLDINGS
As at 30 September 2017
Company % Country
Tencent Holdings Ltd 6.5 China
TSMC 5.7 Taiwan
Alibaba 4.7 China
DBS Group Holdings 4.7 Singapore
Samsung Electronics 4.4 Korea
ICBC 3.3 China
China Construction Bank Corp 3.1 China
Larsen and Toubro 3.0 India
Maruti Suzuki India 2.6 India
Ping An Insurance Group 2.3 China
For
per
sona
l use
onl
y
19
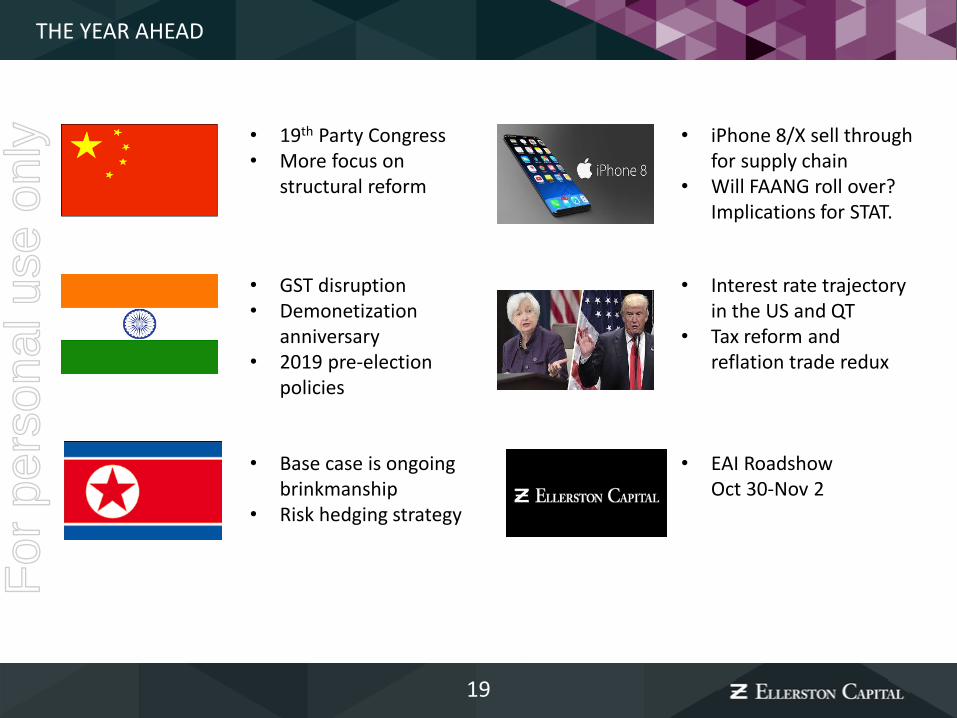
THE YEAR AHEAD
• 19th Party Congress• More focus on
structural reform
• iPhone 8/X sell through for supply chain
• Will FAANG roll over? Implications for STAT.
• GST disruption• Demonetization
anniversary• 2019 pre-election
policies
• Interest rate trajectory in the US and QT
• Tax reform and reflation trade redux
• Base case is ongoing brinkmanship
• Risk hedging strategy
• EAI RoadshowOct 30-Nov 2
For
per
sona
l use
onl
y
Any Questions?
For
per
sona
l use
onl
y
21
DISCLAIMER
This presentation is issued by Ellerston Asian Investments Limited (ACN 606 683 729) (Company or Ellerston Asian Investments), and Ellerston CapitalLimited (ACN 110 397 674) (Manager or Ellerston Capital). The Company and the Manager have made every effort to ensure that the information inthis presentation is accurate. However, its accuracy, reliability or completeness cannot be assured. To the maximum extent permitted by law, neitherthe Company nor the Manager accepts any liability for any error or omission or for any loss or damage suffered as a result of others acting on the basisof the information contained in this presentation. Copyright in this document is owned by the Company and the Manager. Its contents may not becopied, reproduced or embodied in any other document or distributed to a third party without the prior written consent of the Company and theManager.This presentation does not constitute an offer of interests in the Company. You should not rely on this presentation if or when deciding whether or notto make an investment in the Company. This document must not be circulated and is confidential in nature. By accepting this document you areagreeing to comply with such confidentiality requirements.
This presentation has been prepared without taking into account any investor's objectives, financial situation or needs. An investment in the Companycarries potential risks and fees which are described in the relevant documentation. An investor should, before deciding whether to invest in theCompany and consider the appropriateness of it, having regard to the legal documentation (which can be obtained by contacting the Joint LeadManagers or Link Market Services) in its entirety and the investor's objectives, financial situation and needs. This presentation is for generalinformational purposes only and is not intended to be a definitive statement on the subject matter.
Neither the Company, the Manager nor any other person guarantees the investment performance, earnings or return of capital invested in theCompany. The information provided in this document is current only as at the date indicated on this document and is subject to change withoutnotice. This document is not necessarily exhaustive of the relevant subject matter. This material has been prepared based on information believed tobe accurate at the time of publication, including actual and estimated returns. Past performance of the Manager is not indicative of futureperformance. Assumptions and estimates may have been made which may prove not to be accurate. The Company undertakes no responsibility tocorrect any such inaccuracy. Subsequent changes in circumstances may occur at any time and may impact the accuracy of the information. To thefullest extent permitted by law, none of the Company, the Manager or any member of the Ellerston Capital Group of companies makes any warranty asto the accuracy or completeness of the information in this document and disclaims all liability that may arise due to any information contained in thisdocument being inaccurate, unreliable or incomplete.
This presentation is not available to persons for which it would be a contravention of a law to provide or offer interests in the Company. By attendingthis presentation, or reading this document, you are representing that you are not such a person.F