33
AgN-GLEE Landscape Analysis Lidan Du, PhD June 18, 2013 Washington DC

AgN-GLEE Landscape Analysis
Lidan Du, PhD June 18, 2013
Washington DC

Background of Landscape Analysis
• Part of Agriculture-Nutrition Global Learning and
Evidence Exchange (AgN-GLEE)
• Task: to review USAID-supported FTF programs and
map current interventions and pathways linking
agriculture and nutrition
• This presentation:
– Methodology
– Findings from Phase one and two
– Thoughts for discussion
2

Methods
• Desk review of FTF multi-year strategy and project
documents
• Key informant interviews with FTF Points of Contact
• Tools for data collection, extraction and analysis
• Pathways and Principles
• Not an evaluation
3

Timeline
Technical consultations Aug 21 , Sep 6
Document Collection Sep 5
LA team formed Sep 17
12 African Country profiles Dec 3 – Dec 4
3 LAC Country profiles Feb 28
4 Asia Country profiles March 10
5 case studies May-June
1 final report soon (under review)
4

Data Collection
Countries No. documents consulted No. people interviewed
AFRICA 98 23
LAC 23 7
Asia 42 5
TOTAL 163 35
5

Countries To be awarded <1yr implementation >1yr implementation
Bangladesh X X
Cambodia X
Nepal X X
Tajikistan X
Guatemala X
Haiti X X
Honduras X X
Ethiopia X X
Ghana X X
Kenya X X
Liberia X
Malawi X X
Mali X X
Mozambique X X
Rwanda X
Senegal X
Tanzania X
Uganda X X X
Zambia X X
Status of Key FTF Ag-Nutr Projects As of January
and April

Countries Flagship Co-location Retro-fitting
Bangladesh X
Cambodia X
Nepal X
Tajikistan X X
Guatemala X
Haiti X (X) X
Honduras X
Ethiopia X X
Ghana X (X)
Kenya X X X
Liberia X X
Malawi X
Mali (X)
Mozambique X X
Rwanda X
Senegal X X
Tanzania X
Uganda X X
Zambia X
Program approach

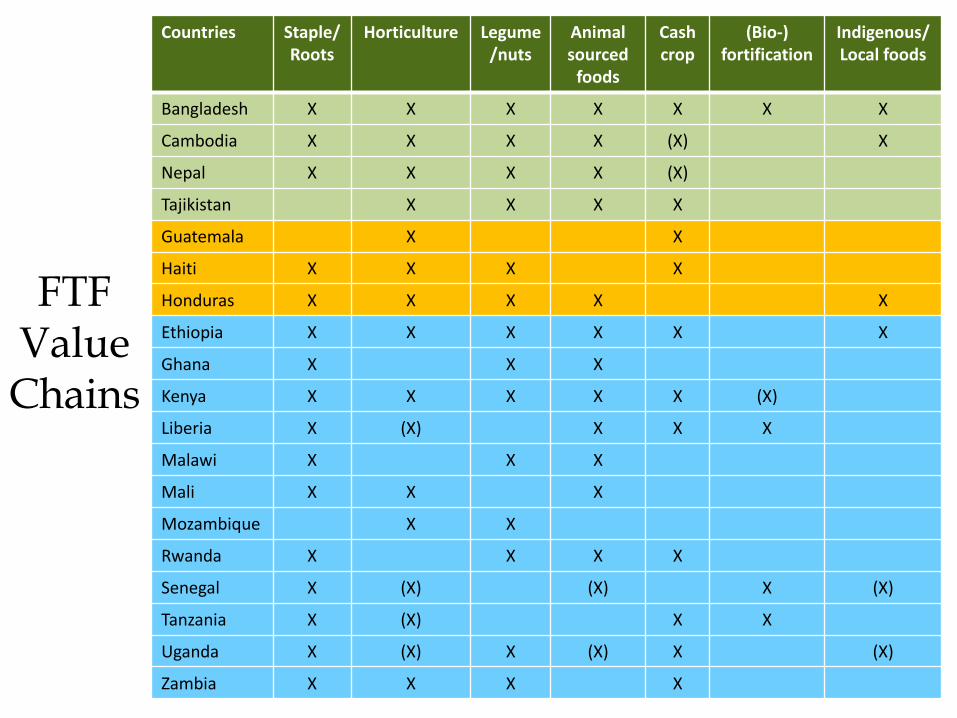
Countries Staple/ Roots
Horticulture Legume /nuts
Animal sourced
foods
Cash crop
(Bio-) fortification
Indigenous/ Local foods
Bangladesh X X X X X X X
Cambodia X X X X (X) X
Nepal X X X X (X)
Tajikistan X X X X
Guatemala X X
Haiti X X X X
Honduras X X X X X
Ethiopia X X X X X X
Ghana X X X
Kenya X X X X X (X)
Liberia X (X) X X X
Malawi X X X
Mali X X X
Mozambique X X
Rwanda X X X X
Senegal X (X) (X) X (X)
Tanzania X (X) X X
Uganda X (X) X (X) X (X)
Zambia X X X X
FTF Value Chains

FTF Value Chains
10
0
2
4
6
8
10
12
14
16
Staple /Roots
Horticulture Legume /Nuts
AnimalSource
Cash Crop (Bio-)Fortification
Indigenous /Local

Countries Nutrition impact
Income Potential
Gender Gov’t/ donor
Food security
Number of farmers
Bangladesh X X X X X X
Cambodia X X X
Nepal X X X X
Tajikistan X X X X
Guatemala X X X X
Haiti X X X
Honduras X X X X X
Ethiopia X X X
Ghana X X X X
Kenya (X) X X
Liberia X X X X
Malawi X X X
Mali X (X) X X
Mozambique X X X X
Rwanda (X) X (X) X X
Senegal (X) X X X
Tanzania (X) X X X X
Uganda X X X X X
Zambia X X X
Factors in FTF Value Chain
Selection
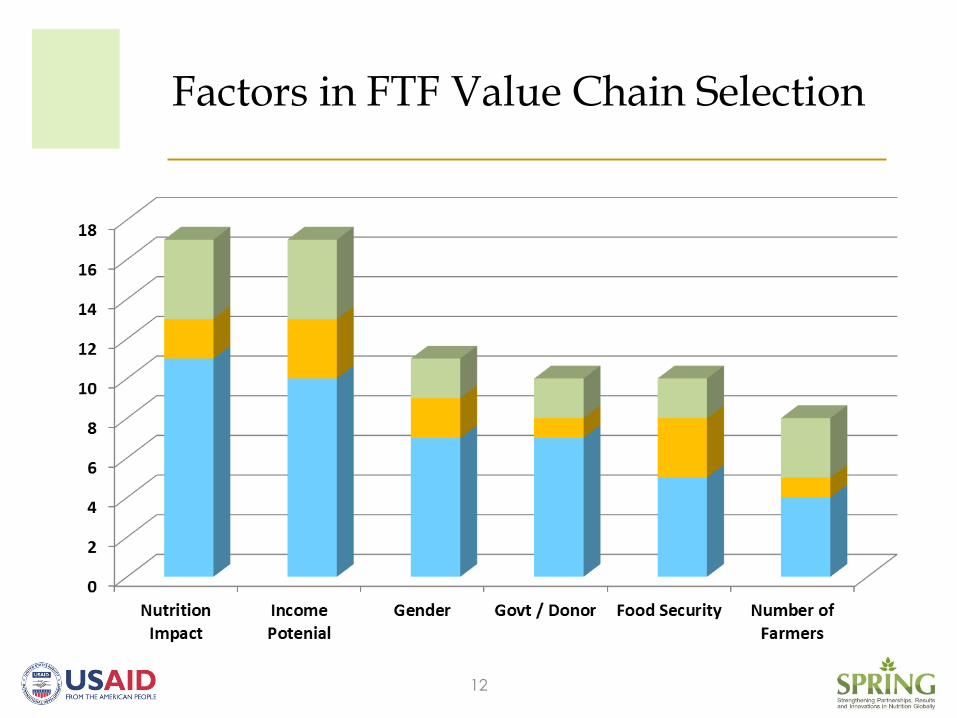
Factors in FTF Value Chain Selection
12
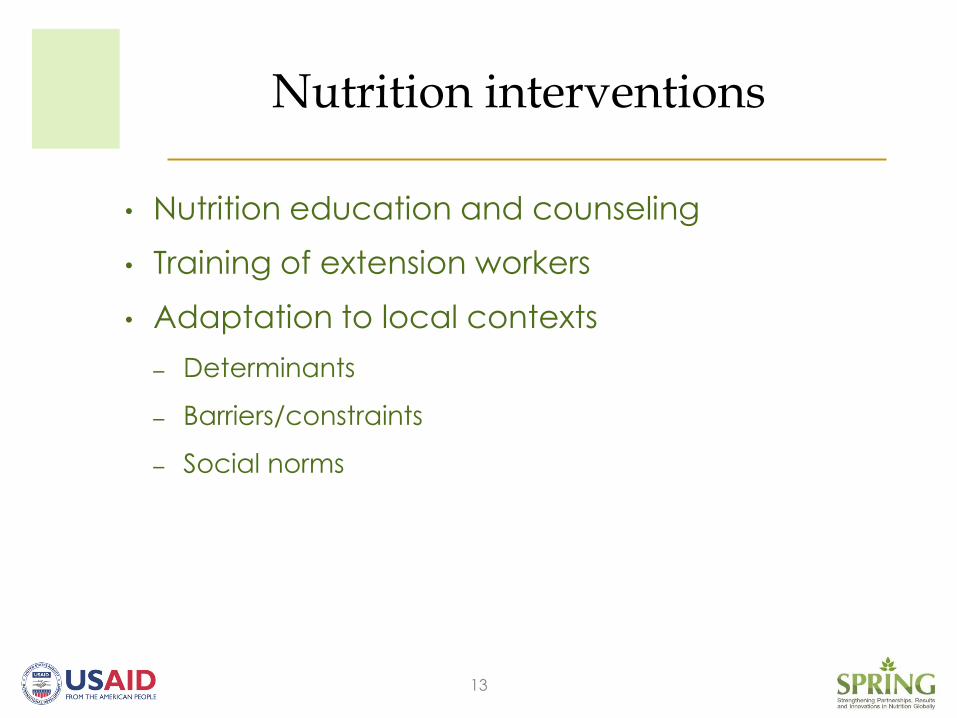
Nutrition interventions
13
• Nutrition education and counseling
• Training of extension workers
• Adaptation to local contexts
– Determinants
– Barriers/constraints
– Social norms

Agriculture-Nutrition Pathways
• Own production food consumption
• Income food purchase
• Income healthcare purchase
• Food prices food purchase
• Women’s time use care capacity
• Women’s workload maternal energy use
• Women’s control of income resource allocation
Ref: Stuart Gillespie, Jody Harris, and Suneetha Kadiyala, The Agriculture-Nutrition
Disconnect in India, What Do We Know? IFPRI Discussion Paper 01187, June 2012
14

Countries Production-consumption
Income -food
Income -health
Price -food
Women’s time
Women’s workload
Women’s income
Bangladesh X X X X
Cambodia X X X
Nepal X X X X X
Tajikistan X X X
Guatemala X X X X X
Haiti X X X X
Honduras X X (X) X X X
Ethiopia X X X X X X
Ghana X X (X)
Kenya X X X X
Liberia X X X (X)
Malawi X (X) (X)
Mali X (X)
Mozambique X (X) (X)
Rwanda X X (X)
Senegal X X (X)
Tanzania X X (X)
Uganda X (X) X X X X
Zambia X X
Explicit/ Implicit
Pathways

16
Explicit/Implicit Pathways
0
2
4
6
8
10
12
14
16
18
20
Production -Consumption
Income -Food
purchase
Income -Health
purchase
Food price -Food
purchase
Women'sTime
Women'sWorkload
Women'sIncome
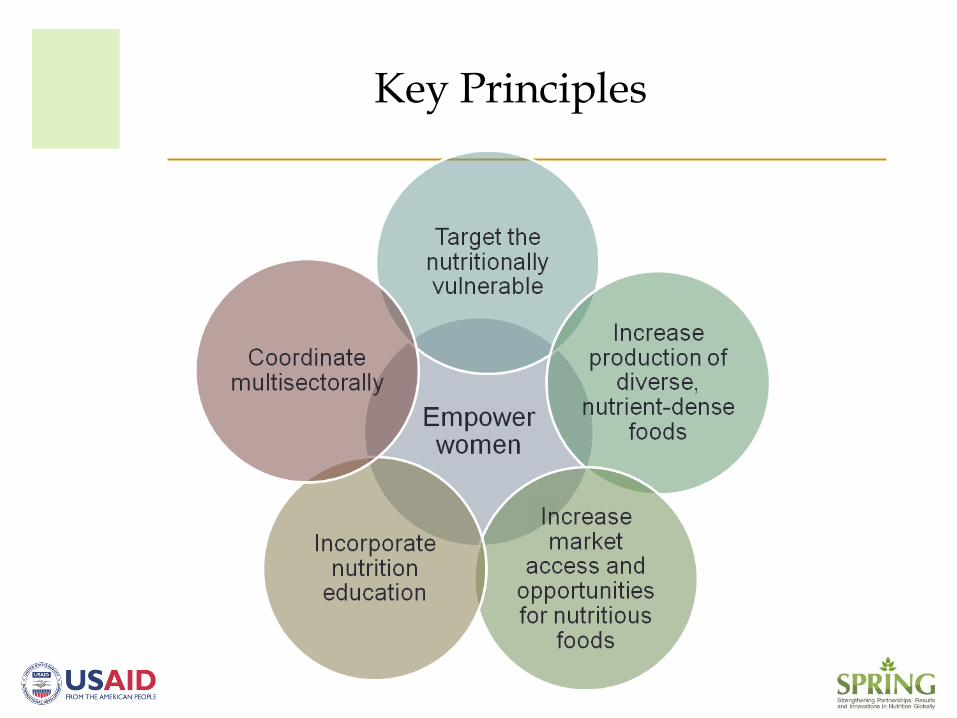
Key Principles

Observations
18
• Empowering women
• Targeting the nutritionally
vulnerable
• Value chain selection
• Market access
• Multi-Sectoral Coordination
• Nutrition education – SBCC

Preparation
Intra-household allocation and consumption
19
Behavior Change in FTF
NE/SBCC
Storage/ processing
Production
Nutrition
Market
Income
Purchase/ demand
Utilization

Additional Observations
20
• Capacities
• staff, time, skills, data, information
• Funding
• Complex situation
Considerations
• Design and Modify Project Activities Based on
Continuous Context Assessments
• Target SBCC Activities along All Agriculture-
Nutrition Pathways
• Empower Women by Building Supportive Family
and Social Environment
• Focus on Opportunities for Nutrition throughout the
Value Chains
• Document Incremental Results to Build Evidence
Base
21
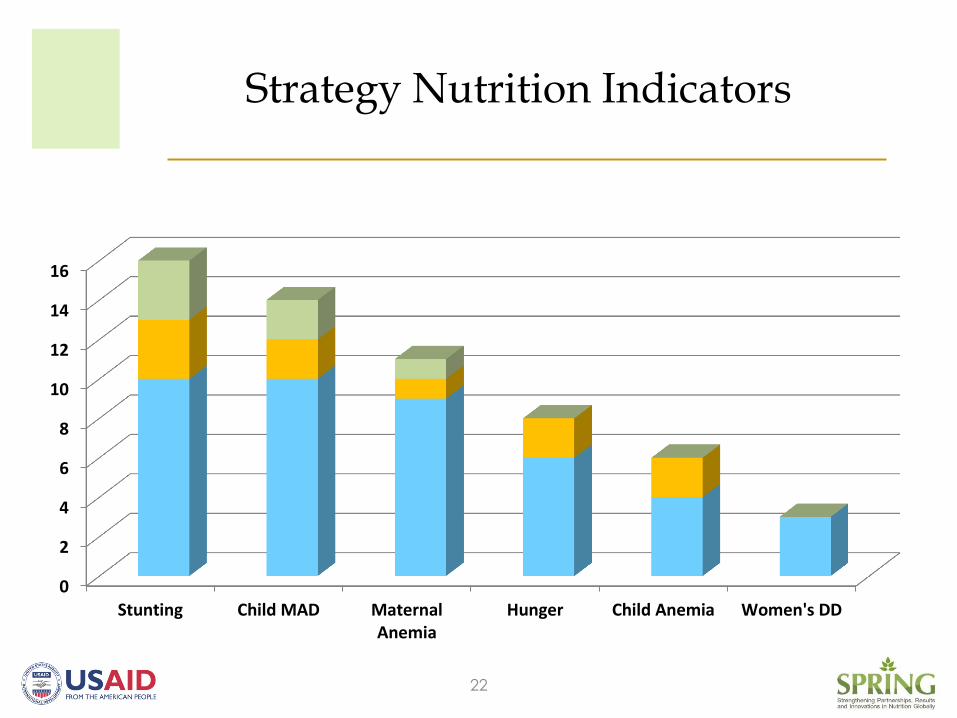
Strategy Nutrition Indicators
22
0
2
4
6
8
10
12
14
16
Stunting Child MAD MaternalAnemia
Hunger Child Anemia Women's DD

FTF Nutrition Indicators: Benefits of Integration
Feed the Future Indicator Handbook: Definition Sheets Updated April 4, 2012
Agriculture (3)
% of households with moderate or severe hunger *
Women’s dietary diversity *
% of national budget allocated to nutrition
Nutrition (5)
% of exclusive breastfeeding of children under 6 mo *
No. of health facilities to manage acute undernutrition
No. of people trained in child health and nutrition
No. of children under 5 received Vitamin A
No. of children under 5 reached by USG-nutrition programs
Integration (7)
% of stunted children under 5 years of age*
% of wasted children under 5 years of age*
% of underweight women *
% of underweight children under 5 years of age *
% of anemia among women of reproductive age *
% of anemia among children 6-59 mo *
% of children 6-23mo receiving a MAD*
23
Considerations (cont’d)
• Invest Strategically in Partnerships and
Capacity Building for Sustainability
• Strengthen Coordination and
Collaboration within the Missions
• Guidelines and incentives for projects and offices to
coordinate
• Close collaboration between agriculture/economic growth
and direct health/nutrition (Food safety and WASH/Hygiene)
activities is a must!
24

25
Landscape Analysis Constraints
• Access to documents
• Incomplete and out of date documents
• Information on actual implementation
• Definition of FTF ag-nutr program
• Mission staff turn-over
26

Deliverables
• 19 Country profiles
• 5 Country case studies
– Bangladesh + Nepal
– Guatemala + Honduras
– Senegal
• 4 Presentations – findings
– June 18/9 Cross-country
– March 19 – 21 Asian Focus countries
– March 5 – 7 LAC focus countries
– Dec 10 – 12 African focus countries
• 1 Final report
27

Landscape Analysis Team
Document Review and Analysis
Lidan Du
Aaron Buchsbaum (photo credit)
Alyssa Klein (photo credit)
Jody Harris
Technical advisors
Anu Narayan
Anna Herforth
Marie Ruel
28
Question for you
What can your agency do in the
next 2-3 years to help increase
the nutrition impact of Feed the
Future programs in the focus
countries?
29

Thank You
30

Additional Slides
31

Value Chain Details – Full List
32
Bangladesh Rice, local and new potato and sweet potato (OFSP), exotic and indigenous vegetable crops – tomato, peppers,
amaranth, Kang Kong, jute mallow, gourds (pumpkins), and beans, fish and shrimp
Cambodia Rice, green corn, seven commercially viable and predominantly indigenous fish species and prawns, over 40 types of
legumes, fruits, vegetables, and herbs – predominantly higher nutrition or value ones
Nepal High-value vegetables; secondary focus on lentils, maize, and rice; chickens, eggs, small livestock
Tajikistan Dried beans, peanuts, onions, garlic, dairy, kitchen garden crops (mainly profitable fruits and vegetables)
Guatemala Coffee, horticulture
Haiti Rice, maize, beans, plantains, cocoa, mango
Honduras Maize, beans, exotic and indigenous fruits and vegetables (price conscious), poultry, pigs, juice, tailoring, handicrafts
Ethiopia Maize, wheat, vegetable, pulses, sesame/chickpea, meat and live animals, dairy, honey, coffee
Ghana Maize, rice, soy, fish
Kenya Maize, cassava, millet/sorghum, sweet/Irish potato, vegetable, banana, mango, passion fruit, beans, legume, cowpea,
groundnuts, green grams, pigeon peas, dairy, livestock, flowers
Liberia Rice, cassava, other roots and tubers, vegetables, horticulture, poultry, goats, cocoa
Malawi Rice, beans, groundnuts, pigeon peas, soy, fish, dairy
Mali Sorghum/millet, rice, livestock/dairy (potentially vegetables)
Mozambique Fresh fruits, pulses, oilseeds, cashew
Rwanda Maize, beans, livestock (potentially pineapple, cassava, rice, coffee, pyrethrum, dairy)
Senegal Maize, millet/sorghum, rice (some horticulture, native food and iron-rich seeds; maybe livestock)
Tanzania Maize, rice, horticulture, vegetables, flowers, spices
Uganda Maize, beans, coffee, & sub-district-specific plants and livestock
Zambia Maize, horticulture, groundnut, soy, sunflower

33
Illustrative Intermediate Indicators along IFPRI Agriculture-Nutrition Pathways .Production Consumption pathway: crop yield, number of animals raised and butchered for home consumption, varieties of items grown in the gardens, quality (varieties) and quantity of foods stored at home, varieties and quantity of foods prepared and available at the table .Income Food purchase pathway: existence of a viable market accessible to target population, nutritious foods sold by local producers who grow them at this market, .Income Healthcare purchase pathway: availability of and access to quality facility-based and community-based health services, types of services provided and used by target population, stock management, health seeking behaviors (time waited before taking children to care) .Food Prices Food Purchase: supply and demand statistics, food price information .Women’s Workload Maternal Energy Use: women's BMI, micronutrient status, weight gain, time spent on rest, during pregnancy, birth weight .Women’s Time Use Care Capacity: time spent on farm/non-farm labor, time spent on child care (hygiene, interaction, play time), feeding practices (frequencies, kinds and quantities of food fed to children, styles of feeding), .Women’s Control of Income Resource Allocation: the amount of income controlled by women, difference between women’s priority purchase needs versus men’s, women and children’s food intake versus men (sequence, variety and quantity)


