Agreement between X-ray data Agreement between X-ray data and magnetically channeled and magnetically channeled wind shock model of wind shock model of 1 1 Ori C Ori C David Cohen, Marc Gagn David Cohen, Marc Gagn é é for Massive Star research for Massive Star research group group
Transcript
Agreement between X-ray data and Agreement between X-ray data and magnetically channeled wind shock magnetically channeled wind shock
model of model of 11 Ori C Ori C
David Cohen, Marc GagnDavid Cohen, Marc Gagnéé
for Massive Star research groupfor Massive Star research group
context context
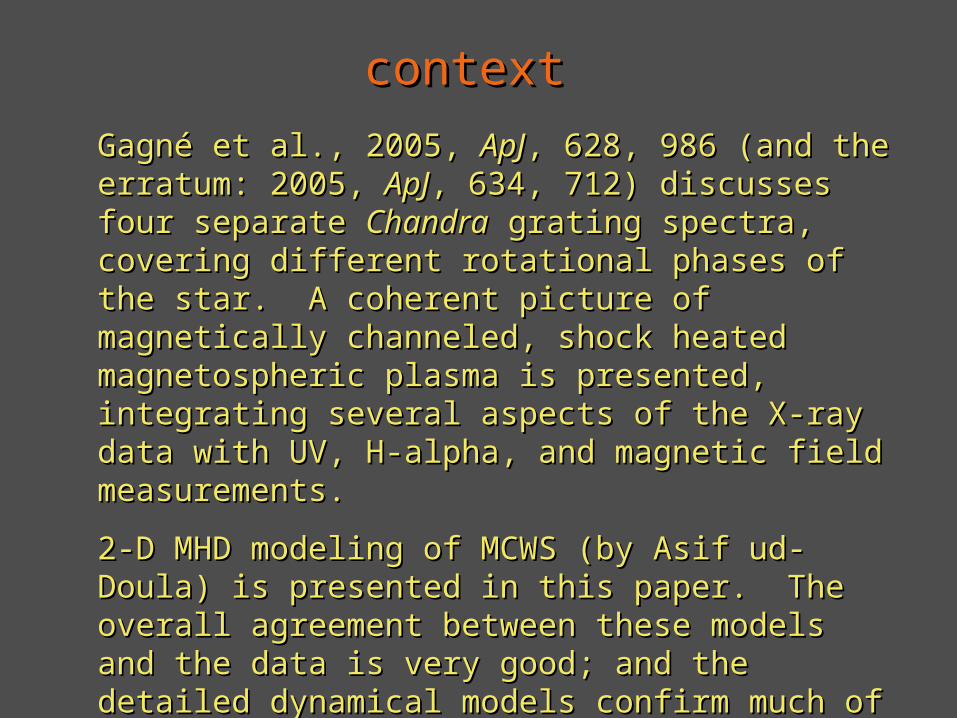
GagnGagné et al., 2005, é et al., 2005, ApJApJ, 628, 986 (and the erratum: , 628, 986 (and the erratum: 2005, 2005, ApJApJ, 634, 712) discusses four separate , 634, 712) discusses four separate ChandraChandra grating spectra, covering different rotational phases of grating spectra, covering different rotational phases of the star. A coherent picture of magnetically channeled, the star. A coherent picture of magnetically channeled, shock heated magnetospheric plasma is presented, shock heated magnetospheric plasma is presented, integrating several aspects of the X-ray data with UV, H-integrating several aspects of the X-ray data with UV, H-alpha, and magnetic field measurements. alpha, and magnetic field measurements.
2-D MHD modeling of MCWS (by Asif ud-Doula) is 2-D MHD modeling of MCWS (by Asif ud-Doula) is presented in this paper. The overall agreement presented in this paper. The overall agreement between these models and the data is very good; and between these models and the data is very good; and the detailed dynamical models confirm much of the the detailed dynamical models confirm much of the qualitative physical picture of the magnetospheric qualitative physical picture of the magnetospheric properties. properties.
outlineoutline
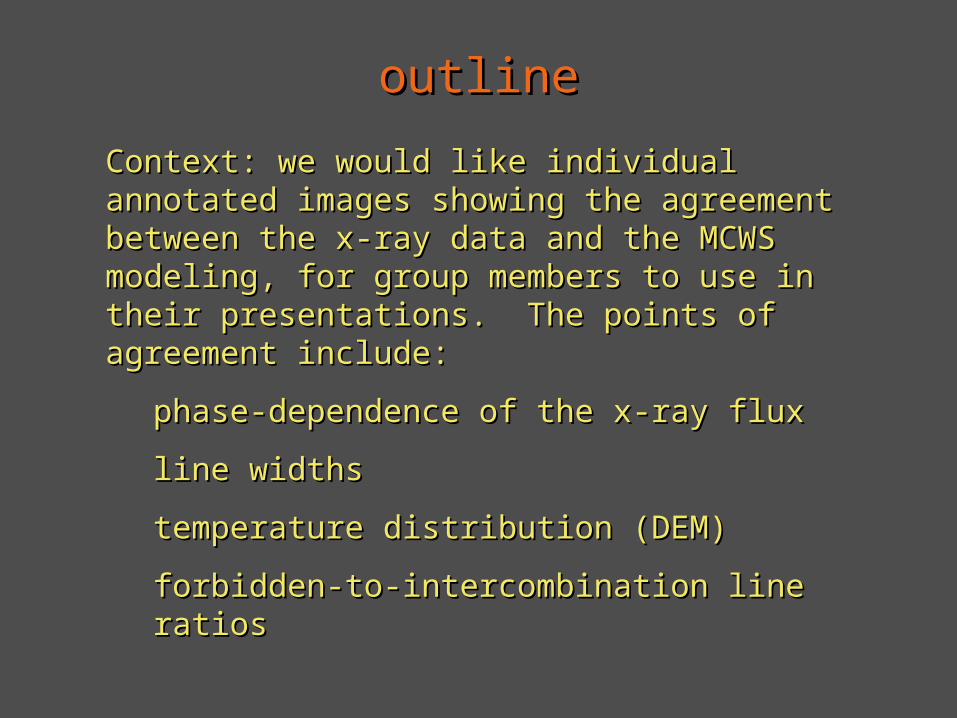
Context: we would like individual annotated images Context: we would like individual annotated images showing the agreement between the x-ray data and the showing the agreement between the x-ray data and the MCWS modeling, for group members to use in their MCWS modeling, for group members to use in their presentations. The points of agreement include: presentations. The points of agreement include:
phase-dependence of the x-ray fluxphase-dependence of the x-ray flux
line widthsline widths
temperature distribution (DEM)temperature distribution (DEM)
forbidden-to-intercombination line ratiosforbidden-to-intercombination line ratios
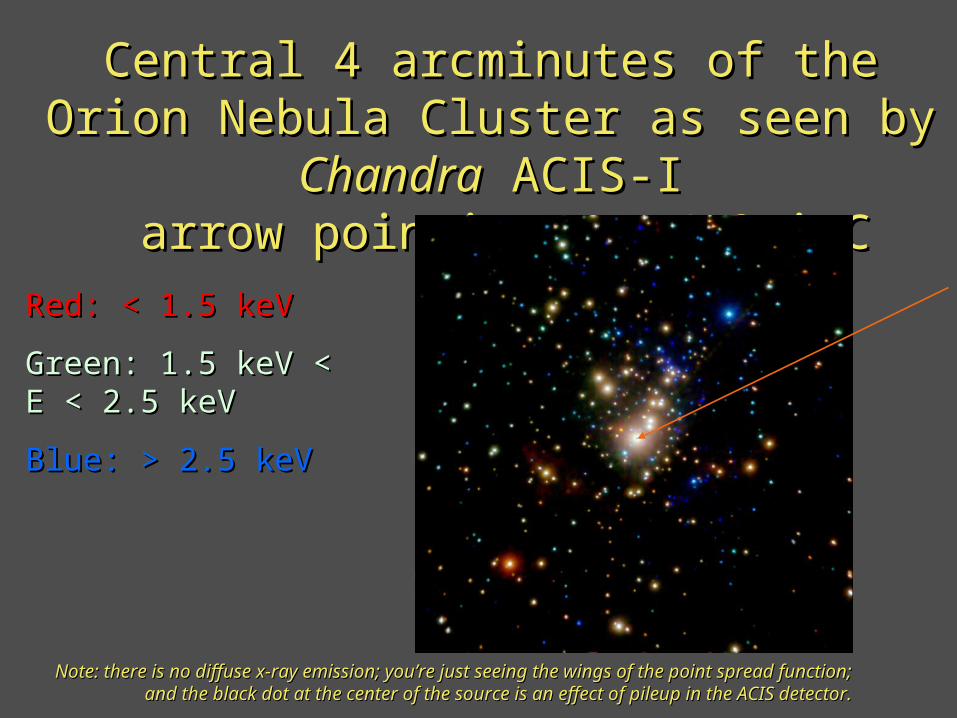
Central 4 arcminutes of the Orion Nebula Central 4 arcminutes of the Orion Nebula Cluster as seen by Cluster as seen by ChandraChandra ACIS-I ACIS-I
arrow pointing at arrow pointing at 11 Ori C Ori C
Red: < 1.5 keVRed: < 1.5 keV
Green: 1.5 keV < E < Green: 1.5 keV < E < 2.5 keV2.5 keV
Blue: > 2.5 keVBlue: > 2.5 keV
Note: there is no diffuse x-ray emission; you’re just seeing the wings of the point spread function; Note: there is no diffuse x-ray emission; you’re just seeing the wings of the point spread function; and the black dot at the center of the source is an effect of pileup in the ACIS detector.and the black dot at the center of the source is an effect of pileup in the ACIS detector.
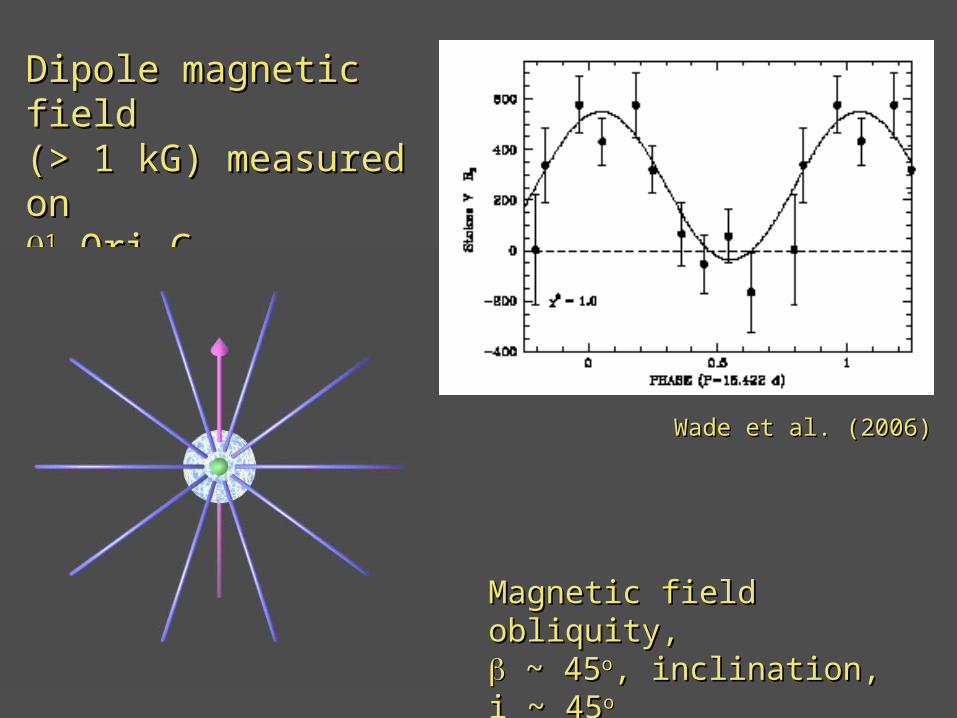
Dipole magnetic field Dipole magnetic field (> 1 kG) measured on (> 1 kG) measured on 11 Ori C Ori C
Magnetic field obliquity, Magnetic field obliquity, ~ 45 ~ 45oo, inclination, i ~ 45, inclination, i ~ 45oo
Wade et al. (2006)Wade et al. (2006)
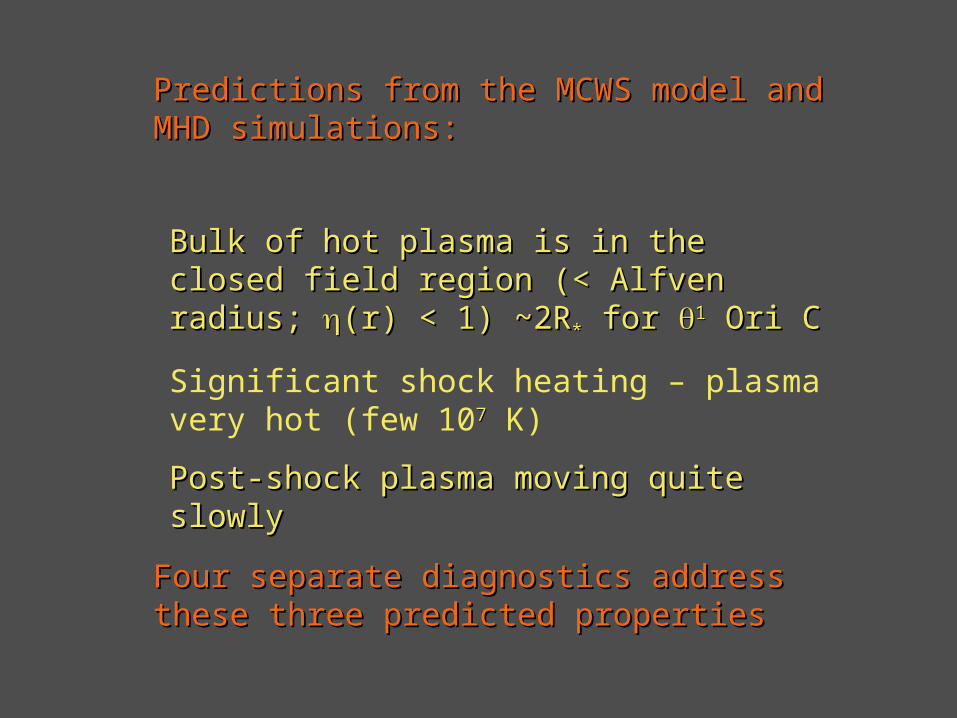
Predictions from the MCWS model and MHD Predictions from the MCWS model and MHD simulations:simulations:
Bulk of hot plasma is in the closed field region Bulk of hot plasma is in the closed field region (< Alfven radius; (< Alfven radius; (r) < 1) ~2R(r) < 1) ~2R** for for 11 Ori C Ori C
Significant shock heating – plasma very hot (few 1077 K)
Four separate diagnostics address these three Four separate diagnostics address these three predicted propertiespredicted properties
The phase dependence of the x-ray flux The phase dependence of the x-ray flux constrains the spatial distribution of the x-ray constrains the spatial distribution of the x-ray emitting plasma in the magnetosphere.emitting plasma in the magnetosphere.
A deeper eclipse at edge-on viewing angles if the A deeper eclipse at edge-on viewing angles if the hot plasma is closer to the star.hot plasma is closer to the star.
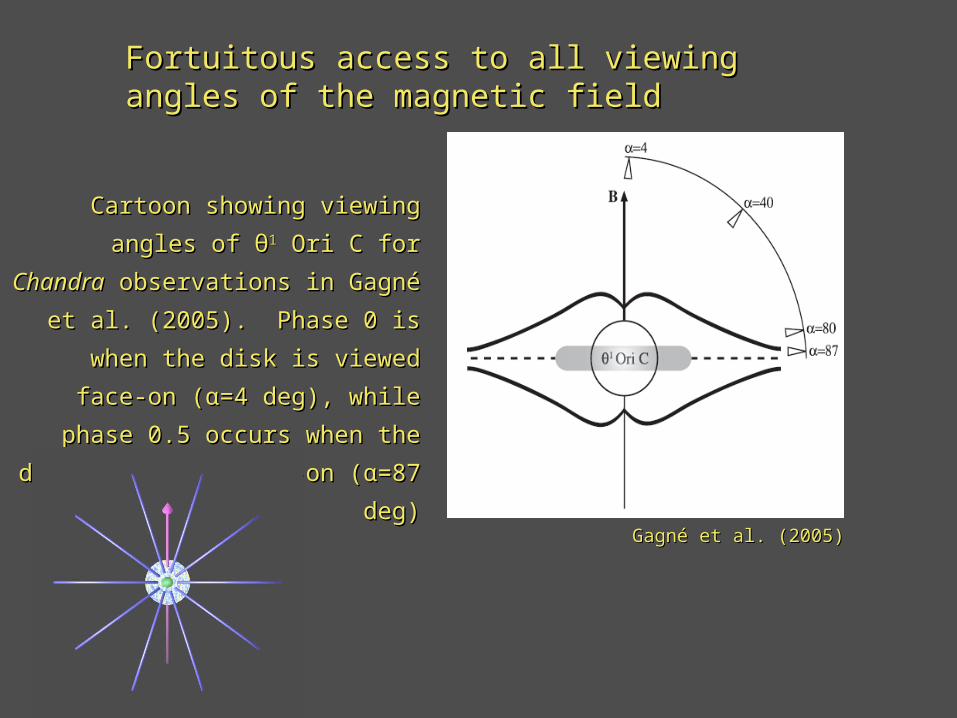
Fortuitous access to all viewing angles of the Fortuitous access to all viewing angles of the magnetic fieldmagnetic field
Cartoon showing viewing angles of θCartoon showing viewing angles of θ11
Ori C for Ori C for ChandraChandra observations in observations in
GagnGagné et al. (2005)é et al. (2005). Phase 0 is when . Phase 0 is when
the disk is viewed face-on (α=4 deg), the disk is viewed face-on (α=4 deg),
while phase 0.5 occurs when the disk while phase 0.5 occurs when the disk
is viewed edge-on (α=87 deg)is viewed edge-on (α=87 deg)
GagnGagné et al. (2005)é et al. (2005)
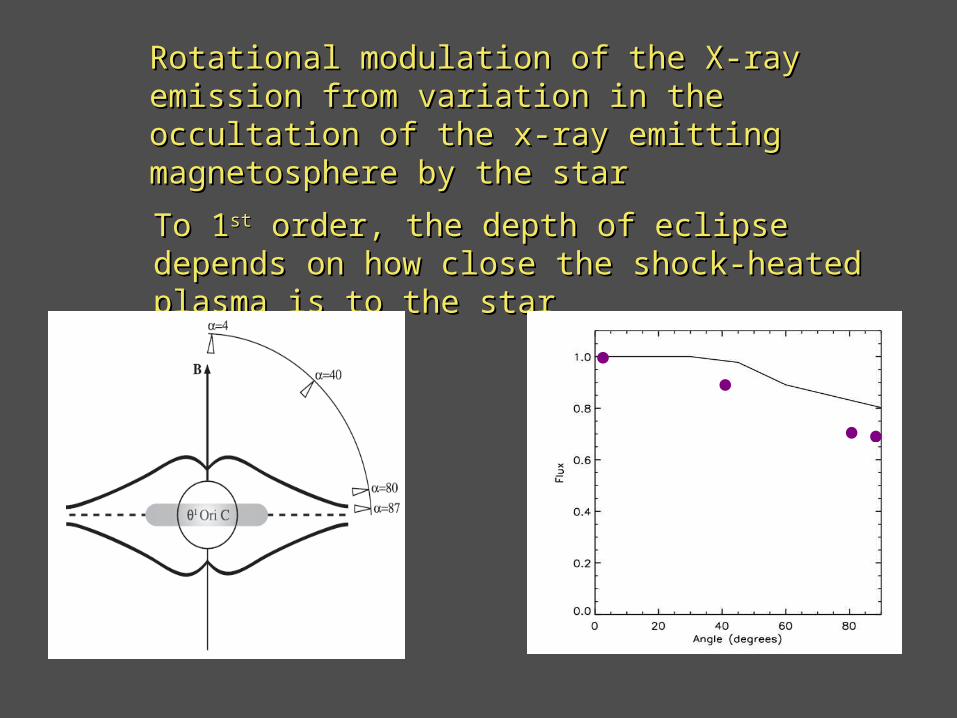
Rotational modulation of the X-ray emission from Rotational modulation of the X-ray emission from variation in the occultation of the x-ray emitting variation in the occultation of the x-ray emitting magnetosphere by the starmagnetosphere by the star
To 1To 1stst order, the depth of eclipse depends on how order, the depth of eclipse depends on how close the shock-heated plasma is to the star close the shock-heated plasma is to the star
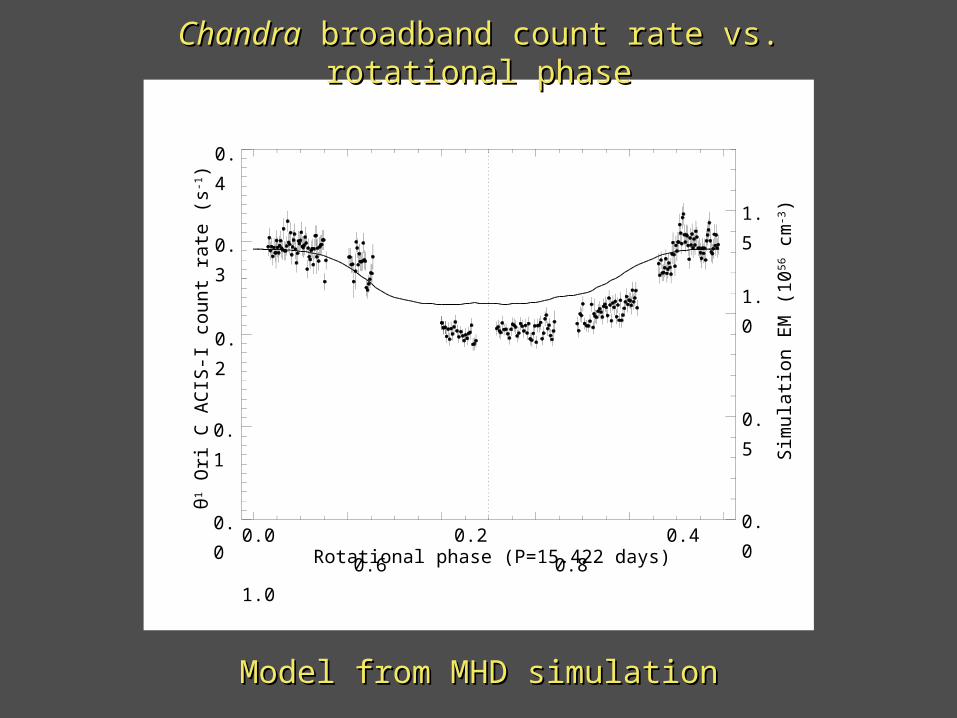
ChandraChandra broadband count rate vs. rotational phase broadband count rate vs. rotational phase
Model from MHD simulationModel from MHD simulation
Note that the assumption in the last two figures Note that the assumption in the last two figures is that the only thing that modulates the x-ray is that the only thing that modulates the x-ray flux is occultation of the magnetosphere by the flux is occultation of the magnetosphere by the star itself. star itself.
Fig. 14 and Table 6 in Gagné et al. (2005) Fig. 14 and Table 6 in Gagné et al. (2005) indicate that there might be a modest excess indicate that there might be a modest excess of absorbing column when the of absorbing column when the magnetosphere is viewed edge-on. magnetosphere is viewed edge-on.
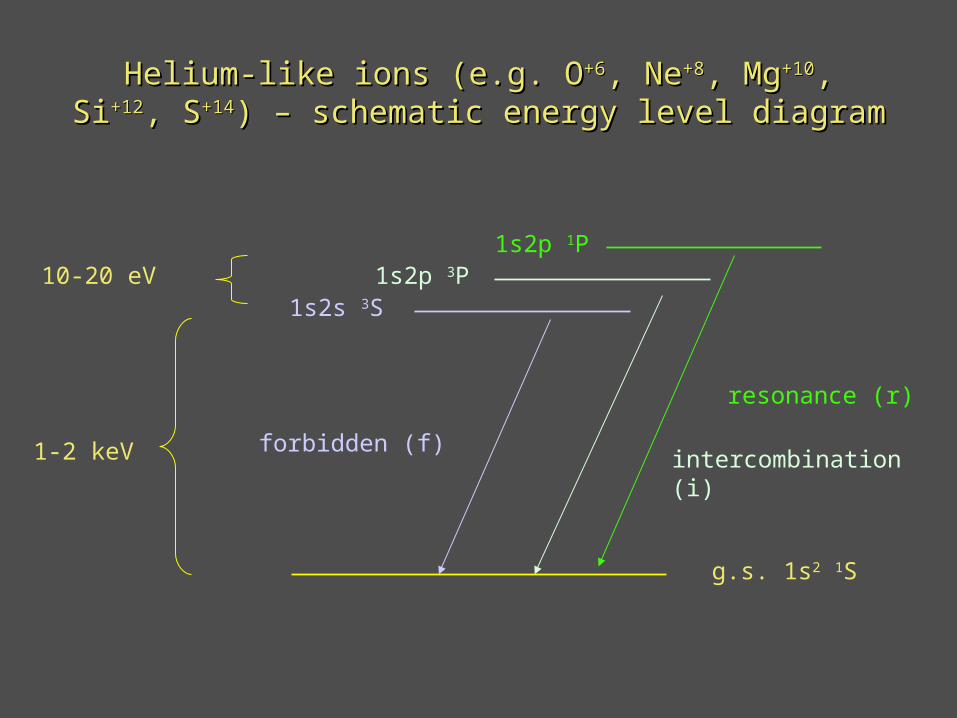
The ratio of the intensity of the helium-like The ratio of the intensity of the helium-like forbiddenforbidden to to intercombinationintercombination lines also constrains lines also constrains the spatial distribution of the x-ray emitting plasma the spatial distribution of the x-ray emitting plasma in the magnetosphere.in the magnetosphere.
A weaker forbidden line indicates the plasma is A weaker forbidden line indicates the plasma is closer to the star, since the upper level of the closer to the star, since the upper level of the forbidden line is depopulated by the local UV forbidden line is depopulated by the local UV radiation field. radiation field.
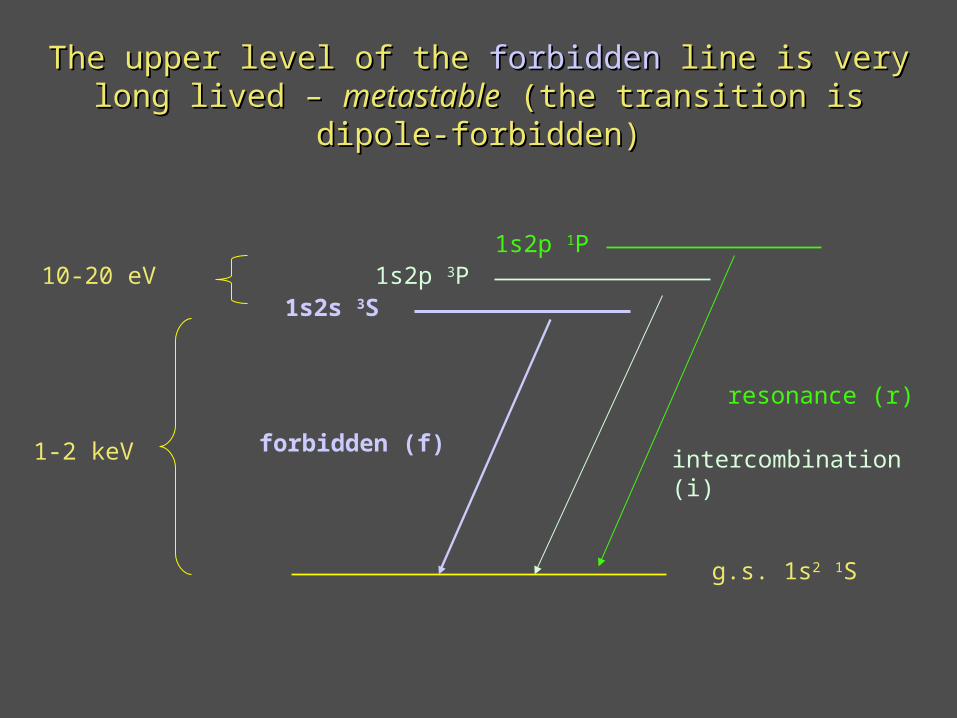
The upper level of the The upper level of the forbiddenforbidden line is very long lived – line is very long lived – metastablemetastable (the transition is dipole-forbidden) (the transition is dipole-forbidden)
g.s. 1s2 1S
1s2s 3S1s2p 3P
1s2p 1P
resonance (r)
intercombination (i)forbidden (f)
10-20 eV
1-2 keV
1s2s 3S
1s2p 3P1s2p 1P
resonance (r)
intercombination (i)forbidden (f)
g.s. 1s2s 1S
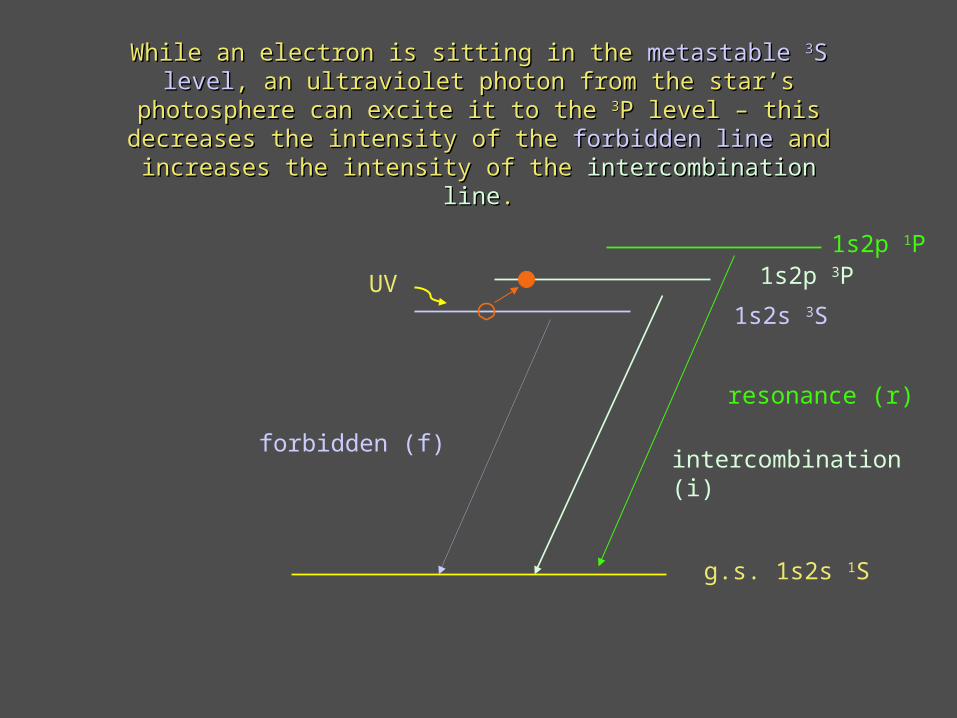
While an electron is sitting in the While an electron is sitting in the metastable metastable 33S levelS level, an ultraviolet , an ultraviolet photon from the star’s photosphere can excite it to the photon from the star’s photosphere can excite it to the 33P level – this P level – this
decreases the intensity of the decreases the intensity of the forbidden lineforbidden line and increases the and increases the intensity of the intensity of the intercombination lineintercombination line..
UV
1s2s 3S
1s2p 3P1s2p 1P
resonance (r)
intercombination (i)forbidden (f)
g.s. 1s2s 1S
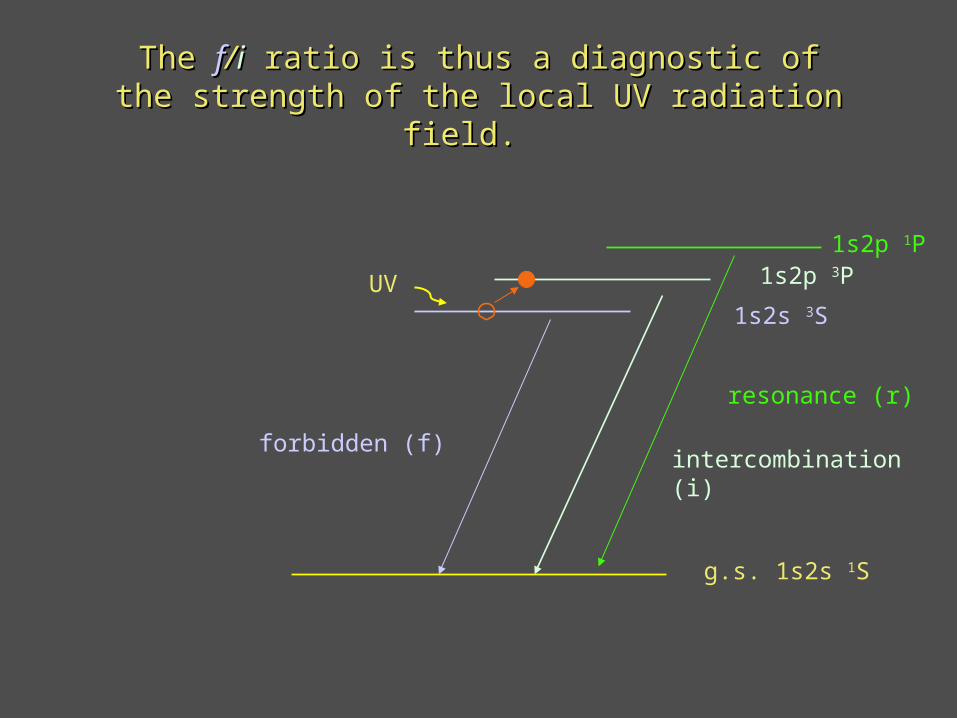
The The ff//ii ratio is thus a diagnostic of the strength of the ratio is thus a diagnostic of the strength of the local UV radiation field. local UV radiation field.
UV
1s2s 3S
1s2p 3P1s2p 1P
resonance (r)
intercombination (i)forbidden (f)
g.s. 1s2s 1S
If you know the UV intensity emitted from the star’s surface, it If you know the UV intensity emitted from the star’s surface, it thus becomes a diagnostic of the distance that the x-ray thus becomes a diagnostic of the distance that the x-ray
emitting plasma is from the star’s surface.emitting plasma is from the star’s surface.
UV
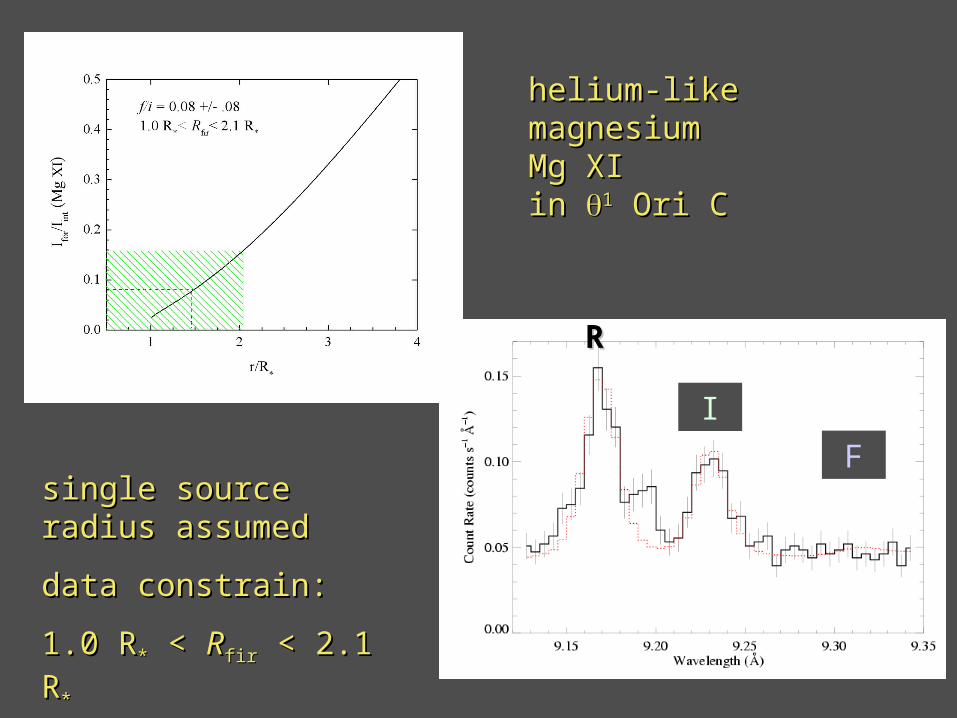
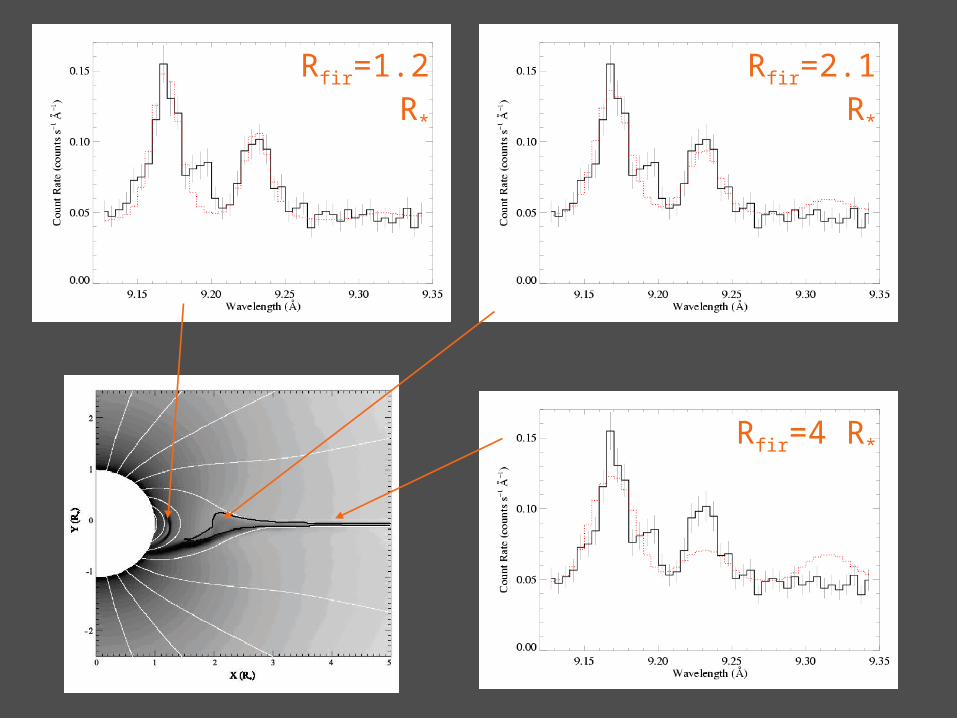
Model of f/i ratio dependence on the radius (via the Model of f/i ratio dependence on the radius (via the dilution factor)dilution factor)
model
constraints from data
implied constraints on location
RR
I
F
helium-like magnesiumhelium-like magnesiumMg XIMg XIin in 11 Ori C Ori C
single source radius single source radius assumedassumed
data constrain:data constrain:
1.0 R1.0 R** < < RRfirfir < 2.1 R < 2.1 R**
Rfir=1.2 R* Rfir=2.1 R*
Rfir=4 R*
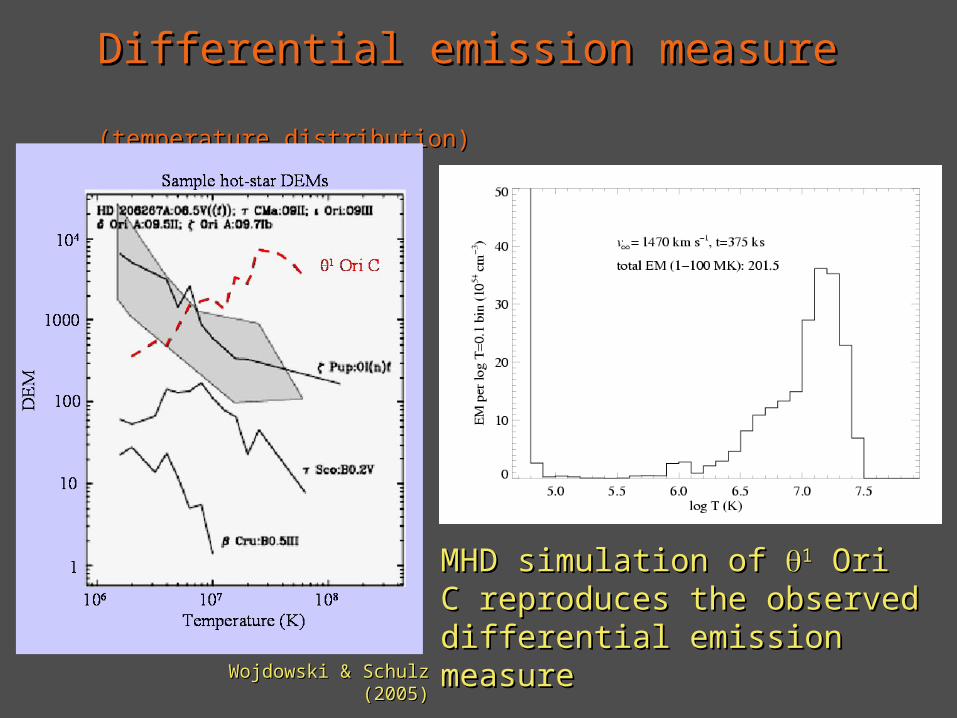
Temperature distribution in the X-ray emitting Temperature distribution in the X-ray emitting plasma is predicted to be skewed toward high plasma is predicted to be skewed toward high temperatures, due to the strong, head-on shocks temperatures, due to the strong, head-on shocks near the magnetic equator.near the magnetic equator.
The temperature distribution (‘differential emission The temperature distribution (‘differential emission measure’) is derived from fitting thermal measure’) is derived from fitting thermal equilibrium models (e.g. APEC) to the dispersed equilibrium models (e.g. APEC) to the dispersed spectrum. spectrum.
MHD simulation of MHD simulation of 11 Ori C Ori C reproduces the observed reproduces the observed differential emission measuredifferential emission measure
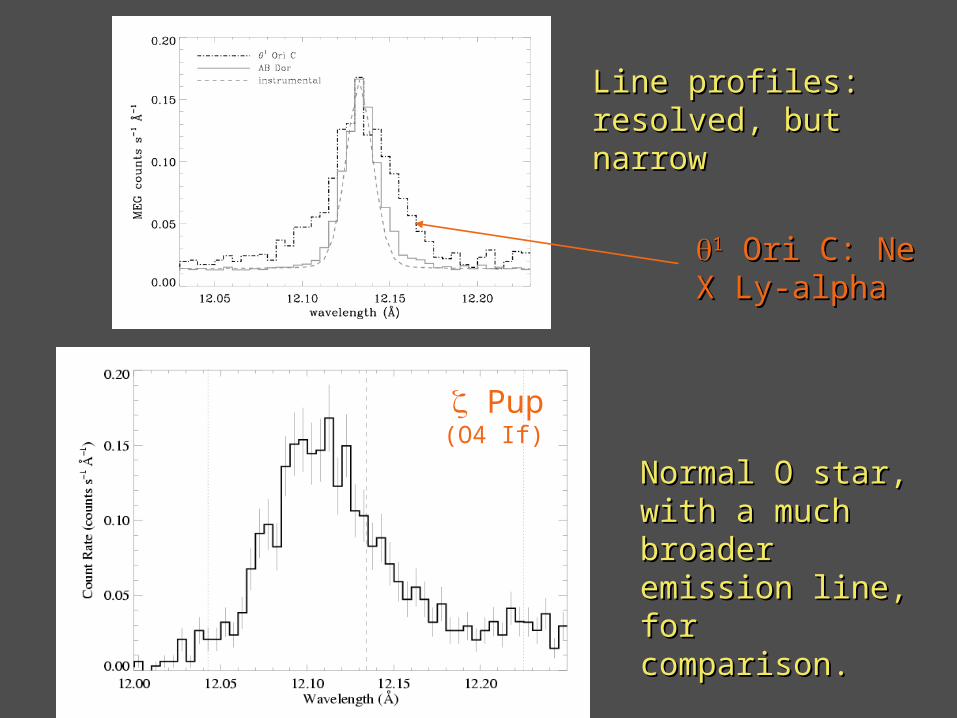
Emission line widths trace the line-of-sight velocity Emission line widths trace the line-of-sight velocity distribution in the hot plasma.distribution in the hot plasma.
The magnetic confinement of the post-shock The magnetic confinement of the post-shock plasma predicts small, but not infinitely narrow, plasma predicts small, but not infinitely narrow, line widths. line widths.
Pup(O4 If)
Line profiles: Line profiles: resolved, but narrowresolved, but narrow
11 Ori C: Ne X Ori C: Ne X Ly-alphaLy-alpha
Normal O star, with Normal O star, with a much broader a much broader emission line, for emission line, for comparison. comparison.
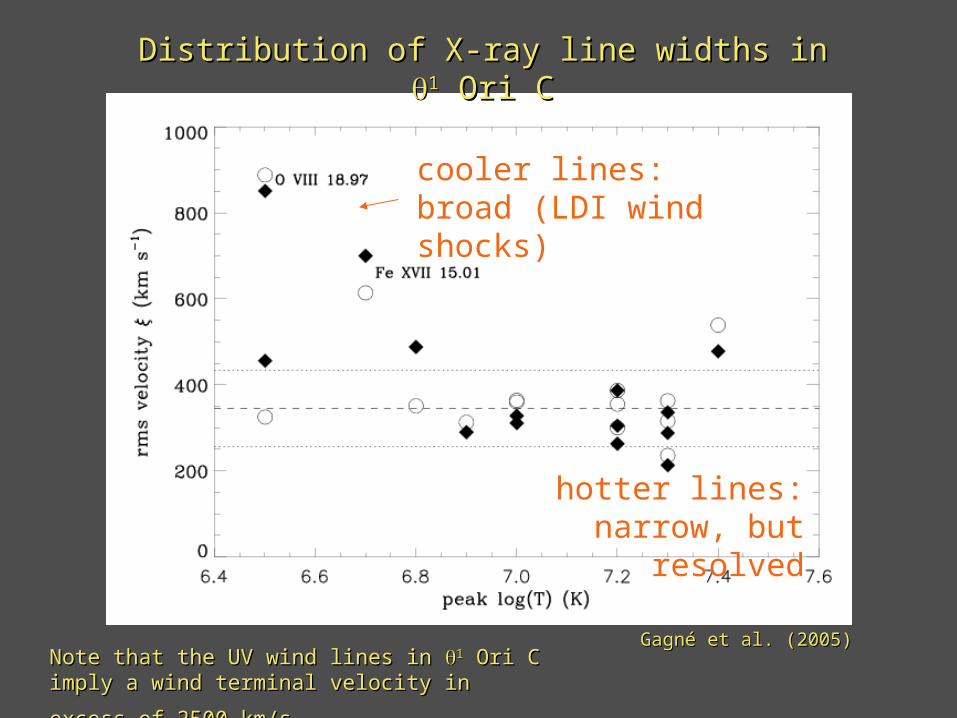
Distribution of X-ray line widths in Distribution of X-ray line widths in 11 Ori C Ori C
hotter lines: narrow, but resolved
cooler lines: broad (LDI wind shocks)
Gagné et al. (2005)Gagné et al. (2005)Note that the UV wind lines in Note that the UV wind lines in 11 Ori C imply a wind Ori C imply a wind
terminal velocity in excess of 2500 km/s.terminal velocity in excess of 2500 km/s.
z-ax
is (
stel
lar
radi
i)
x-axis (stellar radii)
-5 0 5
0
-5
5
EM per unit volume (1110 ks)
Line profile (1110 ks) – tilt: 0
deg
Line-of-Sight Velocity (km/s) -500 0 500
EM
(cm
-3)
0
2x1054
4x1054
6x1054
8x1054
1x1055 Line profile (1110 ks) – tilt: 90
deg
Line-of-Sight Velocity (km/s) -500 0 500
EM
(cm
-3)
0
2x1054
4x1054
6x1054
8x1054
1x1055
MHD sims:
HWHM ~ 200 km/s
No viewing angle dependence
The following slides demo the The following slides demo the basic results from the MHD simsbasic results from the MHD sims
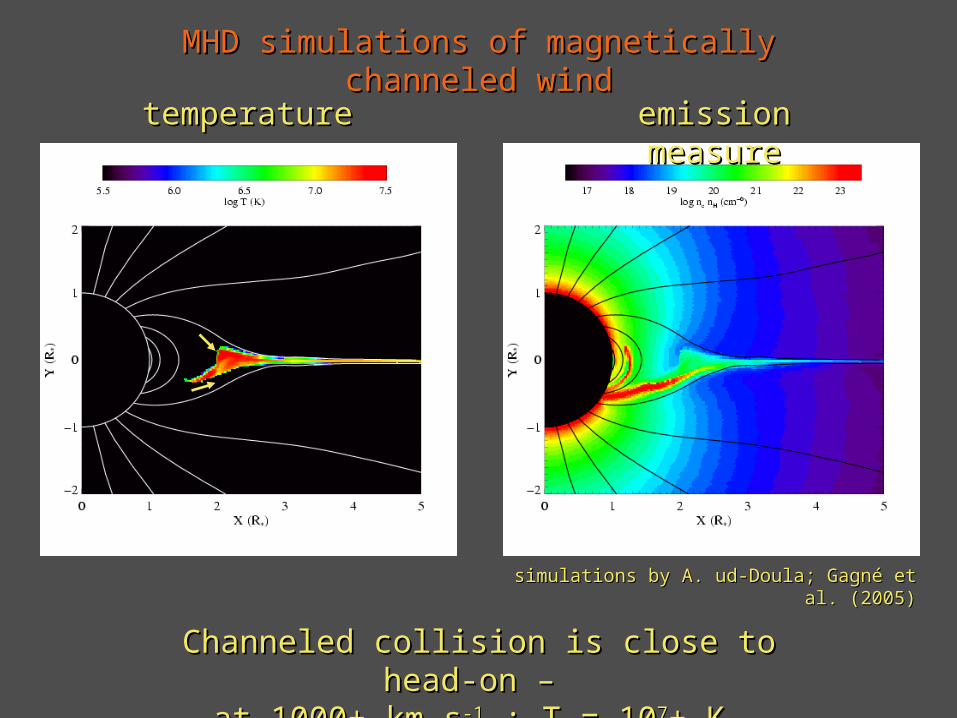
MHD simulations of magnetically channeled windMHD simulations of magnetically channeled wind
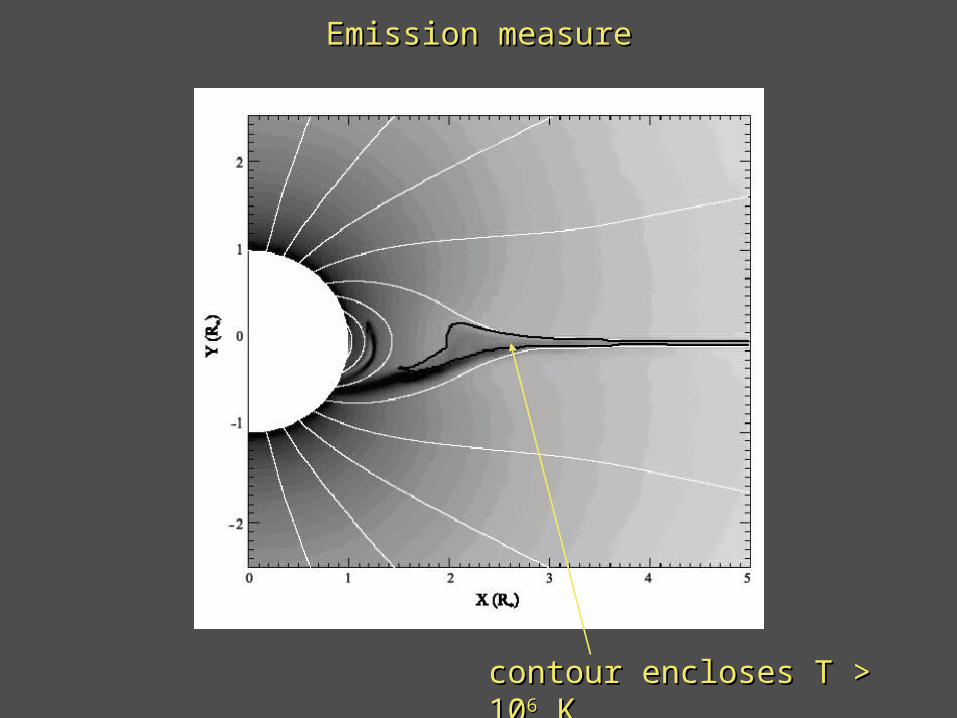
Channeled collision is close to head-on – Channeled collision is close to head-on – at 1000+ km sat 1000+ km s-1-1 : T = 10 : T = 1077+ K + K
simulations by A. ud-Doula; Gagné et al. (2005)simulations by A. ud-Doula; Gagné et al. (2005)
Emission measureEmission measure
contour encloses T > 10contour encloses T > 1066 K K
MHD simulations show multi-10MHD simulations show multi-1066 K plasma, K plasma, moving slowly, ~1Rmoving slowly, ~1R** above photosphere above photosphere
contour encloses T > 10contour encloses T > 1066 K K
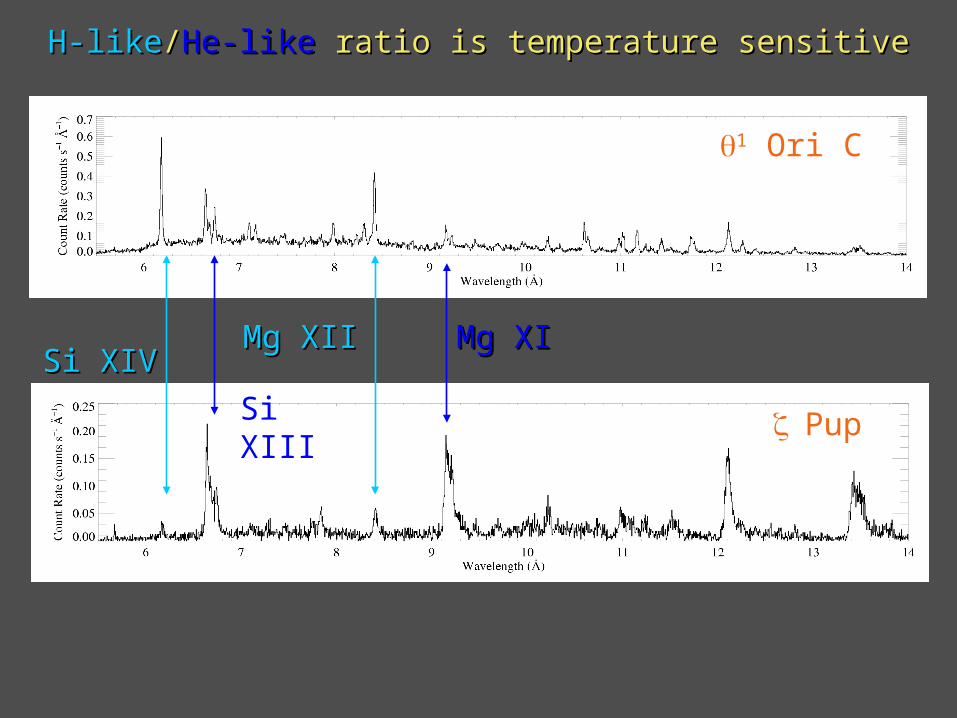
The following slides show the Chandra grating The following slides show the Chandra grating (MEG) data, with that of (MEG) data, with that of Pup for comparison. Pup for comparison.
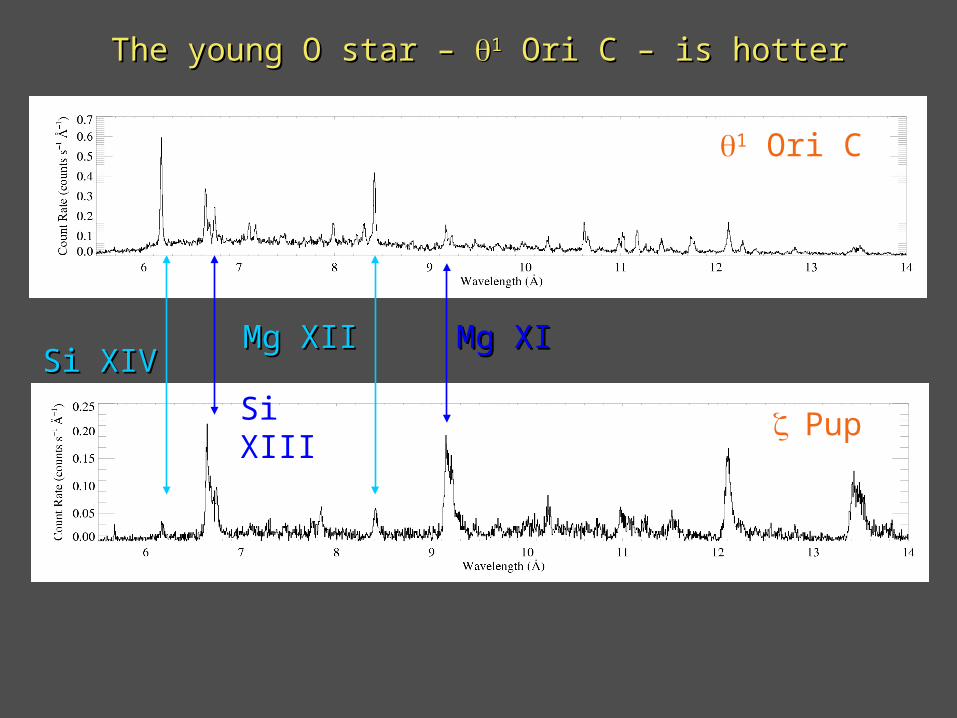
The helium-like complexes of several ions The helium-like complexes of several ions are visible;are visible;
The high temperatures are apparent in the The high temperatures are apparent in the line ratios (and strong continuum); line ratios (and strong continuum);
The modest line widths are easily seen when The modest line widths are easily seen when compared to compared to Pup’s. Pup’s.
Pup
1 Ori C
ChandraChandra grating spectra ( grating spectra (RR ~ 1000 ~ 300 km s ~ 1000 ~ 300 km s-1-1))
11 Ori C: hotter plasma, narrower emission lines Ori C: hotter plasma, narrower emission lines