Kentucky Tobacco Research and Development Center | Veterinary Diagnostic Laboratory | Division of Regulatory Services | Research and Education Center Robinson Forest | Robinson Center for Appalachian Resource Sustainability | University of Kentucky Superfund Research Center | Equine Programs Agricultural Experiment Station PR-739 Fruit and Vegetable 2017 ANNUAL RESEARCH REPORT University of Kentucky College of Agriculture, Food and Environment Agricultural Experiment Station
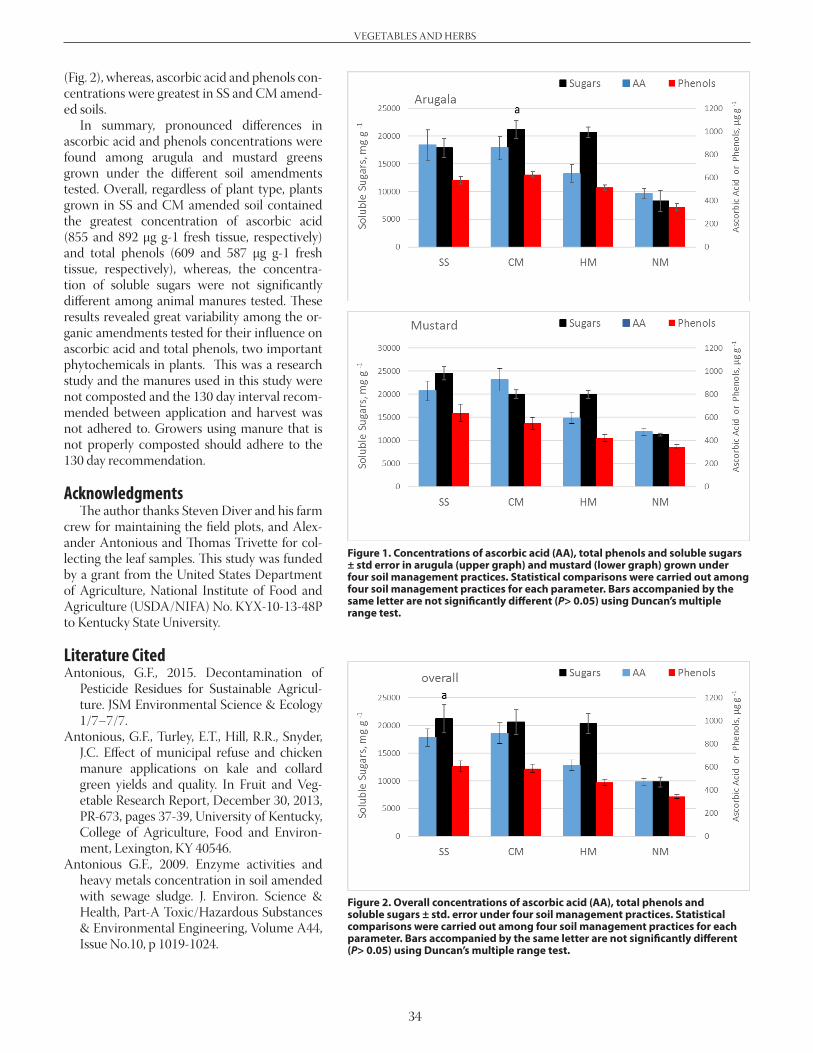
Transcript
University of KentuckyCollege of Agriculture,Food and EnvironmentAgricultural Experiment Station
Kentucky Tobacco Research and Development Center | Veterinary Diagnostic Laboratory | Division of Regulatory Services | Research and Education CenterRobinson Forest | Robinson Center for Appalachian Resource Sustainability | University of Kentucky Superfund Research Center | Equine Programs
Agricultural Experiment Station
PR-739
Fruit and Vegetable2 0 1 7 A N N U A L R E S E A R C H R E P O R T
University of KentuckyCollege of Agriculture,Food and EnvironmentAgricultural Experiment Station
Kentucky Tobacco Research and Development Center | Veterinary Diagnostic Laboratory | Division of Regulatory Services | Research and Education CenterRobinson Forest | Robinson Center for Appalachian Resource Sustainability | University of Kentucky Superfund Research Center | Equine Programs
Agricultural Experiment Station
Cover: Pumpkin from a fungicide and cultivar evaluation at the U.K. Horticultural Research Farm in Lexington, 2017.Photographer: Callie Hicks
2017 Fruit and Vegetable Crops Research ReportEdited by John Snyder, Chris Smigell, and John Strang
CONTRIBUTIONS TO THIS REPORT:
Mention or display of a trademark, proprietary product, or firm in text or figures does not constitute an endorsement and does not imply approval to the exclusion of other suitable products or firms.Several of the research reports presented in this document were partially funded by the Kentucky Agricultural Development Board through a grant to the Kentucky Horticulture Council.
HorticultureFacultyDoug ArchboldRobert GeneveJohn SnyderJohn StrangArea Extension AssociatesTy Cato, Shelbyville, Louisville metro area (vegetables)Dan Becker, Princeton, West Kentucky (fruits and vegetables)Chris Smigell, Lexington, Central Kentucky (fruits and vegetables)Professional StaffGrant ClouserSteve DiverJune JohnstonDave LowrySharon KesterGinny TravisJoseph TuckerJohn WalshDwight WolfeGraduate StudentsAmmar Al BayatiMohmmad DawoodBridget Reed
Extension AgentsAgriculture and Natural Resources and Horticulture (county research sites)Jessamine Co., Steve Musen Laurel Co., Bonnie Sigmon Lincoln Co., Will Stallard
Kentucky State UniversityCollege of Agriculture Food Science and Sustainable SystemsFaculty George F. Antonius Kirk Pomper John SedlacekProfessional StaffAlexander AntoniusMamata BashayalKaren FrileySheri Crabtree
Acknowledgments Grants from the Agricultural Devel-opment Board through the Kentucky Horticulture Council have allowed an expansion of the field research and dem-onstration program to meet the infor-mational and educational needs of our growing vegetable and fruit industries. The editors would also like to thank the Kentucky Vegetable Growers Associa-tion and the Kentucky State Horticul-ture Society for providing funds to cover the costs of printing in 2017.
Important Note to Readers The majority of research reports in this volume do not include treatments with experimental pesticides. It should be understood that any experimental pesticide must first be labeled for the crop in question before it can be used by growers, regardless of how it might have been used in research trials. The most recent product label is the final authority concerning application rates, pre-cautions, harvest intervals, and oth-er relevant information. Contact your county’s Cooperative Extension office if you need assistance in interpreting pes-ticide labels. This is a progress report and may not reflect exactly the final outcome of on-going projects. Please do not reproduce project reports for distribution without permission of the authors.
ContentsThe 2017 Fruit and Vegetable Crops Research Program .................................................................5
DemonstrationsOn-Farm Commercial Fruit and Vegetable Demonstrations .......................................................6
Trees and Small FruitFruiting Characteristics of Three Primocane-fruiting Blackberry Selections at Kentucky State University ....................................................................................8Erect Thornless Blackberry Cultivar Trial ............................................................................................9Parasitoid Wasps Associated with Blackberries Bordered by Native Perennial Plants versus Pasture Borders in Franklin County, Kentucky ................... 10Haskap Selection and Variety Evaluation .......................................................................................... 12Timing of Bark Inlay Grafting of Pawpaw Affects Success Rate................................................ 15Rootstock Effects on Apple and Peach Tree Growth and Yield ................................................ 16
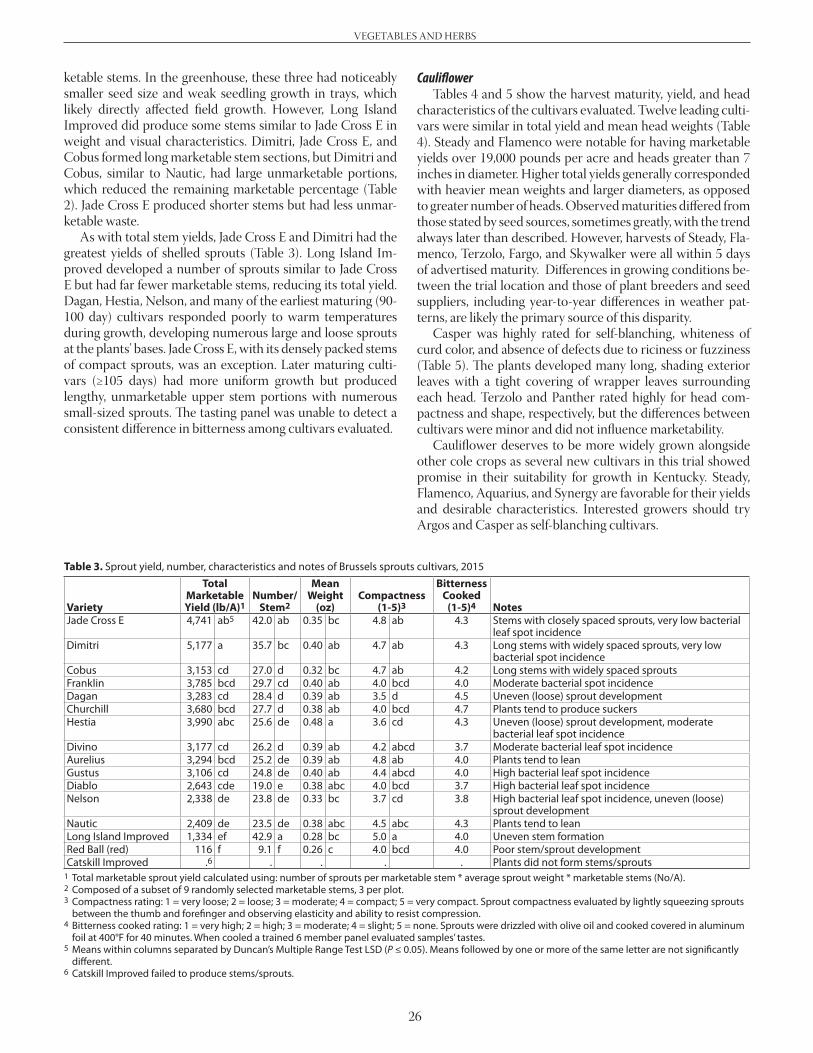
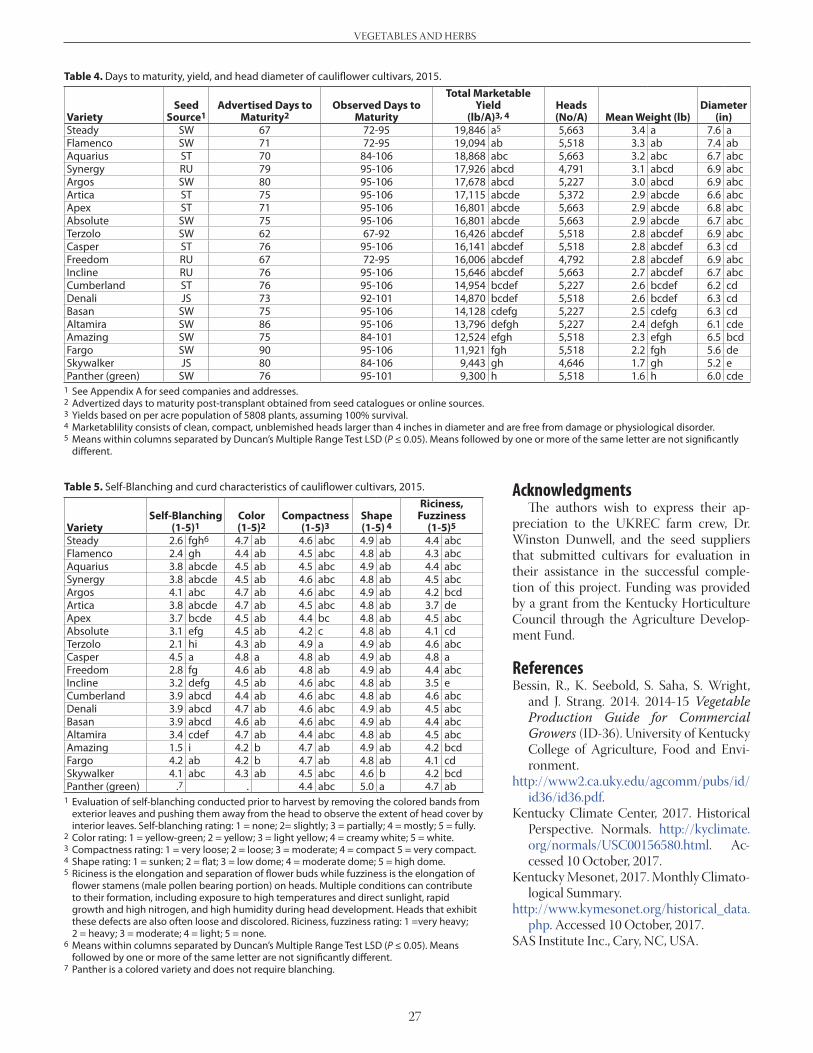
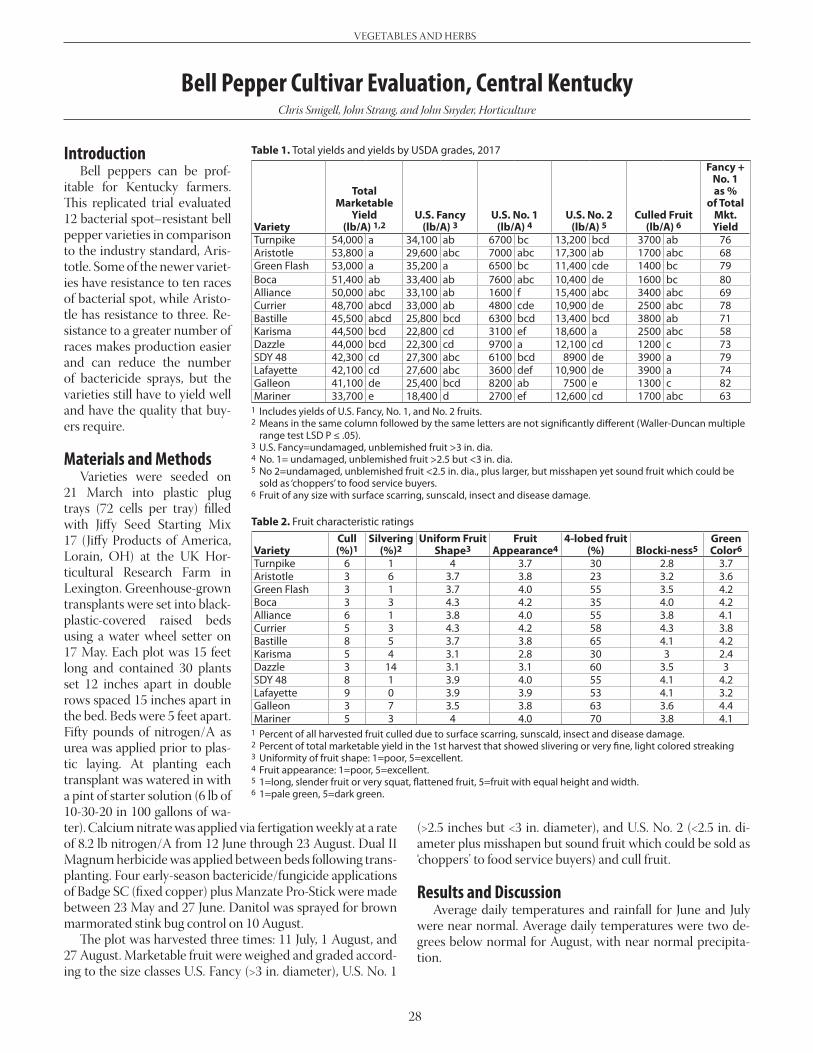
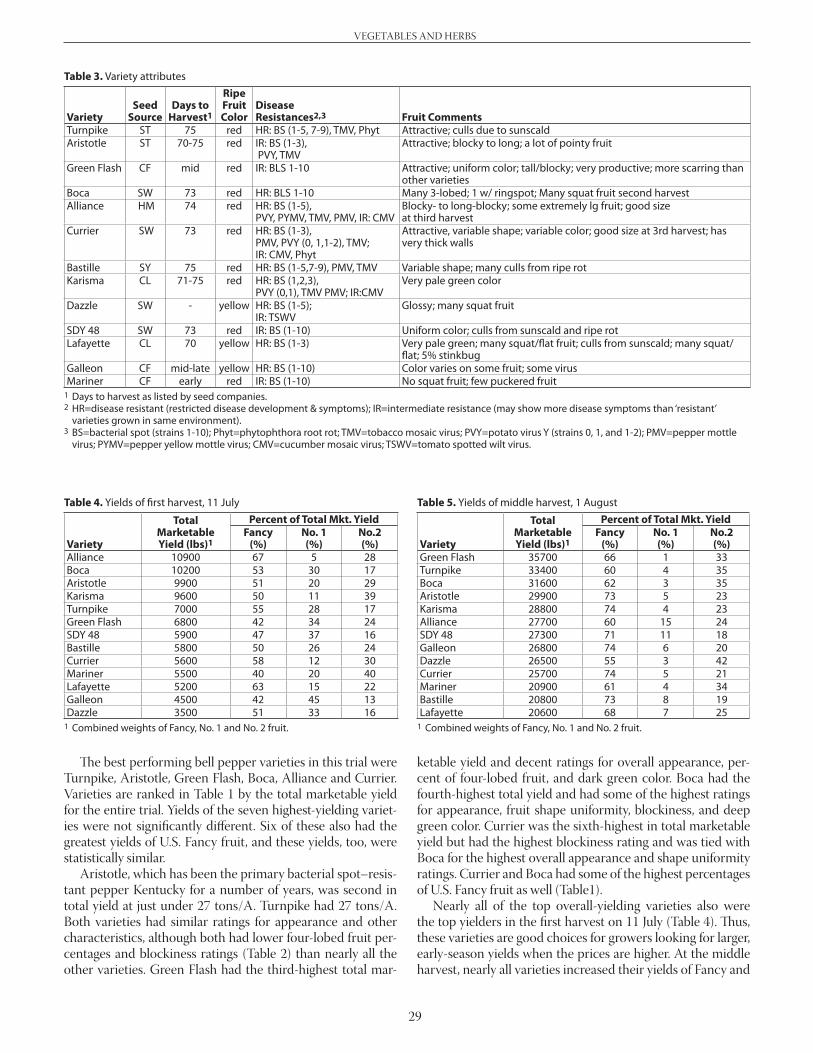
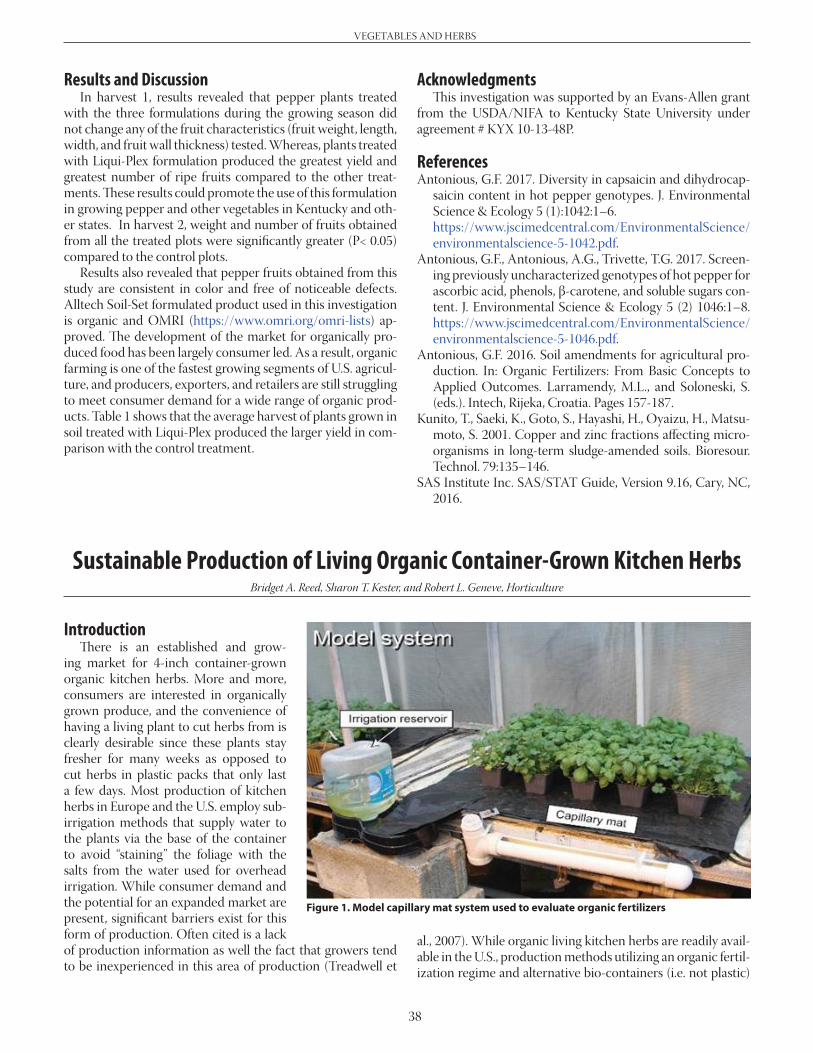
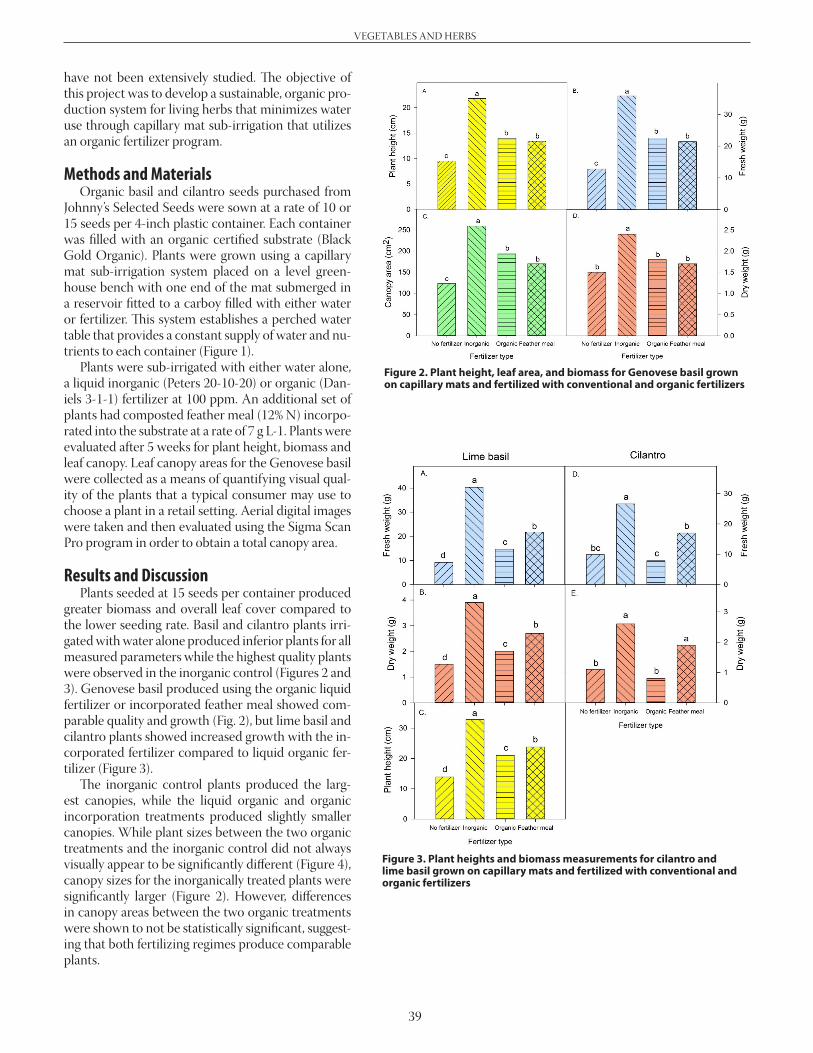
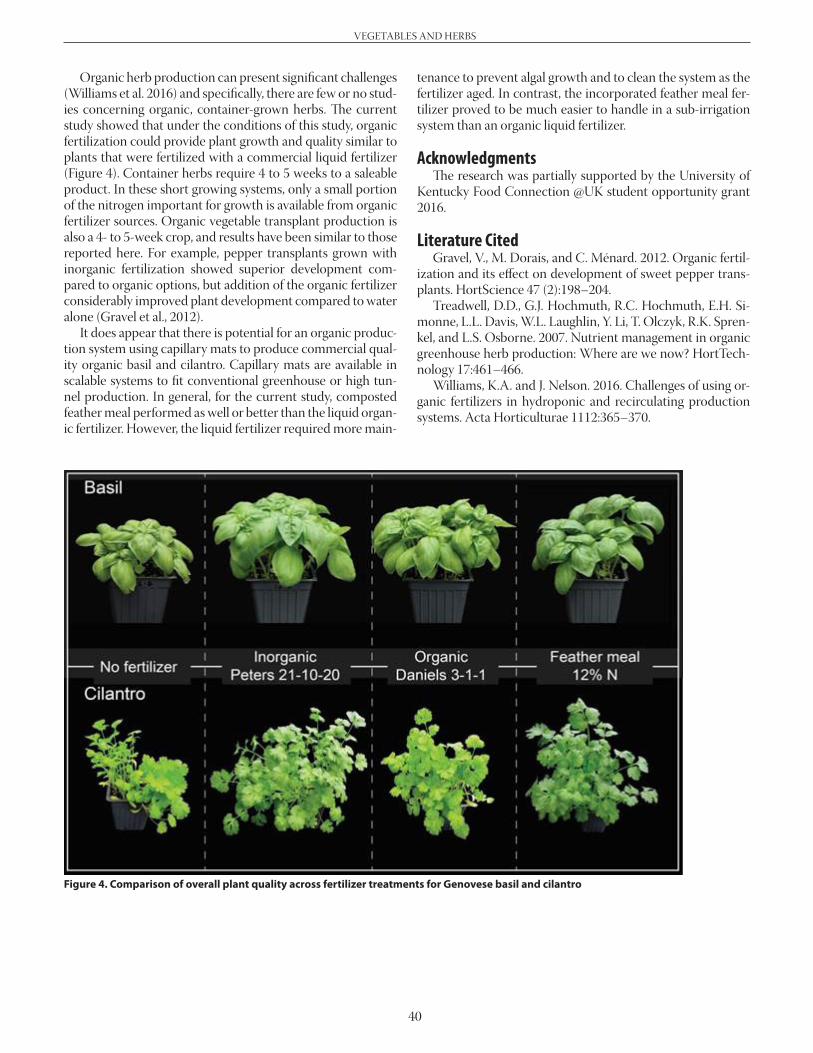
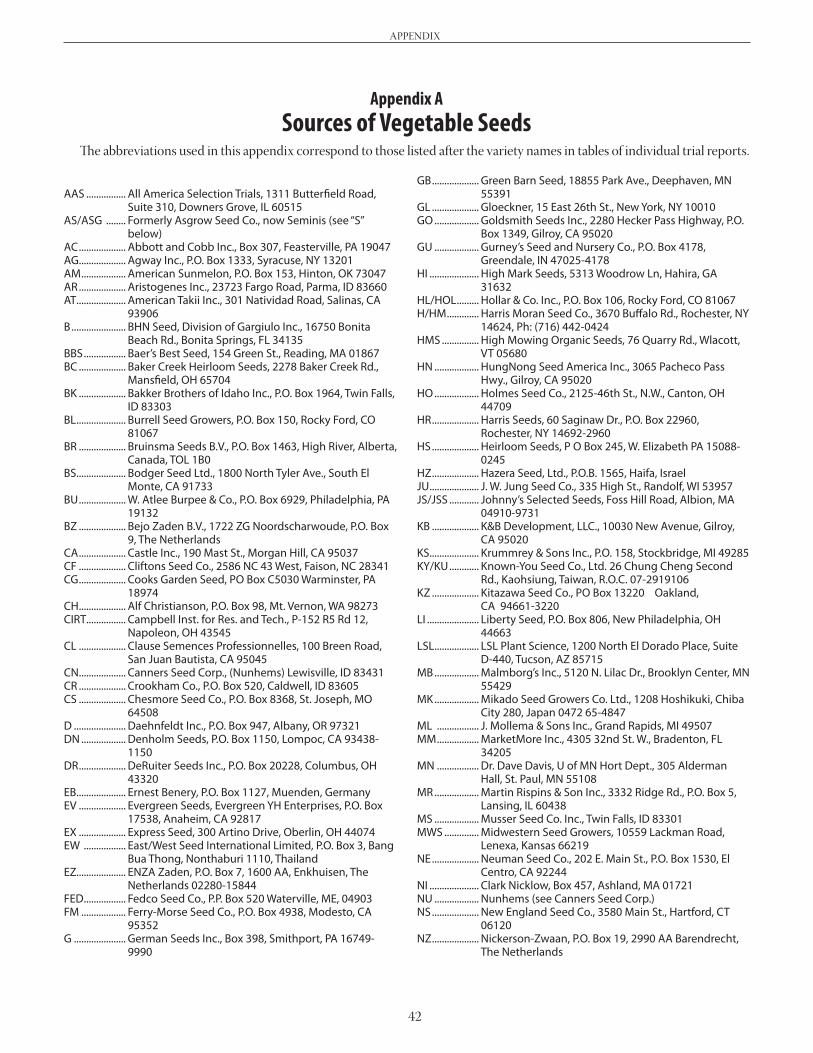
Vegetables and HerbsGreen Bean Variety Evaluation .............................................................................................................. 20Broccoli Cultivar Trial in Western Kentucky, Fall 2016 and Spring 2017 .............................. 22Fall Brussels Sprouts and Cauliflower Cultivar Trial in Western Kentucky, 2015 .......................................................................................................... 24Bell Pepper Cultivar Evaluation, Central Kentucky ....................................................................... 28Pumpkin Fungicide and Cultivar Evaluation .................................................................................... 30Soil Amended with Organic Manure Elevated Antioxidants Content of Arugula and Mustard Greens .................................................................................................... 33Small Scale Equipment to Optimize Tomato Disease Management ...................................... 35Investigating the Impact of Soil-Set®, Grain-Set®, and Liqui-Plex® Formulations on Hot Pepper, Capsicum annuum Yield ................................................... 37Sustainable Production of Living Organic Container-Grown Kitchen Herbs ..................... 38
AppendixSources of Vegetable Seeds ..................................................................................................................... 42
5
INTRODUCTION
Fruit and vegetable production continues to show sus-tained growth in Kentucky. As the industry grows around a diverse collection of marketing tactics (wholesale, farmers markets, CSAs, and direct to restaurants) as well as various production systems, there continues to be a need for applied practical information to support the industry. The 2017 Fruit and Vegetable Crops research report includes results for 16 projects. This year fruit and vegetable research, demonstra-tion plots were conducted in 13 counties in Kentucky: Bath, Boone, Boyle, Breckinridge, Jessamine, Kenton, Laurel, Lewis, Lincoln, Marshal, McCracken, Metcalfe and Shelby. Research was conducted by faculty and staff from the Horticulture and Plant Pathology Departments in the University of Kentucky College of Agriculture, Food and Environment. Faculty and staff of Kentucky State University also contributed to this re-port.
Variety trials included in this year’s publication include bell peppers, blackberries, broccoli, Brussels sprouts, cauliflower, green beans, and haskap berries. Additional research trials in-clude rootstock effects on apple and peach tree growth and yield, small scale equipment to optimize tomato disease man-agement, sustainable production of living organic container-grown kitchen herbs, timing of bark inlay grafting of pawpaw as it affects success rate, parasitoid wasps associated with blackberries bordered by native perennial plants versus pas-ture borders, an investigation of the impact of Soil-Set®, Grain-Set®, and Liqui-Plex® formulations on hot pepper yield, and evaluation of soil amended with organic manure as it affected antioxidant content of arugula and mustard greens. Evaluation of varieties is a continuing necessity and allows us to provide the most up to date information in communications with veg-etable growers. The vegetable variety trial results are the basis for updating the recommendations in our Vegetable Produc-tion Guide for Commercial Growers (ID-36). These updates are not based solely on one season’s data or location. It is nec-essary to trial varieties in multiple seasons and if at all possible, multiple locations. We may also collaborate with researchers in surrounding states such as Ohio, Indiana, and Tennessee to discuss results of variety trials they have conducted. The re-sults presented in this publication often reflect a single year of data at a limited number of locations. Although some varieties perform well across Kentucky year after year, others may not. Following are some helpful guidelines for interpreting the re-sults of fruit and vegetable variety trials.
Our Yields vs. Your YieldsYields reported in variety trial results are extrapolated from
small plots. Depending on the crop, individual plots range from 1 to 200 plants. Our yields are calculated by multiply-ing the yields in these small plots by correction factors to esti-mate per-acre yield. For example, if you can plant 4,200 tomato plants per acre (assuming 18” within row spacing) and our tri-
als only have 10 plants per plot, we must multiply our average plot yields by a factor of 420 to calculate per-acre yields. Thus, small errors can be greatly amplified. Due to the availability of labor, research plots may be harvested more often than would be economically possible. Keep this in mind when reviewing the research papers in this publication.
StatisticsOften yield or quality data will be presented in tables fol-
lowed by a series of letters (a, ab, bc, etc.). These letters indicate whether the yields of the varieties are statistically different. Two varieties may have average yields that are numerically dif-ferent, but statistically are the same. For example, if tomato va-riety 1 has an average yield of 2,000 boxes per acre, and variety 2 yields 2,300 boxes per acre, one would assume that variety 2 had a greater yield. However, just because the two varieties had different average yields does not mean that they are statis-tically or significantly different. In the tomato example, variety 1 may have consisted of four plots with yields of 1,800; 1,900; 2,200; and 2,100 boxes per acre. The average yield would then be 2,000 boxes per acre. Tomato variety 2 may have had four plots with yields of 1,700; 2,500; 2,800; and 2,200 boxes per acre. The four plots together would average 2,300 boxes per acre. The tomato varieties have plots with yield averages that overlap, and therefore would not be considered statistically different, even though the average per acre yields for the two varieties appear to be quite different. This example also dem-onstrates variability. Good varieties are those that not only yield well but have little variation. Tomato variety 2 may have had yields similar to variety 1 but also much greater variation. Therefore, all other things being equal, tomato variety 1 may be a better choice due to less variation in the field.
Statistical significance is shown in tables by the letters that follow a given number. For example, when two varieties have yields followed by completely different letters, they are signifi-cantly different; however, if they share even one letter, statisti-cally they are no different. Thus a variety with a yield that is fol-lowed by the letters “bcd” would be no different than a variety followed by the letters “cdef,” because the letters “c” and “d” are shared by the two varieties. Yield data followed by the letters “abc” would be different from yield data followed by “efg.”
When determining statistical significance we typically use a P value of 0.05. In this case, P stands for probability. If two varieties are said to be different at P <0.05, then at least 95 per-cent of the time those varieties will be different. If the P value is 0.01, then 99 percent of the time those varieties will be dif-ferent. Different P values can be used, but typically P <0.05 is considered standard practice for agricultural research.
This approach may be confusing, but without statistics our results wouldn’t be useful. Using statistics ensures that we can make more accurate recommendations for farmers in Kentucky.
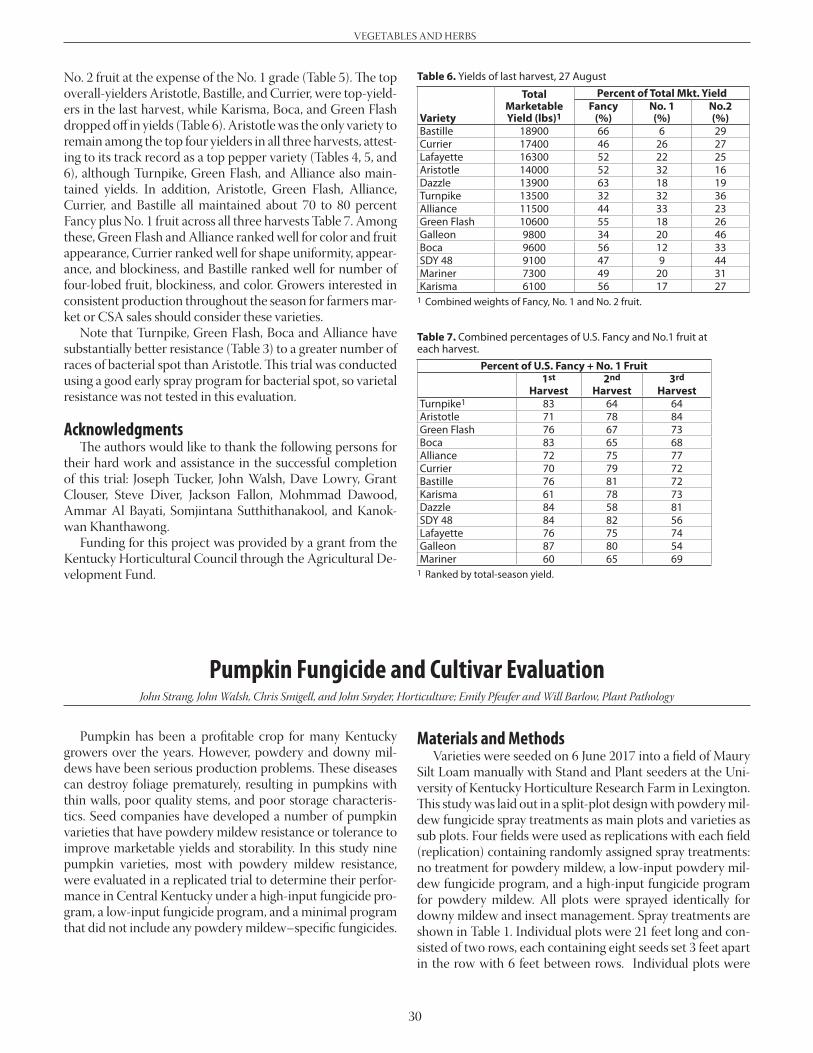
The 2017 Fruit and Vegetable Crops Research ProgramJohn Strang, Horticulture
6
DEMONSTRATIONS
IntroductionIn 2017, three on-farm commercial vegetable
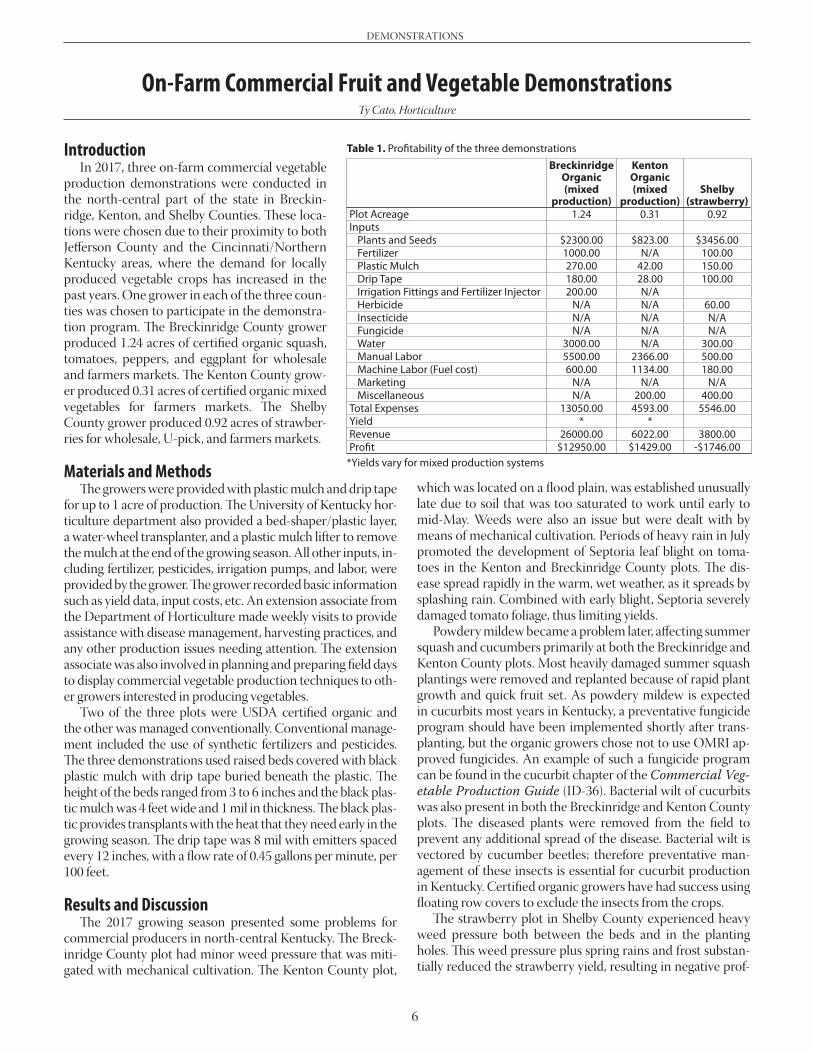
production demonstrations were conducted in the north-central part of the state in Breckin-ridge, Kenton, and Shelby Counties. These loca-tions were chosen due to their proximity to both Jefferson County and the Cincinnati/Northern Kentucky areas, where the demand for locally produced vegetable crops has increased in the past years. One grower in each of the three coun-ties was chosen to participate in the demonstra-tion program. The Breckinridge County grower produced 1.24 acres of certified organic squash, tomatoes, peppers, and eggplant for wholesale and farmers markets. The Kenton County grow-er produced 0.31 acres of certified organic mixed vegetables for farmers markets. The Shelby County grower produced 0.92 acres of strawber-ries for wholesale, U-pick, and farmers markets.
Materials and MethodsThe growers were provided with plastic mulch and drip tape
for up to 1 acre of production. The University of Kentucky hor-ticulture department also provided a bed-shaper/plastic layer, a water-wheel transplanter, and a plastic mulch lifter to remove the mulch at the end of the growing season. All other inputs, in-cluding fertilizer, pesticides, irrigation pumps, and labor, were provided by the grower. The grower recorded basic information such as yield data, input costs, etc. An extension associate from the Department of Horticulture made weekly visits to provide assistance with disease management, harvesting practices, and any other production issues needing attention. The extension associate was also involved in planning and preparing field days to display commercial vegetable production techniques to oth-er growers interested in producing vegetables.
Two of the three plots were USDA certified organic and the other was managed conventionally. Conventional manage-ment included the use of synthetic fertilizers and pesticides. The three demonstrations used raised beds covered with black plastic mulch with drip tape buried beneath the plastic. The height of the beds ranged from 3 to 6 inches and the black plas-tic mulch was 4 feet wide and 1 mil in thickness. The black plas-tic provides transplants with the heat that they need early in the growing season. The drip tape was 8 mil with emitters spaced every 12 inches, with a flow rate of 0.45 gallons per minute, per 100 feet.
Results and DiscussionThe 2017 growing season presented some problems for
commercial producers in north-central Kentucky. The Breck-inridge County plot had minor weed pressure that was miti-gated with mechanical cultivation. The Kenton County plot,
Table 1. Profitability of the three demonstrationsBreckinridge
On-Farm Commercial Fruit and Vegetable DemonstrationsTy Cato, Horticulture
which was located on a flood plain, was established unusually late due to soil that was too saturated to work until early to mid-May. Weeds were also an issue but were dealt with by means of mechanical cultivation. Periods of heavy rain in July promoted the development of Septoria leaf blight on toma-toes in the Kenton and Breckinridge County plots. The dis-ease spread rapidly in the warm, wet weather, as it spreads by splashing rain. Combined with early blight, Septoria severely damaged tomato foliage, thus limiting yields.
Powdery mildew became a problem later, affecting summer squash and cucumbers primarily at both the Breckinridge and Kenton County plots. Most heavily damaged summer squash plantings were removed and replanted because of rapid plant growth and quick fruit set. As powdery mildew is expected in cucurbits most years in Kentucky, a preventative fungicide program should have been implemented shortly after trans-planting, but the organic growers chose not to use OMRI ap-proved fungicides. An example of such a fungicide program can be found in the cucurbit chapter of the Commercial Veg-etable Production Guide (ID-36). Bacterial wilt of cucurbits was also present in both the Breckinridge and Kenton County plots. The diseased plants were removed from the field to prevent any additional spread of the disease. Bacterial wilt is vectored by cucumber beetles; therefore preventative man-agement of these insects is essential for cucurbit production in Kentucky. Certified organic growers have had success using floating row covers to exclude the insects from the crops.
The strawberry plot in Shelby County experienced heavy weed pressure both between the beds and in the planting holes. This weed pressure plus spring rains and frost substan-tially reduced the strawberry yield, resulting in negative prof-
7
DEMONSTRATIONS
its for the grower. Plasticulture strawberry production success requires a high level of grower management skill and decent weather in early spring and during harvest because of the high input costs. Most experienced plasticulture strawberry grow-ers did not do well this season because of frost losses and rain during harvest that resulted in fruit decay despite good spray programs.
Profitability of the three demonstrations varied greatly. Diminished yields due to biotic factors contributed to nega-tive profits for the Shelby County strawberry grower (Table 1). Initial start-up costs for the conventional strawberry grower greatly reduced profitability as well. These initial costs were for one-time investments (e.g. equipment) that could be am-ortized over the life of the product, thus leading to increased profits in the years to come. The most profitable plots, based on size and return, were the Breckinridge and Kenton County certified organic operations.
8
TREE AND SMALL FRUITS
Fruiting Characteristics of Three Primocane-fruiting Blackberry Selections at Kentucky State University
Jeremiah D. Lowe, Sheri B. Crabtree, and Kirk W. Pomper, College of Agriculture, Food Science, and Sustainable Systems, Kentucky State University; John R. Clark, Horticulture, University of Arkansas; and John G. Strang, Horticulture, University of Kentucky
IntroductionIn Kentucky, over 670 farms grow berry crops, including
blackberries, valued at over $2,600,000 annually (Census of Agriculture, 2012). Kentucky’s climate is well suited for black-berry production.
Two cane types exist within brambles: primocanes (or first-year canes), which are usually vegetative, and floricanes, which are the same canes, flowering and producing fruit the next growing season. Primocane-fruiting blackberries have the po-tential to produce two crops per year, with a normal summer crop (floricane) and a later crop on the current season primo-canes. These flower and fruit from mid-summer until frost, depending on temperature, plant health, and the location in which they are grown. Growers can reduce pruning costs by mowing canes in late winter to obtain a primocane crop only; this also provides anthracnose, cane blight, and red-necked cane borer control without pesticides. Relying only on a pri-mocane crop also avoids potential winter injury of floricanes. However, later ripening blackberries are more prone to spot-ted wing drosophila infestations and growers that are market-ing the berries will need to maintain a spray program.
The first commercially available primocane-fruiting black-berry varieties, ‘Prime-Jim®’ and ‘Prime-Jan®,’ were released by the University of Arkansas in 2004 (Clark et al., 2005; Clark 2008). ‘Black MagicTM’ is a thorny, primocane-fruiting selec-tion suited for home growers and on-farm sales (Clark et al., 2014). ‘Prime-Ark®45,’ released in 2009 for commercial use, has improved heat tolerance and shipping traits compared to previous selections (Clark and Perkins-Veazie, 2011). ‘Prime-Ark® Freedom’ was the first thornless primocane-fruiting blackberry and produces large fruit but displays inferior ship-ping traits compared to ‘Prime-Ark® 45’ (Clark, 2014). ‘Prime-Ark® Traveler’, also a thornless primocane-fruiting selection, has improved storage and shipping characteristics compared to ‘Prime-Ark® Freedom’ and is also recommended for com-mercial production (Clark and Salgado, 2016). In fall 2017, APF-205T was released as ‘Stark® Black Gem®’.
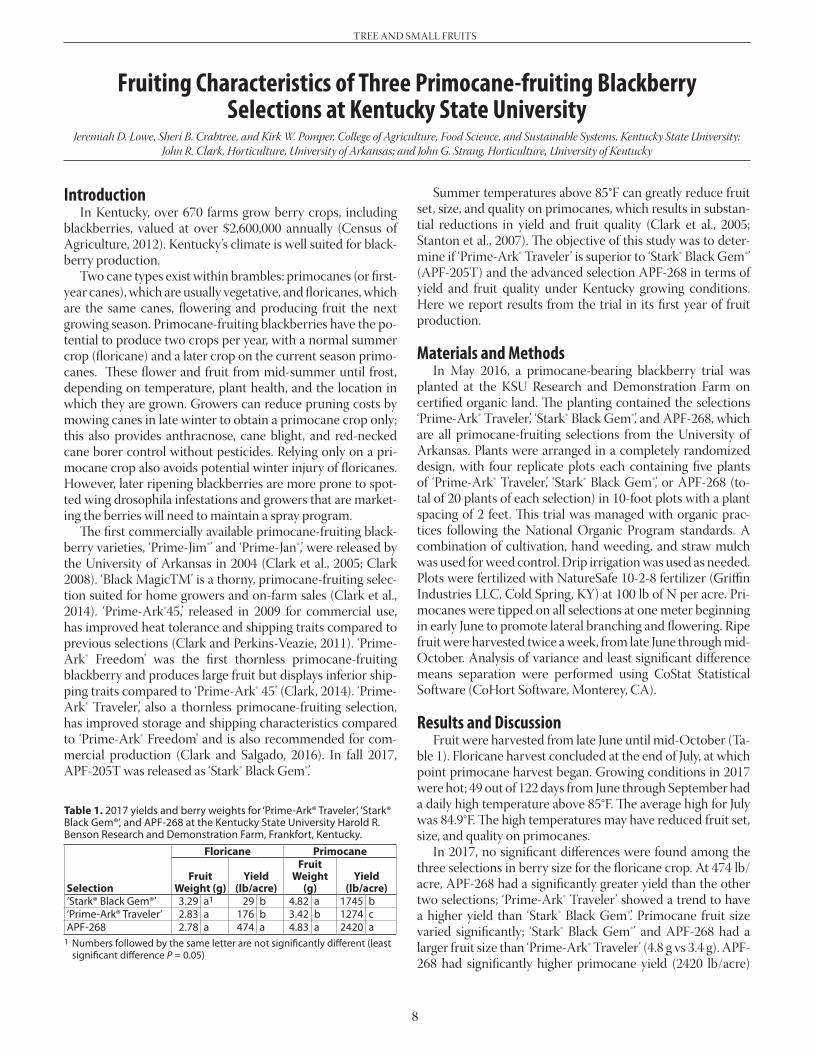
Table 1. 2017 yields and berry weights for ‘Prime-Ark® Traveler’, ‘Stark® Black Gem®’, and APF-268 at the Kentucky State University Harold R. Benson Research and Demonstration Farm, Frankfort, Kentucky.
Selection
Floricane Primocane
Fruit Weight (g)
Yield(lb/acre)
Fruit Weight
(g)Yield
(lb/acre)‘Stark® Black Gem®’ 3.29 a1 29 b 4.82 a 1745 b‘Prime-Ark® Traveler’ 2.83 a 176 b 3.42 b 1274 cAPF-268 2.78 a 474 a 4.83 a 2420 a
1 Numbers followed by the same letter are not significantly different (least significant difference P = 0.05)
Summer temperatures above 85°F can greatly reduce fruit set, size, and quality on primocanes, which results in substan-tial reductions in yield and fruit quality (Clark et al., 2005; Stanton et al., 2007). The objective of this study was to deter-mine if ‘Prime-Ark® Traveler’ is superior to ‘Stark® Black Gem®’ (APF-205T) and the advanced selection APF-268 in terms of yield and fruit quality under Kentucky growing conditions. Here we report results from the trial in its first year of fruit production.
Materials and MethodsIn May 2016, a primocane-bearing blackberry trial was
planted at the KSU Research and Demonstration Farm on certified organic land. The planting contained the selections ‘Prime-Ark® Traveler’, ‘Stark® Black Gem®’, and APF-268, which are all primocane-fruiting selections from the University of Arkansas. Plants were arranged in a completely randomized design, with four replicate plots each containing five plants of ‘Prime-Ark® Traveler’, ‘Stark® Black Gem®’, or APF-268 (to-tal of 20 plants of each selection) in 10-foot plots with a plant spacing of 2 feet. This trial was managed with organic prac-tices following the National Organic Program standards. A combination of cultivation, hand weeding, and straw mulch was used for weed control. Drip irrigation was used as needed. Plots were fertilized with NatureSafe 10-2-8 fertilizer (Griffin Industries LLC, Cold Spring, KY) at 100 lb of N per acre. Pri-mocanes were tipped on all selections at one meter beginning in early June to promote lateral branching and flowering. Ripe fruit were harvested twice a week, from late June through mid-October. Analysis of variance and least significant difference means separation were performed using CoStat Statistical Software (CoHort Software, Monterey, CA).
Results and DiscussionFruit were harvested from late June until mid-October (Ta-
ble 1). Floricane harvest concluded at the end of July, at which point primocane harvest began. Growing conditions in 2017 were hot; 49 out of 122 days from June through September had a daily high temperature above 85°F. The average high for July was 84.9°F. The high temperatures may have reduced fruit set, size, and quality on primocanes.
In 2017, no significant differences were found among the three selections in berry size for the floricane crop. At 474 lb/acre, APF-268 had a significantly greater yield than the other two selections; ‘Prime-Ark® Traveler’ showed a trend to have a higher yield than ‘Stark® Black Gem®’. Primocane fruit size varied significantly; ‘Stark® Black Gem®’ and APF-268 had a larger fruit size than ‘Prime-Ark® Traveler’ (4.8 g vs 3.4 g). APF-268 had significantly higher primocane yield (2420 lb/acre)
9
TREE AND SMALL FRUITS
whereas ‘Prime-Ark® Traveler’ had the lowest yield (1274 lb/acre) and ‘Stark® Black Gem®’ was between the two.
The University of Arkansas Blackberry Breeding Program recommends that commercial producers plant ‘Prime-Ark® Traveler’ due to its superior shipping and storage qualities. Due to softer fruit, ‘Stark® Black Gem®’ is recommended for pick-your-own (also called U-pick) and on-farm sales as well as for home gardens. Year-to-year yield characteristics will need to be evaluated further; however, the first-year data sug-gest that ‘Stark® Black Gem®’ has large fruit and yields well in Kentucky and should be considered by growers interested in producing primocane fruiting blackberries for markets with little shipping.
Literature CitedClark, J.R. 2014. ‘Prime-Ark® Freedom’ primocane-fruiting
Clark, J.R., J.N. Moore, J. Lopez-Medina, C. Finn, P. Perkins-Veazie. 2005. ‘Prime-Jan’ (‘APF-8’) and ‘Prime-Jim’ (‘APF-12’) primocane-fruiting blackberries. HortScience 40:852-855.
Clark, J.R. and P. Perkins-Veazie. 2011. ‘APF-45’ primocane-fruiting blackberry. HortScience 46:670-673.
Clark, J.R., K. Demchak, C.E. Finn, J.D. Lowe, K.W. Pomper, S.B. Crabtree. 2014. ‘Black MagicTM’ (APF-77) primocane-fruiting blackberry. Journal of the American Pomological Society 68:163-170.
Clark, J.R. and A. Salgado. 2016. ‘Prime-Ark® Traveler’ primo-cane-fruiting thornless blackberry for the commercial ship-ping market. HortScience 51(10):1287-1293.
Stanton, M.A., J.C. Scheerens, R.C. Funt, and J.R. Clark. 2007. Floral competence of primocane-fruiting blackberries prime-jan and prime-jim grown at three temperature regi-mens. HortScience 42:508-513.
Erect Thornless Blackberry Cultivar TrialDwight Wolfe, June Johnston, and Ginny Travis, Horticulture
Introduction Blackberries are an important small fruit crop in Kentucky. Demand for this fruit at farmers’ markets is strong and gen-erally exceeds supply. Producers are looking for better culti-vars that are thornless, productive and have berries with good size and flavor. Resistance to orange rust and rosette are also a consideration among growers. Three thornless erect cultivars (Natchez, Osage, and Ouachita) and two selections (A-2434T and A-2491T), all from John Clark’s breeding program at the University of Arkansas, are being evaluated at the UKREC, Princeton, Kentucky.
Materials and MethodsTwenty plants each of five cultivars, Natchez, Osage,
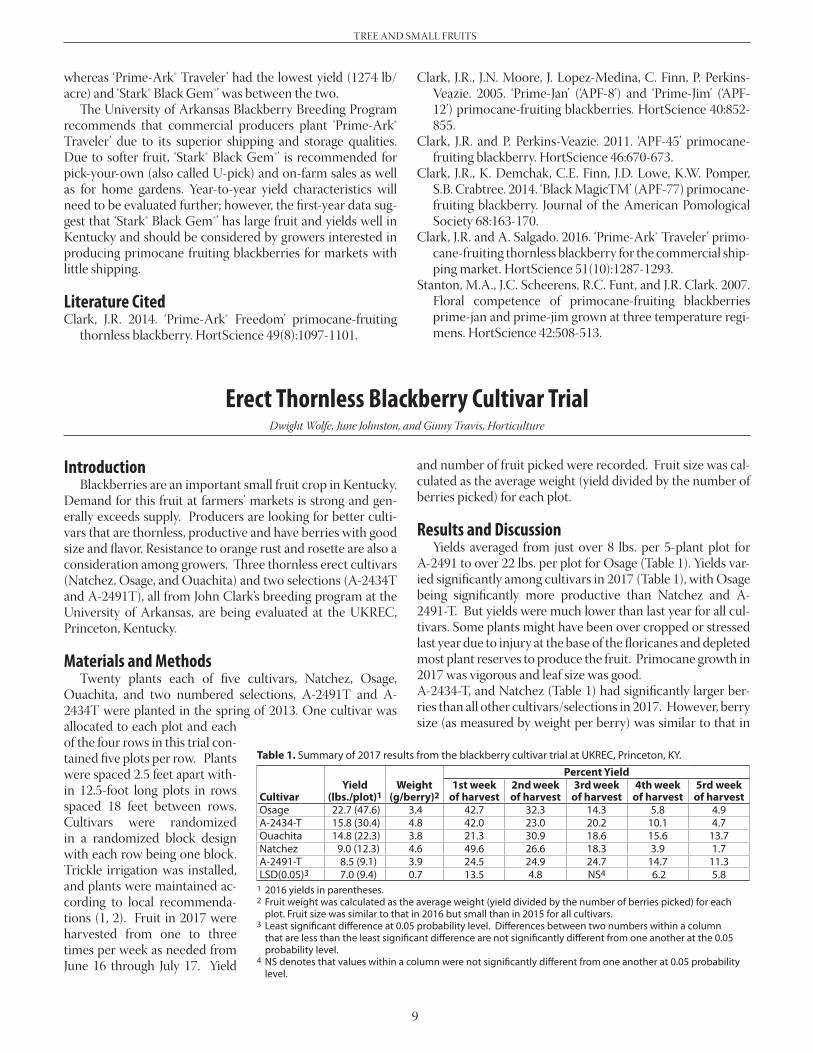
Ouachita, and two numbered selections, A-2491T and A-2434T were planted in the spring of 2013. One cultivar was allocated to each plot and each of the four rows in this trial con-tained five plots per row. Plants were spaced 2.5 feet apart with-in 12.5-foot long plots in rows spaced 18 feet between rows. Cultivars were randomized in a randomized block design with each row being one block. Trickle irrigation was installed, and plants were maintained ac-cording to local recommenda-tions (1, 2). Fruit in 2017 were harvested from one to three times per week as needed from June 16 through July 17. Yield
and number of fruit picked were recorded. Fruit size was cal-culated as the average weight (yield divided by the number of berries picked) for each plot.
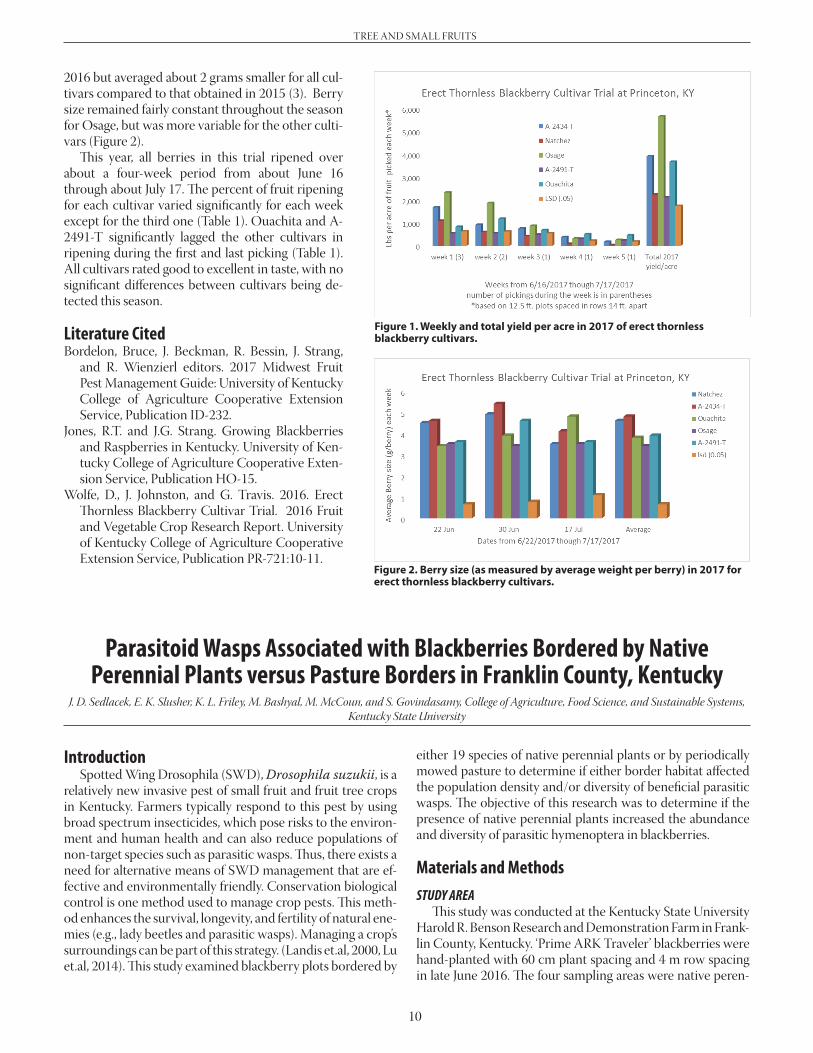
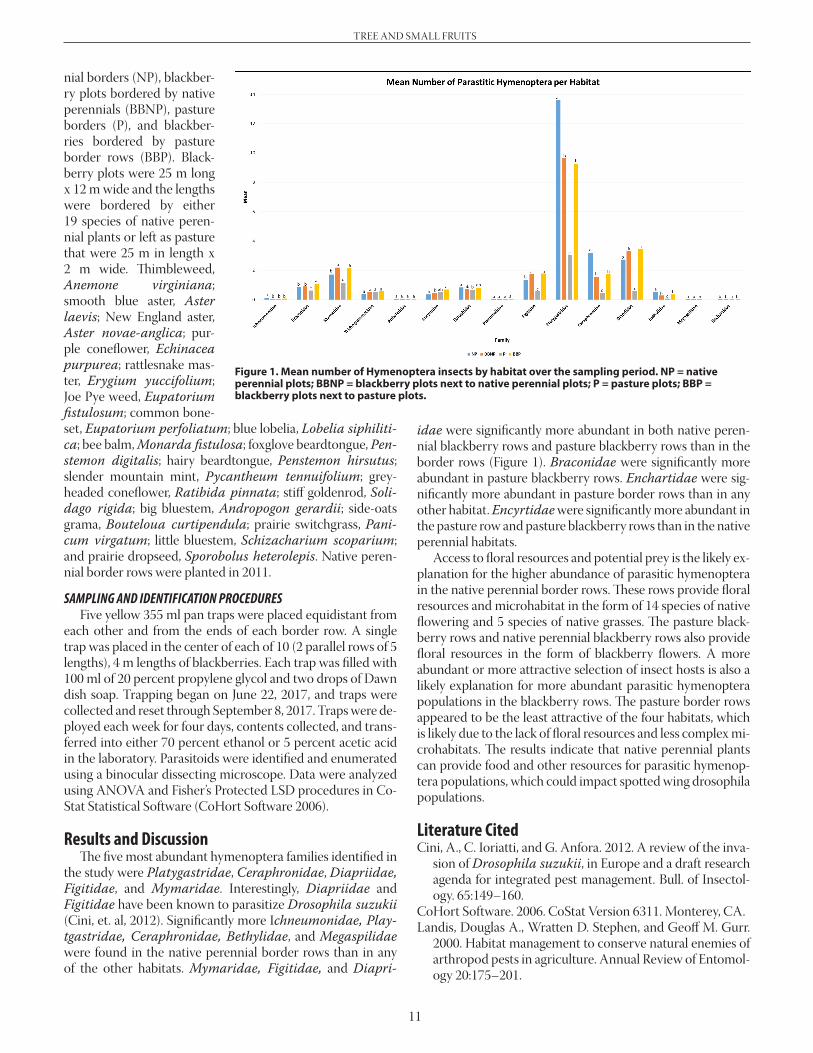
Results and Discussion Yields averaged from just over 8 lbs. per 5-plant plot for A-2491 to over 22 lbs. per plot for Osage (Table 1). Yields var-ied significantly among cultivars in 2017 (Table 1), with Osage being significantly more productive than Natchez and A-2491-T. But yields were much lower than last year for all cul-tivars. Some plants might have been over cropped or stressed last year due to injury at the base of the floricanes and depleted most plant reserves to produce the fruit. Primocane growth in 2017 was vigorous and leaf size was good.A-2434-T, and Natchez (Table 1) had significantly larger ber-ries than all other cultivars/selections in 2017. However, berry size (as measured by weight per berry) was similar to that in
Table 1. Summary of 2017 results from the blackberry cultivar trial at UKREC, Princeton, KY.
1 2016 yields in parentheses.2 Fruit weight was calculated as the average weight (yield divided by the number of berries picked) for each
plot. Fruit size was similar to that in 2016 but small than in 2015 for all cultivars. 3 Least significant difference at 0.05 probability level. Differences between two numbers within a column
that are less than the least significant difference are not significantly different from one another at the 0.05 probability level.
4 NS denotes that values within a column were not significantly different from one another at 0.05 probability level.
10
TREE AND SMALL FRUITS
Parasitoid Wasps Associated with Blackberries Bordered by Native Perennial Plants versus Pasture Borders in Franklin County, Kentucky
J. D. Sedlacek, E. K. Slusher, K. L. Friley, M. Bashyal, M. McCoun, and S. Govindasamy, College of Agriculture, Food Science, and Sustainable Systems, Kentucky State University
Introduction Spotted Wing Drosophila (SWD), Drosophila suzukii, is a relatively new invasive pest of small fruit and fruit tree crops in Kentucky. Farmers typically respond to this pest by using broad spectrum insecticides, which pose risks to the environ-ment and human health and can also reduce populations of non-target species such as parasitic wasps. Thus, there exists a need for alternative means of SWD management that are ef-fective and environmentally friendly. Conservation biological control is one method used to manage crop pests. This meth-od enhances the survival, longevity, and fertility of natural ene-mies (e.g., lady beetles and parasitic wasps). Managing a crop’s surroundings can be part of this strategy. (Landis et.al, 2000, Lu et.al, 2014). This study examined blackberry plots bordered by
either 19 species of native perennial plants or by periodically mowed pasture to determine if either border habitat affected the population density and/or diversity of beneficial parasitic wasps. The objective of this research was to determine if the presence of native perennial plants increased the abundance and diversity of parasitic hymenoptera in blackberries.
Materials and MethodsSTUDY AREA
This study was conducted at the Kentucky State University Harold R. Benson Research and Demonstration Farm in Frank-lin County, Kentucky. ‘Prime ARK Traveler’ blackberries were hand-planted with 60 cm plant spacing and 4 m row spacing in late June 2016. The four sampling areas were native peren-
Figure 1. Weekly and total yield per acre in 2017 of erect thornless blackberry cultivars.
Figure 2. Berry size (as measured by average weight per berry) in 2017 for erect thornless blackberry cultivars.
2016 but averaged about 2 grams smaller for all cul-tivars compared to that obtained in 2015 (3). Berry size remained fairly constant throughout the season for Osage, but was more variable for the other culti-vars (Figure 2). This year, all berries in this trial ripened over about a four-week period from about June 16 through about July 17. The percent of fruit ripening for each cultivar varied significantly for each week except for the third one (Table 1). Ouachita and A-2491-T significantly lagged the other cultivars in ripening during the first and last picking (Table 1). All cultivars rated good to excellent in taste, with no significant differences between cultivars being de-tected this season.
Literature CitedBordelon, Bruce, J. Beckman, R. Bessin, J. Strang,
and R. Wienzierl editors. 2017 Midwest Fruit Pest Management Guide: University of Kentucky College of Agriculture Cooperative Extension Service, Publication ID-232.
Jones, R.T. and J.G. Strang. Growing Blackberries and Raspberries in Kentucky. University of Ken-tucky College of Agriculture Cooperative Exten-sion Service, Publication HO-15.
Wolfe, D., J. Johnston, and G. Travis. 2016. Erect Thornless Blackberry Cultivar Trial. 2016 Fruit and Vegetable Crop Research Report. University of Kentucky College of Agriculture Cooperative Extension Service, Publication PR-721:10-11.
11
TREE AND SMALL FRUITS
Figure 1. Mean number of Hymenoptera insects by habitat over the sampling period. NP = native perennial plots; BBNP = blackberry plots next to native perennial plots; P = pasture plots; BBP = blackberry plots next to pasture plots.
nial borders (NP), blackber-ry plots bordered by native perennials (BBNP), pasture borders (P), and blackber-ries bordered by pasture border rows (BBP). Black-berry plots were 25 m long x 12 m wide and the lengths were bordered by either 19 species of native peren-nial plants or left as pasture that were 25 m in length x 2 m wide. Thimbleweed, Anemone virginiana; smooth blue aster, Aster laevis; New England aster, Aster novae-anglica; pur-ple coneflower, Echinacea purpurea; rattlesnake mas-ter, Erygium yuccifolium; Joe Pye weed, Eupatorium fistulosum; common bone-set, Eupatorium perfoliatum; blue lobelia, Lobelia siphiliti-ca; bee balm, Monarda fistulosa; foxglove beardtongue, Pen-stemon digitalis; hairy beardtongue, Penstemon hirsutus; slender mountain mint, Pycantheum tennuifolium; grey-headed coneflower, Ratibida pinnata; stiff goldenrod, Soli-dago rigida; big bluestem, Andropogon gerardii; side-oats grama, Bouteloua curtipendula; prairie switchgrass, Pani-cum virgatum; little bluestem, Schizacharium scoparium; and prairie dropseed, Sporobolus heterolepis. Native peren-nial border rows were planted in 2011.
SAMPLING AND IDENTIFICATION PROCEDURESFive yellow 355 ml pan traps were placed equidistant from
each other and from the ends of each border row. A single trap was placed in the center of each of 10 (2 parallel rows of 5 lengths), 4 m lengths of blackberries. Each trap was filled with 100 ml of 20 percent propylene glycol and two drops of Dawn dish soap. Trapping began on June 22, 2017, and traps were collected and reset through September 8, 2017. Traps were de-ployed each week for four days, contents collected, and trans-ferred into either 70 percent ethanol or 5 percent acetic acid in the laboratory. Parasitoids were identified and enumerated using a binocular dissecting microscope. Data were analyzed using ANOVA and Fisher’s Protected LSD procedures in Co-Stat Statistical Software (CoHort Software 2006).
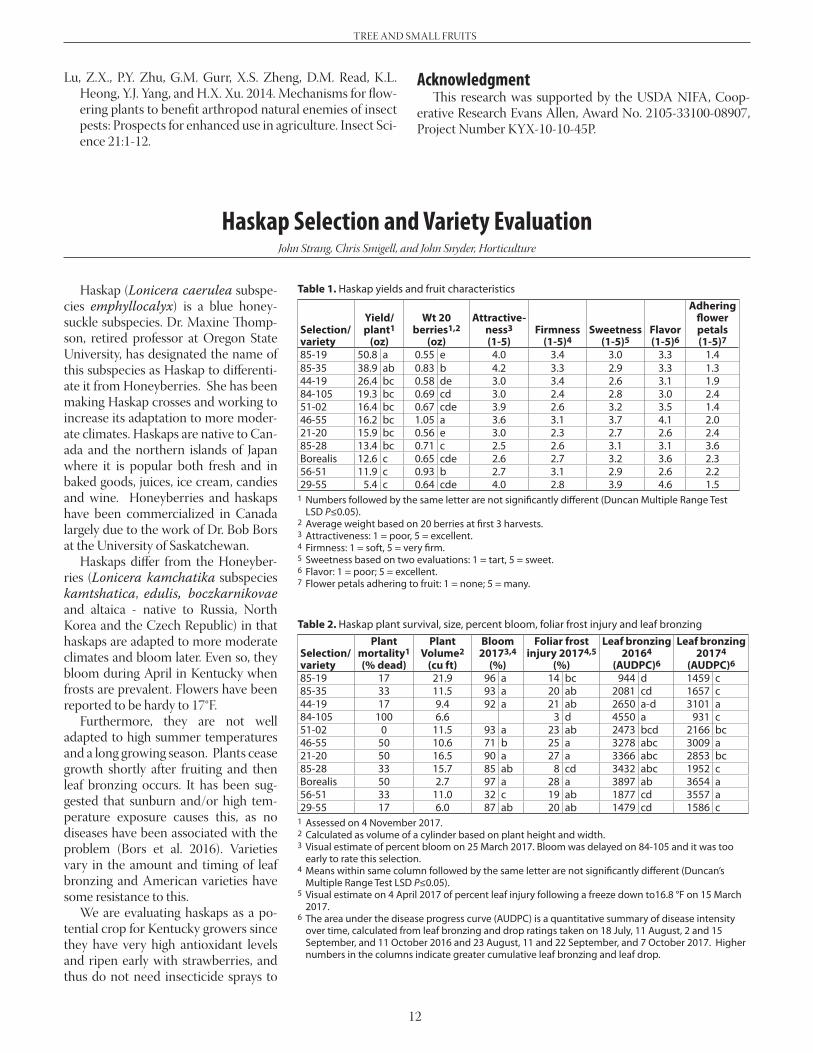
Results and Discussion The five most abundant hymenoptera families identified in the study were Platygastridae, Ceraphronidae, Diapriidae, Figitidae, and Mymaridae. Interestingly, Diapriidae and Figitidae have been known to parasitize Drosophila suzukii (Cini, et. al, 2012). Significantly more Ichneumonidae, Play-tgastridae, Ceraphronidae, Bethylidae, and Megaspilidae were found in the native perennial border rows than in any of the other habitats. Mymaridae, Figitidae, and Diapri-
idae were significantly more abundant in both native peren-nial blackberry rows and pasture blackberry rows than in the border rows (Figure 1). Braconidae were significantly more abundant in pasture blackberry rows. Enchartidae were sig-nificantly more abundant in pasture border rows than in any other habitat. Encyrtidae were significantly more abundant in the pasture row and pasture blackberry rows than in the native perennial habitats.
Access to floral resources and potential prey is the likely ex-planation for the higher abundance of parasitic hymenoptera in the native perennial border rows. These rows provide floral resources and microhabitat in the form of 14 species of native flowering and 5 species of native grasses. The pasture black-berry rows and native perennial blackberry rows also provide floral resources in the form of blackberry flowers. A more abundant or more attractive selection of insect hosts is also a likely explanation for more abundant parasitic hymenoptera populations in the blackberry rows. The pasture border rows appeared to be the least attractive of the four habitats, which is likely due to the lack of floral resources and less complex mi-crohabitats. The results indicate that native perennial plants can provide food and other resources for parasitic hymenop-tera populations, which could impact spotted wing drosophila populations.
Literature CitedCini, A., C. Ioriatti, and G. Anfora. 2012. A review of the inva-
sion of Drosophila suzukii, in Europe and a draft research agenda for integrated pest management. Bull. of Insectol-ogy. 65:149–160.
CoHort Software. 2006. CoStat Version 6311. Monterey, CA.Landis, Douglas A., Wratten D. Stephen, and Geoff M. Gurr.
2000. Habitat management to conserve natural enemies of arthropod pests in agriculture. Annual Review of Entomol-ogy 20:175–201.
12
TREE AND SMALL FRUITS
Lu, Z.X., P.Y. Zhu, G.M. Gurr, X.S. Zheng, D.M. Read, K.L. Heong, Y.J. Yang, and H.X. Xu. 2014. Mechanisms for flow-ering plants to benefit arthropod natural enemies of insect pests: Prospects for enhanced use in agriculture. Insect Sci-ence 21:1-12.
Table 1. Haskap yields and fruit characteristics
Selection/variety
Yield/plant1
(oz)
Wt 20 berries1,2
(oz)
Attractive-ness3
(1-5)Firmness
(1-5)4Sweetness
(1-5)5Flavor(1-5)6
Adhering flower petals(1-5)7
85-19 50.8 a 0.55 e 4.0 3.4 3.0 3.3 1.485-35 38.9 ab 0.83 b 4.2 3.3 2.9 3.3 1.344-19 26.4 bc 0.58 de 3.0 3.4 2.6 3.1 1.984-105 19.3 bc 0.69 cd 3.0 2.4 2.8 3.0 2.451-02 16.4 bc 0.67 cde 3.9 2.6 3.2 3.5 1.446-55 16.2 bc 1.05 a 3.6 3.1 3.7 4.1 2.021-20 15.9 bc 0.56 e 3.0 2.3 2.7 2.6 2.485-28 13.4 bc 0.71 c 2.5 2.6 3.1 3.1 3.6Borealis 12.6 c 0.65 cde 2.6 2.7 3.2 3.6 2.356-51 11.9 c 0.93 b 2.7 3.1 2.9 2.6 2.229-55 5.4 c 0.64 cde 4.0 2.8 3.9 4.6 1.5
1 Numbers followed by the same letter are not significantly different (Duncan Multiple Range Test LSD P≤0.05).
2 Average weight based on 20 berries at first 3 harvests.3 Attractiveness: 1 = poor, 5 = excellent.4 Firmness: 1 = soft, 5 = very firm.5 Sweetness based on two evaluations: 1 = tart, 5 = sweet.6 Flavor: 1 = poor; 5 = excellent.7 Flower petals adhering to fruit: 1 = none; 5 = many.
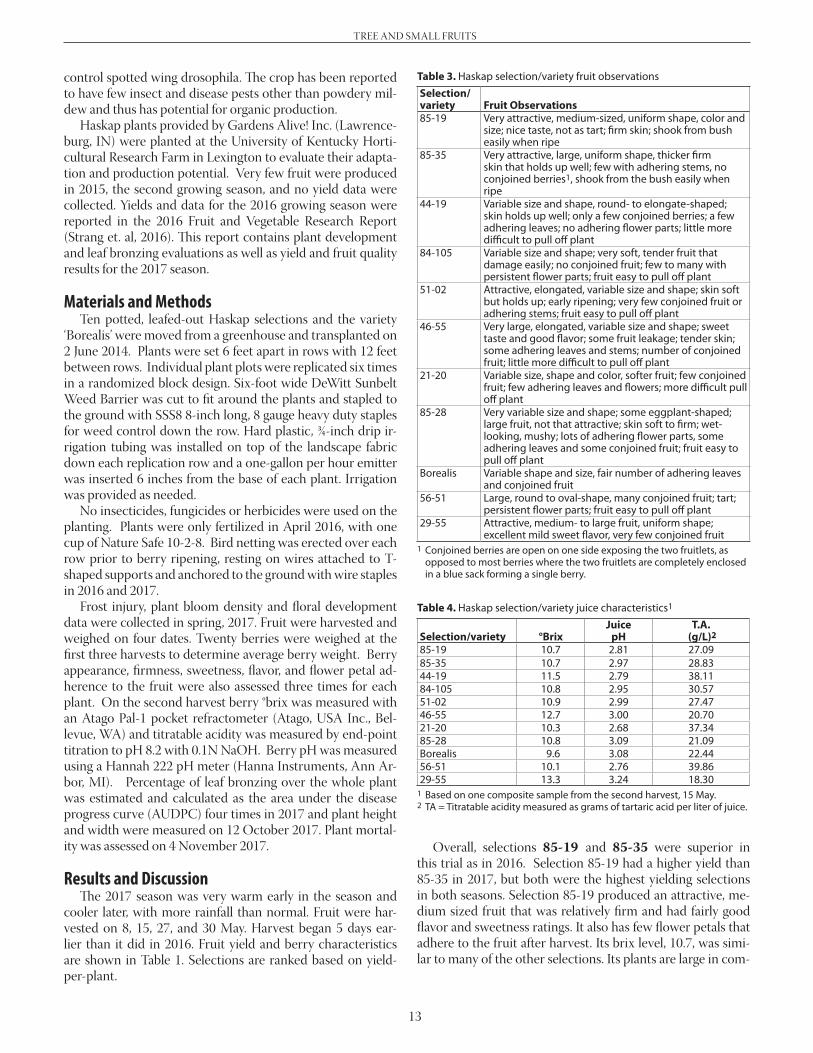
85-19 17 21.9 96 a 14 bc 944 d 1459 c85-35 33 11.5 93 a 20 ab 2081 cd 1657 c44-19 17 9.4 92 a 21 ab 2650 a-d 3101 a84-105 100 6.6 3 d 4550 a 931 c51-02 0 11.5 93 a 23 ab 2473 bcd 2166 bc46-55 50 10.6 71 b 25 a 3278 abc 3009 a21-20 50 16.5 90 a 27 a 3366 abc 2853 bc85-28 33 15.7 85 ab 8 cd 3432 abc 1952 cBorealis 50 2.7 97 a 28 a 3897 ab 3654 a56-51 33 11.0 32 c 19 ab 1877 cd 3557 a29-55 17 6.0 87 ab 20 ab 1479 cd 1586 c
1 Assessed on 4 November 2017.2 Calculated as volume of a cylinder based on plant height and width.3 Visual estimate of percent bloom on 25 March 2017. Bloom was delayed on 84-105 and it was too
early to rate this selection.4 Means within same column followed by the same letter are not significantly different (Duncan’s
Multiple Range Test LSD P≤0.05).5 Visual estimate on 4 April 2017 of percent leaf injury following a freeze down to16.8 °F on 15 March
2017.6 The area under the disease progress curve (AUDPC) is a quantitative summary of disease intensity
over time, calculated from leaf bronzing and drop ratings taken on 18 July, 11 August, 2 and 15 September, and 11 October 2016 and 23 August, 11 and 22 September, and 7 October 2017. Higher numbers in the columns indicate greater cumulative leaf bronzing and leaf drop.
Haskap Selection and Variety EvaluationJohn Strang, Chris Smigell, and John Snyder, Horticulture
AcknowledgmentThis research was supported by the USDA NIFA, Coop-
erative Research Evans Allen, Award No. 2105-33100-08907, Project Number KYX-10-10-45P.
Haskap (Lonicera caerulea subspe-cies emphyllocalyx) is a blue honey-suckle subspecies. Dr. Maxine Thomp-son, retired professor at Oregon State University, has designated the name of this subspecies as Haskap to differenti-ate it from Honeyberries. She has been making Haskap crosses and working to increase its adaptation to more moder-ate climates. Haskaps are native to Can-ada and the northern islands of Japan where it is popular both fresh and in baked goods, juices, ice cream, candies and wine. Honeyberries and haskaps have been commercialized in Canada largely due to the work of Dr. Bob Bors at the University of Saskatchewan.
Haskaps differ from the Honeyber-ries (Lonicera kamchatika subspecies kamtshatica, edulis, boczkarnikovae and altaica - native to Russia, North Korea and the Czech Republic) in that haskaps are adapted to more moderate climates and bloom later. Even so, they bloom during April in Kentucky when frosts are prevalent. Flowers have been reported to be hardy to 17°F.
Furthermore, they are not well adapted to high summer temperatures and a long growing season. Plants cease growth shortly after fruiting and then leaf bronzing occurs. It has been sug-gested that sunburn and/or high tem-perature exposure causes this, as no diseases have been associated with the problem (Bors et al. 2016). Varieties vary in the amount and timing of leaf bronzing and American varieties have some resistance to this.
We are evaluating haskaps as a po-tential crop for Kentucky growers since they have very high antioxidant levels and ripen early with strawberries, and thus do not need insecticide sprays to
13
TREE AND SMALL FRUITS
control spotted wing drosophila. The crop has been reported to have few insect and disease pests other than powdery mil-dew and thus has potential for organic production.
Haskap plants provided by Gardens Alive! Inc. (Lawrence-burg, IN) were planted at the University of Kentucky Horti-cultural Research Farm in Lexington to evaluate their adapta-tion and production potential. Very few fruit were produced in 2015, the second growing season, and no yield data were collected. Yields and data for the 2016 growing season were reported in the 2016 Fruit and Vegetable Research Report (Strang et. al, 2016). This report contains plant development and leaf bronzing evaluations as well as yield and fruit quality results for the 2017 season.
Materials and MethodsTen potted, leafed-out Haskap selections and the variety
‘Borealis’ were moved from a greenhouse and transplanted on 2 June 2014. Plants were set 6 feet apart in rows with 12 feet between rows. Individual plant plots were replicated six times in a randomized block design. Six-foot wide DeWitt Sunbelt Weed Barrier was cut to fit around the plants and stapled to the ground with SSS8 8-inch long, 8 gauge heavy duty staples for weed control down the row. Hard plastic, ¾-inch drip ir-rigation tubing was installed on top of the landscape fabric down each replication row and a one-gallon per hour emitter was inserted 6 inches from the base of each plant. Irrigation was provided as needed.
No insecticides, fungicides or herbicides were used on the planting. Plants were only fertilized in April 2016, with one cup of Nature Safe 10-2-8. Bird netting was erected over each row prior to berry ripening, resting on wires attached to T-shaped supports and anchored to the ground with wire staples in 2016 and 2017.
Frost injury, plant bloom density and floral development data were collected in spring, 2017. Fruit were harvested and weighed on four dates. Twenty berries were weighed at the first three harvests to determine average berry weight. Berry appearance, firmness, sweetness, flavor, and flower petal ad-herence to the fruit were also assessed three times for each plant. On the second harvest berry °brix was measured with an Atago Pal-1 pocket refractometer (Atago, USA Inc., Bel-levue, WA) and titratable acidity was measured by end-point titration to pH 8.2 with 0.1N NaOH. Berry pH was measured using a Hannah 222 pH meter (Hanna Instruments, Ann Ar-bor, MI). Percentage of leaf bronzing over the whole plant was estimated and calculated as the area under the disease progress curve (AUDPC) four times in 2017 and plant height and width were measured on 12 October 2017. Plant mortal-ity was assessed on 4 November 2017.
Results and DiscussionThe 2017 season was very warm early in the season and
cooler later, with more rainfall than normal. Fruit were har-vested on 8, 15, 27, and 30 May. Harvest began 5 days ear-lier than it did in 2016. Fruit yield and berry characteristics are shown in Table 1. Selections are ranked based on yield- per-plant.
Overall, selections 85-19 and 85-35 were superior in this trial as in 2016. Selection 85-19 had a higher yield than 85-35 in 2017, but both were the highest yielding selections in both seasons. Selection 85-19 produced an attractive, me-dium sized fruit that was relatively firm and had fairly good flavor and sweetness ratings. It also has few flower petals that adhere to the fruit after harvest. Its brix level, 10.7, was simi-lar to many of the other selections. Its plants are large in com-
Table 3. Haskap selection/variety fruit observationsSelection/variety Fruit Observations85-19 Very attractive, medium-sized, uniform shape, color and
size; nice taste, not as tart; firm skin; shook from bush easily when ripe
85-35 Very attractive, large, uniform shape, thicker firm skin that holds up well; few with adhering stems, no conjoined berries1, shook from the bush easily when ripe
44-19 Variable size and shape, round- to elongate-shaped; skin holds up well; only a few conjoined berries; a few adhering leaves; no adhering flower parts; little more difficult to pull off plant
84-105 Variable size and shape; very soft, tender fruit that damage easily; no conjoined fruit; few to many with persistent flower parts; fruit easy to pull off plant
51-02 Attractive, elongated, variable size and shape; skin soft but holds up; early ripening; very few conjoined fruit or adhering stems; fruit easy to pull off plant
46-55 Very large, elongated, variable size and shape; sweet taste and good flavor; some fruit leakage; tender skin; some adhering leaves and stems; number of conjoined fruit; little more difficult to pull off plant
21-20 Variable size, shape and color, softer fruit; few conjoined fruit; few adhering leaves and flowers; more difficult pull off plant
85-28 Very variable size and shape; some eggplant-shaped; large fruit, not that attractive; skin soft to firm; wet-looking, mushy; lots of adhering flower parts, some adhering leaves and some conjoined fruit; fruit easy to pull off plant
Borealis Variable shape and size, fair number of adhering leaves and conjoined fruit
56-51 Large, round to oval-shape, many conjoined fruit; tart; persistent flower parts; fruit easy to pull off plant
29-55 Attractive, medium- to large fruit, uniform shape; excellent mild sweet flavor, very few conjoined fruit
1 Conjoined berries are open on one side exposing the two fruitlets, as opposed to most berries where the two fruitlets are completely enclosed in a blue sack forming a single berry.
Table 4. Haskap selection/variety juice characteristics1
1 Based on one composite sample from the second harvest, 15 May. 2 TA = Titratable acidity measured as grams of tartaric acid per liter of juice.
14
TREE AND SMALL FRUITS
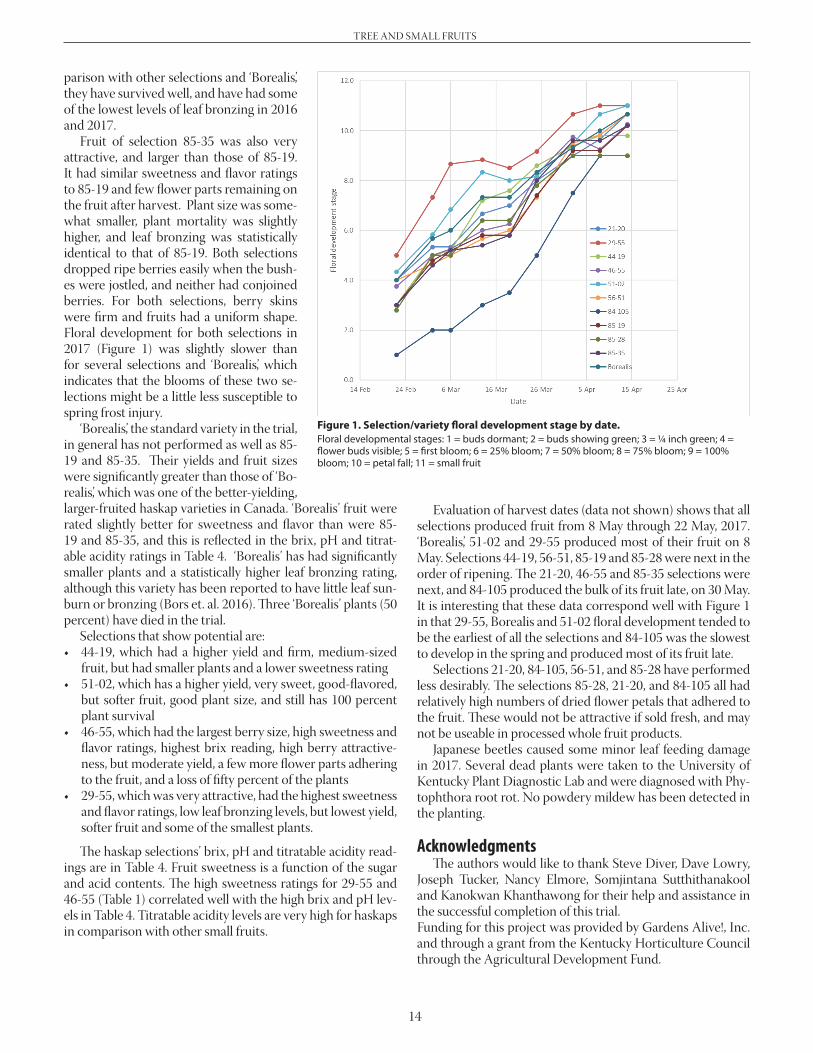
parison with other selections and ‘Borealis’, they have survived well, and have had some of the lowest levels of leaf bronzing in 2016 and 2017.
Fruit of selection 85-35 was also very attractive, and larger than those of 85-19. It had similar sweetness and flavor ratings to 85-19 and few flower parts remaining on the fruit after harvest. Plant size was some-what smaller, plant mortality was slightly higher, and leaf bronzing was statistically identical to that of 85-19. Both selections dropped ripe berries easily when the bush-es were jostled, and neither had conjoined berries. For both selections, berry skins were firm and fruits had a uniform shape. Floral development for both selections in 2017 (Figure 1) was slightly slower than for several selections and ‘Borealis’, which indicates that the blooms of these two se-lections might be a little less susceptible to spring frost injury.
‘Borealis’, the standard variety in the trial, in general has not performed as well as 85-19 and 85-35. Their yields and fruit sizes were significantly greater than those of ‘Bo-realis’, which was one of the better-yielding, larger-fruited haskap varieties in Canada. ‘Borealis’ fruit were rated slightly better for sweetness and flavor than were 85-19 and 85-35, and this is reflected in the brix, pH and titrat-able acidity ratings in Table 4. ‘Borealis’ has had significantly smaller plants and a statistically higher leaf bronzing rating, although this variety has been reported to have little leaf sun-burn or bronzing (Bors et. al. 2016). Three ‘Borealis’ plants (50 percent) have died in the trial.
Selections that show potential are: • 44-19, which had a higher yield and firm, medium-sized
fruit, but had smaller plants and a lower sweetness rating• 51-02, which has a higher yield, very sweet, good-flavored,
but softer fruit, good plant size, and still has 100 percent plant survival
• 46-55, which had the largest berry size, high sweetness and flavor ratings, highest brix reading, high berry attractive-ness, but moderate yield, a few more flower parts adhering to the fruit, and a loss of fifty percent of the plants
• 29-55, which was very attractive, had the highest sweetness and flavor ratings, low leaf bronzing levels, but lowest yield, softer fruit and some of the smallest plants.
The haskap selections’ brix, pH and titratable acidity read-ings are in Table 4. Fruit sweetness is a function of the sugar and acid contents. The high sweetness ratings for 29-55 and 46-55 (Table 1) correlated well with the high brix and pH lev-els in Table 4. Titratable acidity levels are very high for haskaps in comparison with other small fruits.
Figure 1. Selection/variety floral development stage by date.Floral developmental stages: 1 = buds dormant; 2 = buds showing green; 3 = ¼ inch green; 4 = flower buds visible; 5 = first bloom; 6 = 25% bloom; 7 = 50% bloom; 8 = 75% bloom; 9 = 100% bloom; 10 = petal fall; 11 = small fruit
Evaluation of harvest dates (data not shown) shows that all selections produced fruit from 8 May through 22 May, 2017. ‘Borealis’, 51-02 and 29-55 produced most of their fruit on 8 May. Selections 44-19, 56-51, 85-19 and 85-28 were next in the order of ripening. The 21-20, 46-55 and 85-35 selections were next, and 84-105 produced the bulk of its fruit late, on 30 May. It is interesting that these data correspond well with Figure 1 in that 29-55, Borealis and 51-02 floral development tended to be the earliest of all the selections and 84-105 was the slowest to develop in the spring and produced most of its fruit late.
Selections 21-20, 84-105, 56-51, and 85-28 have performed less desirably. The selections 85-28, 21-20, and 84-105 all had relatively high numbers of dried flower petals that adhered to the fruit. These would not be attractive if sold fresh, and may not be useable in processed whole fruit products.
Japanese beetles caused some minor leaf feeding damage in 2017. Several dead plants were taken to the University of Kentucky Plant Diagnostic Lab and were diagnosed with Phy-tophthora root rot. No powdery mildew has been detected in the planting.
Acknowledgments The authors would like to thank Steve Diver, Dave Lowry, Joseph Tucker, Nancy Elmore, Somjintana Sutthithanakool and Kanokwan Khanthawong for their help and assistance in the successful completion of this trial.Funding for this project was provided by Gardens Alive!, Inc. and through a grant from the Kentucky Horticulture Council through the Agricultural Development Fund.
15
TREE AND SMALL FRUITS
Timing of Bark Inlay Grafting of Pawpaw Affects Success RateSheri B. Crabtree, Jeremiah D. Lowe, and Kirk W. Pomper, Kentucky State University Land Grant Program, Cooperative Extension Building,
Frankfort KY 40601; and R. Neal Peterson, Peterson Pawpaws, Harpers Ferry, WV
Literature CitedBors, B., E. Sawchuk, and J. Thomson. Mildew & sunburn in
Haskap (Honeyberries). 3 October 2016. http://www.fruit.usask.ca/Documents/Haskap/MildewSun-
burnHaskap.pdfStrang, J., C. Smigell, and J. Snyder. 2016 Haskap selection and
variety evaluation. pp. 12-13. In: S. Saha, J. Snyder, C. Smigell, and J. Strang, eds. 2016 Fruit and Vegetable Research Report. Kentucky Agricultural Experiment Station publication PR-721.
IntroductionPawpaw, a tree fruit native to the eastern U.S., is in small-
scale commercial production, although its popularity is on the rise. Many small-scale farmers have seedling pawpaw trees or wild trees that produce low yields and poor quality fruit (Peterson, 2003). New commercial pawpaw varieties are available that will increase yield and fruit quality, and improve consumer opinion and demand for fruit. Currently, the most common techniques for propagating varieties of pawpaw are clonal propagation by chip budding, whip and tongue grafts, and cleft grafts (Pomper and Layne, 2005). Bark inlay graft-ing is a technique that allows the union of a rootstock limb or trunk much larger in size than the scion. This technique has not been well-developed for pawpaw and is a potential method for growers to change wild and/or seedling pawpaw trees to higher yielding, higher quality cultivars. The objective of this study was to determine the optimum timing for bark inlay grafting of pawpaw in Kentucky.
Materials and MethodsThree commercially available pawpaw cultivars with large,
high quality fruit and high yields were selected: ‘KSU-Atwood’, ‘Sunflower’, and ‘Susquehanna’. The bark inlay grafting meth-od was performed on 12- to 15-year-old mature trees. Scion wood was collected in March and stored under refrigeration until grafting. Trees approximately 2 to 3 inches in diameter were selected, and the trunk was cut at a height of approxi-mately 1 foot. Three trees of each cultivar were grafted on two dates (early and late May 2016 and 2017) at the Kentucky State University H.R. Benson Research and Demonstration Farm in Frankfort.
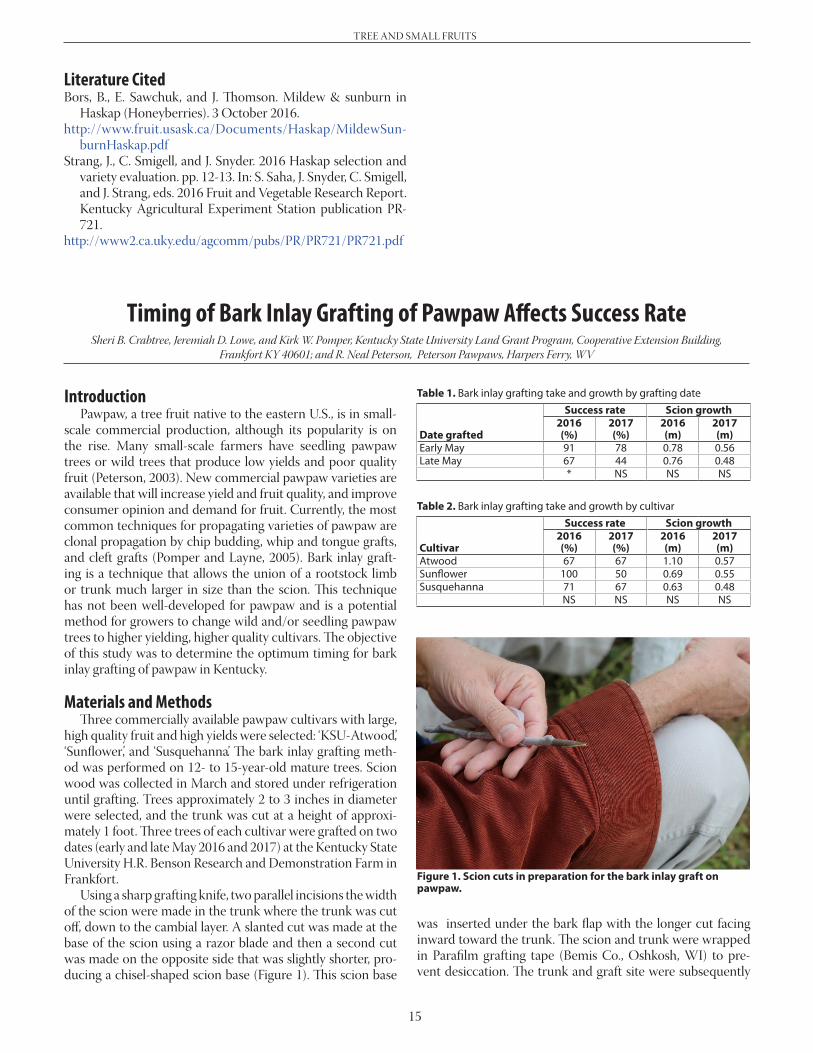
Using a sharp grafting knife, two parallel incisions the width of the scion were made in the trunk where the trunk was cut off, down to the cambial layer. A slanted cut was made at the base of the scion using a razor blade and then a second cut was made on the opposite side that was slightly shorter, pro-ducing a chisel-shaped scion base (Figure 1). This scion base
Figure 1. Scion cuts in preparation for the bark inlay graft on pawpaw.
was inserted under the bark flap with the longer cut facing inward toward the trunk. The scion and trunk were wrapped in Parafilm grafting tape (Bemis Co., Oshkosh, WI) to pre-vent desiccation. The trunk and graft site were subsequently
16
TREE AND SMALL FRUITS
wrapped in freezer tape to ensure good contact between cam-bial layers and to help support the graft union. Grafts were evaluated for survival and growth. Data were analyzed using CoStat Statistical software (CoHort Software, Monterey, CA) and subjected to analysis of variance and least significant dif-ference (LSD) means separation. Treatment means were sepa-rated based on a significance level of P < 0.05.
Results and DiscussionTrees grafted using the bark inlay method in early May
2016 (May 3) had a success rate of 91 percent, whereas trees grafted in late May (May 23) had a success rate of 67 percent (Table 1). These differences were significant. Growth was sim-ilar between the two dates, with scions grafted in early May growing an average of 0.78 m, whereas scions grafted in late May grew an average of 0.76 m. Neither graft success rate nor growth were significantly different among cultivars. Atwood grafts grew an average of 1.1 m, Sunflower 0.69 m, and Susque-hanna 0.63 m. 100 percent of Sunflower grafts were success-ful, compared to 71 percent of Susquehanna and 67 percent of Atwood (Table 2).
In 2017, pawpaw trees grafted using bark inlay in early May (May 2) had a success rate of 78 percent, compared to trees grafted in late May (May 26), which had a success rate of 44 percent. However, these differences were not statisti-cally significant. Again, growth was similar between the two
dates but was slightly lower than in 2016. Trees grafted in early May grew an average of 0.56 m, while scions grafted in late May grew an average of 0.48 m. As in 2016, neither graft suc-cess rate nor growth was significantly different among culti-vars. Both Atwood and Susquehanna had success rates of 67 percent, and 50 percent of Sunflower grafts were successful in 2017. Atwood grafts grew an average of 0.57 m, Sunflower 0.55 m, and Susquehanna grafts grew 0.48 m during the 2017 season.
Grafting success and growth may have been lower in 2017 compared to 2016 due to less desirable trees being available for grafting in 2017. Healthy, optimally sized trees were selected in 2016, therefore fewer were available in 2017, which led to some less vigorous or larger diameter rootstock trees being used. Due to a higher success rate, the recommended time for performing bark inlay grafting of pawpaw trees is early May rather than late May. Scions will continue to be evaluated for survival, growth, and precocity of fruit bearing.
Literature CitedPeterson, R.N. 2003. Pawpaw variety development: A history
and future prospects. HortTechnology 13:449–454.Pomper, K.W. and D.R. Layne. 2005. The North American
pawpaw: Botany and horticulture. Horticultural Reviews 31:351–384.
Rootstock Effects on Apple and Peach Tree Growth and YieldDwight Wolfe, Doug Archbold, June Johnston, and Ginny Travis, Horticulture
IntroductionAlthough apple and peach are the principal tree fruits
grown in Kentucky, the hot and humid summers and heavy clay soils make their production more difficult here than in some neighboring tree fruit producing regions and can lead to high disease and insect pressure in Kentucky orchards. De-spite these challenges, orchards can offer high per-acre income and are suitable for rolling hills and upland soils.
Identification of improved rootstocks and cultivars is fun-damental for advancing the Kentucky tree fruit industry. For this reason, Kentucky cooperates with researchers from 29 other states in the United States, three Canadian provinces, Mexico, and Chile in the Cooperative Regional NC-140 Proj-ect entitled, “Improving Economic and Environmental Sus-tainability in Tree Fruit Production through Changes in Root-stock Use.” The NC-140 trials are critical to Kentucky growers, allowing access to and testing of new rootstocks from around the world. The detailed and objective evaluations allow grow-ers to select the most appropriate rootstocks for Kentucky.
Materials and MethodsGrafts of known cultivars on the various rootstocks were
produced by nurseries on the West Coast and distributed to cooperators. Kentucky’s NC-140 rootstock plantings are lo-
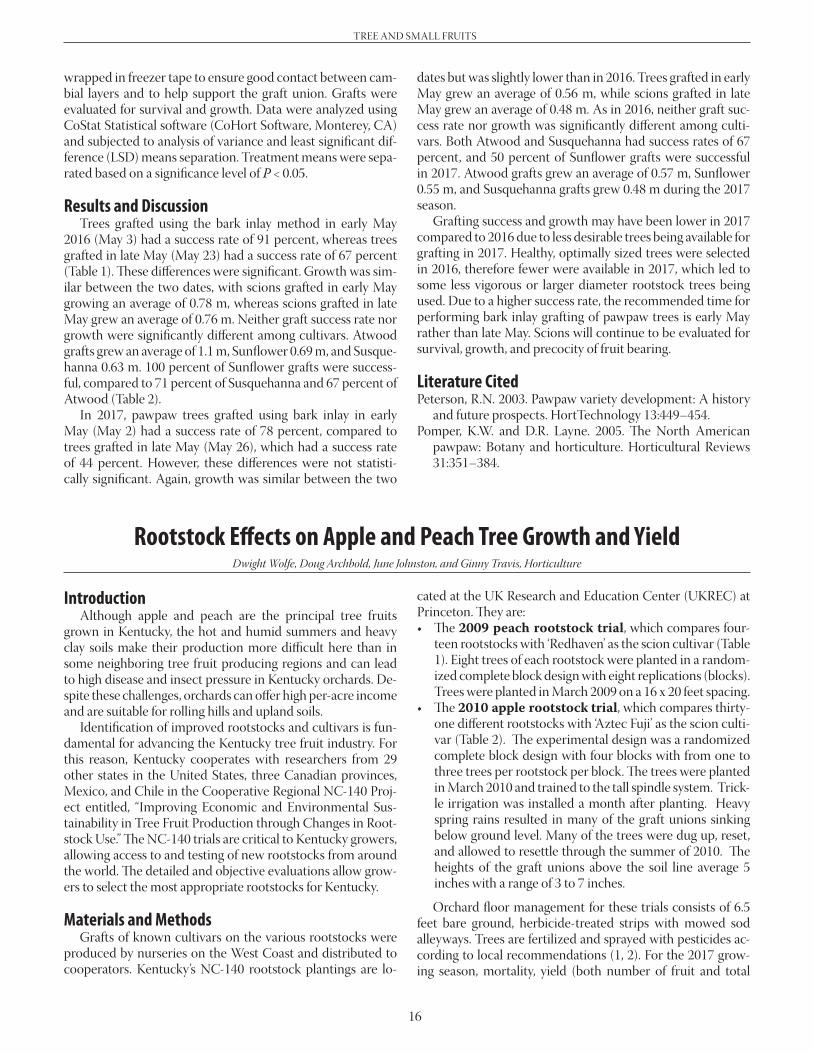
cated at the UK Research and Education Center (UKREC) at Princeton. They are: • The 2009 peach rootstock trial, which compares four-
teen rootstocks with ‘Redhaven’ as the scion cultivar (Table 1). Eight trees of each rootstock were planted in a random-ized complete block design with eight replications (blocks). Trees were planted in March 2009 on a 16 x 20 feet spacing.
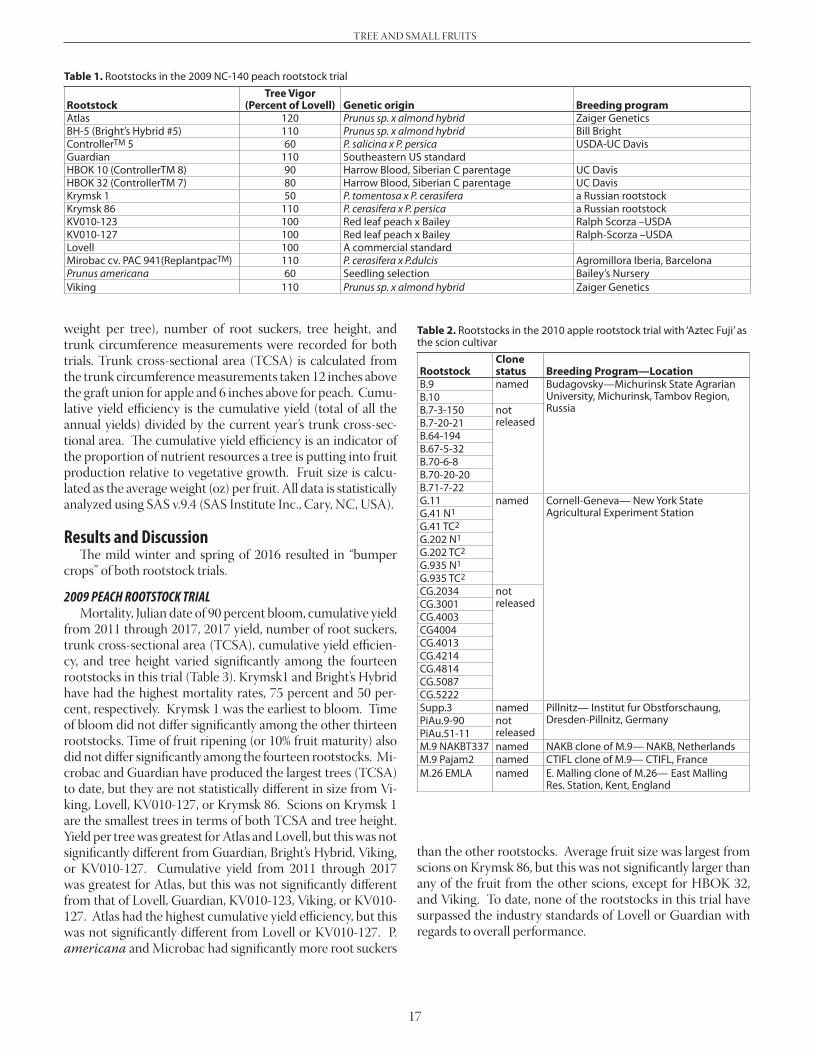
• The 2010 apple rootstock trial, which compares thirty-one different rootstocks with ‘Aztec Fuji’ as the scion culti-var (Table 2). The experimental design was a randomized complete block design with four blocks with from one to three trees per rootstock per block. The trees were planted in March 2010 and trained to the tall spindle system. Trick-le irrigation was installed a month after planting. Heavy spring rains resulted in many of the graft unions sinking below ground level. Many of the trees were dug up, reset, and allowed to resettle through the summer of 2010. The heights of the graft unions above the soil line average 5 inches with a range of 3 to 7 inches.
Orchard floor management for these trials consists of 6.5 feet bare ground, herbicide-treated strips with mowed sod alleyways. Trees are fertilized and sprayed with pesticides ac-cording to local recommendations (1, 2). For the 2017 grow-ing season, mortality, yield (both number of fruit and total
17
TREE AND SMALL FRUITS
Table 1. Rootstocks in the 2009 NC-140 peach rootstock trial
RootstockTree Vigor
(Percent of Lovell) Genetic origin Breeding programAtlas 120 Prunus sp. x almond hybrid Zaiger GeneticsBH-5 (Bright’s Hybrid #5) 110 Prunus sp. x almond hybrid Bill BrightControllerTM 5 60 P. salicina x P. persica USDA-UC DavisGuardian 110 Southeastern US standardHBOK 10 (ControllerTM 8) 90 Harrow Blood, Siberian C parentage UC DavisHBOK 32 (ControllerTM 7) 80 Harrow Blood, Siberian C parentage UC DavisKrymsk 1 50 P. tomentosa x P. cerasifera a Russian rootstockKrymsk 86 110 P. cerasifera x P. persica a Russian rootstockKV010-123 100 Red leaf peach x Bailey Ralph Scorza –USDAKV010-127 100 Red leaf peach x Bailey Ralph-Scorza –USDALovell 100 A commercial standardMirobac cv. PAC 941(ReplantpacTM) 110 P. cerasifera x P.dulcis Agromillora Iberia, BarcelonaPrunus americana 60 Seedling selection Bailey’s NurseryViking 110 Prunus sp. x almond hybrid Zaiger Genetics
Table 2. Rootstocks in the 2010 apple rootstock trial with ‘Aztec Fuji’ as the scion cultivar
RootstockClone status Breeding Program—Location
B.9 named Budagovsky—Michurinsk State Agrarian University, Michurinsk, Tambov Region, Russia
B.10B.7-3-150 not
releasedB.7-20-21B.64-194B.67-5-32B.70-6-8B.70-20-20B.71-7-22G.11 named Cornell-Geneva— New York State
Agricultural Experiment StationG.41 N1
G.41 TC2
G.202 N1
G.202 TC2
G.935 N1
G.935 TC2
CG.2034 not releasedCG.3001
CG.4003CG4004CG.4013CG.4214CG.4814CG.5087CG.5222Supp.3 named Pillnitz— Institut fur Obstforschaung,
Dresden-Pillnitz, GermanyPiAu.9-90 not releasedPiAu.51-11
M.9 NAKBT337 named NAKB clone of M.9— NAKB, NetherlandsM.9 Pajam2 named CTIFL clone of M.9— CTIFL, FranceM.26 EMLA named E. Malling clone of M.26— East Malling
Res. Station, Kent, England
weight per tree), number of root suckers, tree height, and trunk circumference measurements were recorded for both trials. Trunk cross-sectional area (TCSA) is calculated from the trunk circumference measurements taken 12 inches above the graft union for apple and 6 inches above for peach. Cumu-lative yield efficiency is the cumulative yield (total of all the annual yields) divided by the current year’s trunk cross-sec-tional area. The cumulative yield efficiency is an indicator of the proportion of nutrient resources a tree is putting into fruit production relative to vegetative growth. Fruit size is calcu-lated as the average weight (oz) per fruit. All data is statistically analyzed using SAS v.9.4 (SAS Institute Inc., Cary, NC, USA).
Results and DiscussionThe mild winter and spring of 2016 resulted in “bumper
crops” of both rootstock trials.
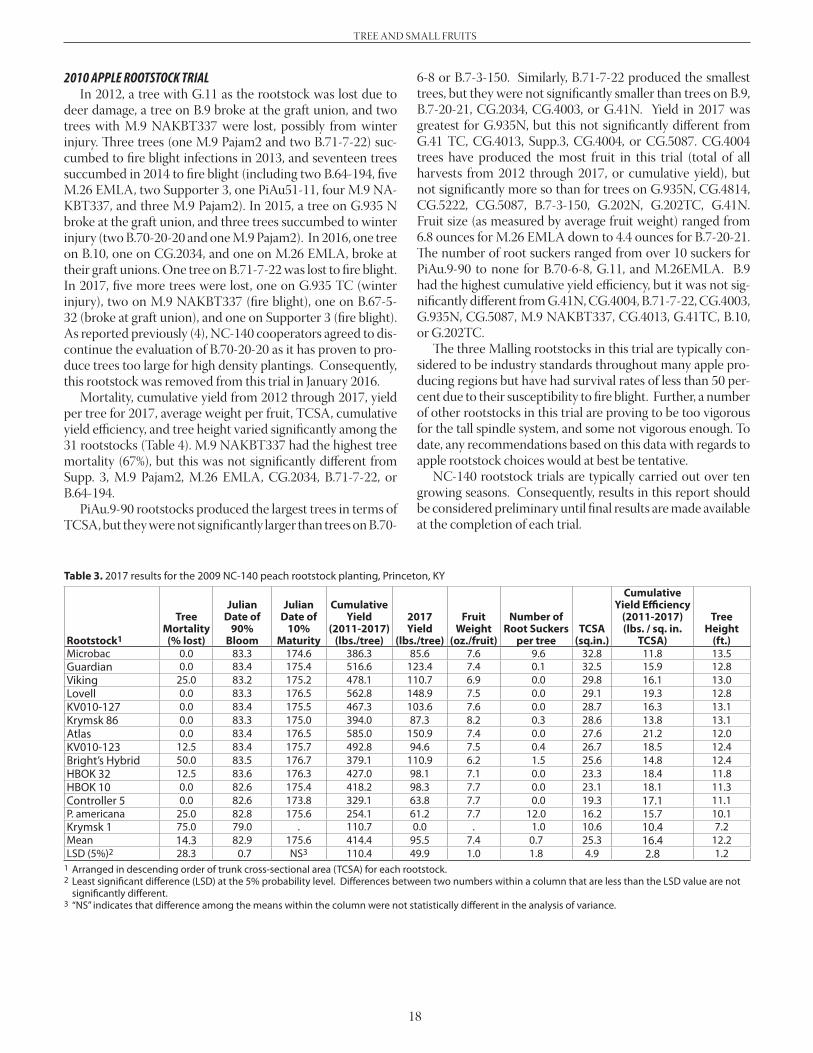
2009 PEACH ROOTSTOCK TRIALMortality, Julian date of 90 percent bloom, cumulative yield
from 2011 through 2017, 2017 yield, number of root suckers, trunk cross-sectional area (TCSA), cumulative yield efficien-cy, and tree height varied significantly among the fourteen rootstocks in this trial (Table 3). Krymsk1 and Bright’s Hybrid have had the highest mortality rates, 75 percent and 50 per-cent, respectively. Krymsk 1 was the earliest to bloom. Time of bloom did not differ significantly among the other thirteen rootstocks. Time of fruit ripening (or 10% fruit maturity) also did not differ significantly among the fourteen rootstocks. Mi-crobac and Guardian have produced the largest trees (TCSA) to date, but they are not statistically different in size from Vi-king, Lovell, KV010-127, or Krymsk 86. Scions on Krymsk 1 are the smallest trees in terms of both TCSA and tree height. Yield per tree was greatest for Atlas and Lovell, but this was not significantly different from Guardian, Bright’s Hybrid, Viking, or KV010-127. Cumulative yield from 2011 through 2017 was greatest for Atlas, but this was not significantly different from that of Lovell, Guardian, KV010-123, Viking, or KV010-127. Atlas had the highest cumulative yield efficiency, but this was not significantly different from Lovell or KV010-127. P. americana and Microbac had significantly more root suckers
than the other rootstocks. Average fruit size was largest from scions on Krymsk 86, but this was not significantly larger than any of the fruit from the other scions, except for HBOK 32, and Viking. To date, none of the rootstocks in this trial have surpassed the industry standards of Lovell or Guardian with regards to overall performance.
18
TREE AND SMALL FRUITS
2010 APPLE ROOTSTOCK TRIALIn 2012, a tree with G.11 as the rootstock was lost due to
deer damage, a tree on B.9 broke at the graft union, and two trees with M.9 NAKBT337 were lost, possibly from winter injury. Three trees (one M.9 Pajam2 and two B.71-7-22) suc-cumbed to fire blight infections in 2013, and seventeen trees succumbed in 2014 to fire blight (including two B.64-194, five M.26 EMLA, two Supporter 3, one PiAu51-11, four M.9 NA-KBT337, and three M.9 Pajam2). In 2015, a tree on G.935 N broke at the graft union, and three trees succumbed to winter injury (two B.70-20-20 and one M.9 Pajam2). In 2016, one tree on B.10, one on CG.2034, and one on M.26 EMLA, broke at their graft unions. One tree on B.71-7-22 was lost to fire blight. In 2017, five more trees were lost, one on G.935 TC (winter injury), two on M.9 NAKBT337 (fire blight), one on B.67-5-32 (broke at graft union), and one on Supporter 3 (fire blight). As reported previously (4), NC-140 cooperators agreed to dis-continue the evaluation of B.70-20-20 as it has proven to pro-duce trees too large for high density plantings. Consequently, this rootstock was removed from this trial in January 2016.
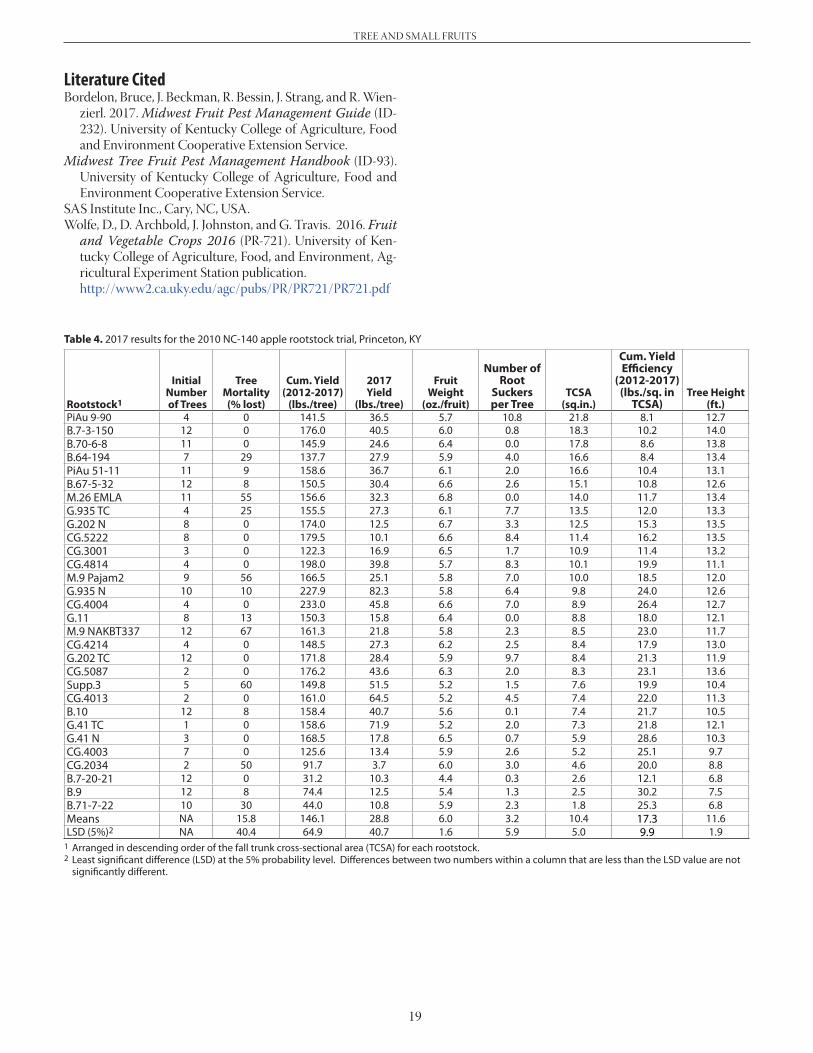
Mortality, cumulative yield from 2012 through 2017, yield per tree for 2017, average weight per fruit, TCSA, cumulative yield efficiency, and tree height varied significantly among the 31 rootstocks (Table 4). M.9 NAKBT337 had the highest tree mortality (67%), but this was not significantly different from Supp. 3, M.9 Pajam2, M.26 EMLA, CG.2034, B.71-7-22, or B.64-194.
PiAu.9-90 rootstocks produced the largest trees in terms of TCSA, but they were not significantly larger than trees on B.70-
6-8 or B.7-3-150. Similarly, B.71-7-22 produced the smallest trees, but they were not significantly smaller than trees on B.9, B.7-20-21, CG.2034, CG.4003, or G.41N. Yield in 2017 was greatest for G.935N, but this not significantly different from G.41 TC, CG.4013, Supp.3, CG.4004, or CG.5087. CG.4004 trees have produced the most fruit in this trial (total of all harvests from 2012 through 2017, or cumulative yield), but not significantly more so than for trees on G.935N, CG.4814, CG.5222, CG.5087, B.7-3-150, G.202N, G.202TC, G.41N. Fruit size (as measured by average fruit weight) ranged from 6.8 ounces for M.26 EMLA down to 4.4 ounces for B.7-20-21. The number of root suckers ranged from over 10 suckers for PiAu.9-90 to none for B.70-6-8, G.11, and M.26EMLA. B.9 had the highest cumulative yield efficiency, but it was not sig-nificantly different from G.41N, CG.4004, B.71-7-22, CG.4003, G.935N, CG.5087, M.9 NAKBT337, CG.4013, G.41TC, B.10, or G.202TC.
The three Malling rootstocks in this trial are typically con-sidered to be industry standards throughout many apple pro-ducing regions but have had survival rates of less than 50 per-cent due to their susceptibility to fire blight. Further, a number of other rootstocks in this trial are proving to be too vigorous for the tall spindle system, and some not vigorous enough. To date, any recommendations based on this data with regards to apple rootstock choices would at best be tentative.
NC-140 rootstock trials are typically carried out over ten growing seasons. Consequently, results in this report should be considered preliminary until final results are made available at the completion of each trial.
Table 3. 2017 results for the 2009 NC-140 peach rootstock planting, Princeton, KY
1 Arranged in descending order of trunk cross-sectional area (TCSA) for each rootstock.2 Least significant difference (LSD) at the 5% probability level. Differences between two numbers within a column that are less than the LSD value are not
significantly different.3 “NS” indicates that difference among the means within the column were not statistically different in the analysis of variance.
19
TREE AND SMALL FRUITS
Table 4. 2017 results for the 2010 NC-140 apple rootstock trial, Princeton, KY
1 Arranged in descending order of the fall trunk cross-sectional area (TCSA) for each rootstock.2 Least significant difference (LSD) at the 5% probability level. Differences between two numbers within a column that are less than the LSD value are not
significantly different.
Literature CitedBordelon, Bruce, J. Beckman, R. Bessin, J. Strang, and R. Wien-
zierl. 2017. Midwest Fruit Pest Management Guide (ID-232). University of Kentucky College of Agriculture, Food and Environment Cooperative Extension Service.
Midwest Tree Fruit Pest Management Handbook (ID-93). University of Kentucky College of Agriculture, Food and Environment Cooperative Extension Service.
SAS Institute Inc., Cary, NC, USA.Wolfe, D., D. Archbold, J. Johnston, and G. Travis. 2016. Fruit
and Vegetable Crops 2016 (PR-721). University of Ken-tucky College of Agriculture, Food, and Environment, Ag-ricultural Experiment Station publication. http://www2.ca.uky.edu/agc/pubs/PR/PR721/PR721.pdf
20
VEGETABLES AND HERBS
Green Bean Variety EvaluationJohn Strang, Chris Smigell, and John Snyder, Horticulture
IntroductionGreen beans are popular at most retail markets across the
state. In recent years a number of darker green bean varieties have been developed. These are often preferred by consumers. Nineteen newer, disease resistant green bean, and a few older standard varieties, as well as one purple variety were evaluated in this trial.
Materials and MethodsVarieties were planted in a field of Maury silt loam soil on
31 May at the University of Kentucky Horticultural Research Farm in Lexington. Approximately 120 seeds per variety were planted in 20-foot-long plots in rows that were 28 inches apart. Each treatment (variety) was replicated four times in a ran-domized complete block design. Fifty pounds of actual nitro-gen as urea was incorporated prior to planting. Dual II Mag-num at 1.5 pt. per acre pre-emergence herbicide was applied one day after planting. No fungicides or insecticides were ap-plied to the plot. The plot was drip-irrigated as needed. Plants were harvested by hand six times over a two–and-a-half-week period on 21, 25, 28, and 31 July, and 3 and 7 August.
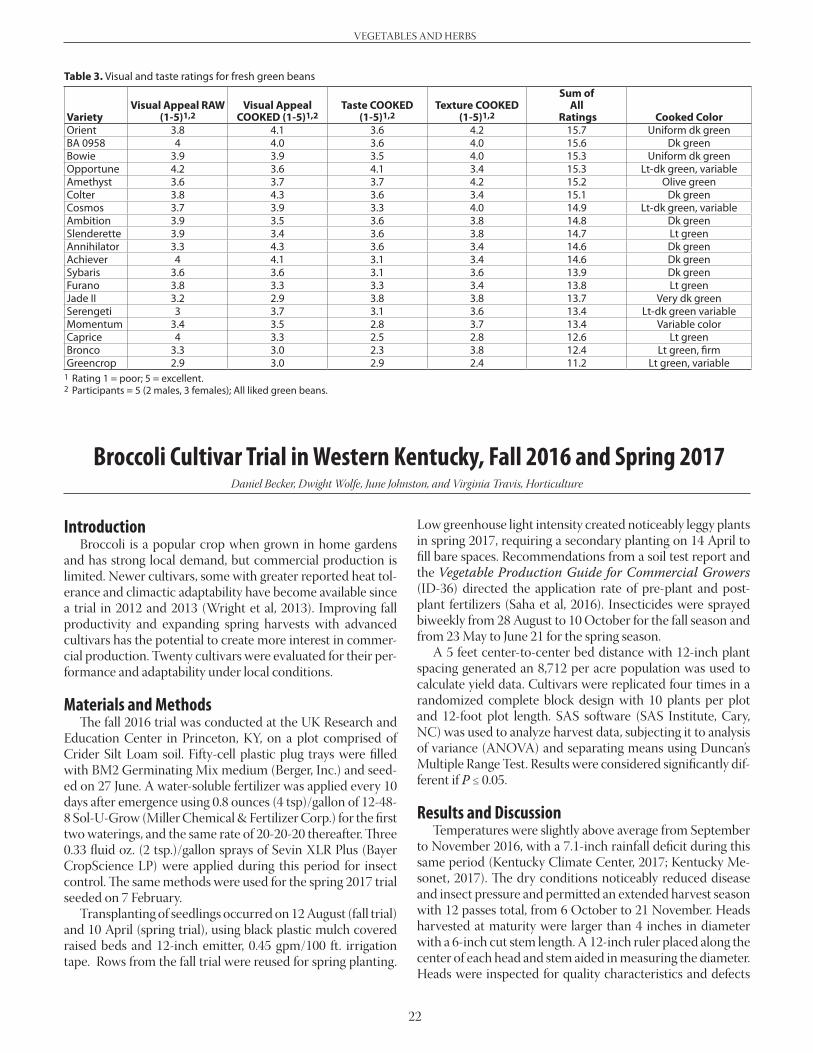
Small quantities of all varieties were harvested the after-noon of 6 August for taste evaluations. That evening approxi-mately four ounces of each variety were cooked uncovered at a medium temperature setting in 2 cups of water for 10 to 15 minutes until tender. Beans were allowed to cool to room tempera-ture, and then placed in sealable plastic bags, and refrigerated. On the morning of 7 August, the beans were placed on paper plates and five individuals (two males and three females) that liked green beans evaluated the samples for visual appeal, taste and texture.
Results and DiscussionThe 2017 growing season was
abnormally wet and cool. Most plants showed some injury from the preemergence herbicide but grew out of this. Only a few seeds of the Inspiration variety came up. It is suspected that this variety may have been more susceptible to Dual II Magnum herbicide injury than other varieties as a germination test conducted with seeds wrapped in a wet paper towel showed 60 percent germi-nation.
Table 1. Days to harvest, yields, and disease resistances
VarietySeed
SourceDays to
Harvest1
Total Yield 6 Harvests
(bu/A)2
Highest Yield 1
Harvest(bu/A)2,3
Highest Yield
Harvest(Date)
Disease Resistance (1-5)4
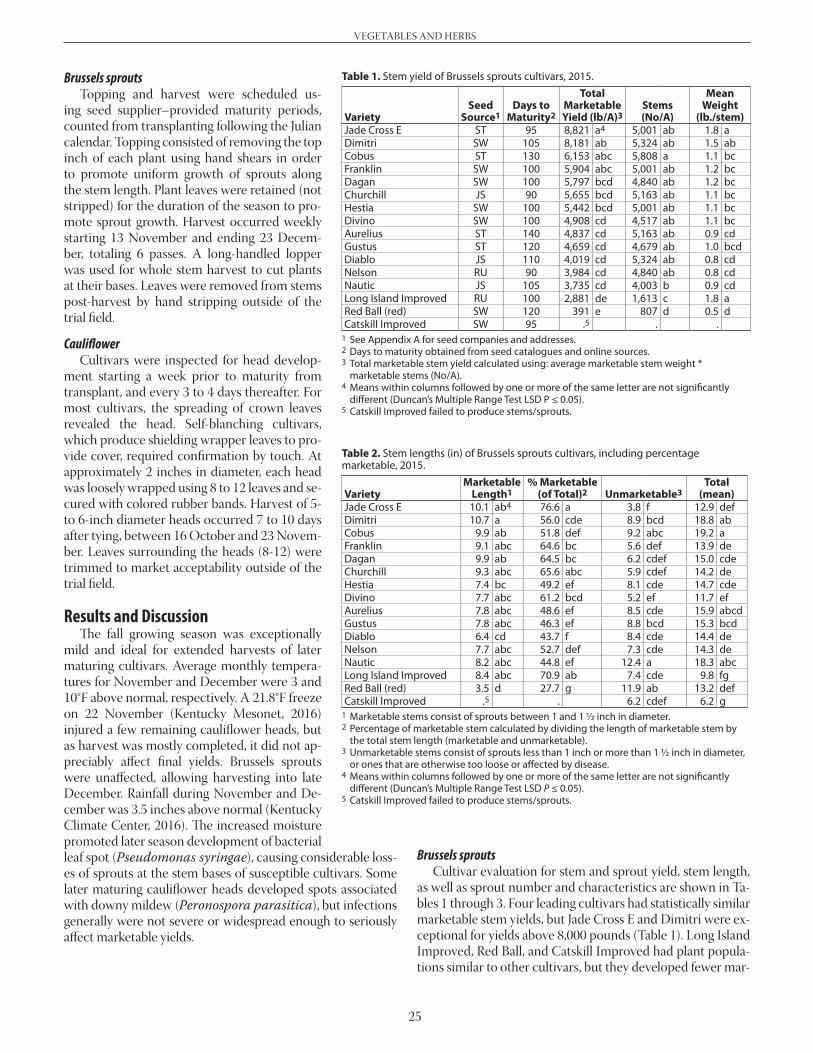
Furano ST 54 785 a 284 abc 7/25 HR: BCMVAmethyst JS 56 711 ab 239 bc 8/11 R: BCMVGreencrop SW 52 697 abc 284 abc 7/29 R: BCMVMomentum SY 56 691 abc 354 a 7/28 HR: BCMVCaprice SW 56 654 bcd 198 cd 7/29 HR: BCMV, HB, Xap; IR: BBSAchiever SW 53 632 bcde 337 ab 7/25 IR: whitefliesJade II BL 60 610 bcde 249 bc 7/25 HR: BCMV; IR: RustColter CF 53 582 cdef 218 cd 7/26 HR: BCMV, BCTV, RustOpportune SY 56 557 def 207 cd 7/28 HR: BCMVCosmos JS 56 551 defg 202 cd 7/31 HR: BCMV, BCTV; IR: BBSBowie SW 54 543 efgh 282 abc 7/28 HR: BCMV, BCTV, HB, BBS; IR: XapBronco HO 53 543 efgh 206 cd 7/28 IR: BCMVSybaris ST 56 530 efgh 187 cd 7/28 HR: BCMV; IR: Rust 90Ambition CF 54 519 efgh 217 cd 7/29 R: BCMV; IR: whitefliesBA 0958 ST 53 510 efgh 241 bc 7/29 R: BCMV; IR: BBS, root rotAnnihilator CF 54 462 fgh 197 cd 7/27 R: BCMV, BCTVOrient JS 55 427 gh 229 c 7/30 HR: BCMV, HB; IR: BBS, BCTVSerengeti SY 55 418 h 201 cd 7/31 HR: BCMVSlenderette HO 53 233 i 114 d 8/4 BCMV, BCTV, BPMV
1 Days to harvest as reported by seed companies.2 Means in the same column followed by the same letters are not significantly different (Waller-Duncan
multiple range test LSD P ≤ 0.05).3 Highest yield obtained on one harvest date.4 Disease resistance from seed company catalogues: HR = high resistance; R = resistance; IR = intermediate
resistance; BPMV = pod mottle virus; BCMV = common mosaic virus; BCTV = beet curly top virus; HB = halo blight; Xap = common bacterial blight; BBS = bacterial brown spot; Rust = common rust.
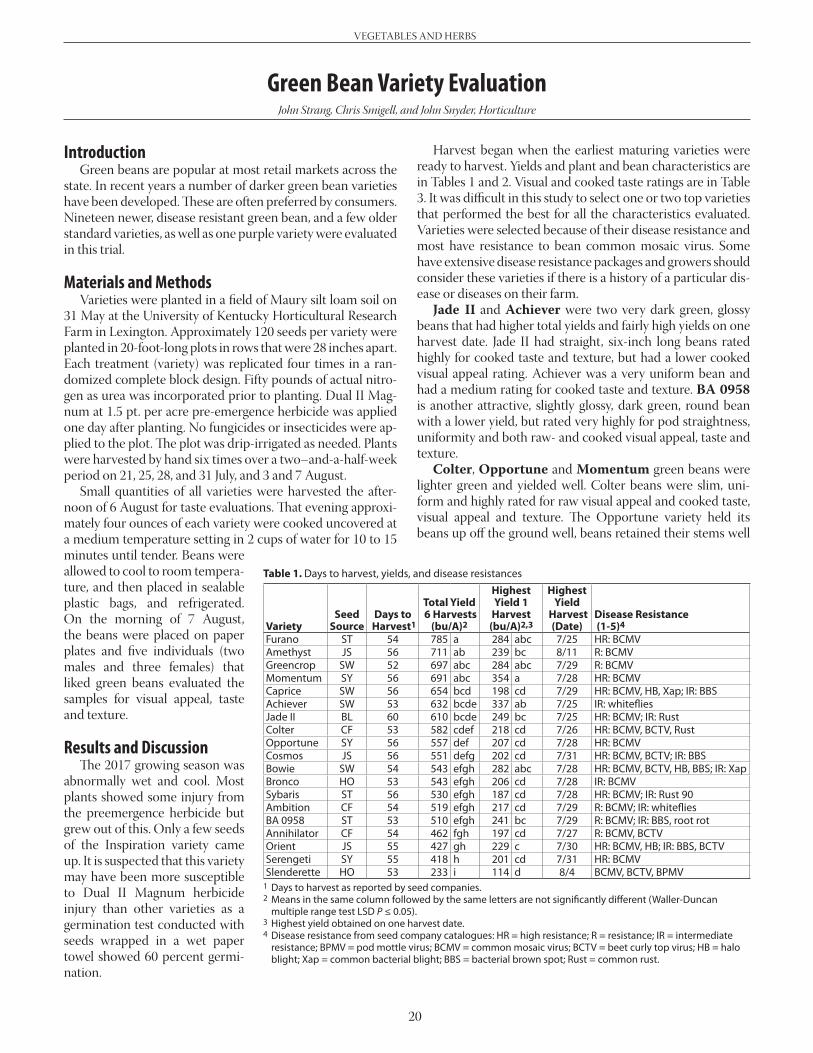
Harvest began when the earliest maturing varieties were ready to harvest. Yields and plant and bean characteristics are in Tables 1 and 2. Visual and cooked taste ratings are in Table 3. It was difficult in this study to select one or two top varieties that performed the best for all the characteristics evaluated. Varieties were selected because of their disease resistance and most have resistance to bean common mosaic virus. Some have extensive disease resistance packages and growers should consider these varieties if there is a history of a particular dis-ease or diseases on their farm.
Jade II and Achiever were two very dark green, glossy beans that had higher total yields and fairly high yields on one harvest date. Jade II had straight, six-inch long beans rated highly for cooked taste and texture, but had a lower cooked visual appeal rating. Achiever was a very uniform bean and had a medium rating for cooked taste and texture. BA 0958 is another attractive, slightly glossy, dark green, round bean with a lower yield, but rated very highly for pod straightness, uniformity and both raw- and cooked visual appeal, taste and texture.
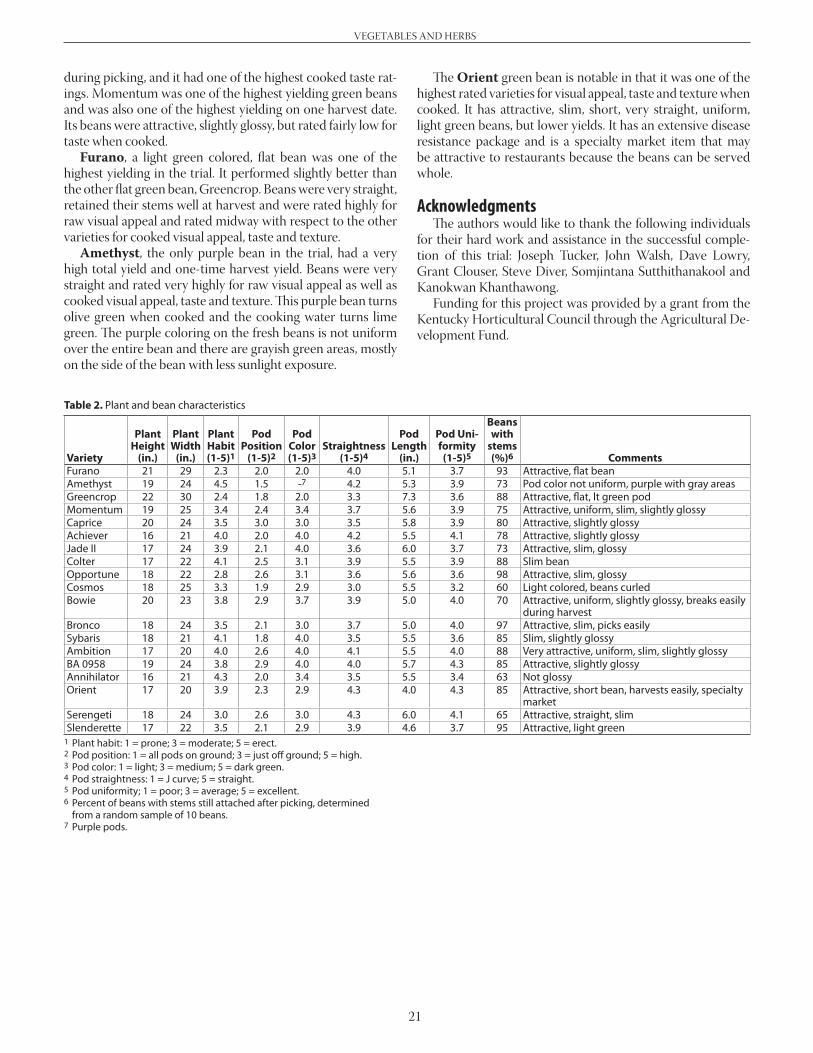
Colter, Opportune and Momentum green beans were lighter green and yielded well. Colter beans were slim, uni-form and highly rated for raw visual appeal and cooked taste, visual appeal and texture. The Opportune variety held its beans up off the ground well, beans retained their stems well
1 Plant habit: 1 = prone; 3 = moderate; 5 = erect.2 Pod position: 1 = all pods on ground; 3 = just off ground; 5 = high.3 Pod color: 1 = light; 3 = medium; 5 = dark green.4 Pod straightness: 1 = J curve; 5 = straight. 5 Pod uniformity; 1 = poor; 3 = average; 5 = excellent.6 Percent of beans with stems still attached after picking, determined
from a random sample of 10 beans.7 Purple pods.
during picking, and it had one of the highest cooked taste rat-ings. Momentum was one of the highest yielding green beans and was also one of the highest yielding on one harvest date. Its beans were attractive, slightly glossy, but rated fairly low for taste when cooked.
Furano, a light green colored, flat bean was one of the highest yielding in the trial. It performed slightly better than the other flat green bean, Greencrop. Beans were very straight, retained their stems well at harvest and were rated highly for raw visual appeal and rated midway with respect to the other varieties for cooked visual appeal, taste and texture.
Amethyst, the only purple bean in the trial, had a very high total yield and one-time harvest yield. Beans were very straight and rated very highly for raw visual appeal as well as cooked visual appeal, taste and texture. This purple bean turns olive green when cooked and the cooking water turns lime green. The purple coloring on the fresh beans is not uniform over the entire bean and there are grayish green areas, mostly on the side of the bean with less sunlight exposure.
The Orient green bean is notable in that it was one of the highest rated varieties for visual appeal, taste and texture when cooked. It has attractive, slim, short, very straight, uniform, light green beans, but lower yields. It has an extensive disease resistance package and is a specialty market item that may be attractive to restaurants because the beans can be served whole.
AcknowledgmentsThe authors would like to thank the following individuals
for their hard work and assistance in the successful comple-tion of this trial: Joseph Tucker, John Walsh, Dave Lowry, Grant Clouser, Steve Diver, Somjintana Sutthithanakool and Kanokwan Khanthawong.
Funding for this project was provided by a grant from the Kentucky Horticultural Council through the Agricultural De-velopment Fund.
22
VEGETABLES AND HERBS
Broccoli Cultivar Trial in Western Kentucky, Fall 2016 and Spring 2017Daniel Becker, Dwight Wolfe, June Johnston, and Virginia Travis, Horticulture
IntroductionBroccoli is a popular crop when grown in home gardens
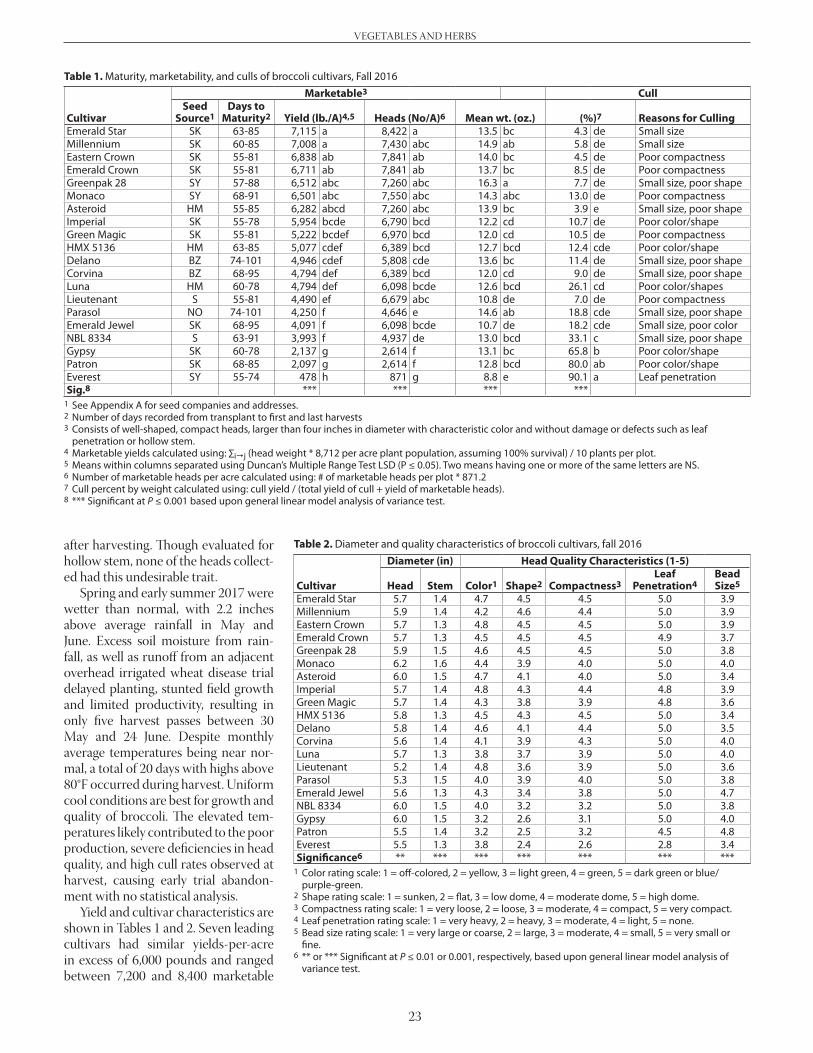
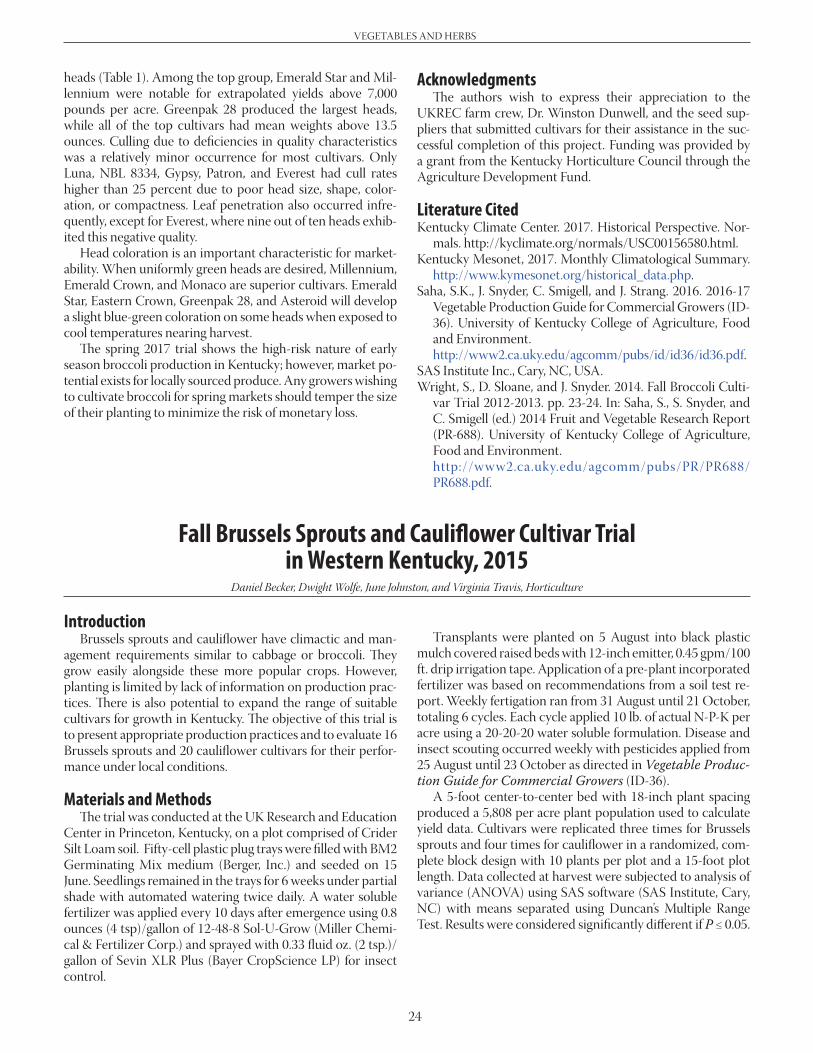
and has strong local demand, but commercial production is limited. Newer cultivars, some with greater reported heat tol-erance and climactic adaptability have become available since a trial in 2012 and 2013 (Wright et al, 2013). Improving fall productivity and expanding spring harvests with advanced cultivars has the potential to create more interest in commer-cial production. Twenty cultivars were evaluated for their per-formance and adaptability under local conditions.
Materials and MethodsThe fall 2016 trial was conducted at the UK Research and
Education Center in Princeton, KY, on a plot comprised of Crider Silt Loam soil. Fifty-cell plastic plug trays were filled with BM2 Germinating Mix medium (Berger, Inc.) and seed-ed on 27 June. A water-soluble fertilizer was applied every 10 days after emergence using 0.8 ounces (4 tsp)/gallon of 12-48-8 Sol-U-Grow (Miller Chemical & Fertilizer Corp.) for the first two waterings, and the same rate of 20-20-20 thereafter. Three 0.33 fluid oz. (2 tsp.)/gallon sprays of Sevin XLR Plus (Bayer CropScience LP) were applied during this period for insect control. The same methods were used for the spring 2017 trial seeded on 7 February.
Transplanting of seedlings occurred on 12 August (fall trial) and 10 April (spring trial), using black plastic mulch covered raised beds and 12-inch emitter, 0.45 gpm/100 ft. irrigation tape. Rows from the fall trial were reused for spring planting.
Low greenhouse light intensity created noticeably leggy plants in spring 2017, requiring a secondary planting on 14 April to fill bare spaces. Recommendations from a soil test report and the Vegetable Production Guide for Commercial Growers (ID-36) directed the application rate of pre-plant and post-plant fertilizers (Saha et al, 2016). Insecticides were sprayed biweekly from 28 August to 10 October for the fall season and from 23 May to June 21 for the spring season.
A 5 feet center-to-center bed distance with 12-inch plant spacing generated an 8,712 per acre population was used to calculate yield data. Cultivars were replicated four times in a randomized complete block design with 10 plants per plot and 12-foot plot length. SAS software (SAS Institute, Cary, NC) was used to analyze harvest data, subjecting it to analysis of variance (ANOVA) and separating means using Duncan’s Multiple Range Test. Results were considered significantly dif-ferent if P ≤ 0.05.
Results and DiscussionTemperatures were slightly above average from September
to November 2016, with a 7.1-inch rainfall deficit during this same period (Kentucky Climate Center, 2017; Kentucky Me-sonet, 2017). The dry conditions noticeably reduced disease and insect pressure and permitted an extended harvest season with 12 passes total, from 6 October to 21 November. Heads harvested at maturity were larger than 4 inches in diameter with a 6-inch cut stem length. A 12-inch ruler placed along the center of each head and stem aided in measuring the diameter. Heads were inspected for quality characteristics and defects
Table 3. Visual and taste ratings for fresh green beans
1 Color rating scale: 1 = off-colored, 2 = yellow, 3 = light green, 4 = green, 5 = dark green or blue/purple-green.
2 Shape rating scale: 1 = sunken, 2 = flat, 3 = low dome, 4 = moderate dome, 5 = high dome. 3 Compactness rating scale: 1 = very loose, 2 = loose, 3 = moderate, 4 = compact, 5 = very compact.4 Leaf penetration rating scale: 1 = very heavy, 2 = heavy, 3 = moderate, 4 = light, 5 = none.5 Bead size rating scale: 1 = very large or coarse, 2 = large, 3 = moderate, 4 = small, 5 = very small or
fine. 6 ** or *** Significant at P ≤ 0.01 or 0.001, respectively, based upon general linear model analysis of
variance test.
Table 1. Maturity, marketability, and culls of broccoli cultivars, Fall 2016
Cultivar
Marketable3 CullSeed
Source1Days to
Maturity2 Yield (lb./A)4,5 Heads (No/A)6 Mean wt. (oz.) (%)7 Reasons for CullingEmerald Star SK 63-85 7,115 a 8,422 a 13.5 bc 4.3 de Small sizeMillennium SK 60-85 7,008 a 7,430 abc 14.9 ab 5.8 de Small sizeEastern Crown SK 55-81 6,838 ab 7,841 ab 14.0 bc 4.5 de Poor compactnessEmerald Crown SK 55-81 6,711 ab 7,841 ab 13.7 bc 8.5 de Poor compactnessGreenpak 28 SY 57-88 6,512 abc 7,260 abc 16.3 a 7.7 de Small size, poor shapeMonaco SY 68-91 6,501 abc 7,550 abc 14.3 abc 13.0 de Poor compactnessAsteroid HM 55-85 6,282 abcd 7,260 abc 13.9 bc 3.9 e Small size, poor shapeImperial SK 55-78 5,954 bcde 6,790 bcd 12.2 cd 10.7 de Poor color/shapeGreen Magic SK 55-81 5,222 bcdef 6,970 bcd 12.0 cd 10.5 de Poor compactnessHMX 5136 HM 63-85 5,077 cdef 6,389 bcd 12.7 bcd 12.4 cde Poor color/shapeDelano BZ 74-101 4,946 cdef 5,808 cde 13.6 bc 11.4 de Small size, poor shapeCorvina BZ 68-95 4,794 def 6,389 bcd 12.0 cd 9.0 de Small size, poor shapeLuna HM 60-78 4,794 def 6,098 bcde 12.6 bcd 26.1 cd Poor color/shapesLieutenant S 55-81 4,490 ef 6,679 abc 10.8 de 7.0 de Poor compactnessParasol NO 74-101 4,250 f 4,646 e 14.6 ab 18.8 cde Small size, poor shapeEmerald Jewel SK 68-95 4,091 f 6,098 bcde 10.7 de 18.2 cde Small size, poor colorNBL 8334 S 63-91 3,993 f 4,937 de 13.0 bcd 33.1 c Small size, poor shapeGypsy SK 60-78 2,137 g 2,614 f 13.1 bc 65.8 b Poor color/shapePatron SK 68-85 2,097 g 2,614 f 12.8 bcd 80.0 ab Poor color/shapeEverest SY 55-74 478 h 871 g 8.8 e 90.1 a Leaf penetrationSig.8 *** *** *** ***
1 See Appendix A for seed companies and addresses.2 Number of days recorded from transplant to first and last harvests 3 Consists of well-shaped, compact heads, larger than four inches in diameter with characteristic color and without damage or defects such as leaf
penetration or hollow stem.4 Marketable yields calculated using: ∑ij (head weight * 8,712 per acre plant population, assuming 100% survival) / 10 plants per plot.5 Means within columns separated using Duncan’s Multiple Range Test LSD (P ≤ 0.05). Two means having one or more of the same letters are NS. 6 Number of marketable heads per acre calculated using: # of marketable heads per plot * 871.27 Cull percent by weight calculated using: cull yield / (total yield of cull + yield of marketable heads).8 *** Significant at P ≤ 0.001 based upon general linear model analysis of variance test.
after harvesting. Though evaluated for hollow stem, none of the heads collect-ed had this undesirable trait.
Spring and early summer 2017 were wetter than normal, with 2.2 inches above average rainfall in May and June. Excess soil moisture from rain-fall, as well as runoff from an adjacent overhead irrigated wheat disease trial delayed planting, stunted field growth and limited productivity, resulting in only five harvest passes between 30 May and 24 June. Despite monthly average temperatures being near nor-mal, a total of 20 days with highs above 80°F occurred during harvest. Uniform cool conditions are best for growth and quality of broccoli. The elevated tem-peratures likely contributed to the poor production, severe deficiencies in head quality, and high cull rates observed at harvest, causing early trial abandon-ment with no statistical analysis.
Yield and cultivar characteristics are shown in Tables 1 and 2. Seven leading cultivars had similar yields-per-acre in excess of 6,000 pounds and ranged between 7,200 and 8,400 marketable
24
VEGETABLES AND HERBS
heads (Table 1). Among the top group, Emerald Star and Mil-lennium were notable for extrapolated yields above 7,000 pounds per acre. Greenpak 28 produced the largest heads, while all of the top cultivars had mean weights above 13.5 ounces. Culling due to deficiencies in quality characteristics was a relatively minor occurrence for most cultivars. Only Luna, NBL 8334, Gypsy, Patron, and Everest had cull rates higher than 25 percent due to poor head size, shape, color-ation, or compactness. Leaf penetration also occurred infre-quently, except for Everest, where nine out of ten heads exhib-ited this negative quality.
Head coloration is an important characteristic for market-ability. When uniformly green heads are desired, Millennium, Emerald Crown, and Monaco are superior cultivars. Emerald Star, Eastern Crown, Greenpak 28, and Asteroid will develop a slight blue-green coloration on some heads when exposed to cool temperatures nearing harvest.
The spring 2017 trial shows the high-risk nature of early season broccoli production in Kentucky; however, market po-tential exists for locally sourced produce. Any growers wishing to cultivate broccoli for spring markets should temper the size of their planting to minimize the risk of monetary loss.
Fall Brussels Sprouts and Cauliflower Cultivar Trial in Western Kentucky, 2015
Daniel Becker, Dwight Wolfe, June Johnston, and Virginia Travis, Horticulture
IntroductionBrussels sprouts and cauliflower have climactic and man-
agement requirements similar to cabbage or broccoli. They grow easily alongside these more popular crops. However, planting is limited by lack of information on production prac-tices. There is also potential to expand the range of suitable cultivars for growth in Kentucky. The objective of this trial is to present appropriate production practices and to evaluate 16 Brussels sprouts and 20 cauliflower cultivars for their perfor-mance under local conditions.
Materials and Methods The trial was conducted at the UK Research and Education
Center in Princeton, Kentucky, on a plot comprised of Crider Silt Loam soil. Fifty-cell plastic plug trays were filled with BM2 Germinating Mix medium (Berger, Inc.) and seeded on 15 June. Seedlings remained in the trays for 6 weeks under partial shade with automated watering twice daily. A water soluble fertilizer was applied every 10 days after emergence using 0.8 ounces (4 tsp)/gallon of 12-48-8 Sol-U-Grow (Miller Chemi-cal & Fertilizer Corp.) and sprayed with 0.33 fluid oz. (2 tsp.)/gallon of Sevin XLR Plus (Bayer CropScience LP) for insect control.
Transplants were planted on 5 August into black plastic mulch covered raised beds with 12-inch emitter, 0.45 gpm/100 ft. drip irrigation tape. Application of a pre-plant incorporated fertilizer was based on recommendations from a soil test re-port. Weekly fertigation ran from 31 August until 21 October, totaling 6 cycles. Each cycle applied 10 lb. of actual N-P-K per acre using a 20-20-20 water soluble formulation. Disease and insect scouting occurred weekly with pesticides applied from 25 August until 23 October as directed in Vegetable Produc-tion Guide for Commercial Growers (ID-36).
A 5-foot center-to-center bed with 18-inch plant spacing produced a 5,808 per acre plant population used to calculate yield data. Cultivars were replicated three times for Brussels sprouts and four times for cauliflower in a randomized, com-plete block design with 10 plants per plot and a 15-foot plot length. Data collected at harvest were subjected to analysis of variance (ANOVA) using SAS software (SAS Institute, Cary, NC) with means separated using Duncan’s Multiple Range Test. Results were considered significantly different if P ≤ 0.05.
AcknowledgmentsThe authors wish to express their appreciation to the
UKREC farm crew, Dr. Winston Dunwell, and the seed sup-pliers that submitted cultivars for their assistance in the suc-cessful completion of this project. Funding was provided by a grant from the Kentucky Horticulture Council through the Agriculture Development Fund.
Literature CitedKentucky Climate Center. 2017. Historical Perspective. Nor-
http://www.kymesonet.org/historical_data.php.Saha, S.K., J. Snyder, C. Smigell, and J. Strang. 2016. 2016-17
Vegetable Production Guide for Commercial Growers (ID-36). University of Kentucky College of Agriculture, Food and Environment. http://www2.ca.uky.edu/agcomm/pubs/id/id36/id36.pdf.
SAS Institute Inc., Cary, NC, USA.Wright, S., D. Sloane, and J. Snyder. 2014. Fall Broccoli Culti-
var Trial 2012-2013. pp. 23-24. In: Saha, S., S. Snyder, and C. Smigell (ed.) 2014 Fruit and Vegetable Research Report (PR-688). University of Kentucky College of Agriculture, Food and Environment. http://www2.ca.uky.edu/agcomm/pubs/PR/PR688/PR688.pdf.
25
VEGETABLES AND HERBS
Brussels sproutsTopping and harvest were scheduled us-
ing seed supplier–provided maturity periods, counted from transplanting following the Julian calendar. Topping consisted of removing the top inch of each plant using hand shears in order to promote uniform growth of sprouts along the stem length. Plant leaves were retained (not stripped) for the duration of the season to pro-mote sprout growth. Harvest occurred weekly starting 13 November and ending 23 Decem-ber, totaling 6 passes. A long-handled lopper was used for whole stem harvest to cut plants at their bases. Leaves were removed from stems post-harvest by hand stripping outside of the trial field.
CauliflowerCultivars were inspected for head develop-
ment starting a week prior to maturity from transplant, and every 3 to 4 days thereafter. For most cultivars, the spreading of crown leaves revealed the head. Self-blanching cultivars, which produce shielding wrapper leaves to pro-vide cover, required confirmation by touch. At approximately 2 inches in diameter, each head was loosely wrapped using 8 to 12 leaves and se-cured with colored rubber bands. Harvest of 5- to 6-inch diameter heads occurred 7 to 10 days after tying, between 16 October and 23 Novem-ber. Leaves surrounding the heads (8-12) were trimmed to market acceptability outside of the trial field.
Results and DiscussionThe fall growing season was exceptionally
mild and ideal for extended harvests of later maturing cultivars. Average monthly tempera-tures for November and December were 3 and 10°F above normal, respectively. A 21.8°F freeze on 22 November (Kentucky Mesonet, 2016) injured a few remaining cauliflower heads, but as harvest was mostly completed, it did not ap-preciably affect final yields. Brussels sprouts were unaffected, allowing harvesting into late December. Rainfall during November and De-cember was 3.5 inches above normal (Kentucky Climate Center, 2016). The increased moisture promoted later season development of bacterial leaf spot (Pseudomonas syringae), causing considerable loss-es of sprouts at the stem bases of susceptible cultivars. Some later maturing cauliflower heads developed spots associated with downy mildew (Peronospora parasitica), but infections generally were not severe or widespread enough to seriously affect marketable yields.
Brussels sproutsCultivar evaluation for stem and sprout yield, stem length,
as well as sprout number and characteristics are shown in Ta-bles 1 through 3. Four leading cultivars had statistically similar marketable stem yields, but Jade Cross E and Dimitri were ex-ceptional for yields above 8,000 pounds (Table 1). Long Island Improved, Red Ball, and Catskill Improved had plant popula-tions similar to other cultivars, but they developed fewer mar-
Table 1. Stem yield of Brussels sprouts cultivars, 2015.
VarietySeed
Source1Days to
Maturity2
Total Marketable Yield (lb/A)3
Stems (No/A)
Mean Weight
(lb./stem)Jade Cross E ST 95 8,821 a4 5,001 ab 1.8 aDimitri SW 105 8,181 ab 5,324 ab 1.5 abCobus ST 130 6,153 abc 5,808 a 1.1 bcFranklin SW 100 5,904 abc 5,001 ab 1.2 bcDagan SW 100 5,797 bcd 4,840 ab 1.2 bcChurchill JS 90 5,655 bcd 5,163 ab 1.1 bcHestia SW 100 5,442 bcd 5,001 ab 1.1 bcDivino SW 100 4,908 cd 4,517 ab 1.1 bcAurelius ST 140 4,837 cd 5,163 ab 0.9 cdGustus ST 120 4,659 cd 4,679 ab 1.0 bcdDiablo JS 110 4,019 cd 5,324 ab 0.8 cdNelson RU 90 3,984 cd 4,840 ab 0.8 cdNautic JS 105 3,735 cd 4,003 b 0.9 cdLong Island Improved RU 100 2,881 de 1,613 c 1.8 aRed Ball (red) SW 120 391 e 807 d 0.5 dCatskill Improved SW 95 .5 . .
1 See Appendix A for seed companies and addresses.2 Days to maturity obtained from seed catalogues and online sources.3 Total marketable stem yield calculated using: average marketable stem weight *
marketable stems (No/A).4 Means within columns followed by one or more of the same letter are not significantly
different (Duncan’s Multiple Range Test LSD P ≤ 0.05). 5 Catskill Improved failed to produce stems/sprouts.
Table 2. Stem lengths (in) of Brussels sprouts cultivars, including percentage marketable, 2015.
VarietyMarketable
Length1% Marketable
(of Total)2 Unmarketable3Total
(mean)Jade Cross E 10.1 ab4 76.6 a 3.8 f 12.9 defDimitri 10.7 a 56.0 cde 8.9 bcd 18.8 abCobus 9.9 ab 51.8 def 9.2 abc 19.2 aFranklin 9.1 abc 64.6 bc 5.6 def 13.9 deDagan 9.9 ab 64.5 bc 6.2 cdef 15.0 cdeChurchill 9.3 abc 65.6 abc 5.9 cdef 14.2 deHestia 7.4 bc 49.2 ef 8.1 cde 14.7 cdeDivino 7.7 abc 61.2 bcd 5.2 ef 11.7 efAurelius 7.8 abc 48.6 ef 8.5 cde 15.9 abcdGustus 7.8 abc 46.3 ef 8.8 bcd 15.3 bcdDiablo 6.4 cd 43.7 f 8.4 cde 14.4 deNelson 7.7 abc 52.7 def 7.3 cde 14.3 deNautic 8.2 abc 44.8 ef 12.4 a 18.3 abcLong Island Improved 8.4 abc 70.9 ab 7.4 cde 9.8 fgRed Ball (red) 3.5 d 27.7 g 11.9 ab 13.2 defCatskill Improved .5 . 6.2 cdef 6.2 g
1 Marketable stems consist of sprouts between 1 and 1 ½ inch in diameter.2 Percentage of marketable stem calculated by dividing the length of marketable stem by
the total stem length (marketable and unmarketable).3 Unmarketable stems consist of sprouts less than 1 inch or more than 1 ½ inch in diameter,
or ones that are otherwise too loose or affected by disease.4 Means within columns followed by one or more of the same letter are not significantly
different (Duncan’s Multiple Range Test LSD P ≤ 0.05). 5 Catskill Improved failed to produce stems/sprouts.
26
VEGETABLES AND HERBS
ketable stems. In the greenhouse, these three had noticeably smaller seed size and weak seedling growth in trays, which likely directly affected field growth. However, Long Island Improved did produce some stems similar to Jade Cross E in weight and visual characteristics. Dimitri, Jade Cross E, and Cobus formed long marketable stem sections, but Dimitri and Cobus, similar to Nautic, had large unmarketable portions, which reduced the remaining marketable percentage (Table 2). Jade Cross E produced shorter stems but had less unmar-ketable waste.
As with total stem yields, Jade Cross E and Dimitri had the greatest yields of shelled sprouts (Table 3). Long Island Im-proved developed a number of sprouts similar to Jade Cross E but had far fewer marketable stems, reducing its total yield. Dagan, Hestia, Nelson, and many of the earliest maturing (90-100 day) cultivars responded poorly to warm temperatures during growth, developing numerous large and loose sprouts at the plants’ bases. Jade Cross E, with its densely packed stems of compact sprouts, was an exception. Later maturing culti-vars (≥105 days) had more uniform growth but produced lengthy, unmarketable upper stem portions with numerous small-sized sprouts. The tasting panel was unable to detect a consistent difference in bitterness among cultivars evaluated.
Table 3. Sprout yield, number, characteristics and notes of Brussels sprouts cultivars, 2015
Variety
Total Marketable Yield (lb/A)1
Number/ Stem2
Mean Weight
(oz)Compactness
(1-5)3
Bitterness Cooked
(1-5)4 NotesJade Cross E 4,741 ab5 42.0 ab 0.35 bc 4.8 ab 4.3 Stems with closely spaced sprouts, very low bacterial
leaf spot incidenceDimitri 5,177 a 35.7 bc 0.40 ab 4.7 ab 4.3 Long stems with widely spaced sprouts, very low
bacterial spot incidenceCobus 3,153 cd 27.0 d 0.32 bc 4.7 ab 4.2 Long stems with widely spaced sproutsFranklin 3,785 bcd 29.7 cd 0.40 ab 4.0 bcd 4.0 Moderate bacterial spot incidenceDagan 3,283 cd 28.4 d 0.39 ab 3.5 d 4.5 Uneven (loose) sprout developmentChurchill 3,680 bcd 27.7 d 0.38 ab 4.0 bcd 4.7 Plants tend to produce suckersHestia 3,990 abc 25.6 de 0.48 a 3.6 cd 4.3 Uneven (loose) sprout development, moderate
bacterial leaf spot incidenceDivino 3,177 cd 26.2 d 0.39 ab 4.2 abcd 3.7 Moderate bacterial leaf spot incidenceAurelius 3,294 bcd 25.2 de 0.39 ab 4.8 ab 4.0 Plants tend to leanGustus 3,106 cd 24.8 de 0.40 ab 4.4 abcd 4.0 High bacterial leaf spot incidenceDiablo 2,643 cde 19.0 e 0.38 abc 4.0 bcd 3.7 High bacterial leaf spot incidenceNelson 2,338 de 23.8 de 0.33 bc 3.7 cd 3.8 High bacterial leaf spot incidence, uneven (loose)
sprout developmentNautic 2,409 de 23.5 de 0.38 abc 4.5 abc 4.3 Plants tend to leanLong Island Improved 1,334 ef 42.9 a 0.28 bc 5.0 a 4.0 Uneven stem formationRed Ball (red) 116 f 9.1 f 0.26 c 4.0 bcd 4.0 Poor stem/sprout developmentCatskill Improved .6 . . . . Plants did not form stems/sprouts
1 Total marketable sprout yield calculated using: number of sprouts per marketable stem * average sprout weight * marketable stems (No/A).2 Composed of a subset of 9 randomly selected marketable stems, 3 per plot. 3 Compactness rating: 1 = very loose; 2 = loose; 3 = moderate; 4 = compact; 5 = very compact. Sprout compactness evaluated by lightly squeezing sprouts
between the thumb and forefinger and observing elasticity and ability to resist compression.4 Bitterness cooked rating: 1 = very high; 2 = high; 3 = moderate; 4 = slight; 5 = none. Sprouts were drizzled with olive oil and cooked covered in aluminum
foil at 400°F for 40 minutes. When cooled a trained 6 member panel evaluated samples’ tastes. 5 Means within columns separated by Duncan’s Multiple Range Test LSD (P ≤ 0.05). Means followed by one or more of the same letter are not significantly
different.6 Catskill Improved failed to produce stems/sprouts.
CauliflowerTables 4 and 5 show the harvest maturity, yield, and head
characteristics of the cultivars evaluated. Twelve leading culti-vars were similar in total yield and mean head weights (Table 4). Steady and Flamenco were notable for having marketable yields over 19,000 pounds per acre and heads greater than 7 inches in diameter. Higher total yields generally corresponded with heavier mean weights and larger diameters, as opposed to greater number of heads. Observed maturities differed from those stated by seed sources, sometimes greatly, with the trend always later than described. However, harvests of Steady, Fla-menco, Terzolo, Fargo, and Skywalker were all within 5 days of advertised maturity. Differences in growing conditions be-tween the trial location and those of plant breeders and seed suppliers, including year-to-year differences in weather pat-terns, are likely the primary source of this disparity.
Casper was highly rated for self-blanching, whiteness of curd color, and absence of defects due to riciness or fuzziness (Table 5). The plants developed many long, shading exterior leaves with a tight covering of wrapper leaves surrounding each head. Terzolo and Panther rated highly for head com-pactness and shape, respectively, but the differences between cultivars were minor and did not influence marketability.
Cauliflower deserves to be more widely grown alongside other cole crops as several new cultivars in this trial showed promise in their suitability for growth in Kentucky. Steady, Flamenco, Aquarius, and Synergy are favorable for their yields and desirable characteristics. Interested growers should try Argos and Casper as self-blanching cultivars.
27
VEGETABLES AND HERBS
Table 4. Days to maturity, yield, and head diameter of cauliflower cultivars, 2015.
1 See Appendix A for seed companies and addresses.2 Advertized days to maturity post-transplant obtained from seed catalogues or online sources.3 Yields based on per acre population of 5808 plants, assuming 100% survival.4 Marketablility consists of clean, compact, unblemished heads larger than 4 inches in diameter and are free from damage or physiological disorder. 5 Means within columns separated by Duncan’s Multiple Range Test LSD (P ≤ 0.05). Means followed by one or more of the same letter are not significantly
different.
Table 5. Self-Blanching and curd characteristics of cauliflower cultivars, 2015.
VarietySelf-Blanching
(1-5)1Color (1-5)2
Compactness (1-5)3
Shape (1-5) 4
Riciness, Fuzziness
(1-5)5
Steady 2.6 fgh6 4.7 ab 4.6 abc 4.9 ab 4.4 abcFlamenco 2.4 gh 4.4 ab 4.5 abc 4.8 ab 4.3 abcAquarius 3.8 abcde 4.5 ab 4.5 abc 4.9 ab 4.4 abcSynergy 3.8 abcde 4.5 ab 4.6 abc 4.8 ab 4.5 abcArgos 4.1 abc 4.7 ab 4.6 abc 4.9 ab 4.2 bcdArtica 3.8 abcde 4.7 ab 4.5 abc 4.8 ab 3.7 deApex 3.7 bcde 4.5 ab 4.4 bc 4.8 ab 4.5 abcAbsolute 3.1 efg 4.5 ab 4.2 c 4.8 ab 4.1 cdTerzolo 2.1 hi 4.3 ab 4.9 a 4.9 ab 4.6 abcCasper 4.5 a 4.8 a 4.8 ab 4.9 ab 4.8 aFreedom 2.8 fg 4.6 ab 4.8 ab 4.9 ab 4.4 abcIncline 3.2 defg 4.5 ab 4.6 abc 4.8 ab 3.5 eCumberland 3.9 abcd 4.4 ab 4.6 abc 4.8 ab 4.6 abcDenali 3.9 abcd 4.7 ab 4.6 abc 4.9 ab 4.5 abcBasan 3.9 abcd 4.6 ab 4.6 abc 4.9 ab 4.4 abcAltamira 3.4 cdef 4.7 ab 4.4 abc 4.8 ab 4.5 abcAmazing 1.5 i 4.2 b 4.7 ab 4.9 ab 4.2 bcdFargo 4.2 ab 4.2 b 4.7 ab 4.8 ab 4.1 cdSkywalker 4.1 abc 4.3 ab 4.5 abc 4.6 b 4.2 bcdPanther (green) .7 . 4.4 abc 5.0 a 4.7 ab
1 Evaluation of self-blanching conducted prior to harvest by removing the colored bands from exterior leaves and pushing them away from the head to observe the extent of head cover by interior leaves. Self-blanching rating: 1 = none; 2= slightly; 3 = partially; 4 = mostly; 5 = fully.
2 Color rating: 1 = yellow-green; 2 = yellow; 3 = light yellow; 4 = creamy white; 5 = white.3 Compactness rating: 1 = very loose; 2 = loose; 3 = moderate; 4 = compact 5 = very compact.4 Shape rating: 1 = sunken; 2 = flat; 3 = low dome; 4 = moderate dome; 5 = high dome. 5 Riciness is the elongation and separation of flower buds while fuzziness is the elongation of
flower stamens (male pollen bearing portion) on heads. Multiple conditions can contribute to their formation, including exposure to high temperatures and direct sunlight, rapid growth and high nitrogen, and high humidity during head development. Heads that exhibit these defects are also often loose and discolored. Riciness, fuzziness rating: 1 =very heavy; 2 = heavy; 3 = moderate; 4 = light; 5 = none.
6 Means within columns separated by Duncan’s Multiple Range Test LSD (P ≤ 0.05). Means followed by one or more of the same letter are not significantly different.
7 Panther is a colored variety and does not require blanching.
AcknowledgmentsThe authors wish to express their ap-
preciation to the UKREC farm crew, Dr. Winston Dunwell, and the seed suppliers that submitted cultivars for evaluation in their assistance in the successful comple-tion of this project. Funding was provided by a grant from the Kentucky Horticulture Council through the Agriculture Develop-ment Fund.
References Bessin, R., K. Seebold, S. Saha, S. Wright,
and J. Strang. 2014. 2014-15 Vegetable Production Guide for Commercial Growers (ID-36). University of Kentucky College of Agriculture, Food and Envi-ronment.
Bell Pepper Cultivar Evaluation, Central KentuckyChris Smigell, John Strang, and John Snyder, Horticulture
IntroductionBell peppers can be prof-
itable for Kentucky farmers. This replicated trial evaluated 12 bacterial spot–resistant bell pepper varieties in comparison to the industry standard, Aris-totle. Some of the newer variet-ies have resistance to ten races of bacterial spot, while Aristo-tle has resistance to three. Re-sistance to a greater number of races makes production easier and can reduce the number of bactericide sprays, but the varieties still have to yield well and have the quality that buy-ers require.
Materials and MethodsVarieties were seeded on
21 March into plastic plug trays (72 cells per tray) filled with Jiffy Seed Starting Mix 17 (Jiffy Products of America, Lorain, OH) at the UK Hor-ticultural Research Farm in Lexington. Greenhouse-grown transplants were set into black-plastic-covered raised beds using a water wheel setter on 17 May. Each plot was 15 feet long and contained 30 plants set 12 inches apart in double rows spaced 15 inches apart in the bed. Beds were 5 feet apart. Fifty pounds of nitrogen/A as urea was applied prior to plas-tic laying. At planting each transplant was watered in with a pint of starter solution (6 lb of 10-30-20 in 100 gallons of wa-ter). Calcium nitrate was applied via fertigation weekly at a rate of 8.2 lb nitrogen/A from 12 June through 23 August. Dual II Magnum herbicide was applied between beds following trans-planting. Four early-season bactericide/fungicide applications of Badge SC (fixed copper) plus Manzate Pro-Stick were made between 23 May and 27 June. Danitol was sprayed for brown marmorated stink bug control on 10 August.
The plot was harvested three times: 11 July, 1 August, and 27 August. Marketable fruit were weighed and graded accord-ing to the size classes U.S. Fancy (>3 in. diameter), U.S. No. 1
(>2.5 inches but <3 in. diameter), and U.S. No. 2 (<2.5 in. di-ameter plus misshapen but sound fruit which could be sold as ‘choppers’ to food service buyers) and cull fruit.
Results and DiscussionAverage daily temperatures and rainfall for June and July
were near normal. Average daily temperatures were two de-grees below normal for August, with near normal precipita-tion.
Table 1. Total yields and yields by USDA grades, 2017
Variety
TotalMarketable
Yield(lb/A) 1,2
U.S. Fancy(lb/A) 3
U.S. No. 1(lb/A) 4
U.S. No. 2(lb/A) 5
Culled Fruit(lb/A) 6
Fancy + No. 1as %
of TotalMkt. Yield
Turnpike 54,000 a 34,100 ab 6700 bc 13,200 bcd 3700 ab 76Aristotle 53,800 a 29,600 abc 7000 abc 17,300 ab 1700 abc 68Green Flash 53,000 a 35,200 a 6500 bc 11,400 cde 1400 bc 79Boca 51,400 ab 33,400 ab 7600 abc 10,400 de 1600 bc 80Alliance 50,000 abc 33,100 ab 1600 f 15,400 abc 3400 abc 69Currier 48,700 abcd 33,000 ab 4800 cde 10,900 de 2500 abc 78Bastille 45,500 abcd 25,800 bcd 6300 bcd 13,400 bcd 3800 ab 71Karisma 44,500 bcd 22,800 cd 3100 ef 18,600 a 2500 abc 58Dazzle 44,000 bcd 22,300 cd 9700 a 12,100 cd 1200 c 73SDY 48 42,300 cd 27,300 abc 6100 bcd 8900 de 3900 a 79Lafayette 42,100 cd 27,600 abc 3600 def 10,900 de 3900 a 74Galleon 41,100 de 25,400 bcd 8200 ab 7500 e 1300 c 82Mariner 33,700 e 18,400 d 2700 ef 12,600 cd 1700 abc 63
1 Includes yields of U.S. Fancy, No. 1, and No. 2 fruits.2 Means in the same column followed by the same letters are not significantly different (Waller-Duncan multiple
range test LSD P ≤ .05).3 U.S. Fancy=undamaged, unblemished fruit >3 in. dia. 4 No. 1= undamaged, unblemished fruit >2.5 but <3 in. dia.5 No 2=undamaged, unblemished fruit <2.5 in. dia., plus larger, but misshapen yet sound fruit which could be
sold as ‘choppers’ to food service buyers. 6 Fruit of any size with surface scarring, sunscald, insect and disease damage.
1 Percent of all harvested fruit culled due to surface scarring, sunscald, insect and disease damage. 2 Percent of total marketable yield in the 1st harvest that showed slivering or very fine, light colored streaking 3 Uniformity of fruit shape: 1=poor, 5=excellent.4 Fruit appearance: 1=poor, 5=excellent. 5 1=long, slender fruit or very squat, flattened fruit, 5=fruit with equal height and width.6 1=pale green, 5=dark green.
29
VEGETABLES AND HERBS
Table 3. Variety attributes
VarietySeed
SourceDays to
Harvest1
Ripe Fruit Color
DiseaseResistances2,3 Fruit Comments
Turnpike ST 75 red HR: BS (1-5, 7-9), TMV, Phyt Attractive; culls due to sunscaldAristotle ST 70-75 red IR: BS (1-3),
PVY, TMVAttractive; blocky to long; a lot of pointy fruit
Green Flash CF mid red IR: BLS 1-10 Attractive; uniform color; tall/blocky; very productive; more scarring than other varieties
Boca SW 73 red HR: BLS 1-10 Many 3-lobed; 1 w/ ringspot; Many squat fruit second harvestAlliance HM 74 red HR: BS (1-5),
PVY, PYMV, TMV, PMV, IR: CMVBlocky- to long-blocky; some extremely lg fruit; good sizeat third harvest
Attractive, variable shape; variable color; good size at 3rd harvest; has very thick walls
Bastille SY 75 red HR: BS (1-5,7-9), PMV, TMV Variable shape; many culls from ripe rotKarisma CL 71-75 red HR: BS (1,2,3),
PVY (0,1), TMV PMV; IR:CMVVery pale green color
Dazzle SW - yellow HR: BS (1-5);IR: TSWV
Glossy; many squat fruit
SDY 48 SW 73 red IR: BS (1-10) Uniform color; culls from sunscald and ripe rotLafayette CL 70 yellow HR: BS (1-3) Very pale green; many squat/flat fruit; culls from sunscald; many squat/
flat; 5% stinkbugGalleon CF mid-late yellow HR: BS (1-10) Color varies on some fruit; some virusMariner CF early red IR: BS (1-10) No squat fruit; few puckered fruit
1 Days to harvest as listed by seed companies. 2 HR=disease resistant (restricted disease development & symptoms); IR=intermediate resistance (may show more disease symptoms than ‘resistant’
varieties grown in same environment). 3 BS=bacterial spot (strains 1-10); Phyt=phytophthora root rot; TMV=tobacco mosaic virus; PVY=potato virus Y (strains 0, 1, and 1-2); PMV=pepper mottle
1 Combined weights of Fancy, No. 1 and No. 2 fruit.
The best performing bell pepper varieties in this trial were Turnpike, Aristotle, Green Flash, Boca, Alliance and Currier. Varieties are ranked in Table 1 by the total marketable yield for the entire trial. Yields of the seven highest-yielding variet-ies were not significantly different. Six of these also had the greatest yields of U.S. Fancy fruit, and these yields, too, were statistically similar.
Aristotle, which has been the primary bacterial spot–resis-tant pepper Kentucky for a number of years, was second in total yield at just under 27 tons/A. Turnpike had 27 tons/A. Both varieties had similar ratings for appearance and other characteristics, although both had lower four-lobed fruit per-centages and blockiness ratings (Table 2) than nearly all the other varieties. Green Flash had the third-highest total mar-
ketable yield and decent ratings for overall appearance, per-cent of four-lobed fruit, and dark green color. Boca had the fourth-highest total yield and had some of the highest ratings for appearance, fruit shape uniformity, blockiness, and deep green color. Currier was the sixth-highest in total marketable yield but had the highest blockiness rating and was tied with Boca for the highest overall appearance and shape uniformity ratings. Currier and Boca had some of the highest percentages of U.S. Fancy fruit as well (Table1).
Nearly all of the top overall-yielding varieties also were the top yielders in the first harvest on 11 July (Table 4). Thus, these varieties are good choices for growers looking for larger, early-season yields when the prices are higher. At the middle harvest, nearly all varieties increased their yields of Fancy and
30
VEGETABLES AND HERBS
Pumpkin has been a profitable crop for many Kentucky growers over the years. However, powdery and downy mil-dews have been serious production problems. These diseases can destroy foliage prematurely, resulting in pumpkins with thin walls, poor quality stems, and poor storage characteris-tics. Seed companies have developed a number of pumpkin varieties that have powdery mildew resistance or tolerance to improve marketable yields and storability. In this study nine pumpkin varieties, most with powdery mildew resistance, were evaluated in a replicated trial to determine their perfor-mance in Central Kentucky under a high-input fungicide pro-gram, a low-input fungicide program, and a minimal program that did not include any powdery mildew–specific fungicides.
Pumpkin Fungicide and Cultivar EvaluationJohn Strang, John Walsh, Chris Smigell, and John Snyder, Horticulture; Emily Pfeufer and Will Barlow, Plant Pathology
No. 2 fruit at the expense of the No. 1 grade (Table 5). The top overall-yielders Aristotle, Bastille, and Currier, were top-yield-ers in the last harvest, while Karisma, Boca, and Green Flash dropped off in yields (Table 6). Aristotle was the only variety to remain among the top four yielders in all three harvests, attest-ing to its track record as a top pepper variety (Tables 4, 5, and 6), although Turnpike, Green Flash, and Alliance also main-tained yields. In addition, Aristotle, Green Flash, Alliance, Currier, and Bastille all maintained about 70 to 80 percent Fancy plus No. 1 fruit across all three harvests Table 7. Among these, Green Flash and Alliance ranked well for color and fruit appearance, Currier ranked well for shape uniformity, appear-ance, and blockiness, and Bastille ranked well for number of four-lobed fruit, blockiness, and color. Growers interested in consistent production throughout the season for farmers mar-ket or CSA sales should consider these varieties.
Note that Turnpike, Green Flash, Boca and Alliance have substantially better resistance (Table 3) to a greater number of races of bacterial spot than Aristotle. This trial was conducted using a good early spray program for bacterial spot, so varietal resistance was not tested in this evaluation.
AcknowledgmentsThe authors would like to thank the following persons for
their hard work and assistance in the successful completion of this trial: Joseph Tucker, John Walsh, Dave Lowry, Grant Clouser, Steve Diver, Jackson Fallon, Mohmmad Dawood, Ammar Al Bayati, Somjintana Sutthithanakool, and Kanok-wan Khanthawong.
Funding for this project was provided by a grant from the Kentucky Horticultural Council through the Agricultural De-velopment Fund.
Materials and MethodsVarieties were seeded on 6 June 2017 into a field of Maury
Silt Loam manually with Stand and Plant seeders at the Uni-versity of Kentucky Horticulture Research Farm in Lexington. This study was laid out in a split-plot design with powdery mil-dew fungicide spray treatments as main plots and varieties as sub plots. Four fields were used as replications with each field (replication) containing randomly assigned spray treatments: no treatment for powdery mildew, a low-input powdery mil-dew fungicide program, and a high-input fungicide program for powdery mildew. All plots were sprayed identically for downy mildew and insect management. Spray treatments are shown in Table 1. Individual plots were 21 feet long and con-sisted of two rows, each containing eight seeds set 3 feet apart in the row with 6 feet between rows. Individual plots were
31
VEGETABLES AND HERBS
separated from the next plot by 6 feet. Guard rows were planted on both sides of each field or replica-tion. Drip irrigation provided water and fertilizer as needed.
Fifty pounds of N/A as urea were incorporated into the field prior to planting. Plots were drip ir-rigated as needed and fertigated with a total of 16 lb N/A as calcium nitrate divided into five appli-cations over the season beginning on 19 July and ending on 23 August.
A tank mix of 1.33 pt of Dual II Magnum plus 0.66 oz Sandea herbicides /A was applied on 7 June for weed control. Bindweed and morning glory seedlings that emerged were hand pulled and spot sprayed with glyphosate once pumpkin plants emerged. Greenhouse grown pumpkin transplants were set in the field where seeds did not emerge. Following plant emergence the sys-temic insecticide Macho 2.0 FL (Imidacloprid) at the rate of 20 fl oz/A (1.38 fl oz/1,000 linear foot of row) was applied as a drench to each plant with a backpack sprayer at 1.0 fl oz of solution per plant for squash bug control on 21 June.
Disease ratings were completed on August 11. The upper and lower side of 20 leaves per plot were evaluated for disease severity using the Horsfall-Barratt scale. Individual data points were transformed to the midpoint of the rating range prior to means calculation. Analysis of variance was conducted using PROC Mixed in SAS 9.4, followed by LSMEANS comparison using the Tukey post-hoc test (P = 0.05).
Harvest began on 18 September and continued through 3 October. Pumpkins were cut and piled in the field for each treatment and rated for fruit shape, smoothness, ribbing, col-or, and stem quality. The number of cull and green pumpkins were counted, and all pumpkins were weighed. All pumpkins were lifted by their stems during loading and a separate stem rating was made for number of rotten stems and those that broke upon lifting.
Results and DiscussionThe spring season was cool and wet. Powdery mildew fun-
gicide spray treatment results are shown in Table 2, and va-riety results are shown in Tables 3 and 4. Yields in lb/A were
significantly higher (8.3%) for the high input spray treatment than the other treatments, Table 2. However, there was no dif-ference in the number of pumpkins harvested between treat-ments. Thus the high input spray treatment increased pump-kin weight across all varieties, but not the number of pumpkins harvested. There was no significant difference in the number of culls between spray treatments. There was no significant in-teraction between fungicide treatments and variety for any of the yield parameters. All varieties responded similarly to each of the fungicide treatments.
Overall, Kratos, Aladdin, and Apollo were the best yield-ing varieties in this trial. Camaro had the lowest powdery mil-dew severity, followed by Kratos and El Toro. Camaro yielded
Table 1. Pumpkin fungicide and insecticide main plot spray treatmentsSpray Number and Date
High Input Spray1
Low Input Spray2
Minimal program3
Insecticides for All Plots
1June 29
PM- Aprovia Top + mancozeb
mancozeb Mancozeb Permethrin
2July 10
PM- Fontelis + mancozeb
Topsin Permethrin
3 July 19
PM- Quintec + mancozeb
mancozeb Mancozeb Permethrin
4July 26
PM- Aprovia Top + chlorothalonil
Topsin Assail
5Aug. 2
PM- Fontelis + chlorothalonil
Chlorothalonil Chlorothalonil Assail
6Aug. 9
PM- Quintec + mancozeb
DM- Ranman
Topsin +
Ranman
Ranman
7Aug. 16
PM- Aprovia Top + chlorothalonil
DM-Previcur Flex
Chlorothalonil +
Previcur Flex
Chlorothalonil
Previcur Flex
Permethrin
8Aug. 23
PM- Fontelis + chlorothalonilDM- Ranman
Topsin +
Ranman
Ranman No insecticide
9Aug. 30
PM- Quintec + chlorothalonil
DM-Previcur Flex
Chlorothalonil +
Previcur Flex
Previcur Flex Assail
10Sept. 6
PM- Aprovia Top + chlorothalonilDM- Ranman
Topsin +
Ranman
Ranman No insecticide
Approximate season-long PM fungicide cost4
$517.20 $226.05 $101.72
1 High Input program, PM = fungicides applied for powdery mildew; DM = fungicides applied for downy mildew
2 Low Input program lists fungicides applied for powdery and downy mildew3 Minimal program lists fungicides applied for downy mildew and Plectosporium blight.
Mancozeb and chlorothalonil have protectant activity against powdery mildew. 4 Total cost per acre, based on a Kentucky fungicide supplier’s 2017 price list. This
approximate cost does not include downy mildew fungicides or insecticides.
Table 2. Powdery mildew fungicide pumpkin yield, fruit size, percent culls, and powdery mildew severity on the upper and lower leaf surfaces on August 11
Treatment1Yield
(lb/A)2,3 Yield (No./A)2,3Fruit Size
(lb)3Culls(%)3
PM severity on upper leaf surface (%)4
PM severity on lower leaf surface (%)4
High input 57,567 a 2,849 a 20.9 a 15 a 5.26 a 9.81 aLow input 48,538 b 2,727 a 18.6 b 20 a 20.23 ab 29.05 bMinimal 47,787 b 2,643 a 18.8 b 21 a 25.79 b 36.86 b
1 Spray program details in Table 1. 2 Yield averaged across all varieties.3 Means in the same column followed by the same letters are not significantly different (Waller-Duncan multiple range test LSD P = 0.05). 4 Powdery mildew severity was rated on the upper and lower sides of 20 leaves per replicate on 11 August, using the Horsfall-Barratt scale. Data were
transformed to the midpoint prior to conducting analysis of variance on the split-plot design. Means in the same column followed by the same letters are not significantly different (Tukey test P = 0.05).
32
VEGETABLES AND HERBS
well, but its light color reduces its value in many Kentucky markets. Notable were Early King, which was a very tall, elon-gated pumpkin with very nice stems and Cronus, a low yield-ing variety, with some of the largest, most attractive fruit with outstanding stems. All varieties but Howden had intermediate resistance to powdery mildew.
Kratos, Camaro, Aladdin, Apollo, and Early King were the highest yielding pumpkins based on pounds of marketable pumpkins per acre, Table 3. Kratos, Camaro, Aladdin, and Apollo produced some of the highest numbers of marketable pumpkins per acre. Early Giant and Cronus produced the larg-est pumpkins in the trial, while Apollo and Howden had on average the smallest pumpkins. Apollo, Kratos, and Cronus had the fewest cull fruits, while Early Giant had the most cull fruits, primarily due to stem decay, and also the highest pow-dery mildew pressure (Table 3). One cause of stem decay is excessive powdery mildew.
All varieties had dark orange skins except for Camaro, which was light orange, Table 4. This reduced its price at the Lincoln County Auction in Kentucky. Most of the varieties
Table 3. Pumpkin variety yield, size and percent culls
VarietySeed
SourceDays to
Harvest1Yield
(lb/A)2Yield
(No/A)2Size(lb)2
Culls(%)2
PM severity,
upper leaf surface
(%)3
PM severity,
lower leaf surface
(%)3Disease
Resistance4
Kratos SW 115 66,435 a 3,718 a 17.9 cd 12 cd 14.8 ab 18.8 ab IR: pmCamaro BL 110 61,117 ab 3,441 a 17.8 cd 18 bc 6.8 a 6.0 a IR: pmAladdin SW 110 59,731 abc 3,290 ab 18.3 cd 22 b 15.8 ab 24.5 bc IR: pmApollo SW 110 57,728 abc 3,769 a 15.3 e 9 d 21.5 ab 25.8 bc IR: pmEarly King SI 90 54,161 abc 2,798 bc 19.3 c 20 bc 22.7 b 28.1 bc IR: pmEarly Giant SI 95 49,386 bc 1,739 d 28.0 a 33 a 27.3 b 37.7 c IR: pmEl Toro SI 95 47,171 c 2,483 c 18.8 cd 20 bc 12.9 ab 18.8 ab IR: pmCronus SW 115 34,213 d 1,550 d 22.1 b 16 bcd 15.8 ab 33.2 bc IR: pmHowden BL 115 31,732 d 1,865 d 17.1 de 29 bc 12.7 ab 34.1 bc IR: br
1 Days to harvest as listed by seed companies. 2 Means in same column followed by same letters are not significantly different (Waller-Duncan multiple range test LSD P = 0.05).3 Powdery mildew severity was rated on upper and lower sides of 20 leaves per replicate on August 11, 2017 using the Horsfall-Barratt scale. Data
were transformed to the midpoint prior to conducting analysis of variance on the split-plot design. Means in the same column followed by the same letters are not significantly different (Tukey test P = 0.05).
4 Disease resistance as published by seed companies: IR = Intermediate resistance; pm = powdery mildew; br= black rot
Table 4. Pumpkin fruit characteristics
Variety Color1Shape(1-5)2
Smoothness(1-5)3
Ribbing(1-5)4
Stem(1-5)5 Comments
Kratos do 2.4 3.8 4.0 4.5 Very attractive fruit, very nice stemsCamaro lo 2.6 4.3 2.4 3.9 Thinner stemsAladdin do 2.0 3.8 2.9 3.3 Thinner stemsApollo do 2.2 3.1 3.3 3.9 Very attractive fruit, good stemsEarly King do 2.1 2.7 3.5 4.0 Variable fruit size and shape, good stemsEarly Giant do 2.0 3.5 3.6 3.1 Attractive tall pumpkins, more decayed stemsEl Toro do 2.4 3.5 3.6 4.2 Attractive fruit, very nice stemsCronus do 2.3 2.3 4.0 4.7 Very attractive fruit; very large, embedded, buttressed stemsHowden do 2.4 3.1 3.7 3.3 Variable fruit size and shape
1 Pumpkin skin color: do = dark orange; lo = light orange. 2 Shape: 1 = oblate; 2 = blocky; 3 = round; 4= flat; 5= highly variable.3 Smoothness; 1= rough warty; 5 = very smooth. 4 Ribbing; 1 = no ribbing; 5 = heavy ribbing.5 Stem quality; 1= poor; 5 = excellent.
had a blocky shape, but Camaro, Kratos, El Toro, and How-den shapes varied more from blocky to round. Early Giant and Early King produced mostly tall, elongated pumpkins. Cronus and Early King had rougher skin, which was not objectionable, and Camaro had a very smooth skin. Kratos and Cronus had deeper, very apparent ribbing; Camaro had little ribbing. The Kratos and Cronus varieties had very large, attractive, green stems, many of which were indented into the fruit and but-tressed.
Acknowledgments The authors would like to thank Joseph Tucker, Dave Low-
ry, Jackson Fallon, Steve Diver, Grant Clouser, Somjintana Sut-thithanakool and Kanokwan Khanthawong for their help and assistance in the successful completion of this trial.
Funding for this project was provided by a Kentucky Horti-culture Council grant through the Agricultural Development Fund and general support from the University of Kentucky College of Agriculture, Food, and Environment.
33
VEGETABLES AND HERBS
Soil Amended with Organic Manure Elevated Antioxidants Content of Arugula and Mustard Greens
George F. Antonious, Division of Environmental Studies, College of Agriculture, Food Science, and Sustainable Systems, Kentucky State University, Frankfort, Kentucky
IntroductionAnimal manure applied as organic fertilizer has important
properties that cannot be obtained from synthetic inorganic fertilizers. Manures increase soil organic matter, improve soil physical structure, enhance soil fungal and bacterial activ-ity, reduce eutrophication (excess N and P in natural water resources), provide low-cost adsorbents that bind with agri-cultural contaminants and prevent natural water contamina-tion by pesticides (Antonious 2015). Over the past 50 years, N and P entering our nation’s waters have increased dramati-cally (Keehner et al. 2011). Municipal sewage sludge (SS), a by-product of sewage treatment plants, is currently applied to some agricultural soils as an alternative to conventional inorganic fertilizers. Microorganisms in SS and other animal manures facilitate the slow release of the three main plant nu-trients, N, P, and K, from soil organic matter.
Use of animal manure may reduce dependence on inor-ganic fertilizers and may provide alternative fertilizers for improving soil structure and nutrient status (Antonious et al. 2013). Use of organic amendments has been reviewed (An-tonious 2009; Ozores-Hampton and Peach 2002). The use of chicken manure (CM) has overtaken use of other animal ma-nure (e.g. pig manure, horse manure, and cow manure). Poul-try litter contains all essential plant nutrients (N, P, K, S, Ca, Mg, B, Cu, Fe, Mn, Mo, and Zn), and has been documented as an excellent fertilizer (Subramanian and Gupta 2006). CM is one of the most commonly used soil amendments in the U.S. Because of the rapid growth of the poultry industry, CM has become increasingly available in recent years. Regarding the use of horse manure (HM) as organic fertilizer, typically, a ton of horse manure contains 11 pounds of N, 2 pounds of P and 8 pounds of K (Westendorf and Krogmann 2013). HM contains about 60 percent solids and 40 percent urine (Wheeler 2009).
A review of the literature revealed a lack of information re-garding the impact of organic amendments on resulting plant nutritional and antioxidant properties. Investigators have fo-cused on the plant yield and soil physical and chemical prop-erties following the incorporation of animal manures as soil amendments with very little focus on the plant nutritional and antioxidant contents. Accordingly, the objectives of this study were to assess the impact of animal manure on arugula and mustard sugar and antioxidant content (ascorbic acid and to-tal phenols).
Materials and MethodsThe trial was conducted within an arugula (Eruca sativa)
and mustard (Brassica juncea) field. Plants were grown on April 17, 2015 in 30 feet × 144 feet beds of freshly tilled soil at the University of Kentucky Horticultural Research Farm (Lex-
ington, KY). Each bed, 12 feet × 30 feet, was divided into three replicates in a randomized complete block design (RCBD) with four soil treatments. The entire study area contained 24 experimental plots (2 crops × 3 replicates × 4 treatments). The treatments were native soil amended with: 1) sewage sludge (SS), 2) chicken manure (CM), 3) horse manure (HM). Animal manures were applied to soil to achieve a concentration of 5 percent N in each plot, except for the no-mulch bare soil (con-trol treatment). SS used in this study was purchased from the Metropolitan Sewer District, Louisville, Kentucky. CM was obtained from the Department of Animal and Food Sciences, University of Kentucky, Lexington, Kentucky. HM was ob-tained from the Kentucky Horse Park (Lexington, Kentucky).
Arugula and mustard were grown according to Kentucky agricultural guidelines (Hessin et al. 2015), and no inorganic fertilizers were applied. At harvest (July 20, 2015), representa-tive plant leaves (20 g) were blended with 150 mL of ethanol to extract phenols. The homogenates were filtered through Whatman No. 1 filter paper and one mL aliquots of filtrate were used for determination of total phenols using the Folin-Ciocalteu method (McGrath et al. 1982) against a standard cal-ibration curve (1 to16 μg mL-1) using chlorogenic acid (Fisher Scientific Company, Pittsburg, PA, USA). Ascorbic acid was extracted by blending 20 g of leaves with 100 mL of 0.4 percent (w/v) oxalic acid (Antonious and Kasperbauer 2002) and was quantified using the potassium ferricyanide method (Hashmi 1973). Soluble sugars in 25 g leaves were extracted with 80% ethanol and quantified by the method described by VanEtten et al. 1974). Concentrations of ascorbic acid, total phenols, and sugar contents were compared using analysis of variance and Duncan’s multiple range test for mean comparisons (SAS In-stitute 2016).
Results and DiscussionOverall, regardless of crop type, SS, CM, and HM signifi-
cantly (P< 0.05) increased ascorbic acid in plants by 82, 90, and 31 percent, respectively. Whereas, SS, CM, and HM signifi-cantly increased total phenols by 77, 70, and 36%, respectively compared to the no mulch bare soil (data not shown).
Ascorbic acid and phenols concentrations in arugula (Fig-ure 1, upper graph) were greatest in plants grown in SS and CM amended soils compared to HM and NM soils. Concen-trations of free sugars did not differ among the three animal manures tested, but were significantly greater than that for the NM soil. Similarly, mustard plants grown in SS and CM amended soils contained the greatest concentrations of ascor-bic acid and phenols (Fig. 1, lower graph) compared to HM and NM treatments. When the responses of the two crops were averaged, no significant differences were found among the three soil amendments in soluble sugars concentrations
34
VEGETABLES AND HERBS
(Fig. 2), whereas, ascorbic acid and phenols con-centrations were greatest in SS and CM amend-ed soils.
In summary, pronounced differences in ascorbic acid and phenols concentrations were found among arugula and mustard greens grown under the different soil amendments tested. Overall, regardless of plant type, plants grown in SS and CM amended soil contained the greatest concentration of ascorbic acid (855 and 892 µg g-1 fresh tissue, respectively) and total phenols (609 and 587 µg g-1 fresh tissue, respectively), whereas, the concentra-tion of soluble sugars were not significantly different among animal manures tested. These results revealed great variability among the or-ganic amendments tested for their influence on ascorbic acid and total phenols, two important phytochemicals in plants. This was a research study and the manures used in this study were not composted and the 130 day interval recom-mended between application and harvest was not adhered to. Growers using manure that is not properly composted should adhere to the 130 day recommendation.
AcknowledgmentsThe author thanks Steven Diver and his farm
crew for maintaining the field plots, and Alex-ander Antonious and Thomas Trivette for col-lecting the leaf samples. This study was funded by a grant from the United States Department of Agriculture, National Institute of Food and Agriculture (USDA/NIFA) No. KYX-10-13-48P to Kentucky State University.
Literature CitedAntonious, G.F., 2015. Decontamination of
Antonious, G.F., Turley, E.T., Hill, R.R., Snyder, J.C. Effect of municipal refuse and chicken manure applications on kale and collard green yields and quality. In Fruit and Veg-etable Research Report, December 30, 2013, PR-673, pages 37-39, University of Kentucky, College of Agriculture, Food and Environ-ment, Lexington, KY 40546.
Antonious G.F., 2009. Enzyme activities and heavy metals concentration in soil amended with sewage sludge. J. Environ. Science & Health, Part-A Toxic/Hazardous Substances & Environmental Engineering, Volume A44, Issue No.10, p 1019-1024.
Figure 1. Concentrations of ascorbic acid (AA), total phenols and soluble sugars ± std error in arugula (upper graph) and mustard (lower graph) grown under four soil management practices. Statistical comparisons were carried out among four soil management practices for each parameter. Bars accompanied by the same letter are not significantly different (P> 0.05) using Duncan’s multiple range test.
Figure 2. Overall concentrations of ascorbic acid (AA), total phenols and soluble sugars ± std. error under four soil management practices. Statistical comparisons were carried out among four soil management practices for each parameter. Bars accompanied by the same letter are not significantly different (P> 0.05) using Duncan’s multiple range test.
35
VEGETABLES AND HERBS
Antonious, G.F., Kasperbauer, M.J. 2002. Color of light reflect-ed to leaves modifies nutrient content of carrot roots. Crop Sci. 42, 1211-1216.
Bessin, R., Seebold, K., Saha S., Wright S. and Strang, J., 2015. Vegetable Production Guide for Commercial Growers, Co-operative Extension Service Bulletin ID-36, University of Kentucky, College of Agriculture, Lexington, KY.
Hashmi, M.H., 1973. Spectrophotometric determination with potassium ferricyanide. In: Assay of vitamins in pharma-ceutical preparations, John Wiley and Sons.
Keehner D, Conde R, Preston S. Nitrogen and phosphorus: Tools for developing state nitrogen and phosphorus pollu-tion reduction strategies, 2011. http://water.epa.gov/learn/training/wacademy/archives.cfm
McGrath, R.M., Kaluza, W.Z., Daiber, K.H., Van der Riet, W.R., Glennie, C.W. 1982. Polyphenols of sorghum grain, their change during malting and their inhibitory nature. J Agric. Food Chem. 30:450-456.
Ozores-Hampton, M. and Peach, S. 2002. Biosolids in vegeta-ble production systems. Hort Technology 12 (3):336-340.
SAS Institute Inc. SAS/STAT Guide, Version 6.4 SAS Inc., Campus Drive, Cary, NC 27513; 2016.
Subramanian, B., Gupta, G. 2006. Adsorption of trace ele-ments from poultry litter by montmorillonite clay. J. Haz-ard Mater B128:80–83.
VanEtten, C.H.; McGrew, C.E.; Daxenbichler, M.E., 1974. Glu-cosinolate determination in Cruciferous seeds and meals by measurement of enzymatically related glucose. J. Agric. Food Chem. 22 (3):483–487.
Westendorf, M., Krogmann, U. Horses and Manure. New Jer-sey Agricultural Experiment, New Brunswick, NJ 08901-8525 Cooperative Extension Fact Sheet FS036, September 2013.
Wheeler, E., Zajaczkowski, J. 2009. Horse Stable Manure Man-agement, College of Agricultural Sciences, Agricultural Re-search and Cooperative Extension, The Pennsylvania State University.
Small Scale Equipment to Optimize Tomato Disease ManagementEmily Pfeufer, Will Barlow, and Erica Fealko, Plant Pathology
IntroductionTomatoes are arguably the most popular crop for the farm-
ers’ market, and numerous part-time and small scale produc-ers grow them as part of their vegetable portfolio. Early blight, caused by the fungal pathogen Alternaria tomatephila, and Septoria leaf spot are together the most common diseases of tomato in Kentucky. Early blight may be managed well using a preventative fungicide program, however, the ability to con-trol disease can be as reliant on the choice of delivery method as the types of fungicides used. At the same time, small scale producers may be less likely to invest in top-grade equipment for disease management, since the scale of their operations may dictate more conservative economic investment com-pared to larger scale commercial vegetable producers.
In this trial, identical fungicide programs were used to man-age early blight of tomato, but the tested variable was the deliv-ery equipment used to apply the fungicides. Different types of equipment included a hand-pump backpack sprayer, a mister-blower backpack sprayer, and a CO2 backpack sprayer.
Materials and MethodsTomato seeds were sown in 72-cell flats filled with pre-
wetted ProMix BX on 27 Mar 2017. The variety ‘Sunstart’ was used because it is very susceptible to early blight. The field was located at the University of Kentucky Spindletop Farm in Lex-ington, KY and was prepared with 50 lb/A urea, broadcast and disked. Transplants were set into 18 ft-plots on raised beds prepared with black plastic mulch and a single line of drip ir-rigation on 18 May. Plant spacing was 18-in. and arranged as a randomized complete block design with four replications. Un-
treated border rows were established between treated rows to reduce the chance of spray drift among treatments. Potassium Nitrate was used as a starter fertilizer in the water wheel setter water. On 19 May, Platinum (11.0 fl. oz / A) was applied as a targeted 30 ml/plant drench at the base of each plant for in-sect management. Plants were of slightly reduced quality due to the need to hold them for optimal field conditions. Plants were fertigated with the equivalent of 10 lb calcium nitrate per week.
The fungicide program used was a relaxed schedule of the program defined in the Vegetable Production Guide for Com-mercial Growers, 2016-17 (ID-36), pg. 97. Actual fungicides and rates applied are listed by application date in Table 1. Six fungicide applications were made on 9, 16, and 27 June, and 5, 17, and 26 July. Volumes used were the equivalents of 30 gal/A for June applications and 50 gal/A in July applications. Equip-ment used were a Solo Deluxe 4-Gal Backpack Sprayer with diaphragm pump (retail cost $90), a Stihl SR450 mister-blower (retail cost $710), and an R&D CO2 sprayer (retail cost $1300). At the outset of the experiment, a Solo 5-Gal Rechargeable, Two-Speed backpack sprayer (retail cost approx. $200) was also ordered and intended to be used, but it never success-fully functioned, even after servicing by the supplier. Thus, those data are unavailable for this report. The hand-pumped backpack sprayer was outfitted with an adjustable brass spray nozzle to achieve a hollow-cone spray pattern, while the CO2 sprayer was outfitted with a TX-18 hollow cone nozzle.
Plants were inoculated with a suspension of 2.5 x 10³ A. tomatephila conidia / mL on the evening of 21 June. Plants were rated for disease on 3, 14, and 26 July using the Horsfall-Barratt scale. Disease ratings were transformed to the mid-
36
VEGETABLES AND HERBS
Table 1. Fungicide application dates and ratesApplication date Fungicides applied (rate / A)9 Jun Dithane F45 1.2 qt/A Nordox 2 lb/A Actigard 0.33 oz /A16 Jun Dithane F45 1.2 qt/A Nordox 2 lb/A Actigard 0.33 oz / A27 Jun Quadris 6.0 fl oz/A Dithane 1.2 qt/A5 Jul Initiate 720 1.5 pt/A Nordox 2 lb/A17 Jul Fontelis 20 fl oz/A26 Jul Initiate 720 1.5 pt/A Nordox 2 lb/A
Table 2. Disease severity on three rating dates after inoculation with the early blight pathogen and repeated fungicide applications
Treatment
Early blight July 3(%)z, y
Early blight July 14(%) z, y
Early blight July 26(%) z, y
Untreated 9.7 b 39.2 d 68.0 fHand-pump backpack 1.1 a 2.6 c 11.7 eMister-blower backpack 0.9 a 1.2 c 11.8 eCO2 backpack 0.9 a 1.7 c 7.1 e
z Ratings were assigned using the Horsfall-Barratt scale, but were transformed to the midpoint of the range prior to means calculations and subsequent statistical analysis.
Y Means in the same column followed by the same letters are not significantly different (Tukey test P = 0.05).
Table 3. Marketable and total yields from three harvests of ‘Sunstart’ tomato with three different
Treatment
13 Jul yields(lb/plot)
25 Jul yields(lb/plot)
11 Aug yields(lb/plot)
Marketable Totalz Marketable Total Marketablez Totalz
Untreated 4.9 10.4 a 23.7 53.2 2.7 d 30.8 fHand-pump backpack 4.2 7.3 ab 19.8 35.7 26.6 c 87.6 eMister-blower backpack 1.7 3.7 b 19.2 44.2 37.8 c 86.0 eCO2 backpack 2.7 6.2 ab 20.1 45.0 29.1 c 85.1 e
types of fungicide application used. z Means in the same column followed by the same letters are not significantly different (Tukey test P = 0.05).
point of each rating range prior to statistical analysis. Harvests occurred on 13 and 25 July, and 11 August. Plots were har-vested individually by hand, with marketable yield weighed separately from unmarketable yield. At the 11 August harvest, plants were picked clean, regardless of whether fruit were ad-equately ripened. Analyses of variance with fungicide delivery equipment as the independent factor and disease or yield as the dependent variables were completed using PROC GLM in SAS 9.4. The Tukey test was used for a post-hoc means comparison.
Results and DiscussionAt all disease ratings, untreated plants averaged higher
early blight disease severity than the treated plots. No statisti-cally significant differences were apparent among the fungi-cide delivery methods at each rating date, however, the CO2 backpack severity ratings were numerically the lowest on 26 July (Table 2).
At the final yield estimate, taken on 11 August (Table 3), all fungicide treatments were significantly different from the untreated control. While none of the treatments were statis-tically different from each other, the mister-blower backpack
treatment had numerically the highest marketable yields among the group. On 13 July, this same treatment had signifi-cantly less total yield compared to the untreated plot, but the marketable yields were not statistically different. One reason for this difference may be that the fungicide-treated plants had been treated with Actigard, which is known to occasion-ally drag down yields if applied when plants are in a stressed condition.
Acknowledgments The authors would like to thank Lauren Spencer, Tim Hoey,
Ruiyang Liu, Fan Xia, Xinyu Yuan, Xueqiong Xiao, Shine Baby, Jiaqi You, John Walsh, Jack Zeleznik, Grace Ragain, Dr. Bob Pearce, and Nolan Stephenson for their assistance with har-vests. We would also like to thank the farm crew at Spindletop Farm and Dr. Ric Bessin for their assistance in setting up the field plots.
Funding for this project was provided by a grant from the Kentucky Vegetable Growers Association and general support from the University of Kentucky College of Agriculture, Food, and Environment.
37
VEGETABLES AND HERBS
Table 1. Impact of Liqui-Plex, Soil-Set, and Grain-Set on hot pepper, Capsicum annuum var. Georgia Flame yield, number of fruits, and fruit quality characteristics of plants grown at KSU Research Farm (Franklin County, KY)
Treatment Fruit/plot (No.) Wt. of Fruits (g/plot) Fruit Length (cm) Fruit Width (cm)Fruit Wall Thickness
(mm)Harvest 1Liqui-Plex 192.8 a 5744 a 11.65 b 3.54 a 0.31 aControl 186 b 5130 c 11.84 ab 3.44 a 0.31 aSoil-Set 173 c 5245 b 12.19 a 3.49 a 0.3 aGrain-Set 154.8 d 4230 d 12.22 a 3.42 a 0.3 aHarvest 2Liqui-Plex 551.38 a 11213.1 a 12.24 a 3.48 a 0.277 aControl 489 b 9280.2 b 11.61 a 3.34 ab 0.288 aSoil-Set 546.51 a 10642.6 a 11.81 a 3.23 b 0.271 aGrain-Set 536.25 a 10650.7 a 11.58 a 3.14 b 0.272 aAverage Total HarvestLiqui-Plex 369.79 a 8444.2 a 11.94 a 3.51 a 0.29 aControl 337.5 c 7205.3 c 11.72 a 3.39 ab 0.30 aSoil-Set 359.87 ab 7943.7 b 11.99 a 3.36 ab 0.29 aGrain-Set 345.50 bc 7440.4 c 11.89 a 3.28 b 0.28 a
Note that each value in the table is an average of 12 replicates of each soil treatment. Statistical analysis was carried out among soil treatments. Values accompanied by the same letter(s) are not significantly different (P> 0.05) using SAS procedure.
Investigating the Impact of Soil-Set®, Grain-Set®, and Liqui-Plex® Formulations on Hot Pepper, Capsicum annuum Yield
George Antonious, Kirk Pomper, Eric Turley, Quinn Heist, Thomas Trivette, Lusekelo Nkuwi, Yogendra Upadhyaya, and Bijesh Mishra, Division of Environmental Studies, College of Agriculture, Food Science, and Sustainable Systems, Kentucky State University, Frankfort, Kentucky 40601
IntroductionHot pepper, Capsicum spp. is a source of antioxidants
(Antonious 2017; Antonious et al. 2017). The consumption of hot pepper has increased during the last decade due to the in-creased consumption by ethnic populations and a greater in-terest in ethnic foods in the U.S. The impact of Soil-Set® (a soil amendment that contains natural enzymatic compounds and balanced nutrients), Grain-Set® (a foliar fertilizer that supplies Mn, S, and Zn to the growing plant), and Liqui-Plex® Bonder WP (a foliar fertilizer that contains minerals complexed with amino acids) on pepper yield and fruit quality characteristics (fruit length, width, and wall thickness) were investigated.
Soil-Set is one of the Organic Material Review Institute (OMRI)–listed products, approved for use in organic farms (https://www.omri.org/omri-lists). The product is applied di-rectly to soil before crop emergence to promote decomposi-tion of crop residues and other organic matter and improve soil structure, ultimately contributing to improved root de-velopment. It contains essential elements for plant growth (Cu, Fe, S, Mn, and Zn), bacterial metabolites, and natural en-zymes. Kunito et al. (2001) and Antonious (2016) studied the impact of metals on soil microbial activity and reported that Cu and Zn may impact soil microorganisms and total enzymes secreted in soil.
Crop-Set contains a similar mix of essential elements (S, Cu, Fe, and Mn) and plant extracts but is applied as a foliar fertil-izer after crop emergence to provide plant essential nutrients. Liqui-Plex is another foliar spray that contains micronutrients complexed with amino acids needed for plant growth. Foliar application of fertilizers bypasses chemical reactions in the
soil that can make nutrients unavailable to plants. The effect of these formulations on yield and quality of treated crops re-quire further investigation to evaluate the potential outcomes of wide application of such materials in order to stimulate the use of these organic products in agricultural production sys-tems.
Materials and MethodsA field study was designed at Kentucky State University
Harold R. Benson Research and Demonstration Farm on a silty-loam soil. Sixteen field plots 4 foot wide and 30 foot long (120 foot2 each) were used in a randomized complete block design (RCBD) with four soil treatments (Soil-Set, Grain-Set, Liqui-Plex, and control plots) replicated four times with two border plots (one at each side of the field study). Each block was divided into the following four treatments: 1) control (un-treated soil and untreated plants); 2) Soil-Set, applied at 32 oz per acre at planting; 3) Grain-Set, applied at 8 oz per acre at vegetative stage; and 4) Liqui-Plex Bonder WP, applied at 16 oz. per acre at vegetative stage. The soil was planted with 72 day old seedlings of hot pepper, Capsicum annuum var. Georgia Flam on June 2, 2017 and drip-irrigated as needed. Soil-Set®, Grain-Set®, and Liqui-Plex® Formulations were obtained from Alltech Crop Science (Nicholasville, KY). Soil-Set was sprayed on June 2 and Grain-Set and Liqui-Plex were sprayed twice, on July 7 and 11, 2017. At harvest, pepper fruit yield, number of ripe fruits, and fruit characteristics (fruit length, width, and fruit wall thickness) were recorded and statistically analyzed using ANOVA procedure (SAS 2016).
38
VEGETABLES AND HERBS
Results and DiscussionIn harvest 1, results revealed that pepper plants treated
with the three formulations during the growing season did not change any of the fruit characteristics (fruit weight, length, width, and fruit wall thickness) tested. Whereas, plants treated with Liqui-Plex formulation produced the greatest yield and greatest number of ripe fruits compared to the other treat-ments. These results could promote the use of this formulation in growing pepper and other vegetables in Kentucky and oth-er states. In harvest 2, weight and number of fruits obtained from all the treated plots were significantly greater (P< 0.05) compared to the control plots.
Results also revealed that pepper fruits obtained from this study are consistent in color and free of noticeable defects. Alltech Soil-Set formulated product used in this investigation is organic and OMRI (https://www.omri.org/omri-lists) ap-proved. The development of the market for organically pro-duced food has been largely consumer led. As a result, organic farming is one of the fastest growing segments of U.S. agricul-ture, and producers, exporters, and retailers are still struggling to meet consumer demand for a wide range of organic prod-ucts. Table 1 shows that the average harvest of plants grown in soil treated with Liqui-Plex produced the larger yield in com-parison with the control treatment.
AcknowledgmentsThis investigation was supported by an Evans-Allen grant
from the USDA/NIFA to Kentucky State University under agreement # KYX 10-13-48P.
ReferencesAntonious, G.F. 2017. Diversity in capsaicin and dihydrocap-
saicin content in hot pepper genotypes. J. Environmental Science & Ecology 5 (1):1042:1–6. https://www.jscimedcentral.com/EnvironmentalScience/environmentalscience-5-1042.pdf.
Antonious, G.F., Antonious, A.G., Trivette, T.G. 2017. Screen-ing previously uncharacterized genotypes of hot pepper for ascorbic acid, phenols, β-carotene, and soluble sugars con-tent. J. Environmental Science & Ecology 5 (2) 1046:1–8. https://www.jscimedcentral.com/EnvironmentalScience/environmentalscience-5-1046.pdf.
Antonious, G.F. 2016. Soil amendments for agricultural pro-duction. In: Organic Fertilizers: From Basic Concepts to Applied Outcomes. Larramendy, M.L., and Soloneski, S. (eds.). Intech, Rijeka, Croatia. Pages 157-187.
Kunito, T., Saeki, K., Goto, S., Hayashi, H., Oyaizu, H., Matsu-moto, S. 2001. Copper and zinc fractions affecting micro-organisms in long-term sludge-amended soils. Bioresour. Technol. 79:135–146.
SAS Institute Inc. SAS/STAT Guide, Version 9.16, Cary, NC, 2016.
Sustainable Production of Living Organic Container-Grown Kitchen HerbsBridget A. Reed, Sharon T. Kester, and Robert L. Geneve, Horticulture
IntroductionThere is an established and grow-
ing market for 4-inch container-grown organic kitchen herbs. More and more, consumers are interested in organically grown produce, and the convenience of having a living plant to cut herbs from is clearly desirable since these plants stay fresher for many weeks as opposed to cut herbs in plastic packs that only last a few days. Most production of kitchen herbs in Europe and the U.S. employ sub-irrigation methods that supply water to the plants via the base of the container to avoid “staining” the foliage with the salts from the water used for overhead irrigation. While consumer demand and the potential for an expanded market are present, significant barriers exist for this form of production. Often cited is a lack of production information as well the fact that growers tend to be inexperienced in this area of production (Treadwell et
al., 2007). While organic living kitchen herbs are readily avail-able in the U.S., production methods utilizing an organic fertil-ization regime and alternative bio-containers (i.e. not plastic)
Figure 1. Model capillary mat system used to evaluate organic fertilizers
39
VEGETABLES AND HERBS
Figure 2. Plant height, leaf area, and biomass for Genovese basil grown on capillary mats and fertilized with conventional and organic fertilizers
have not been extensively studied. The objective of this project was to develop a sustainable, organic pro-duction system for living herbs that minimizes water use through capillary mat sub-irrigation that utilizes an organic fertilizer program.
Methods and MaterialsOrganic basil and cilantro seeds purchased from
Johnny’s Selected Seeds were sown at a rate of 10 or 15 seeds per 4-inch plastic container. Each container was filled with an organic certified substrate (Black Gold Organic). Plants were grown using a capillary mat sub-irrigation system placed on a level green-house bench with one end of the mat submerged in a reservoir fitted to a carboy filled with either water or fertilizer. This system establishes a perched water table that provides a constant supply of water and nu-trients to each container (Figure 1).
Plants were sub-irrigated with either water alone, a liquid inorganic (Peters 20-10-20) or organic (Dan-iels 3-1-1) fertilizer at 100 ppm. An additional set of plants had composted feather meal (12% N) incorpo-rated into the substrate at a rate of 7 g L-1. Plants were evaluated after 5 weeks for plant height, biomass and leaf canopy. Leaf canopy areas for the Genovese basil were collected as a means of quantifying visual qual-ity of the plants that a typical consumer may use to choose a plant in a retail setting. Aerial digital images were taken and then evaluated using the Sigma Scan Pro program in order to obtain a total canopy area.
Results and DiscussionPlants seeded at 15 seeds per container produced
greater biomass and overall leaf cover compared to the lower seeding rate. Basil and cilantro plants irri-gated with water alone produced inferior plants for all measured parameters while the highest quality plants were observed in the inorganic control (Figures 2 and 3). Genovese basil produced using the organic liquid fertilizer or incorporated feather meal showed com-parable quality and growth (Fig. 2), but lime basil and cilantro plants showed increased growth with the in-corporated fertilizer compared to liquid organic fer-tilizer (Figure 3).
The inorganic control plants produced the larg-est canopies, while the liquid organic and organic incorporation treatments produced slightly smaller canopies. While plant sizes between the two organic treatments and the inorganic control did not always visually appear to be significantly different (Figure 4), canopy sizes for the inorganically treated plants were significantly larger (Figure 2). However, differences in canopy areas between the two organic treatments were shown to not be statistically significant, suggest-ing that both fertilizing regimes produce comparable plants.
Figure 3. Plant heights and biomass measurements for cilantro and lime basil grown on capillary mats and fertilized with conventional and organic fertilizers
40
VEGETABLES AND HERBS
Organic herb production can present significant challenges (Williams et al. 2016) and specifically, there are few or no stud-ies concerning organic, container-grown herbs. The current study showed that under the conditions of this study, organic fertilization could provide plant growth and quality similar to plants that were fertilized with a commercial liquid fertilizer (Figure 4). Container herbs require 4 to 5 weeks to a saleable product. In these short growing systems, only a small portion of the nitrogen important for growth is available from organic fertilizer sources. Organic vegetable transplant production is also a 4- to 5-week crop, and results have been similar to those reported here. For example, pepper transplants grown with inorganic fertilization showed superior development com-pared to organic options, but addition of the organic fertilizer considerably improved plant development compared to water alone (Gravel et al., 2012).
It does appear that there is potential for an organic produc-tion system using capillary mats to produce commercial qual-ity organic basil and cilantro. Capillary mats are available in scalable systems to fit conventional greenhouse or high tun-nel production. In general, for the current study, composted feather meal performed as well or better than the liquid organ-ic fertilizer. However, the liquid fertilizer required more main-
tenance to prevent algal growth and to clean the system as the fertilizer aged. In contrast, the incorporated feather meal fer-tilizer proved to be much easier to handle in a sub-irrigation system than an organic liquid fertilizer.
Acknowledgments The research was partially supported by the University of
Kentucky Food Connection @UK student opportunity grant 2016.
Literature CitedGravel, V., M. Dorais, and C. Menard. 2012. Organic fertil-
ization and its effect on development of sweet pepper trans-plants. HortScience 47 (2):198–204.
Treadwell, D.D., G.J. Hochmuth, R.C. Hochmuth, E.H. Si-monne, L.L. Davis, W.L. Laughlin, Y. Li, T. Olczyk, R.K. Spren-kel, and L.S. Osborne. 2007. Nutrient management in organic greenhouse herb production: Where are we now? HortTech-nology 17:461–466.
Williams, K.A. and J. Nelson. 2016. Challenges of using or-ganic fertilizers in hydroponic and recirculating production systems. Acta Horticulturae 1112:365–370.
Figure 4. Comparison of overall plant quality across fertilizer treatments for Genovese basil and cilantro
41
42
APPENDIX
Appendix ASources of Vegetable Seeds
The abbreviations used in this appendix correspond to those listed after the variety names in tables of individual trial reports.
AAS ................ All America Selection Trials, 1311 Butterfield Road, Suite 310, Downers Grove, IL 60515
AS/ASG ........ Formerly Asgrow Seed Co., now Seminis (see “S” below)
AC ................... Abbott and Cobb Inc., Box 307, Feasterville, PA 19047AG................... Agway Inc., P.O. Box 1333, Syracuse, NY 13201AM .................. American Sunmelon, P.O. Box 153, Hinton, OK 73047AR ................... Aristogenes Inc., 23723 Fargo Road, Parma, ID 83660AT .................... American Takii Inc., 301 Natividad Road, Salinas, CA
93906B ...................... BHN Seed, Division of Gargiulo Inc., 16750 Bonita
Beach Rd., Bonita Springs, FL 34135BBS ................. Baer’s Best Seed, 154 Green St., Reading, MA 01867BC ................... Baker Creek Heirloom Seeds, 2278 Baker Creek Rd.,
Mansfield, OH 65704BK ................... Bakker Brothers of Idaho Inc., P.O. Box 1964, Twin Falls,
ID 83303BL .................... Burrell Seed Growers, P.O. Box 150, Rocky Ford, CO
81067BR ................... Bruinsma Seeds B.V., P.O. Box 1463, High River, Alberta,
Canada, TOL 1B0BS.................... Bodger Seed Ltd., 1800 North Tyler Ave., South El
Monte, CA 91733BU ................... W. Atlee Burpee & Co., P.O. Box 6929, Philadelphia, PA
San Juan Bautista, CA 95045CN ................... Canners Seed Corp., (Nunhems) Lewisville, ID 83431CR ................... Crookham Co., P.O. Box 520, Caldwell, ID 83605CS ................... Chesmore Seed Co., P.O. Box 8368, St. Joseph, MO
64508D ..................... Daehnfeldt Inc., P.O. Box 947, Albany, OR 97321DN .................. Denholm Seeds, P.O. Box 1150, Lompoc, CA 93438-
Rochester, NY 14692-2960HS ................... Heirloom Seeds, P O Box 245, W. Elizabeth PA 15088-
0245HZ ................... Hazera Seed, Ltd., P.O.B. 1565, Haifa, IsraelJU .................... J. W. Jung Seed Co., 335 High St., Randolf, WI 53957JS/JSS ............ Johnny’s Selected Seeds, Foss Hill Road, Albion, MA
04910-9731KB ................... K&B Development, LLC., 10030 New Avenue, Gilroy,
CA 95020KS.................... Krummrey & Sons Inc., P.O. 158, Stockbridge, MI 49285KY/KU ............ Known-You Seed Co., Ltd. 26 Chung Cheng Second
City 280, Japan 0472 65-4847ML ................. J. Mollema & Sons Inc., Grand Rapids, MI 49507MM ................. MarketMore Inc., 4305 32nd St. W., Bradenton, FL
34205MN ................. Dr. Dave Davis, U of MN Hort Dept., 305 Alderman
Hall, St. Paul, MN 55108MR .................. Martin Rispins & Son Inc., 3332 Ridge Rd., P.O. Box 5,
Lansing, IL 60438MS .................. Musser Seed Co. Inc., Twin Falls, ID 83301MWS .............. Midwestern Seed Growers, 10559 Lackman Road,
Lenexa, Kansas 66219NE ................... Neuman Seed Co., 202 E. Main St., P.O. Box 1530, El
Centro, CA 92244NI .................... Clark Nicklow, Box 457, Ashland, MA 01721NU .................. Nunhems (see Canners Seed Corp.)NS ................... New England Seed Co., 3580 Main St., Hartford, CT
06120NZ ................... Nickerson-Zwaan, P.O. Box 19, 2990 AA Barendrecht,
The Netherlands
43
APPENDIX
OE ................... Ohlsens-Enke, NY Munkegard, DK-2630, Taastrup, Denmark
ON .................. Osbourne Seed Co., 2428 Old Hwy 99 South Road Mount Vernon, WA 98273
OR ................... Origene Seeds, P.O. Box 699, Rehovet, IsraelOS ................... Outstanding Seed Co., 354 Center Grange
Road, Monaca PA 15061OLS ................. L.L. Olds Seed Co., P.O. Box 7790, Madison, WI 53707-
IL 60438RS .................... Royal Sluis, 1293 Harkins Road, Salinas, CA 93901RU/RP/RUP .. Rupp Seeds Inc., 17919 Co. Rd. B, Wauseon, OH 43567S ...................... Seminis Inc. (may include former Asgrow and Peto
cultivars), 2700 Camino del Sol, Oxnard, CA 93030-7967
SE .................... Southern Exposure Seed Exchange, P.O. Box 460Mineral, VA 23117
SHUM ............ Shumway Seed Co., 334 W. Stroud St. Randolph, WI 53956
SIT ................... Seeds From Italy, P.O. Box 149, Winchester, MA 01890 SK.................... Sakata Seed America Inc., P.O. Box 880, Morgan Hill,
CA 95038SN ................... Snow Seed Co., 21855 Rosehart Way, Salinas, CA
93980SO .................. Southwestern Seeds, 5023 Hammock Trail, Lake Park,
GA 31636SOC ................ Seeds of Change, Sante Fe, NMSST ................. Southern States, 6606 W. Broad St., Richmond, VA
23230ST .................... Stokes Seeds Inc., 737 Main St., Box 548, Buffalo, NY
14240SU/SS ............. Sunseeds, 18640 Sutter Blvd., P.O. Box 2078, Morgan
Hill, CA 95038SV ................... Seed Savers Exchange, 3094 North Winn Rd., Decorah,
IA 52101SW .................. Seedway Inc., 1225 Zeager Rd., Elizabethtown, PA
17022SY .................... Syngenta/Rogers, 600 North Armstrong Place (83704),
P.O. Box 4188, Boise, ID 83711-4188T/TR ............... Territorial Seed Company, P.O. Box 158, Cottage Grove,
OR 97424TGS ................. Tomato Growers Supply Co., P.O. Box 2237, Ft. Myers,
Saitama-ken 300, JapanTT .................... Totally Tomatoes, P.O. Box 1626, Augusta, GA 30903TW .................. Twilley Seeds Co. Inc., P.O. Box 65, Trevose, PA 19047UA ................... US Agriseeds, San Luis Obispo, CA 93401.UG .................. United Genetics, 8000 Fairview Road, Hollister, CA
95023US ................... US Seedless, 12812 Westbrook Dr., Fairfax, VA 22030V ...................... Vesey’s Seed Limited, York, Prince Edward Island,
Grove, IL 60515-4095VTR ................. VTR Seeds, P.O. Box 2392, Hollister, CA 95024WI ................... Willhite Seed Co., P.O. Box 23, Poolville, TX 76076WP ................. Woodpraire Farms, 49 Kinney Road, Bridgewater, ME
04735ZR ................... Zeraim Seed Growers Company Ltd., P.O. Box 103,
Gedera 70 700, Israel
44
The College of Agriculture is an Equal Opportunity Organization12-2017
Mention or display of a trademark, proprietary product, or firm in text or figures does not constitute an endorsement and does not imply approval to the exclusion of other suitable products or firms.