Research Library Research Library Bulletins 4000 - Research Publications 2012 Agricultural greenhouse gas emissions Agricultural greenhouse gas emissions Meredith Fairbanks David Bowran Geraldine Pasqual Follow this and additional works at: https://researchlibrary.agric.wa.gov.au/bulletins Part of the Agriculture Commons, Forest Sciences Commons, and the Natural Resources and Conservation Commons Recommended Citation Recommended Citation Fairbanks, M, Bowran, D, and Pasqual, G. (2012), Agricultural greenhouse gas emissions. Department of Primary Industries and Regional Development, Western Australia, Perth. Bulletin 4837. This bulletin is brought to you for free and open access by the Research Publications at Research Library. It has been accepted for inclusion in Bulletins 4000 - by an authorized administrator of Research Library. For more information, please contact [email protected].
Transcript
Research Library Research Library
Bulletins 4000 - Research Publications
2012
Agricultural greenhouse gas emissions Agricultural greenhouse gas emissions
Meredith Fairbanks
David Bowran
Geraldine Pasqual
Follow this and additional works at: https://researchlibrary.agric.wa.gov.au/bulletins
Part of the Agriculture Commons, Forest Sciences Commons, and the Natural Resources and
Conservation Commons
Recommended Citation Recommended Citation Fairbanks, M, Bowran, D, and Pasqual, G. (2012), Agricultural greenhouse gas emissions. Department of
Primary Industries and Regional Development, Western Australia, Perth. Bulletin 4837.
This bulletin is brought to you for free and open access by the Research Publications at Research Library. It has been accepted for inclusion in Bulletins 4000 - by an authorized administrator of Research Library. For more information, please contact [email protected].
Agricultural Greenhouse Gas EmissionsDAFWA Bulletin numBer 4837
Meredith Fairbanks, David Bowran and Geraldine Pasqual
Supporting your success
Agricultural Greenhouse Gas Emissions
AcknowledgementsThis publication is funded by the Department of Agriculture and Food Western Australia (DAFWA), Grains Research and Development
Corporation and the Australian Government’s Climate Change Research Program under the project DAW 00202 Demonstrating adaptation to
climate change in the wheatbelt of Western Australia through innovative on-farm and virtual farm approaches. The suggestions and information
provided by Kari-Lee Falconer, DAFWA and Fran Hoyle, DAFWA are greatly appreciated.
Disclaimer
The Chief Executive Officer of the Department of Agriculture and Food and the State of Western Australia accept no liability whatsoever by
reason of negligence or otherwise arising from the use or release of this information or any part of it.
Contents
The Issue ..................................................................................................................................................... 2
Challenges for Mitigation .......................................................................................................................... 18
Agriculture contributes 15.5 per cent of Australia’s emissions (Figure 1), largely due to methane, from ruminant livestock digestion, nitrous oxide
from soils and carbon dioxide from fossil fuel use (Australian National Greenhouse Accounts 2011; ABARES 2011). This bulletin identifies current
ways to reduce greenhouse gas emissions from Australian agriculture.
ElectricalGeneration
36%
DirectFuel
Combustion15%
Agriculture15%
Transport14%
FugitiveEmissions
7%
IndustrialProcesses
5%
Waste5%
Deforestationand Forestry
3%
Figure 1. Australian fossil carbon emission profile based on 2009 emissions (from Australian national Greenhouse Accounts, 2011). emissions are mainly from coal and natural gas burning for electricity generation, and petroleum products in the transport sector. methane and carbon dioxide also escape into the atmosphere when coal is mined and gas is produced.
introduction
The enhanced greenhouse gas effect refers to the rise of the
equilibrium temperature at the Earth’s surface. This occurs as
a result of humans releasing greenhouse gases from fossil fuel
use or altering agricultural and natural systems and so increasing
these gases in the atmosphere above pre-industrial levels. Carbon
dioxide (CO2), methane (CH4) and nitrous oxide (N2O) are the major
gases responsible for this enhanced greenhouse effect (Eckard and
Armstrong 2009). Each greenhouse gas has a different capacity to
cause greenhouse warming. This capacity is measured in carbon
dioxide equivalents (CO2-e) and depends on the lifetime of the gas
and its ability to trap heat in the atmosphere. For example, during a
100 year time frame, one tonne of methane is equivalent in warming
potential to 21 tonnes of carbon dioxide, and one tonne of nitrous
oxide is equivalent to 310 tonnes of carbon dioxide (ABARES 2011;
Crutzen 1981) (see box 1 for glossary of greenhouse gases).
Methane and nitrous oxide are the two main gases from agriculture
which contribute substantially to the Australian total greenhouse gas
emissions. In 2009, agriculture produced an estimated 84.7 million
tonnes (mt) of equivalent carbon dioxide (CO2-e) emissions. The
sector is the dominant national source of both methane and nitrous
oxide accounting for 65.3 mt CO2-e (57.9 per cent) and 19.5 mt CO2-e
(74.5 per cent), respectively of the net national emissions (see table
1 for breakdown of greenhouse gas sources) (Australian National
Greenhouse Accounts 2011).
Box 1. Glossary of greenhouse gases
MethaneMethane is a natural by-product of wetland rice paddy farming,
ruminant digestion and anaerobic decomposition of biological
material, and has a global warming potential 21 times that of carbon
dioxide. Animals produce methane as a by-product of fermentative
digestion in the rumen and hind gut. Methane is largely released
through the animals’ mouths (ABARES 2011). The amount of methane
produced by the ruminant livestock industry can be from 250 – 500L/
animal/day (Jones et al 2009). Efforts to lower emissions from animal
production systems are considered important for achieving long
term domestic emissions targets and moderating their impact on
climate change.
Nitrous oxideNitrous oxide emissions account for about ten per cent of global
greenhouse gas emissions, with 90 per cent of these emissions
derived from agricultural practices (Smith et al 2007). Nitrous oxide
in soils is produced largely by the microbial process of denitrification
and to a lesser extent by nitrification. Nitrification is an aerobic
process that oxidises ammonium (NH4+) to nitrate (NO3
-), with N2O as
a by-product, whereas dissimilatory nitrate reduction (denitrification)
is an anaerobic process that reduces NO3 – to nitrogen gas (N2), with
N2O as an obligatory intermediate (de Klein and Eckard, 2008). As
a consequence of its high global warming potential, nitrous oxide
emissions from land can have a large bearing on the assessment
of greenhouse gases from cropping systems (Australian National
Greenhouse Accounts 2011). Nitrous oxide has also been implicated
as an increasing contributor to ozone depletion, with potential
negative consequences for the recovery of the ozone hole over
Antarctica (de Laat and van Weele 2011)
Agricultural Greenhouse Gas Emissions 3
4 Agricultural Greenhouse Gas Emissions
introduction
Carbon dioxideThe National Greenhouse Gas Inventory does not include carbon
dioxide emissions from farm machinery in the agriculture sector.
Carbon dioxide is included in this report as studies have found
carbon dioxide emissions produced by fossil fuels account for a large
proportion of pre-farm greenhouse gas emissions and also a small
proportion of on-farm and post farm emissions (Barton et al 2008a).
Box 1. Glossary of greenhouse gases (continued)
Sources and sinks of agricultural greenhouse gases
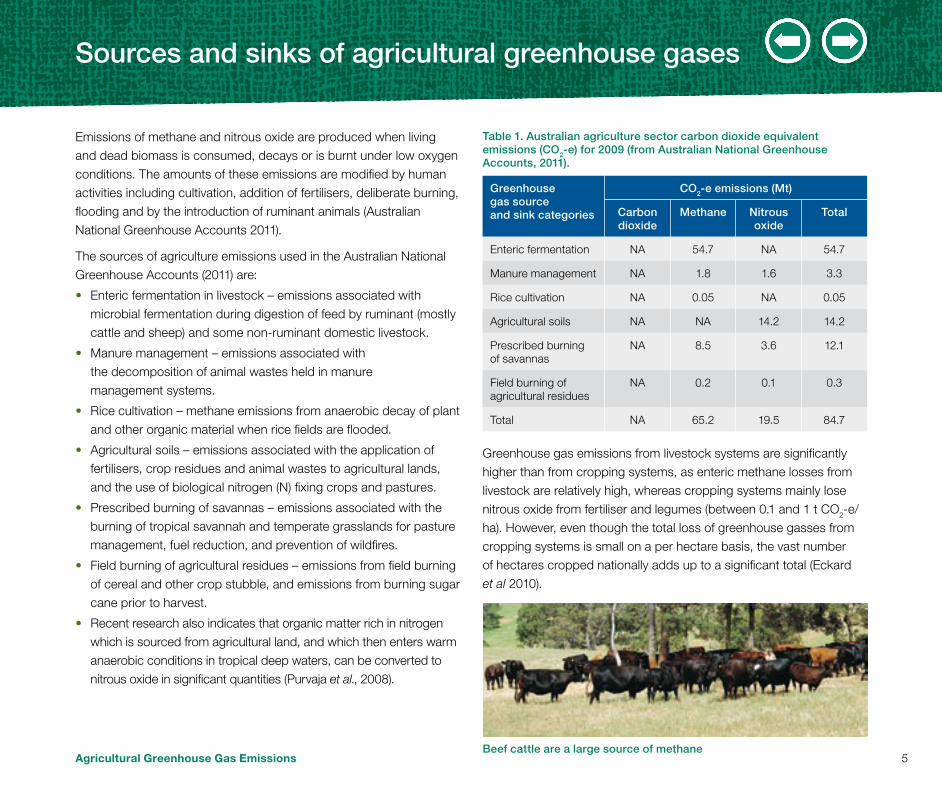
Emissions of methane and nitrous oxide are produced when living
and dead biomass is consumed, decays or is burnt under low oxygen
conditions. The amounts of these emissions are modified by human
activities including cultivation, addition of fertilisers, deliberate burning,
flooding and by the introduction of ruminant animals (Australian
National Greenhouse Accounts 2011).
The sources of agriculture emissions used in the Australian National
Greenhouse Accounts (2011) are:
• Enteric fermentation in livestock – emissions associated with
microbial fermentation during digestion of feed by ruminant (mostly
cattle and sheep) and some non-ruminant domestic livestock.
• Manure management – emissions associated with
the decomposition of animal wastes held in manure
management systems.
• Rice cultivation – methane emissions from anaerobic decay of plant
and other organic material when rice fields are flooded.
• Agricultural soils – emissions associated with the application of
fertilisers, crop residues and animal wastes to agricultural lands,
and the use of biological nitrogen (N) fixing crops and pastures.
• Prescribed burning of savannas – emissions associated with the
burning of tropical savannah and temperate grasslands for pasture
management, fuel reduction, and prevention of wildfires.
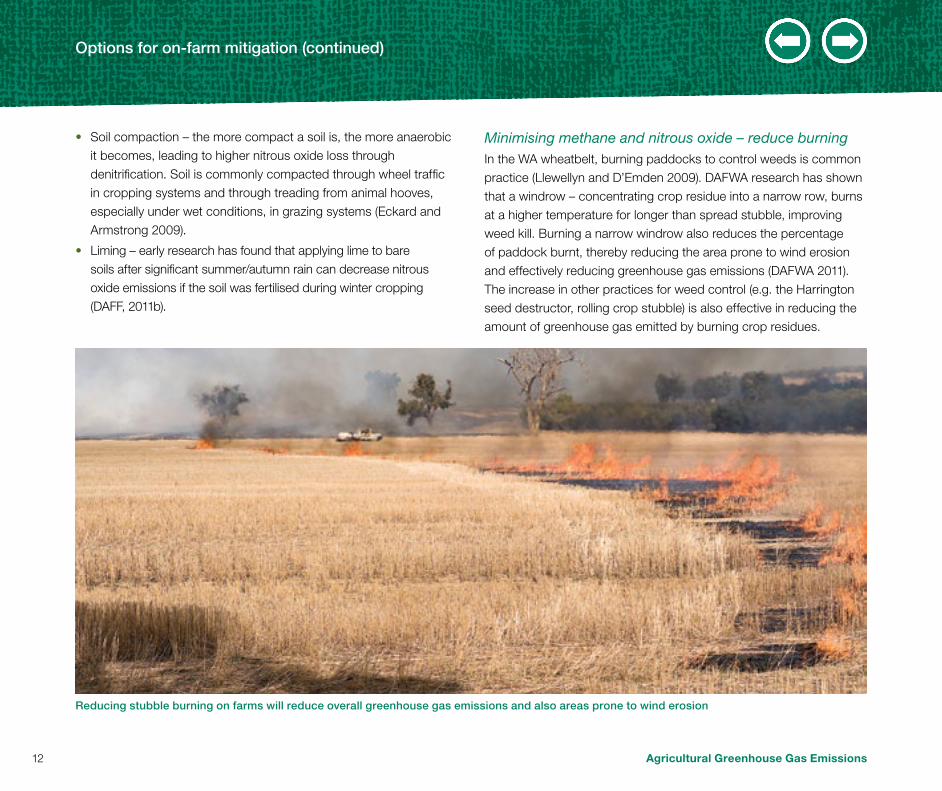
• Field burning of agricultural residues – emissions from field burning
of cereal and other crop stubble, and emissions from burning sugar
cane prior to harvest.
• Recent research also indicates that organic matter rich in nitrogen
which is sourced from agricultural land, and which then enters warm
anaerobic conditions in tropical deep waters, can be converted to
nitrous oxide in significant quantities (Purvaja et al., 2008).
table 1. Australian agriculture sector carbon dioxide equivalent emissions (CO2-e) for 2009 (from Australian national Greenhouse Accounts, 2011).
Greenhouse gas source and sink categories
CO2-e emissions (mt)
Carbon dioxide
methane nitrous oxide
total
Enteric fermentation NA 54.7 NA 54.7
Manure management NA 1.8 1.6 3.3
Rice cultivation NA 0.05 NA 0.05
Agricultural soils NA NA 14.2 14.2
Prescribed burning of savannas
NA 8.5 3.6 12.1
Field burning of agricultural residues
NA 0.2 0.1 0.3
Total NA 65.2 19.5 84.7
Greenhouse gas emissions from livestock systems are significantly
higher than from cropping systems, as enteric methane losses from
livestock are relatively high, whereas cropping systems mainly lose
nitrous oxide from fertiliser and legumes (between 0.1 and 1 t CO2-e/
ha). However, even though the total loss of greenhouse gasses from
cropping systems is small on a per hectare basis, the vast number
of hectares cropped nationally adds up to a significant total (Eckard
et al 2010).
Beef cattle are a large source of methaneAgricultural Greenhouse Gas Emissions 5
6 Agricultural Greenhouse Gas Emissions
Sources and sinks of agricultural greenhouse gases
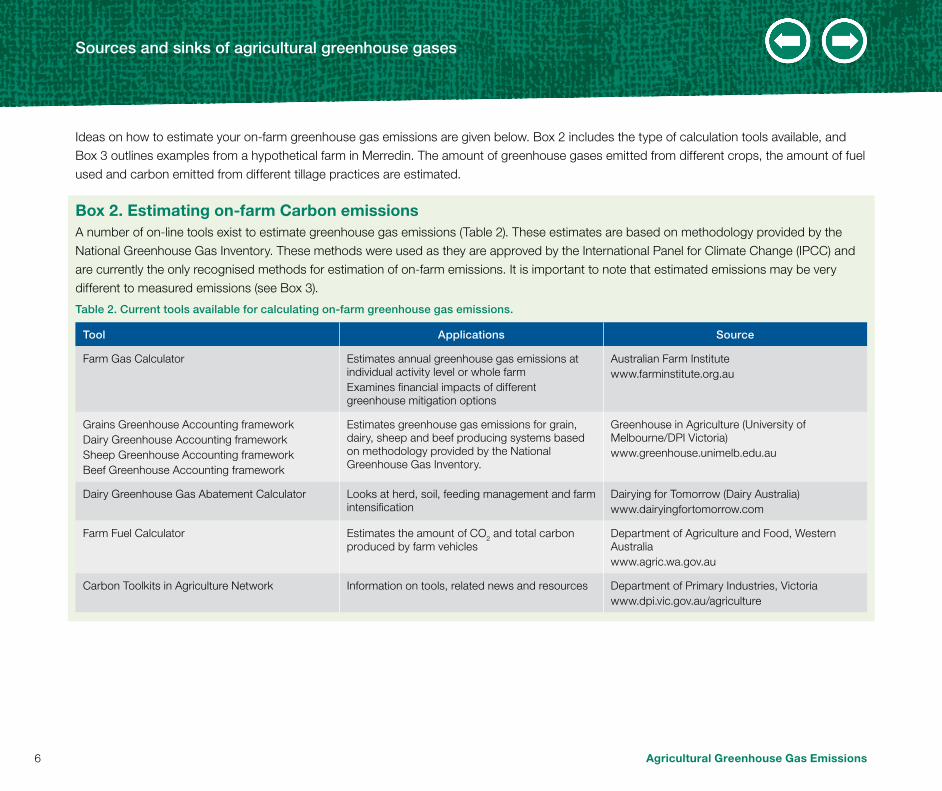
Ideas on how to estimate your on-farm greenhouse gas emissions are given below. Box 2 includes the type of calculation tools available, and
Box 3 outlines examples from a hypothetical farm in Merredin. The amount of greenhouse gases emitted from different crops, the amount of fuel
used and carbon emitted from different tillage practices are estimated.
Box 2. Estimating on-farm Carbon emissionsA number of on-line tools exist to estimate greenhouse gas emissions (Table 2). These estimates are based on methodology provided by the
National Greenhouse Gas Inventory. These methods were used as they are approved by the International Panel for Climate Change (IPCC) and
are currently the only recognised methods for estimation of on-farm emissions. It is important to note that estimated emissions may be very
different to measured emissions (see Box 3).
table 2. Current tools available for calculating on-farm greenhouse gas emissions.
tool Applications Source
Farm Gas Calculator Estimates annual greenhouse gas emissions at individual activity level or whole farmExamines financial impacts of different greenhouse mitigation options
Estimates greenhouse gas emissions for grain, dairy, sheep and beef producing systems based on methodology provided by the National Greenhouse Gas Inventory.
Greenhouse in Agriculture (University of Melbourne/DPI Victoria)www.greenhouse.unimelb.edu.au
Dairy Greenhouse Gas Abatement Calculator Looks at herd, soil, feeding management and farm intensification
Dairying for Tomorrow (Dairy Australia)www.dairyingfortomorrow.com
Farm Fuel Calculator Estimates the amount of CO2 and total carbon produced by farm vehicles
Department of Agriculture and Food, Western Australiawww.agric.wa.gov.au
Carbon Toolkits in Agriculture Network Information on tools, related news and resources Department of Primary Industries, Victoriawww.dpi.vic.gov.au/agriculture
Sources and sinks of agricultural greenhouse gases
Box 3. Emission estimates from cropping practices
Greenhouse gas emissions from a number of hypothetical crops
located in Merredin Western Australia (WA) were estimated using the
Grains Greenhouse Accounting framework. The Farm Fuel Calculator
was used to estimate the total amount of carbon produced by
farm vehicles (Table 3). From Table 3, the highest greenhouse gas
estimated was produced through the application of fertiliser in cereal
crops and from N2 fixation from legume crops whereas measured
results show that the majority of carbon produced in farming systems
comes from fuel (in wheat production).
Please note that the numbers in Table 3 are estimates, and not actual
values. Research has found using international emission factors
to estimate nitrous oxide emissions from the WA grain belt is not
appropriate due to differences in nitrogen (N) fertiliser management,
soil types and climate, and factors demonstrated to influence annual
agriculture nitrous oxide emissions (Stehfest and Bouwman 2006).
Studies in WA, have found the international default value for soil
nitrous oxide emissions over estimated measured greenhouse gas
by 52 per cent in wheat (Barton et al., 2008a) and were 50 times
greater than actual nitrous oxide emissions associated with growing
and converting canola for biodiesel production and the burning of
biodiesel (Farm Weekly 2011). A University of Western Australia (UWA)
five year study looking at paddock based greenhouse emissions in
WA wheat growth has changed the Australian nitrous oxide emissions
standards used from one per cent of N fertiliser (IPCC values) to
0.1 per cent (Department of Climate Change and Energy Efficiency
values) for Australian grain growers (Farm Weekly 2011). The values
reported in Table 3 are from the Grains Greenhouse Accounting
framework which is using IPCC values.
Soil nitrous oxide emissions are relatively low in the winter growing
season, but increase markedly following summer rain. Different crop
rotations can have a significant impact on nitrous oxide emissions
following rainfall in summer and the effect is also likely to be
influenced by factors such as soil type and rainfall amount and timing.
Two National Adaptation and Mitigation Initiative (NAMI) projects1
measured nitrous oxide emissions from trial sites located at the UWA
Ridgefield Farm at Pingelly and the Department of Agriculture and
Food Western Australia (DAFWA) Dry Land Institute at Merredin.
Nitrous oxide emissions were relatively low and were of a similar
order to those reported for Western Australia by Barton et al. (2008b).
Nitrous oxide emissions at Merredin were mostly below detection
levels. At Pingelly nitrous oxide emissions in the subsequent wheat
crop did not increase after fallow compared with continuous winter
cropping. Rather, these emissions appeared to be impacted by the
current (2011) crop management (seeding and fertilisation) and rainfall.
(Flower et al., 2012)
Assumptions – Merredin is a ‘non-leaching’ area according to the
Grains Greenhouse Accounting Framework, and so no nitrous oxide
emissions have been estimated for leaching or run-off. All crops
(apart from lucerne) had 10 per cent stubble burnt (Llewellyn and
D’Emden, 2009). Potential yields for 2011 were calculated using the
Potential Yield Calculator2. Nitrogen rates were calculated using 45
units of nitrogen per tonne for cereals, 60 units per tonne for canola
(B. Bowden pers comm.). Fallow was field peas which were either
green manure (gm) (ploughed into ground) or brown manure (bm)
(chemically killed – four spray passes (as four has been shown to
be the number of sprays required to effectively kill weeds and keep
a bare fallow). * measured amounts from Barton et al., 2008a from
wheat produced on 0.43 hectares and delivered to port.
1 More information about NAMI can be found at web address http://www.agric.wa.gov.au/search for climate change
2 Potential Yield Calculator is developed by DAFWA www.agric.wa.gov.au/search decision support tools
Agricultural Greenhouse Gas Emissions 7
8 Agricultural Greenhouse Gas Emissions
Sources and sinks of agricultural greenhouse gases (continued)
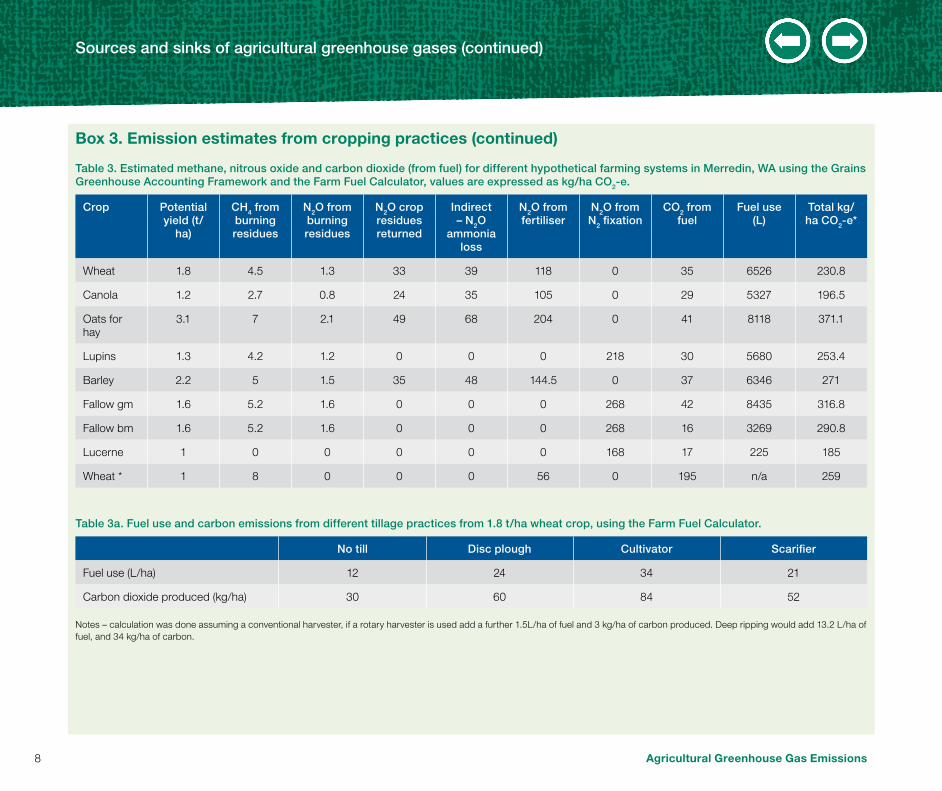
table 3. estimated methane, nitrous oxide and carbon dioxide (from fuel) for different hypothetical farming systems in merredin, WA using the Grains Greenhouse Accounting Framework and the Farm Fuel Calculator, values are expressed as kg/ha CO2-e.
Crop Potential yield (t/
ha)
CH4 from burning residues
n2O from burning residues
n2O crop residues returned
indirect – n2O
ammonia loss
n2O from fertiliser
n2O from n2 fixation
CO2 from fuel
Fuel use (l)
total kg/ha CO2-e*
Wheat 1.8 4.5 1.3 33 39 118 0 35 6526 230.8
Canola 1.2 2.7 0.8 24 35 105 0 29 5327 196.5
Oats for hay
3.1 7 2.1 49 68 204 0 41 8118 371.1
Lupins 1.3 4.2 1.2 0 0 0 218 30 5680 253.4
Barley 2.2 5 1.5 35 48 144.5 0 37 6346 271
Fallow gm 1.6 5.2 1.6 0 0 0 268 42 8435 316.8
Fallow bm 1.6 5.2 1.6 0 0 0 268 16 3269 290.8
Lucerne 1 0 0 0 0 0 168 17 225 185
Wheat * 1 8 0 0 0 56 0 195 n/a 259
table 3a. Fuel use and carbon emissions from different tillage practices from 1.8 t/ha wheat crop, using the Farm Fuel Calculator.
no till Disc plough Cultivator Scarifier
Fuel use (L/ha) 12 24 34 21
Carbon dioxide produced (kg/ha) 30 60 84 52
Notes – calculation was done assuming a conventional harvester, if a rotary harvester is used add a further 1.5L/ha of fuel and 3 kg/ha of carbon produced. Deep ripping would add 13.2 L/ha of fuel, and 34 kg/ha of carbon.
Box 3. Emission estimates from cropping practices (continued)
Options for on-farm mitigation
There are many options to reduce agricultural greenhouse gas emissions in a changing climate. Strategies include reducing emissions, increasing carbon sequestration and developing technologies to avoid fossil emissions. Each strategy varies in its current scientific and technological advancement, ability to mitigate greenhouse gases, ease of implementation, economic viability and effectiveness over time (ABARES 2011).
Reducing methane – livestock emissionsA reduction of 20 to 40 per cent of methane produced is achievable with current technology, many of which will continue to improve production efficiency while also reducing methane losses (Eckard et al 2010). This includes:
• Animal numbers – methane emissions from a farm depend on the number of animals and the emissions per head. By improving health, genetic and nutritional management production will improve the productivity and fertility of the herd and increase weaning rate with flow-on effects to lower total methane emissions from the herd (Eckard et al 2010).
• Animal breeding – a genetic improvement program can achieve shorter finishing times by selecting bulls or rams for efficient feed conversion. Estimates suggests that over 25 years, it may be possible to reduce annual greenhouse gas emissions by approximately three per cent when herds are bred for increased feed efficiencies (Alford et al 2006).
• Diet and nutrition management – ensure pasture is of good quality and include perennial pastures (Jones 2009), this will cause cows to eat more, produce more, but produce less methane per unit of output. Therefore providing animals with the best combination of pasture quality and concentrate feeding will effectively reduce methane emissions from the herd. Methane emissions are also commonly lower with higher proportions of forage legumes in the diet, partly due to lower fibre content, faster rate of passage and, in some cases, the presence of condensed tannins (Eckard et al 2010).
• Dietary supplements – in intensive livestock production systems,
dietary supplements have the potential to profitably reduce methane
emissions, with many strategies already available for implementation
on-farm. For every one per cent increase in total oil in the diet,
average methane emissions can be reduced by 3.5 per cent.
Reductions of 10 to 25 per cent may be achievable through the
addition of dietary oils to the diets of ruminants. Examples of these
higher oil supplements include whole cotton seed, cold-pressed
canola, hominy meal, grape marc and micro-algae. Some secondary
plant compounds, such as tannins, have been shown to reduce
methane production by 10 to 30 per cent (Eckard et al 2010).
• Rumen manipulation – manipulating microbial populations in the
rumen, through chemical means, by introducing competitive or
predatory microbes, or through vaccination approaches, can
reduce methane production (Eckard et al 2010).
• New forage plants – several alternative plant forages such as
broccoli leaves and some Australian natives (tar bush, the golden
wreath wattle and a number of salt bush species) have been shown
to reduce methane emissions in laboratory experiments (DAFF
2011a). A recent study at the UWA shows that tar bush can reduce
sheep methane emissions by one-third. Further research is planned
to confirm these results under field conditions (UWA 2011).
One way to offset greenhouse gas emissions produced on farm is
to increase total amount of carbon produced and stored in the soil.
Any practice that increases the photosynthetic input of carbon and/or
slows the return of stored carbon to carbon dioxide via respiration, fire
or erosion will increase carbon reserves thereby ‘sequesting’ carbon
or building carbon ‘sinks’ (Smith et al 2007). Soils have the ability to
sequester carbon dioxide which means less carbon is released to
the atmosphere. Carbon sequestration will help reduce greenhouse
gas emissions from Australian agriculture, increase farm productivity
and potentially create offsets under the Carbon Farming Initiative,
providing new economic opportunities for landholders (DAFF 2011c).
It is important to note that long term sequestration in soil carbon
stores and forests is limited by their maximum potential to store
carbon (saturation) and uncertainties about measurements and losses
(ABARES 2011). However, if we could capture just 15 per cent of the
biophysical capacity of the Australian landscape to store carbon, it
would offset the equivalent of 25 per cent of Australia’s current annual
greenhouse emissions for the next 40 years (Wentworth Group of
Concerned Scientists, 2009). A primary challenge for farmers is to
sustain a profitable farming system for the long term, which requires
continued addition and maintenance of organic inputs (Hoyle, 2011).
The following table gives a summary of the major management
options for sequestering carbon in agricultural soils.
Agricultural Greenhouse Gas Emissions 13
14 Agricultural Greenhouse Gas Emissions
Carbon sequestration continued
table 4. Summary of major management options for sequestering carbon (C) in agricultural soils (from Sanderman et al 2010, or otherwise stated).
managementSoil Organic C
benefit a Conf. b Justification
1. Shifts within an existing cropping/mixed systems
a. Maximizing efficiencies1. Water use2. Nutrient use
0/+ L Yield and efficiency increases do not necessarily translate to increased C return to soil
b. Increased productivity1. Irrigation2. Fertilisation
0/+ L Potential trade-off between increased C return to soil and increased decomposition rates
c. Stubble management1. Eliminate burning/grazing
+ M Greater C return to the soil should increase SOC stocks. Also promotes water conservation (Hoyle et al 2011).
d. Tillage1. Reduced tillage2. Direct drilling
0/+0/+
MM
1. Reduced till has shown little SOC benefit. In theory reduced or zero tillage options will promote soil aggregation and provide greater physical protection of SOC (tillage is likely to result in continuing decline of SOC) (Hoyle et al 2011).
2. Direct drill reduces erosion and destruction of soil structure thus slowing decomposition rates, however surface residues decompose with only minor contribution to SOC pool
e. Rotation1. Eliminate fallow with cover crop2. Inc. proportion of pasture to crops3. Pasture cropping
++/++++
MHM
1. Losses continue during fallow without any C inputs – cover crops mitigate this. Reduced fallow periods also increase root biomass and decrease erosion (Hoyle et al 2011)
2. Pastures generally return more C to soil than crops. 3. Pasture cropping increases C return with the benefits of
perennial grasses
f. Organic matter and offsite additionsBiochar
++/++++
HM
Direct input of C, often in a more stable form, into the soil. Farmers may be able to regulate agricultural management to maximise organic inputs and retain them, but in some cases only an external source of organic matter to the soil will improve SOC (Hoyle et al 2011). Organic matter contributes to stabilising soil aggregates and pore structure as well as increasing C inputs (Hoyle et al 2011).As not all biochars have the same properties, how it stores carbon is variable, research is on-going (CSIRO 2011).
Carbon sequestration continued
managementSoil Organic C
benefit a Conf. b Justification
2. Shifts within an existing pastoral system
a. Increased productivity1. Irrigation2. Fertilisation
0/+ L Potential trade-off between increased C return to soil and increased decomposition rates
b. rotational grazing + L Increased productivity, inc. root turnover and incorporation of residues by trampling but lacking field evidence
c. Shift to perennial species ++ M Introducing grass species with greater productivity or carbon allocation to deeper roots has been shown to increase soil carbon (Smith et al 2007). Early trials have shown that perennial grasses, including kikuyu grasses can increase soil carbon levels (DAFF 2011c).
3. Shift to different system
a. Conventional to organic farming system
0/+/++ L Likely highly variable depending on the specifics of the organic system (i.e. manuring, cover crops)
b. Cropping to pasture system +/++ M Generally greater C return to soil in pasture systems; will likely depend greatly upon the specifics of the switch
c. Retirement of land and restoration of degraded land
+++++
H Annual production, minus natural loss, is now returned to soil; active management to replant native species often results in large C gains
Notes: a Qualitative assessment of the SOC sequestration potential of a given management practice (0=nil, + = low, ++ = moderate, +++ = high). b Qualitative assessment of the confidence in this estimate of sequestration potential based on both theoretical and evidentiary lines (L = low, M = medium, H= high).
Agricultural Greenhouse Gas Emissions 15
16 Agricultural Greenhouse Gas Emissions
reducing carbon dioxide emissions
Studies have shown carbon dioxide can account for a considerable
proportion of on-farm greenhouse gas emissions (Barton et al
2008a). Therefore it is important to look at reducing greenhouse gas
emissions from fossil fuels.
• Switch to alternative fuels such as LPG, natural gas, or Biofuels
such as biodiesel from canola. Current research from DAFWA
supports the viability of canola for biodiesel production in WA
which also minimises greenhouse gas emissions (Farm Weekly
2011). Biofuels still release carbon dioxide upon combustion, but
the carbon is of recent atmospheric origin (via photosynthesis),
rather than from fossil carbon (Smith et al 2007).
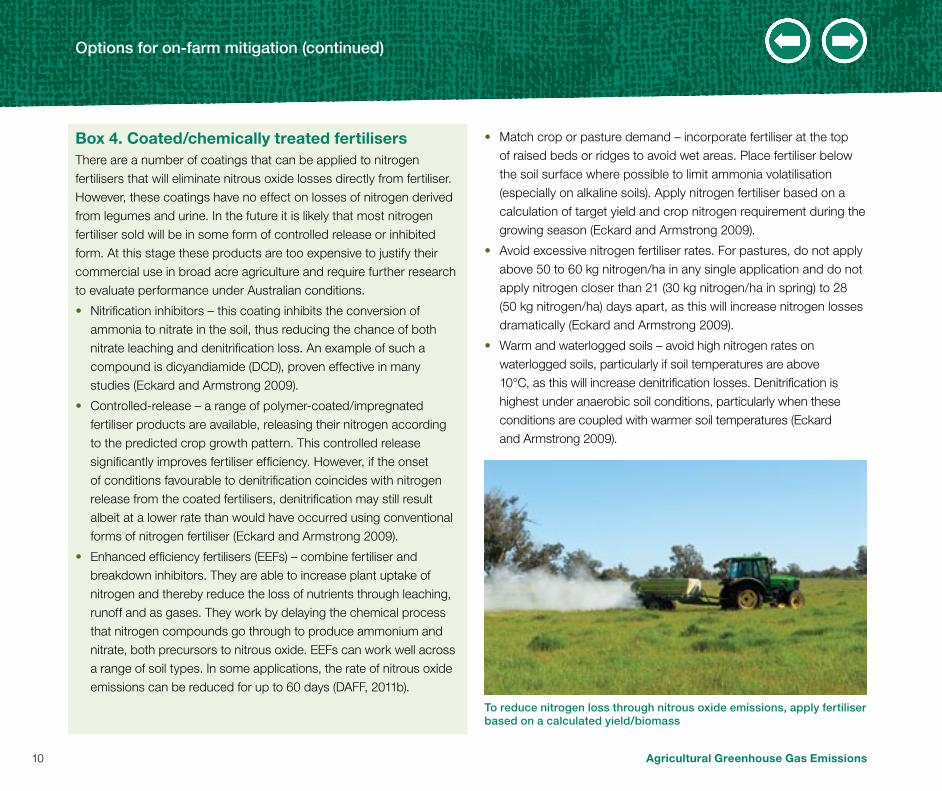
• Improve the efficiency of fertiliser and chemical applications to help
save on fuel consumption.
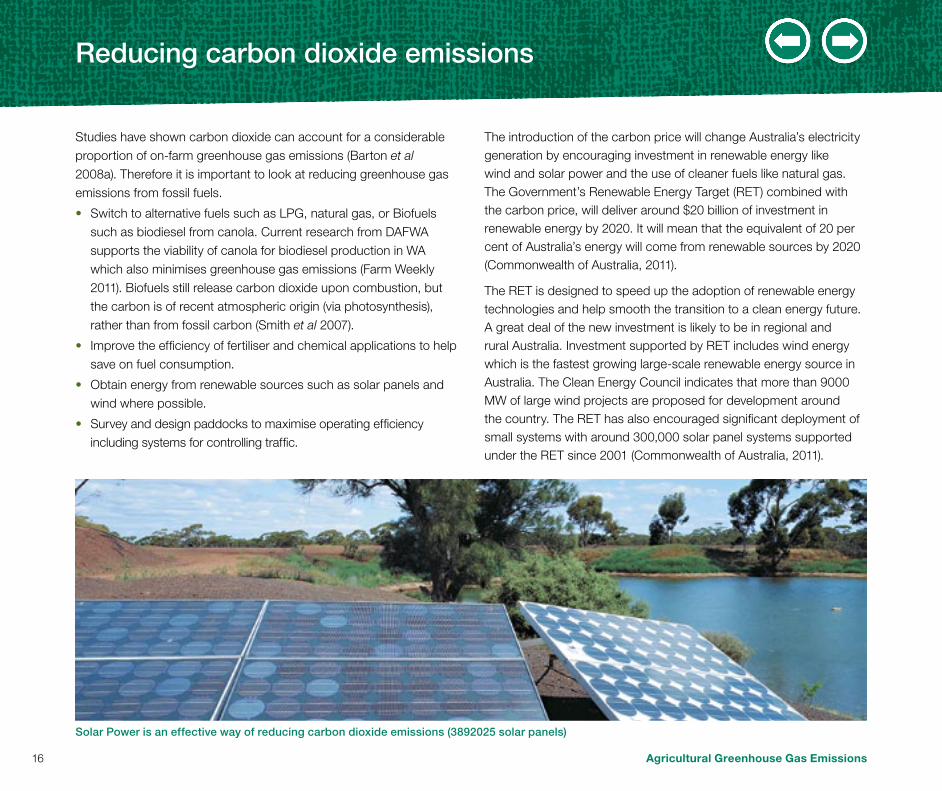
• Obtain energy from renewable sources such as solar panels and
wind where possible.
• Survey and design paddocks to maximise operating efficiency
including systems for controlling traffic.
The introduction of the carbon price will change Australia’s electricity generation by encouraging investment in renewable energy like wind and solar power and the use of cleaner fuels like natural gas. The Government’s Renewable Energy Target (RET) combined with the carbon price, will deliver around $20 billion of investment in renewable energy by 2020. It will mean that the equivalent of 20 per cent of Australia’s energy will come from renewable sources by 2020 (Commonwealth of Australia, 2011).
The RET is designed to speed up the adoption of renewable energy technologies and help smooth the transition to a clean energy future. A great deal of the new investment is likely to be in regional and rural Australia. Investment supported by RET includes wind energy which is the fastest growing large-scale renewable energy source in Australia. The Clean Energy Council indicates that more than 9000 MW of large wind projects are proposed for development around the country. The RET has also encouraged significant deployment of small systems with around 300,000 solar panel systems supported under the RET since 2001 (Commonwealth of Australia, 2011).
Solar Power is an effective way of reducing carbon dioxide emissions (3892025 solar panels)
reducing carbon dioxide emissions continued
Box 5. Carbon Farming InitiativeFarmers and land managers will receive significant support to pursue
climate change action on the land and enhance biodiversity through
a suite of measures including Carbon Farming Initiative, Carbon
Farming Futures program and a new Biodiversity Fund. Emissions
from agriculture will not be subject to a carbon price (Commonwealth
of Australia, 2011).
The Carbon farming initiative is a carbon offset scheme that will
provide new economic opportunities for farmers and help the
environment by reducing carbon pollution. Farmers and land
managers will be able to generate credits that can then be sold to
other businesses wanting to offset their own carbon pollution. Actions
to reduce pollution or increase carbon storage can also increase
the land sector’s resilience to climate change, protect Australia’s
natural environment and improve long term farm productivity
(Commonwealth of Australia, 2011).
Land sector activities under the Carbon Farming Initiative – land
managers will be allowed to earn credits (generate income) from
the following:
• Reforestation and revegetation
• Reduced methane emissions from livestock digestion
• Reduced fertiliser pollution
• Manure management
• Reduced pollution or increased carbon storage in agriculture soils
(soil carbon)
• Savannah fire management
• Native forest protection
• Forest management
• Reduced pollution from burning stubble and crop residue
• Reduced pollution from rice cultivation
Agricultural Greenhouse Gas Emissions 17
18 Agricultural Greenhouse Gas Emissions
Challenges for mitigation Conclusion
Mitigating on farm greenhouse gas emissions has some big
challenges. To be effective, any mitigation strategy must be
scientifically sound, measurable, relatively easy to implement and
economically viable, and must retain effectiveness over the long
term (ABARES 2011). It is important to remember that there is no
quick fix when it comes to mitigation, with animal breeding estimates
suggesting that it might be 25 years until a reduction in greenhouse
gas emissions are seen (Alford et al 2006).
Farming carbon for profit is viable in WA. A 2006 study found that at
the then expected carbon price of $15/t CO2-e (it is now $23 a tonne),
growing trees for carbon is not a viable alternative for landholders in
low rainfall regions (330 mm/year) due to low sequestration rates. In
medium rainfall region (550 mm/year), growing trees for carbon and
timber is a viable alternative (Flugge and Abadi 2006). A more recent
study has found that it is better to increase soil organic carbon as
a means of improving the farming system rather than to achieve an
economic benefit from storing carbon (Hoyle and Bennett 2009).
Some mitigation practices may be technically and economically viable
with extra incentives. For example, no-till practices (which are already
incorporated in the majority of WA farming systems) that reduce
production cost and increase productivity through improving soils
may become cost effective (ABARES 2011). Targeted soil nutrient
application and improved animal feed efficiency may also be attractive
as they have the potential to reduce input costs (Smith et al 2007).
Greenhouse gas emissions from the agricultural sector can be
reduced by implementing alternative management practices,
increasing carbon sequestration and reducing fossil fuel emissions.
The results from the various NAMI trials should also encourage
mitigation in WA. The ABARES report (2011), research by Barton
et al (2008a) and a joint project by DAFWA, UWA and Curtin
University (Farm Weekly 2011), highlights the importance of life cycle
assessment. Life cycle assessment is critical in assessing the whole
farm impact and in ensuring the strategy does not increase emissions
elsewhere in the production chain. For example, improving pasture
quality (digestibility) may reduce methane emissions, but is likely to
increase dry matter intake (Eckard et al 2010).
For farmers, an on farm life cycle assessment will help to identify
optimal greenhouse gas mitigation strategies for each property and,
when combined with economic analyses, will indicate the lowest
cost path to greenhouse gas abatement. However, comprehensive
life cycle analyses are not always possible, given the complexity of
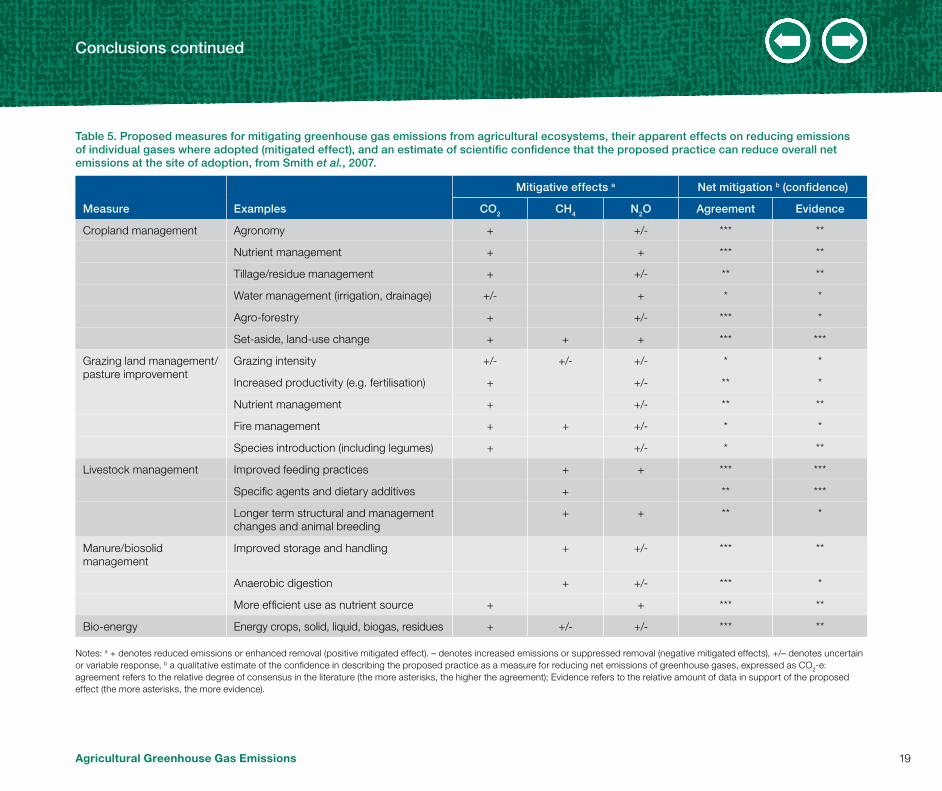
many farming systems. Table 5 has been provided to summarise the
impacts of some mitigation options. The table also includes estimates
of the confidence based on expert opinion that the practice can
reduce overall net emissions at the site of adoption. Some of these
practices also have indirect effects on ecosystems elsewhere. For
example, increased productivity in existing croplands could avoid
deforestation and its attendant emissions (Smith et al 2007). The
potential to mitigate on farm greenhouse gas emissions is greatest
where science is sure and easy to implement at low cost. Policy
certainty and financial incentives, such as a carbon offset market,
may also encourage mitigation activities by Australia’s primary
producers (ABARES 2011).
Conclusions continued
table 5. Proposed measures for mitigating greenhouse gas emissions from agricultural ecosystems, their apparent effects on reducing emissions of individual gases where adopted (mitigated effect), and an estimate of scientific confidence that the proposed practice can reduce overall net emissions at the site of adoption, from Smith et al., 2007.
mitigative effects a net mitigation b (confidence)
Notes: a + denotes reduced emissions or enhanced removal (positive mitigated effect). – denotes increased emissions or suppressed removal (negative mitigated effects), +/– denotes uncertain or variable response, b a qualitative estimate of the confidence in describing the proposed practice as a measure for reducing net emissions of greenhouse gases, expressed as CO2-e: agreement refers to the relative degree of consensus in the literature (the more asterisks, the higher the agreement); Evidence refers to the relative amount of data in support of the proposed effect (the more asterisks, the more evidence).
Agricultural Greenhouse Gas Emissions 19
20 Agricultural Greenhouse Gas Emissions
references
ABARES (Australian Bureau of Agricultural and Resource Economics and Sciences) 2011 ‘Options for on-farm mitigation of greenhouse gases in Australia’. Science and Economic Insights Issue 3, viewed 20 September 2011, http://www.daff.gov.au/abare-brs/publications
Alford, AR, Hegarty, RS, Parnell, PF, Cacho, OJ, Herd, RM & Griffith, GR 2006 ‘The impact of breeding to reduce residual feed intake on enteric methane emissions from the Australian beef industry.’ Australian Journal of Experimental Agriculture 46:813-820.
Australian National Greenhouse Accounts 2011 ‘National Inventory Report 2009: Accounting for the Kyoto Target December quarter 2010’ Published by the Department of Climate Change and Energy Efficiency. April 2011, viewed 20 September 2011 http://www.climatechange.gov.au/publications/greenhouse-acctg/national-greenhouse-gas-inventory-2009.aspx
Barton, L, Biswas, W & Carter, D 2008a ‘Global warming potential of wheat production in Western Australia : A life cycle assessment’. Agribusiness Crop Updates, Farming Systems 2008 pp 4-7
Barton, L., Kiese, R., Gatter, D., Butterbach-Bahl, K., Buck, R., Hinz, C., Murphy, D.V., 2008b. Nitrous oxide emissions from a cropped soil in a semi-arid climate. Global Change Biology Bioenergy 14, 177-192.
Commonwealth of Australia 2011 ‘Securing a clean energy future. The Australian Government’s Climate Change Plan. Licensed from the Commonwealth of Australia under a Creative Commons Attribution 3.0 Australia Licence, viewed 18 October 2011, http://www.cleanenergyfuture.gov.au/clean-energy-future/securing-a-clean-energy-future/.
Crutzen, PJ 1981 ‘Atmospheric chemical processes of the oxides of nitrogen including nitrous oxide’. In: Delwiche, CC (ed.) Denitrification, Nitrification and Atmospheric Nitrous Oxide. John Wiley and Sons New York 17-44.
CSIRO 2011 ‘Biochar for agronomic improvement and greenhouse gas mitigation’ CSIRO Sustainable Agriculture Flagship, viewed 20 September 2011 http://www.csiro.au/resources/Biochar-agronomic-improvement.html
DAFF 2011a ‘Reducing emissions from livestock fact sheet’ Department of Agriculture, Fisheries and Forestry, viewed 19 September 2011, http://www.daff.gov.au/climatechange/australias-farming-future/climate-change-and-productivity-research/emissions_reduction2/reducing-emissions-livestock/fact-sheet
DAFF 2011b ‘Reducing nitrous oxide emissions’ Climate Change Research Program Department of Agriculture, Fisheries and Forestry, viewed 19 September 2011, http://www.daff.gov.au/climatechange/australias-farming-future/climate-change-and-productivity-research/emissions_reduction2/nitrous_oxide_research_program/fact-sheet-reducing-nitrous_oxide_emissions
DAFF 2011c ‘Reducing greenhouse gas emissions using soil carbon’ Climate Change Research Program Department of Agriculture, Fisheries and Forestry, viewed 19 September 2011, http://www.daff.gov.au/climatechange/australias-farming-future/climate-change-and-productivity-research/emissions_reduction2/reducing-emissions-livestock/fact-sheet-greenhouse
DAFWA 2011 ‘Weeds – integrated weed management – Tactic 1.1 Burning’, Department of Agriculture and Food, WA, viewed 19 September 2011, http://www.agric.wa.gov.au/PC_93465.html?s=2075361928
De Klein, CAM & Eckard RJ 2008 Targeted technologies for nitrous oxide abatement from animal agriculture. Aust. J. Exp. Agric. 48: 14-20.
de Laat, ATJ & van Weele M 2011 The 2010 Antarctic ozone hole: observed reduction in ozone destruction by minor sudden stratospheric warmings. Scientific Reports 1:38
DPI Victoria 2011 Carbon and Emissions: soils Department of Primary Industries, Victoria website’, viewed 27 September 2011 http://new.dpi.vic.gov.au/agriculture/farming-management/weather-climate/understanding-carbon-and-emissions/soils
Eckard, R & Armstrong, R 2009 ‘Grains Greenhouse Accounting Framework’ viewed 19 September 2011, www.greenhouse.unimelb.edu.au/site/Tools.htm
Eckard, RJ, Grainger, C, & de Klein, CAM 2010 ‘Options for the abatement of methane and nitrous oxide from ruminant production: A review’. Livestock Science 130: 47–56
Farm Weekly 2011 ‘Biodiesel canola treads lightly on canola’. 18 August 2011, 22
Flower, K.C., Manalil, S., Riethmuller, G., Peek, C. and Pasqual, G. (2012). Previous fallow has no effect on soil nitrous oxide emissions in wheat but weedy fallow reduces yield. Paper published in GRDC Agribusiness Crop Updates. 28th February 2012, Pan Pacific Hotel, Perth Western Australia.
Flugge, F, & Abadi, A, 2006 ‘Farming carbon: an economic analysis of agroforestry for carbon sequestration and dryland salinity reduction in Western Australia’. Agroforest Syst 68:181–192
Hoyle, FC, Baldock, JC, & Murphy, DV, 2011 ‘Chapter 14 Soil Organic Carbon – Role in Rainfed Farming Systems. With Particular Reference to Australian Conditions. In: Tow, P, Cooper, I, Partridge, I, & Birch, C (eds). Rainfed Farming Systems Springer Science + Business Media 339-361
Hoyle, FC, & Bennett, A, 2009 ‘Soil organic carbon in WA agricultural soils’. Agribusiness Crop Updates, Farming Systems 2009 226 – 227
Jones, F 2009 ‘Seeking to reduce livestock greenhouse emissions’ Department of Agriculture and Food, WA Factsheet 376
Jones, F, Phillips, F & Naylor, T 2009 ‘Greenhouse emissions from breeding beef cows selected for extremes in low and high net feed efficiency under a pasture grazing system’. Climate 21: Understanding climate change and how to manage it. Department of Agriculture and Food, WA. pp 20
Llewellyn, RS & D’Emden, F 2009 ‘Adoption of no-till cropping practices in Australian grain growing regions’. Report for SA No-till Farmers Association and CAAANZ June 2009 CSIRO
Purvaja, R, Ramesh, R, Ray, A,K, & Rixen T 2008. Nitrogen cycling: A review of the processes, transformations and fluxes in coastal ecosystems. Current Science 94 (11) 1419-1438.
Sanderman, J, Farquharson, R & Baldock, J 2010 ‘Soil Carbon Sequestration Potential : A review for Australian agriculture CSIRO, viewed 27 September 2011, http://www.csiro.au/files/files/pwiv.pdf
Smith, P, Martino, D, Cai, Z, Gwary, D, Janzen, H, Kumar, P, McCarl, B, Ogle, S, O’Mara, F, Rice, C, Scholes, B & Sirotenko, O 2007 ‘Agriculture’ in ‘Climate Change 2007: Mitigation’, Contribution of Working Group III to the Fourth Assessment Report of the Intergovernmental Panel on Climate Change in Metz, B, Davidson, OR, Bosch, PR, Dave, R & Meyer, LA (eds.), Cambridge University Press, Cambridge, United Kingdom and New York, NY , USA, viewed 27 September 2011, http://www.ipcc.ch/publications_and_data/ar4/wg3/en/ch8.html
Stehfest, E & Bouwman, L 2006 ‘N2O and NO emission from
agricultural fields and soils under natural vegetation: Summarising available measurement data and modelling of global annual emissions’ Nutrient Cycling in Agroecosystems 74, 207 – 228
UWA 2011 University of Western Australia website, viewed 19 September 2011, http://www.news.uwa.edu.au/201109143924/research/touch-tar-bush
Wentworth Group of Concerned Scientists 2009 ‘Optimising Carbon in the Australian Landscape. How to guide the terrestrial carbon marlets to deliever multiple and economic and environmental benefits, viewed 27 September 2011, http://www.wentworthgroup.org/blueprints/optimising-carbon-in-the-australian-landscape