Agricultural Land Use Inventory District of Squamish & Squamish-Lillooet Regional District Electoral Area D Summer 2017 British Columbia Ministry of Agriculture Strengthening Farming Program December 27, 2017 Photo credit: Diamond Head Outfitters. http://www.exploresquamish.com/business/diamondhead-outfitters
Transcript
Agricultural Land Use Inventory
District of Squamish & Squamish-Lillooet Regional District Electoral Area D
Summer 2017
British Columbia Ministry of Agriculture Strengthening Farming Program
December 27, 2017
Photo credit: Diamond Head Outfitters. http://www.exploresquamish.com/business/diamondhead-outfitters
District of Squamish & SLRD Electoral Area D – Agricultural Land Use Inventory - Page i
AAcckknnoowwlleeddggmmeennttss
This project was made possible by a partnership between the District of Squamish, Squamish-Lillooet Regional District, the BC Ministry of Agriculture, and the Partnership for Water Sustainability in BC.
We would like to acknowledge the Squamish Food Policy Council for their efforts in mobilizing partners to initiate the ALUI. We would also like to acknowledge the farmers and residents who stopped to talk to the survey crew about farming in the region.
Funding for this project has been provided in part by the Governments of Canada and British Columbia under Growing Forward 2, a federal-provincial territorial initiative, through programs delivered by the Investment Agriculture Foundation of BC.
Additional project funding was provided by District of Squamish and Squamish- Lillooet Regional District.
Disclaimer: The governments of Canada and British Columbia are committed to working with industry partners. Opinions expressed in this document are those of the authors and not necessarily those of the Government of Canada or the Investment Agriculture Foundation of BC.
CCiittaattiioonn
BC Ministry of Agriculture. Agricultural Land Use Inventory: District of Squamish and SLRD Electoral Area D, Summer 2017. (Reference No. 800.510-60.2017).
CCoonnttaacctt IInnffoorrmmaattiioonn
For further information on the content and development of this report please contact:
Ministry of Agriculture Innovation & Adaptation Services Branch, Strengthening Farming Program 1767 Angus Campbell Rd, Abbotsford, BC V3G 2M3 (604) 556-3001 or 1-888-221-7141 (toll free)
District of Squamish & SLRD Electoral Area D – Agricultural Land Use Inventory - Page ii
TTaabbllee ooff CCoonntteennttss Acknowledgments........................................................................................................................................ i Citation ......................................................................................................................................................... i Contact Information ..................................................................................................................................... i Table of Contents .........................................................................................................................................ii Acronyms .................................................................................................................................................... iii Executive Summary ..................................................................................................................................... 1 Agrologist Comments .................................................................................................................................. 3 1. General Information .............................................................................................................................. 4
1.1 Overview ...................................................................................................................................................4 1.2 Agricultural Land Reserve .........................................................................................................................5 1.3 Inventory Area ..........................................................................................................................................7
2. Land Cover and Farmed Area ................................................................................................................. 8 2.1 Land Cover and Farmed Area ...................................................................................................................8
4. ALR Utilization ....................................................................................................................................... 17 4.1 Parcel Inclusion in the ALR .................................................................................................................... 17 4.2 Land Use and Farm Use ......................................................................................................................... 18 4.3 Parcel Size and Farm Use ....................................................................................................................... 20
5. ALR Availability for Farming .................................................................................................................. 23 5.1 Parcel Availability Overview .................................................................................................................. 23 5.2 Available For Farming – Privately Owned ALR Parcles .......................................................................... 25 5.3 Unavailable For Farming – Privately Owned ALR Parcels ...................................................................... 27
6. Farming Outside the ALR ...................................................................................................................... 28 6.1 Farming Outside the ALR ....................................................................................................................... 28
7. Methodology ......................................................................................................................................... 29 7.1 Inventory Methodology ......................................................................................................................... 29 7.2 Description of the Data ......................................................................................................................... 30 7.3 Presentation of the Data ....................................................................................................................... 31
Appendix A – Glossary .............................................................................................................................. 32
District of Squamish & SLRD Electoral Area D – Agricultural Land Use Inventory - Page iii
AAccrroonnyymmss
AGRI BC Ministry of Agriculture ALR Agricultural Land Reserve ALUI Agricultural Land Use Inventory AUE Animal Unit Equivalent EA Electoral Area GIS Geographic Information Systems SLRD Squamish-Lillooet Regional District
District of Squamish & SLRD Electoral Area D – Agricultural Land Use Inventory - Page 1
EExxeeccuuttiivvee SSuummmmaarryy
Agricultural Land Use Inventories (ALUIs) collect detailed data about land use and land cover in agricultural areas. This data can be used to generate a wealth of information in a broad range of fields including agricultural planning. The data includes the type and extent of agricultural activities within a region which provides baseline information to help measure changes over time on agricultural lands. ALUI data can also be used to quantify the amount of land used, unavailable, and potentially available for agricultural purposes. The data serves as a key input into an Agricultural Water Demand Model that estimates current and future agricultural water needs.
The BC Ministry of Agriculture and its partners conducted an ALUI in the District of Squamish and in Squamish-Lillooet Regional District Electoral Area D in the summer of 2017. The ALUI was funded in part by District of Squamish, Squamish-Lillooet Regional District, and Growing Forward 2, a federal-provincial territorial initiative.
Area of Interest and Methodology Included in the inventory were all parcels:
• completely or partially within the ALR, or• classified by BC Assessment as having “Farm” status for tax assessment, or• containing an active water licence for farming or irrigation purposes, or• zoned by local government bylaws to permit agriculture and indicating signs of agriculture on
aerial photography
There were 4,066 ha of ALR within Squamish and Electoral Area D. Of this area: • 49% or 1,986 ha was inventoried and forms the “effective ALR”,• 32% or 1,296 ha was on Indian Reserves and was not included in the ALUI, and• 19% or 784 ha was outside of legally surveyed parcels and was not included in the ALUI.
The 1,986 ha of inventoried ALR is considered the “effective ALR” as it is within legally surveyed parcels, and may be subject to local and/or regional planning decisions. Land on Indian Reserves was not included in the ALUI at the request of the Squamish Nation.
The ALUI was conducted using visual interpretation of aerial imagery combined with a drive-by “windshield” survey to capture a snapshot in time of land use and land cover. Land cover is defined as the biophysical material at the surface of the earth while land use is how people utilize the land.
Land Cover and Farming Activities Most of the effective ALR was in a natural or semi-natural state (93%). The remainder of the effective ALR was farmed (2% or 47 ha) or was anthropogenically modified in vegetation, buildings, and roads (5% or 88 ha). An additional 21 ha of farmed land was identified outside of the ALR bringing the total farmed land cover to 68 ha.
There were 52 ha of cultivated field crops within Squamish and Electoral Area D (39 ha in the ALR and 13 ha outside the ALR). Pasture was the most common crop accounting for 87% of all cultivated land (45 ha). Also recorded were hops (3 ha), vegetables (3 ha), and small amounts of tree fruits, mixed berries, and tomatoes (1 ha combined). Eighteen ha of crops (35%) were within Squamish, while 34 ha were within Electoral Area D.
District of Squamish & SLRD Electoral Area D – Agricultural Land Use Inventory - Page 2
Irrigation information was captured by crop type and irrigation type to aid in the development of an agricultural water demand model. Irrigation is not overly common in the region with only 24% of the cultivated land being irrigated.
Livestock Livestock activities were recorded, but were difficult to measure using a windshield survey. Livestock may not be visible if they are housed in barns, or are on another land parcel. Livestock findings are reported as a range of animal unit equivalents for each parcel where animals or related structures were observed.
Equine were the most abundant livestock type accounting for 62% of the estimated animal unit equivalents (AUEs). Sheep / goats accounted for 17% of the AUEs, while beef and swine each accounted for 7%. All livestock occurrences were “small” scale with less than 25 AUEs.
ALR Utilization Parcels were categorized as “Used for farming” or “Not used for farming” based on the proportion of the parcel in cultivated crops, farm infrastructure, and/or the scale of livestock production. “Used for farming” parcels have the majority of their area in agricultural use or have a significant intensity of farming activity. Refer to the glossary for the full definition. Of all parcels in the ALR, 4% were “Used for farming” while 96% were “Not used for farming”.
ALR Availability Parcel availability for farming was assessed based on the extent of existing land uses and land covers and their compatibility with agriculture. Parcels considered “Not used for farming” were further categorized as available or unavailable for farming. “Unavailable for farming” parcels either had a land use making agricultural development improbable (e.g. golf course, school, etc.) or had little land with potential for farming. Of the privately owned ALR parcels:
• 10 parcels (6%) were used for farming• 58 parcels (34%) were available for farming• 102 parcels (60%) were unavailable for farming
A parcel is considered to be “Available for farming” if it is not already “Used for farming”, has at least 50% of its area and at least 0.4 ha in land with potential for farming, and does not have a land use that excludes agriculture. Available for farming parcels provide an initial selection of parcels that may be available for agricultural expansion. Detailed investigation is required to determine the land costs, land suitability, and trade offs associated with converting these natural areas to agriculture. Of the privately owned and available parcels:
• 33 parcels (57%) are less than 4 ha in size• 25 parcels (43%) are greater than 4 ha in size
District of Squamish & SLRD Electoral Area D – Agricultural Land Use Inventory - Page 3
AAggrroollooggiisstt CCoommmmeennttss
The District of Squamish and Squamish Lillooet Regional District Electoral Area D are located within the traditional territory of the Squamish First Nation. The first of the European settlers arrived in the area starting in the 1870’s. Agriculture was the key driver of the local economy at that time, with hops, potatoes, forage, livestock and vegetables being produced. It is interesting to note that after an absence of several decades, hops are once again being produced in the region as well as mixed vegetables, and forage to support livestock.
The Agricultural Land Reserve within the District of Squamish and Electoral Area D comprises 1.3% of the total jurisdictional land area. Approximately half of the ALR (1,986 ha) was inventoried as the ‘effective’ ALR with the remainder being on Indian Reserves, or outside of legally surveyed parcels.
Although a relatively small amount of the inventoried ALR is being farmed (47 ha), there are additional lands outside of the ALR also being farmed (21 ha). It is also significant that over 90% of the effective ALR is covered by natural and semi-natural vegetation and wetlands with minimal current anthropogenic use. These underutilized lands represent a valuable land base to expand regional agricultural production in the future but will require clearing to become agriculturally productive.
The Squamish area has a reputation for clean air and water with land prices somewhat less expensive than those in Metro Vancouver. The valley has potential to draw new agricultural entrants interested in farming within reasonable proximity to the lower mainland with its large markets. Unfortunately there is pressure on the farming land base due to people finding the area desirable for estate homes and this is likely pushing land prices higher. There may, however, be opportunity for local farms to tap into the well-established tourism industry and provide more agri-tourism experiences in the area.
There is a thriving food culture in the Squamish area, with many restaurants highlighting fresh produce, which provides opportunity for farms in the region. A farmers’ market operates between April and October that features produce from many of the local farms and some from the broader region, including the Pemberton Valley. The Squamish Climate Action Network has a strong focus on food security and building sustainable food systems, and the Brackendale Farmers’ Institute holds a fall fair every year and supports its members in agricultural pursuits.
It is likely that backyard livestock and small lot agriculture are under-represented in this inventory. While these activities do not significantly contribute to commercial agricultural production, they play a role in maintaining local food production skills and knowledge. These small scale activities can provide the nucleus for larger market gardens and other potential contributions to the local food supply, all which contribute positively to the socio-economic fabric of the community.
District of Squamish & SLRD Electoral Area D – Agricultural Land Use Inventory - Page 4
11.. GGeenneerraall IInnffoorrmmaattiioonn
1.1 OVERVIEW
Squamish-Lillooet Regional District (SLRD) is comprised of four Electoral Areas (A, B, C, D) and four member municipalities (District of Squamish, Resort Municipality of Whistler, Village of Pemberton, and District of Lillooet). The region is located within the traditional territories of both the Squamish and St’at’imc Nations and contains varied land cover that includes steep mountainous terrain, heavily forested areas, glaciers, river valleys, and floodplains1.
The District of Squamish is the centre of human activity for the surrounding Electoral Area D which includes the communities of Porteau Cove, Furry Creek, and Britannia Beach. Squamish and Electoral Area D are within the traditional territory of the Squamish Nation. Squamish and Electoral Area D have a total area including land and water of 3,046.5 square km2. Electoral Area D has a population of 1,057 and Squamish has a population of 19,953 which includes 441 people residing on Indian Reserves2. The region boasts many outdoor recreation opportunities that draw visitors into the area.
Figure 1. General location map – Squamish-Lillooet Regional District
1 Squamish-Lillooet Regional District Regional Growth Strategy. 2008. http://www.slrd.bc.ca/siteengine/activepage.asp?PageID=17 2 Statistics Canada, 2016 Census of Population. http://www12.statcan.gc.ca/census-recensement/2016/dp-pd/prof/index.cfm?Lang=E
District of Squamish & SLRD Electoral Area D – Agricultural Land Use Inventory - Page 5
1.2 AGRICULTURAL LAND RESERVE
The Agricultural Land Reserve (ALR) is a provincial land use zone that was designated in 1973 in which agriculture is recognized as the priority use. Within the ALR, farming is encouraged and non- agricultural uses are controlled.
In 2017, there were 4,066 ha of ALR within District of Squamish and Electoral Area D. Twenty-five percent of this ALR occurred in District of Squamish (797 ha) while 75% (3,269 ha) occurred in Electoral Area D. The ALR area includes:
• 1,986 ha of inventoried parcels • 784 ha outside of legally surveyed parcels • 1,296 ha of land on Indian Reserves
The 1,986 ha of ALR on inventoried parcels is considered the ‘effective ALR’ as these areas are within legally surveyed parcels and are subject to local and/or regional planning decisions. Analysis of ALR land outside of legally surveyed parcels and ALR land on Indian reserves is not included in this report.
Figure 2. General location map – Area of interest
District of Squamish & SLRD Electoral Area D – Agricultural Land Use Inventory - Page 6
Figure 3 shows the proportion of different categories of ALR land in Squamish and Electoral Area D.
In total, 49% of ALR area is considered the ‘effective ALR’, 32% is on Indian reserves, and 19% is outside of legally surveyed parcels.
The ‘effective ALR’ forms the basis of this report. ALR lands on Indian Reserves are not included in this report at the request of the Squamish Nation.
Table 1 categorizes the ALR in Squamish and Electoral Area D by jurisdiction.
ALUI data is not presented for ALR lands on Indian Reserves.
District of Squamish & SLRD Electoral Area D – Agricultural Land Use Inventory - Page 7
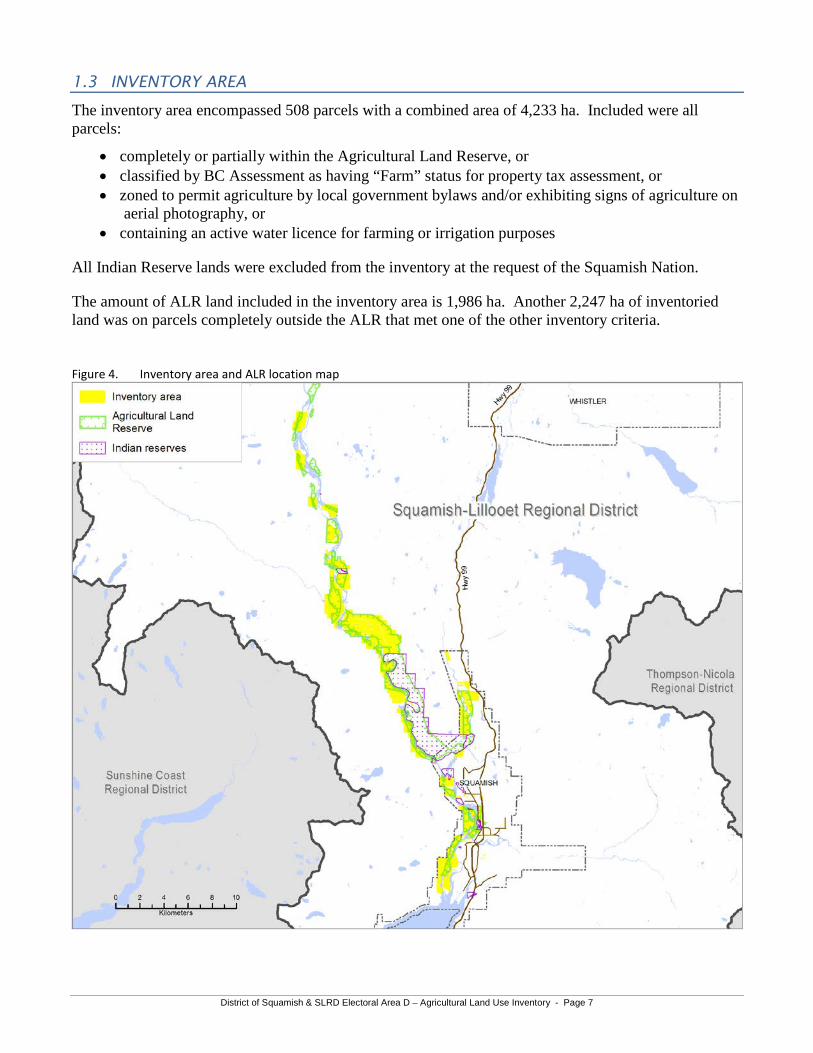
1.3 INVENTORY AREA
The inventory area encompassed 508 parcels with a combined area of 4,233 ha. Included were all parcels:
• completely or partially within the Agricultural Land Reserve, or • classified by BC Assessment as having “Farm” status for property tax assessment, or • zoned to permit agriculture by local government bylaws and/or exhibiting signs of agriculture on
aerial photography, or • containing an active water licence for farming or irrigation purposes
All Indian Reserve lands were excluded from the inventory at the request of the Squamish Nation.
The amount of ALR land included in the inventory area is 1,986 ha. Another 2,247 ha of inventoried land was on parcels completely outside the ALR that met one of the other inventory criteria. Figure 4. Inventory area and ALR location map
District of Squamish & SLRD Electoral Area D – Agricultural Land Use Inventory - Page 8
22.. LLaanndd CCoovveerr aanndd FFaarrmmeedd AArreeaa 2.1 LAND COVER AND FARMED AREA
Land cover describes the biophysical material at the surface of the earth and is distinct from land use which describes how people utilize the land. Refer to Section 4, ALR Utilization for information on land use. Land cover is surveyed by separating the parcel into polygons of homogeneous components and assigning each a description such as landscape lawn, natural open treed, natural waterbody, blueberries, road, or small single family house. Most surveyed parcels have multiple land cover types with each describing a different area of the parcel. Land cover more closely approximates the actual area of land in agricultural production than land use, which is assigned on a parcel basis. Four land cover types are considered “Farmed”:
• Cultivated field crops: vegetation under cultivation for harvest or pasture including land temporarily set aside from farming and perennial crops that were not harvested or grazed in the current growing season
• Farm infrastructure: built structures associated with farming such as barns, stables, corrals, riding rings, and their associated yards
• Greenhouses: permanent enclosed glass or poly structures with or without climate control facilities for growing plants and vegetation under controlled environments
• Crop barns: permanent enclosed structures with non-translucent walls for growing crops such as mushrooms or bean sprouts
Forage and pasture field crops which have not been cut or grazed during the current growing season (unused), unmaintained field crops, and unmaintained greenhouses are considered “Farmed” land covers but are considered inactive. Land cover types which may support farming, such as farm residences, vegetative buffers and farm road access, are not considered “Farmed” land cover. Figure 5. Land cover in the effective ALR
Farmed, 2%
Anthropogenic, 5%
Natura l & Semi-natural, 93%
Figure 5 shows the proportion of different land cover types across the effective ALR in Squamish and Electoral Area D.
The majority of the ALR area (93%) is in “natural & semi-natural” land cover. Two percent (2%) of the effective ALR is in “Farmed” land cover that includes cultivated crops and farm infrastructure.
Land used in support of farming such as farm residences, vegetative buffers or roadways is not included as “Farmed” land cover.
District of Squamish & SLRD Electoral Area D – Agricultural Land Use Inventory - Page 9
Table 2 shows the extent of different land cover types across the effective ALR in Squamish and Electoral Area D.
There were 47 ha of “Farmed” land cover within the ALR. This included 6 ha of unmaintained field crops. An additional 21 ha of “Farmed” land cover was identified outside of the ALR.
Table 3 shows the extent of different land cover categories across the ALR by jurisdiction.
Of the 499 ha of effective ALR in District of Squamish, 9 ha or 1.8% is in “Farmed” land cover.
Of the 1,487 ha of effective ALR in Electoral Area D, 38 ha or 2.6% is in “Farmed” land cover.
District of Squamish & SLRD Electoral Area D – Agricultural Land Use Inventory - Page 10
33.. FFaarrmmiinngg AAccttiivviittiieess
3.1 CULTIVATED FIELD CROPS
Cultivated field crops were captured in a geographic information system (GIS) at the field or land cover level by crop type (e.g. vegetables, forage or pasture, berries). The total land area was then evaluated for each crop.
Included with cultivated field crops is fallow farmland and land temporarily set aside for wildlife or other purposes. Also included is bare cultivated land or land under preparation for planting as it is assumed these lands will be planted during the survey season. Excluded are crops grown in crop cover structures such as greenhouses or mushroom barns.
Pasture is the main field crop type in Squamish and Electoral Area D.
• Forage is a cultivated crop that is cut and made into silage or hay for livestock feed.• Pasture is a cultivated crop that is used for grazing only and is not cut.
Other significant crop types include:
• Hops• Vegetables
Figure 6. Main field crop types by percentage
Pasture, 77%
Unused forage/pasture,
10%
Hops , 6%
Vegetables, 6%
Tree frui ts, mixed berries, cultivated
land, 1%
Figure 6 shows the proportion of crop types in Squamish and Electoral Area D.
Actively used pasture fields account for 77% of all cultivated crops. Hops and vegetables each account for 6% of the total cultivated crop area.
District of Squamish & SLRD Electoral Area D – Agricultural Land Use Inventory - Page 11
^ Bare cultivated land where the crop type could not be determined.
% of cultivated
landCultivated field crop
Total area (ha)
Outside ALR (ha)
In ALR (ha)
* Unused forage/pasture has been cultivated, but not cut or grazed this year.
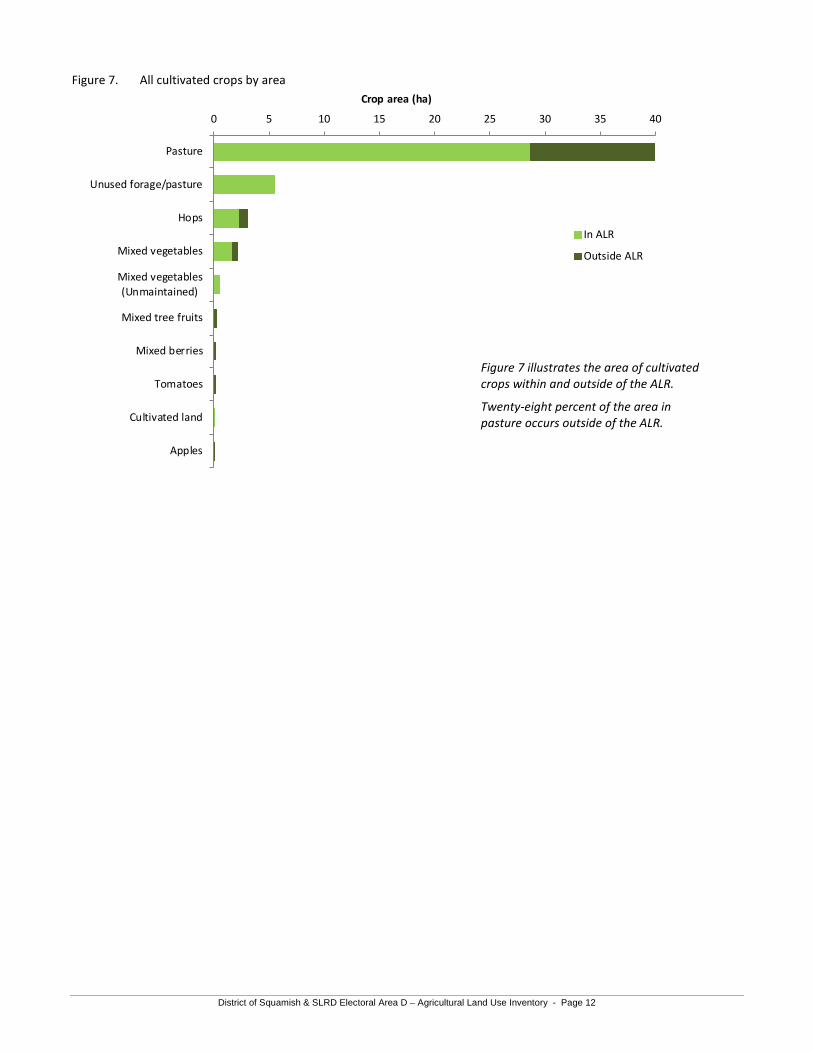
Table 5 details the 10 individual crop types by the area inside and outside of the ALR.
Table 4 details the 10 individual crop types that account for all of the cultivated land in Squamish and Electoral Area D.
Of the 18 ha of crops within Squamish, 11 ha (63%) occur outside of the ALR. Of the 34 ha of crops within Electoral Area D, only 2 ha (4%) occur outside of the ALR. Refer to Table 11 for details on crops outside of the ALR.
District of Squamish & SLRD Electoral Area D – Agricultural Land Use Inventory - Page 12
Figure 7. All cultivated crops by area
0 5 10 15 20 25 30 35 40
Pasture
Unused forage/pasture
Hops
Mixed vegetables
Mixed vegetables(Unmaintained)
Mixed tree fruits
Mixed berries
Tomatoes
Cultivated land
Apples
Crop area (ha)
In ALR
Outside ALR
Figure 7 illustrates the area of cultivated crops within and outside of the ALR.
Twenty-eight percent of the area in pasture occurs outside of the ALR.
District of Squamish & SLRD Electoral Area D – Agricultural Land Use Inventory - Page 13
3.2 IRRIGATION
Irrigation is the application of water to soil or plants and may be used to assist in the growing of agricultural crops, the maintenance of managed vegetation, and the control of soil erosion or dust. The availability of water delivery infrastructure and good quality water for irrigation are often requirements for growing high-value crops. Insufficient water sources or water delivery infrastructure can limit the potential to increase agricultural production through irrigation.
Irrigation information was recorded at the field or land cover level by system type (e.g. sprinkler, giant gun, trickle) and then summarized by crop type to the total land area under irrigation. Irrigated land includes all irrigated field crops and may also include irrigated fallow farmland, land temporarily set aside for wildlife or other purposes, and land under preparation for planting.
Crop and irrigation data from the Agricultural Land Use Inventory are key inputs into an Agricultural Water Demand Model (AWDM). The AWDM is a water management planning tool that estimates current and future agricultural water needs based climate change scenarios and water management practices.
Table 6 shows the total area of crops under irrigation. Pasture is the predominant crop type (refer to Table 4), however, few pastures in the region are irrigated. Only 15% of the pasture area is irrigated while all hops and all maintained vegetable use irrigation.
In total, 13 ha or 24% of the cultivated crop area was irrigated.
District of Squamish & SLRD Electoral Area D – Agricultural Land Use Inventory - Page 14
3.3 LIVESTOCK
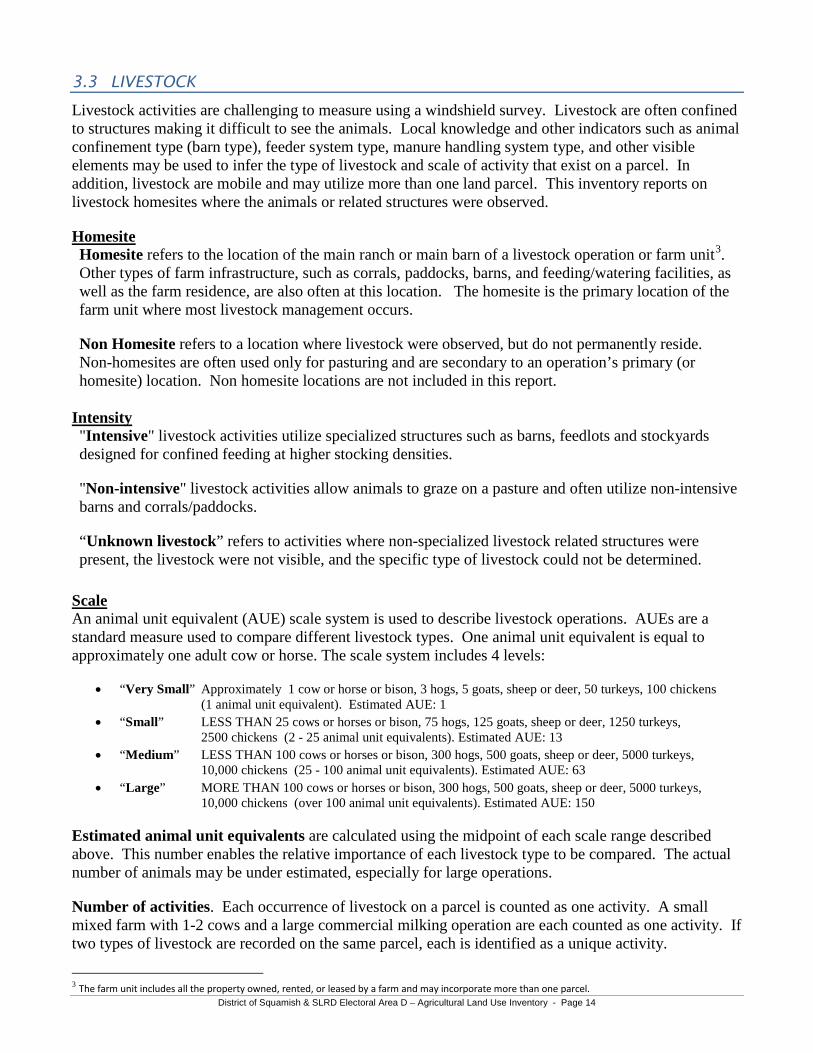
Livestock activities are challenging to measure using a windshield survey. Livestock are often confined to structures making it difficult to see the animals. Local knowledge and other indicators such as animal confinement type (barn type), feeder system type, manure handling system type, and other visible elements may be used to infer the type of livestock and scale of activity that exist on a parcel. In addition, livestock are mobile and may utilize more than one land parcel. This inventory reports on livestock homesites where the animals or related structures were observed.
Homesite Homesite refers to the location of the main ranch or main barn of a livestock operation or farm unit3. Other types of farm infrastructure, such as corrals, paddocks, barns, and feeding/watering facilities, as well as the farm residence, are also often at this location. The homesite is the primary location of the farm unit where most livestock management occurs.
Non Homesite refers to a location where livestock were observed, but do not permanently reside. Non-homesites are often used only for pasturing and are secondary to an operation’s primary (or homesite) location. Non homesite locations are not included in this report.
Intensity "Intensive" livestock activities utilize specialized structures such as barns, feedlots and stockyards designed for confined feeding at higher stocking densities.
"Non-intensive" livestock activities allow animals to graze on a pasture and often utilize non-intensive barns and corrals/paddocks.
“Unknown livestock” refers to activities where non-specialized livestock related structures were present, the livestock were not visible, and the specific type of livestock could not be determined.
Scale An animal unit equivalent (AUE) scale system is used to describe livestock operations. AUEs are a standard measure used to compare different livestock types. One animal unit equivalent is equal to approximately one adult cow or horse. The scale system includes 4 levels:
• “Very Small” Approximately 1 cow or horse or bison, 3 hogs, 5 goats, sheep or deer, 50 turkeys, 100 chickens(1 animal unit equivalent). Estimated AUE: 1
• “Small” LESS THAN 25 cows or horses or bison, 75 hogs, 125 goats, sheep or deer, 1250 turkeys, 2500 chickens (2 - 25 animal unit equivalents). Estimated AUE: 13
• “Medium” LESS THAN 100 cows or horses or bison, 300 hogs, 500 goats, sheep or deer, 5000 turkeys,10,000 chickens (25 - 100 animal unit equivalents). Estimated AUE: 63
• “Large” MORE THAN 100 cows or horses or bison, 300 hogs, 500 goats, sheep or deer, 5000 turkeys, 10,000 chickens (over 100 animal unit equivalents). Estimated AUE: 150
Estimated animal unit equivalents are calculated using the midpoint of each scale range described above. This number enables the relative importance of each livestock type to be compared. The actual number of animals may be under estimated, especially for large operations.
Number of activities. Each occurrence of livestock on a parcel is counted as one activity. A small mixed farm with 1-2 cows and a large commercial milking operation are each counted as one activity. If two types of livestock are recorded on the same parcel, each is identified as a unique activity.
3 The farm unit includes all the property owned, rented, or leased by a farm and may incorporate more than one parcel.
District of Squamish & SLRD Electoral Area D – Agricultural Land Use Inventory - Page 15
Number of livestock activities by livestock type & scale
Small scale
Very small scale
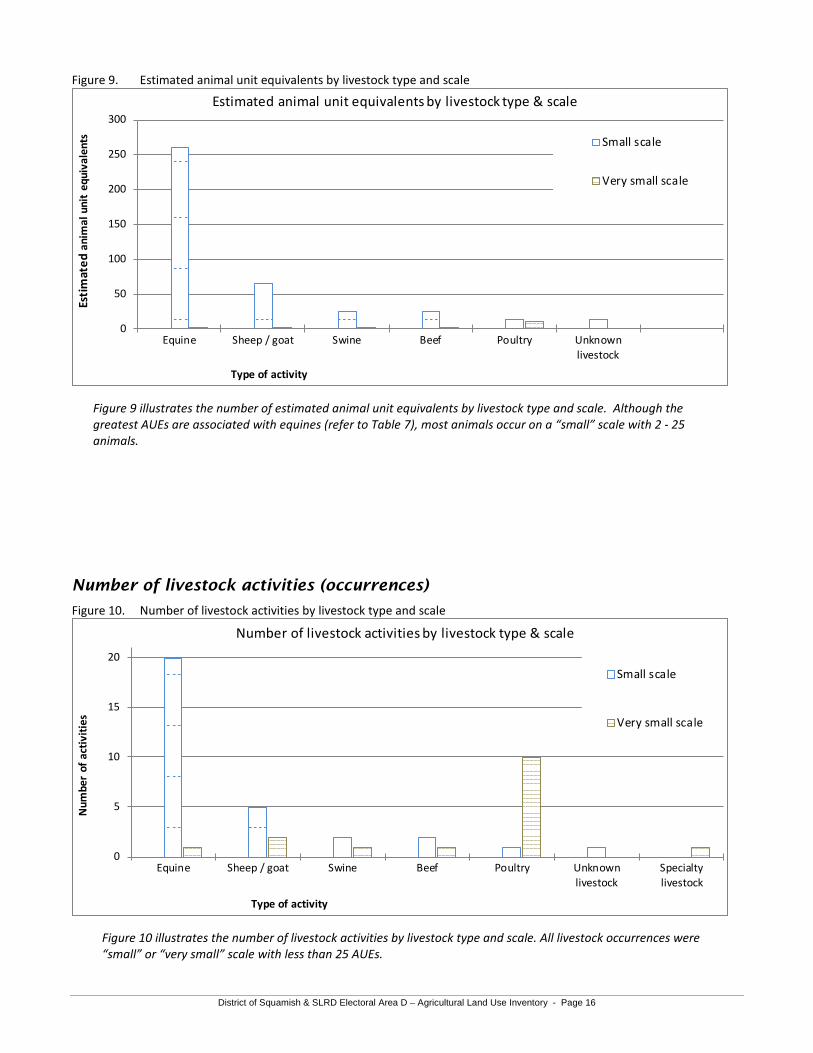
Figure 9 illustrates the number of estimated animal unit equivalents by livestock type and scale. Although the greatest AUEs are associated with equines (refer to Table 7), most animals occur on a “small” scale with 2 - 25 animals.
Figure 10 illustrates the number of livestock activities by livestock type and scale. All livestock occurrences were “small” or “very small” scale with less than 25 AUEs.
District of Squamish & SLRD Electoral Area D – Agricultural Land Use Inventory - Page 17
44.. AALLRR UUttiilliizzaattiioonn
4.1 PARCEL INCLUSION IN THE ALR
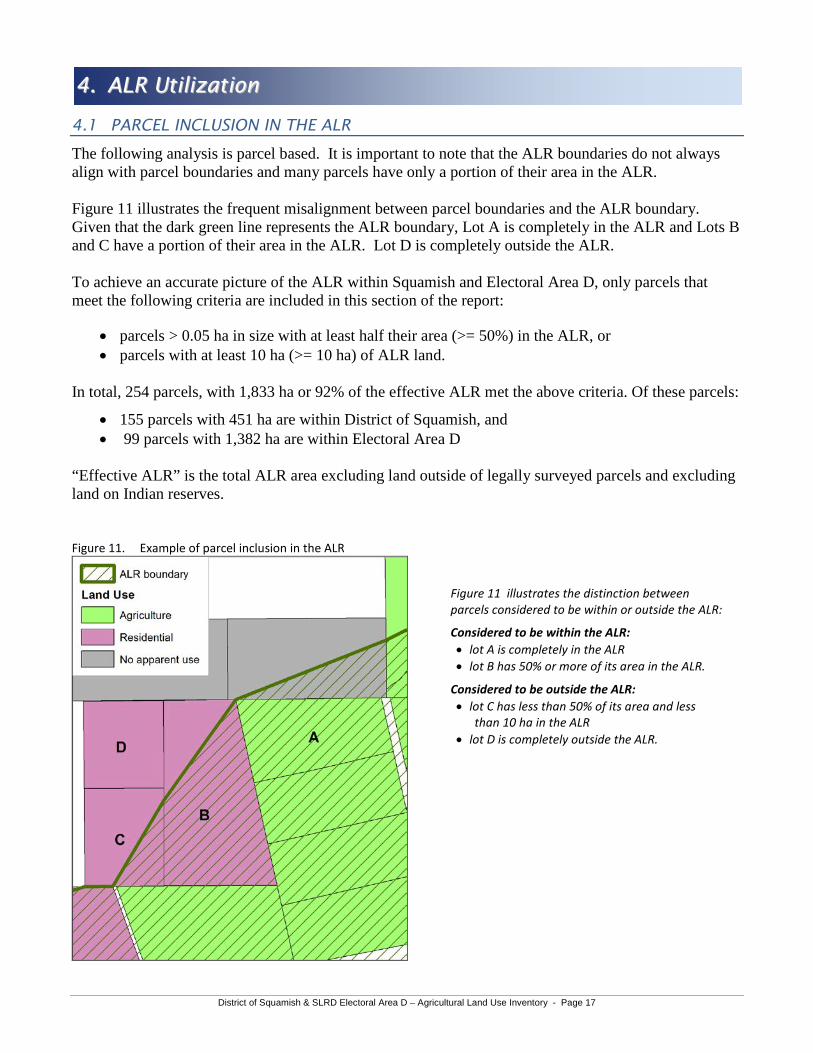
The following analysis is parcel based. It is important to note that the ALR boundaries do not always align with parcel boundaries and many parcels have only a portion of their area in the ALR.
Figure 11 illustrates the frequent misalignment between parcel boundaries and the ALR boundary. Given that the dark green line represents the ALR boundary, Lot A is completely in the ALR and Lots B and C have a portion of their area in the ALR. Lot D is completely outside the ALR.
To achieve an accurate picture of the ALR within Squamish and Electoral Area D, only parcels that meet the following criteria are included in this section of the report:
• parcels > 0.05 ha in size with at least half their area (>= 50%) in the ALR, or• parcels with at least 10 ha (>= 10 ha) of ALR land.
In total, 254 parcels, with 1,833 ha or 92% of the effective ALR met the above criteria. Of these parcels:
• 155 parcels with 451 ha are within District of Squamish, and• 99 parcels with 1,382 ha are within Electoral Area D
“Effective ALR” is the total ALR area excluding land outside of legally surveyed parcels and excluding land on Indian reserves.
Figure 11. Example of parcel inclusion in the ALR
Figure 11 illustrates the distinction between parcels considered to be within or outside the ALR:
Considered to be within the ALR: • lot A is completely in the ALR• lot B has 50% or more of its area in the ALR.
Considered to be outside the ALR:• lot C has less than 50% of its area and less
than 10 ha in the ALR• lot D is completely outside the ALR.
District of Squamish & SLRD Electoral Area D – Agricultural Land Use Inventory - Page 18
4.2 LAND USE AND FARM USE
Land use focuses solely on human use and describes the economic function or type of establishment using the parcel. A parcel can have a variety of activities on the land, yet serve a single use. For example, two parcels are said to be “Used for farming”, even if one is a dairy farm and the other is in blueberries. Another example is commercial land use; if one parcel is a hotel, another is a retail store, and a third is a gas station, all are considered to have a commercial land use.
Up to two general land uses (e.g. residential, commercial, protected area) are recorded for each parcel. Evaluation of land uses are based on the overall economic importance and/or the extent of the land use.
Used for farming – Parcels where the majority of the parcel area is utilized for farming or parcels which exhibit significant evidence of intensive farming. Refer to the glossary for a complete definition. Many “Used for farming” parcels are also used for other purposes such as residential. This report does not attempt to determine which use is primary.
Not used for farming – Parcels that do not meet the “Used for farming” definition.
TOTAL* See "Land Use" in the glossary for terms used in this table.
Table 8 shows the number of ALR parcels “Used for farming” and “Not used for farming” by land use in Squamish & Electoral Area D.
Only 4% of the ALR parcels (11 parcels) met the “Used for farming” definition while 96% of the ALR parcels were “Not used for farming”.
Figure 12 provides more information on “Used for farming” ALR parcels and Figure 13 provides more information on “Not used for farming” ALR parcels.
District of Squamish & SLRD Electoral Area D – Agricultural Land Use Inventory - Page 19
Figure 12. Land use on “Used for farming” ALR parcels
Used for farming &
residential73%
Used for farming only
27%
Used for farming &residential: 8 parcels
Used for farming only:3 parcels
Total number of "Used for farming" ALR parcels: 11 parcels
Figure 13. Land use on “Not used for farming” ALR parcels
Residential, 37%
No apparent use, 32% 17%
6%
5%
3%
Residential
No apparent use
Protected area / park /reserveForestry
Transportation &utilitiesOther
Total number of "Notused for farming" ALR parcels: 243 parcels
Figure 13 illustrates the proportion of “Not used for farming” ALR parcels by their land use.
Thirty-seven percent (37%) of the “Not used for farming” ALR parcels have a residential use and 32% have no apparent use.
Figure 12 illustrates the proportion of “Used for farming” ALR parcels by their land use.
Seventy-three percent (73%) of the ALR parcels that are “Used for farming” are also used for residential purposes.
District of Squamish & SLRD Electoral Area D – Agricultural Land Use Inventory - Page 20
4.3 PARCEL SIZE AND FARM USE
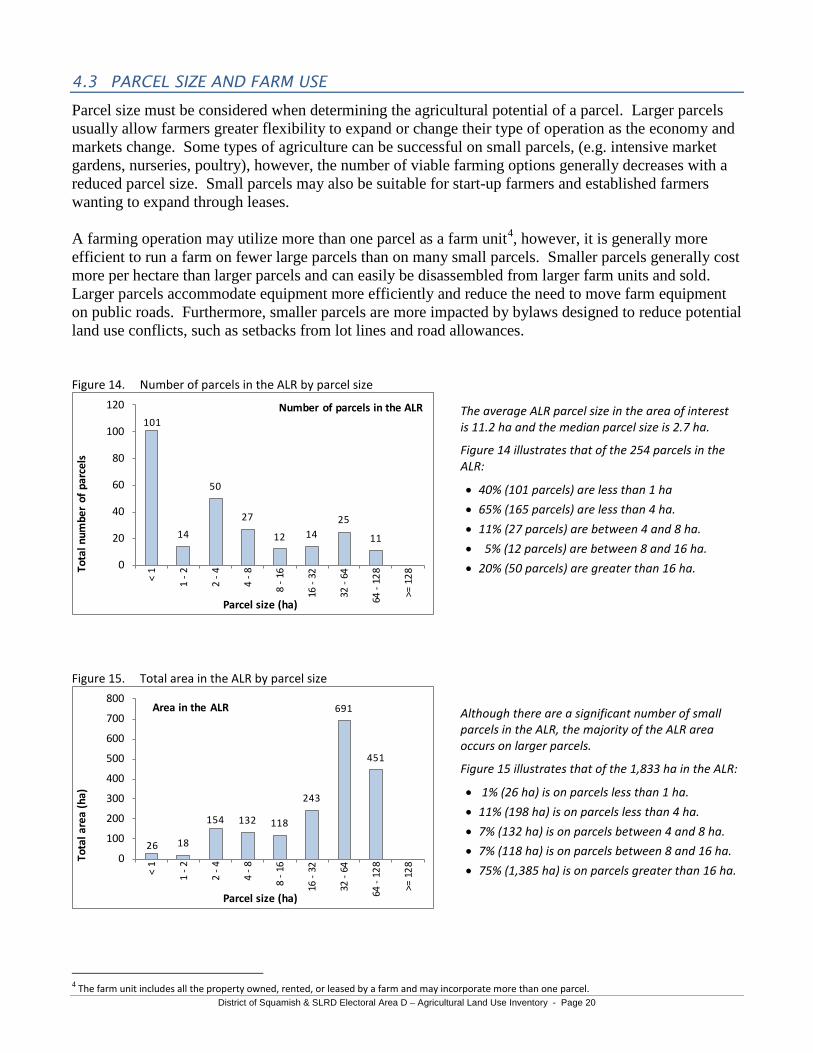
Parcel size must be considered when determining the agricultural potential of a parcel. Larger parcels usually allow farmers greater flexibility to expand or change their type of operation as the economy and markets change. Some types of agriculture can be successful on small parcels, (e.g. intensive market gardens, nurseries, poultry), however, the number of viable farming options generally decreases with a reduced parcel size. Small parcels may also be suitable for start-up farmers and established farmers wanting to expand through leases.
A farming operation may utilize more than one parcel as a farm unit4, however, it is generally more efficient to run a farm on fewer large parcels than on many small parcels. Smaller parcels generally cost more per hectare than larger parcels and can easily be disassembled from larger farm units and sold. Larger parcels accommodate equipment more efficiently and reduce the need to move farm equipment on public roads. Furthermore, smaller parcels are more impacted by bylaws designed to reduce potential land use conflicts, such as setbacks from lot lines and road allowances.
Figure 14. Number of parcels in the ALR by parcel size
101
14
50
27
12 1425
11
0
20
40
60
80
100
120
< 1
1 - 2
2 - 4
4 - 8
8 - 1
6
16 -
32
32 -
64
64 -
128
>= 1
28
Tota
l num
ber
of p
arce
ls
Parcel size (ha)
Number of parcels in the ALR
Figure 15. Total area in the ALR by parcel size
26 18
154 132 118
243
691
451
0
100
200
300
400
500
600
700
800
< 1
1 - 2
2 - 4
4 - 8
8 - 1
6
16 -
32
32 -
64
64 -
128
>= 1
28
Tota
l are
a (h
a)
Parcel size (ha)
Area in the ALR
4 The farm unit includes all the property owned, rented, or leased by a farm and may incorporate more than one parcel.
Although there are a significant number of small parcels in the ALR, the majority of the ALR area occurs on larger parcels.
Figure 15 illustrates that of the 1,833 ha in the ALR:
• 1% (26 ha) is on parcels less than 1 ha.• 11% (198 ha) is on parcels less than 4 ha.• 7% (132 ha) is on parcels between 4 and 8 ha.• 7% (118 ha) is on parcels between 8 and 16 ha.• 75% (1,385 ha) is on parcels greater than 16 ha.
The average ALR parcel size in the area of interest is 11.2 ha and the median parcel size is 2.7 ha.
Figure 14 illustrates that of the 254 parcels in the ALR:
• 40% (101 parcels) are less than 1 ha• 65% (165 parcels) are less than 4 ha.• 11% (27 parcels) are between 4 and 8 ha.• 5% (12 parcels) are between 8 and 16 ha.• 20% (50 parcels) are greater than 16 ha.
District of Squamish & SLRD Electoral Area D – Agricultural Land Use Inventory - Page 21
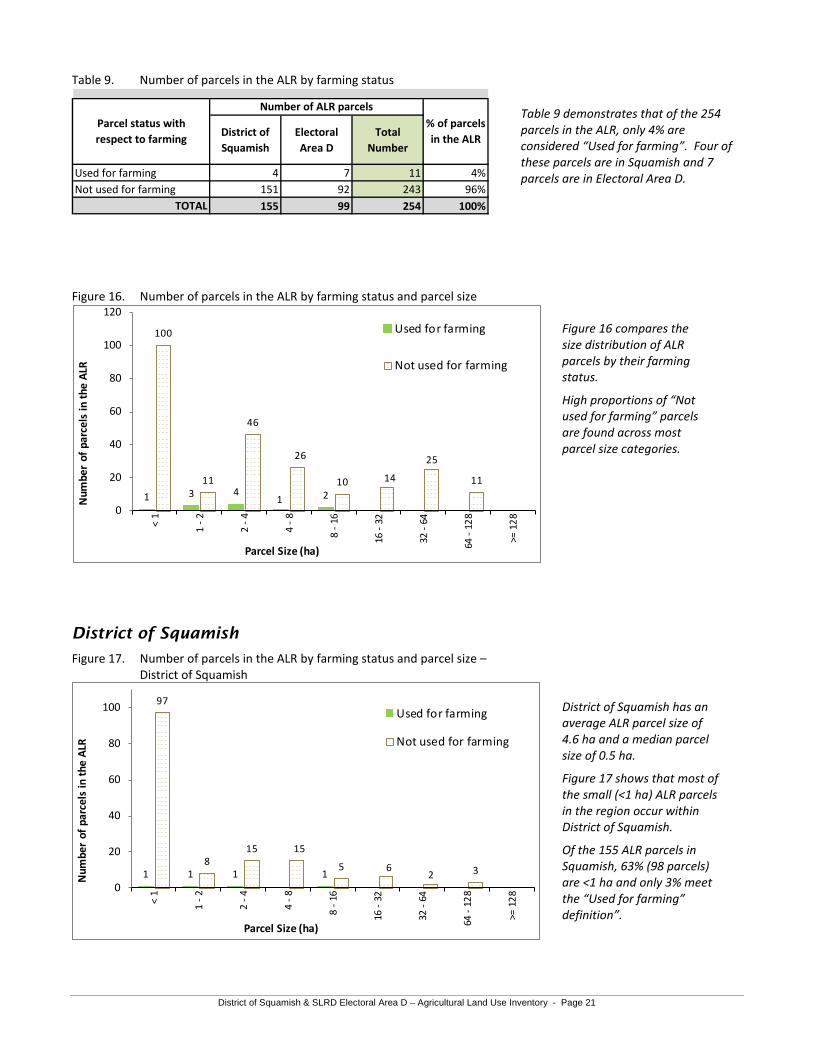
Table 9. Number of parcels in the ALR by farming status
District of Squamish
Electoral Area D
Total Number
Used for farming 4 7 11 4%Not used for farming 151 92 243 96%
TOTAL 155 99 254 100%
Parcel status with respect to farming
Number of ALR parcels% of parcels in the ALR
Figure 16. Number of parcels in the ALR by farming status and parcel size
1 3 41 2
100
11
46
26
10 14
25
11
0
20
40
60
80
100
120
< 1
1 - 2
2 - 4
4 - 8
8 - 1
6
16 -
32
32 -
64
64 -
128
>= 1
28
Num
ber
of p
arce
ls in
the
ALR
Parcel Size (ha)
Used for farming
Not used for farming
District of Squamish
Figure 17. Number of parcels in the ALR by farming status and parcel size – District of Squamish
1 1 1 1
97
815 15
5 62 3
0
20
40
60
80
100
< 1
1 - 2
2 - 4
4 - 8
8 - 1
6
16 -
32
32 -
64
64 -
128
>= 1
28
Num
ber
of p
arce
ls in
the
ALR
Parcel Size (ha)
Used for farming
Not used for farming
Figure 16 compares the size distribution of ALR parcels by their farming status.
High proportions of “Not used for farming” parcels are found across most parcel size categories.
Table 9 demonstrates that of the 254 parcels in the ALR, only 4% are considered “Used for farming”. Four of these parcels are in Squamish and 7 parcels are in Electoral Area D.
District of Squamish has an average ALR parcel size of 4.6 ha and a median parcel size of 0.5 ha.
Figure 17 shows that most of the small (<1 ha) ALR parcels in the region occur within District of Squamish.
Of the 155 ALR parcels in Squamish, 63% (98 parcels) are <1 ha and only 3% meet the “Used for farming” definition”.
District of Squamish & SLRD Electoral Area D – Agricultural Land Use Inventory - Page 22
Electoral Area D
Figure 18. Number of parcels in the ALR by farming status and parcel size – Electoral Area D
2 31 1
3 3
31
11
58
23
8
0
5
10
15
20
25
30
35
40<
1
1 - 2
2 - 4
4 - 8
8 - 1
6
16 -
32
32 -
64
64 -
128
>= 1
28
Num
ber
of p
arce
ls in
the
ALR
Parcel Size (ha)
Used for farming
Not used for farming
Electoral Area D has an average ALR parcel size of 21.6 ha and a median parcel size of 4.8 ha.
Figure 18 shows the size distribution of “Used for farming” and “Not used for farming” parcels in the ALR in Electoral Area D.
Of the 99 ALR parcels in Electoral Area D, 7% (7 parcels) are “Used for farming”.
District of Squamish & SLRD Electoral Area D – Agricultural Land Use Inventory - Page 23
There is a strong demand for agricultural goods produced in British Columbia that is expected to increase with population growth. An available agricultural land base will be important to meet future agricultural needs. This section presents analysis on privately owned ALR parcels that are available and unavailable for farming. Crown lands are not considered in this section as they offer little opportunity for capital investment and intensive agricultural development.
Used for farming – Parcels where the majority of the parcel area is utilized for farming or parcels which exhibit significant intensity of farming. Refer to the glossary for a complete definition.
Not used for farming – Parcels that do not meet the “Used for farming” definition. Includes parcels that are available and unavailable for farming.
Unavailable for farming – “Not used for farming” parcels where future agricultural development is improbable due to a conflicting land use or due to limited land with potential for farming. Land uses such as golf courses, parks, schools, and small residential lots that utilize the majority of the parcel are considered incompatible with agriculture. These properties are serving an established purpose, may be altered in a way that is incompatible with agriculture, or may have very high land values from the built infrastructure. Parcels with little to no land available for farming are also considered “Unavailable for farming”. E.g. A parcel completely covered by trees and a steep slope is considered “Unavailable for farming” due to the limited farming potential on the slope. It is usually uneconomical for a farmer to acquire and convert these properties to farmland.
Available for farming – “Not used for farming” parcels where agricultural activity may be possible. These parcel have no apparent land use, or have an existing land use that is considered compatible with agriculture. Available for farming parcels have at least 50% of their parcel area and least 0.4 ha in land cover that has potential for farming. Areas considered to have potential for farming include:
• Natural and semi-natural vegetation that is free from physical limitations such as steep slopes,rocky soils and riparian areas. Although some crops can thrive in areas with physical limitations(e.g. grapes on steep slopes), it is assumed these areas will not be utilized for farming purposes. Natural areas that are grazed are considered to have potential for more intensive farming.
• Anthropogenic managed vegetation (managed for landscaping, dust or soil control). E.g. Verylarge lawns or rough grass areas (> 0.4 ha) may be available for conversion to agriculture. Parksand golf courses are not considered to have potential for farming.
Built structures, wetlands and waterbodies are considered to have no potential for farming. It is assumed these areas would not likely be removed or filled in to create land with cultivation potential.
Available for farming parcels reflect the maximum amount of land that may be available for farming. It should be noted that these parcels may be providing value that was not accounted for in the ALUI. For example, parcels may be providing ecological goods and services such as soil stabilization, water purification, or wildlife habitat. Additionally, parcels may have an unrecorded physical limitation (rocky soils, poor drainage, etc.) that limits some types of agriculture. Available for farming parcels provide an initial selection of parcels that may be available for agricultural expansion. Detailed investigation is required to confirm the suitability and trade-offs associated with converting these areas to agriculture.
District of Squamish & SLRD Electoral Area D – Agricultural Land Use Inventory - Page 24
Table 10. Availability status of privately owned parcels in the ALR
Used for farming 10 6 % 39 4 %Available for farming 58 34 % 551 51 %Unavailable for farming 102 60 % 497 46 %
TOTAL 170 100 % 1,087 100 %* The entire ALR area or parcel area may not be farmed or available for farming.
Parcel status with respect to farming
Number of parcels
% of parcels in the ALR
Total ALR area (ha)*
% ALR area (ha)
Figure 19. Availability status of privately owned parcels in the ALR by parcel count
Used for farming
6%
Available for farming
34%
Unavailable for farming
60%
Availability by parcel count
Figure 20. Parcel size distribution of privately owned parcels in the ALR by farming status
0
10
20
30
40
50
60
70
< 1
1 - 2
2 - 4
4 - 8
8 - 1
6
16 -
32
32 -
64
64 -
128
>= 1
28
Num
ber
of p
arce
ls in
the
ALR
Parcel Size (ha)
Parcels in the ALR by Farming Status
Farmed
Available
Unavailable
Figure 20 shows the size distribution of privately owned ALR parcels by their farming status. Nearly all parcels less than 1 ha in size are “Unavailable for farming”.
The greatest number of “Available for farming” parcels are 2-4 ha and 4-8 ha in size.
Figure 19 illustrates the proportion of privately owned ALR parcels by their availability for farming status.
Thirty-four (34%) of the ALR parcels are “Available for farming” while 6% are “Used for farming”.
Table 10 details the number of privately owned ALR parcels by their availability for farming status.
34% of the parcels are potentially available for agricultural production.
District of Squamish & SLRD Electoral Area D – Agricultural Land Use Inventory - Page 25
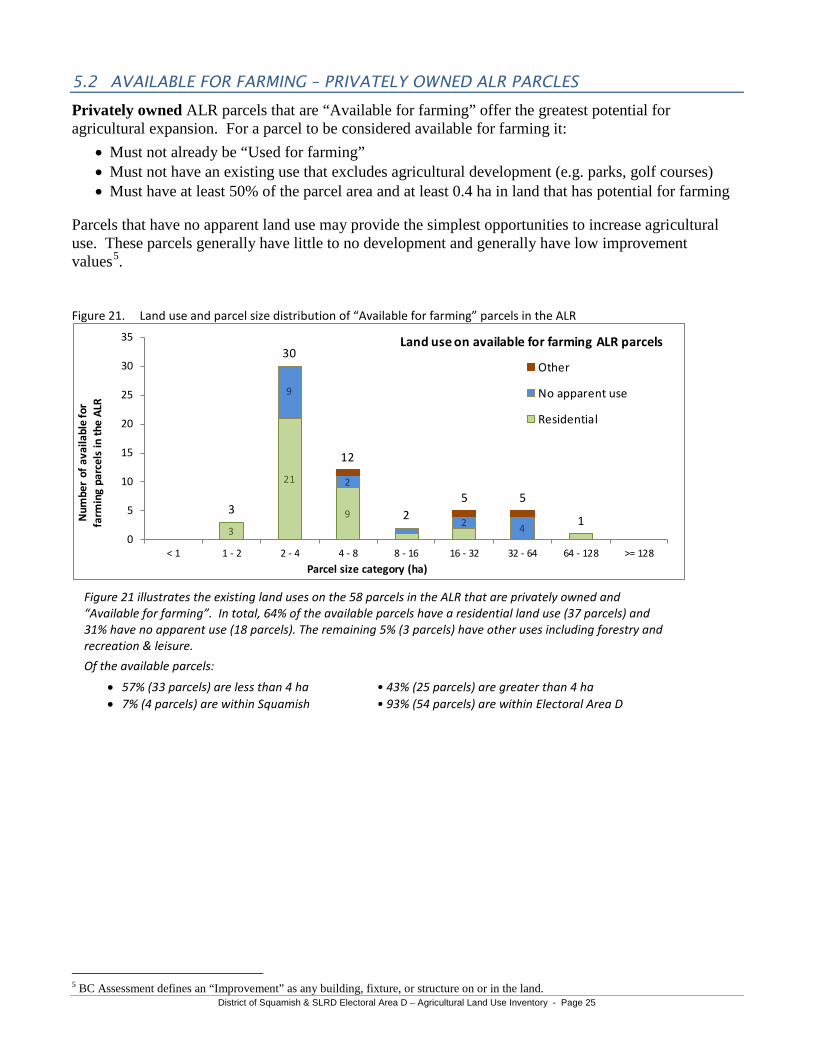
5.2 AVAILABLE FOR FARMING – PRIVATELY OWNED ALR PARCLES
Privately owned ALR parcels that are “Available for farming” offer the greatest potential for agricultural expansion. For a parcel to be considered available for farming it:
• Must not already be “Used for farming”• Must not have an existing use that excludes agricultural development (e.g. parks, golf courses)• Must have at least 50% of the parcel area and at least 0.4 ha in land that has potential for farming
Parcels that have no apparent land use may provide the simplest opportunities to increase agricultural use. These parcels generally have little to no development and generally have low improvement values5.
Figure 21. Land use and parcel size distribution of “Available for farming” parcels in the ALR
5 BC Assessment defines an “Improvement” as any building, fixture, or structure on or in the land.
Figure 21 illustrates the existing land uses on the 58 parcels in the ALR that are privately owned and “Available for farming”. In total, 64% of the available parcels have a residential land use (37 parcels) and 31% have no apparent use (18 parcels). The remaining 5% (3 parcels) have other uses including forestry and recreation & leisure. Of the available parcels:
• 57% (33 parcels) are less than 4 ha • 43% (25 parcels) are greater than 4 ha• 7% (4 parcels) are within Squamish • 93% (54 parcels) are within Electoral Area D
District of Squamish & SLRD Electoral Area D – Agricultural Land Use Inventory - Page 26
Figure 22. Land cover with potential for farming on “Available for farming” parcels in the ALR
462
16
6
2
2
0 100 200 300 400 500
Natural & Semi-natural vegetation
Anthropogenicmanaged vegetation
Unmaintainedfield crops
Natural pastureor rangeland
Anthropogenicnon built or bare
ALR area (ha)
Curr
ent
land
cov
er
Figure 22 shows the types of land cover that have potential for farming on parcels that meet the ‘Available for farming’ criteria.
Land in natural & semi-natural vegetation offers the greatest opportunities to increase cultivation on parcels that are “Available for farming”. These gains in cultivated land would have to be measured against the potential loss of ecological values such as wildlife habitat and societal values such as natural views and privacy.
The majority of the available natural & semi-natural vegetation (97% or 446 ha) is currently treed and would require clearing if cultivation were to occur.
District of Squamish & SLRD Electoral Area D – Agricultural Land Use Inventory - Page 27
5.3 UNAVAILABLE FOR FARMING – PRIVATELY OWNED ALR PARCELS
Parcels that are unavailable for farming have an existing land use that excludes agricultural development (e.g. golf courses, schools, small lot residential), or lack sufficient land cover that has potential for farming. Parcels that do not meet the minimum parcel availability criteria (>50% of the parcel area and >0.4 ha in land cover with potential for farming) are considered unavailable for farming. Examples of parcels not meeting the minimum availability criteria include:
• A parcel completely covered in trees and a steep slope. There is no available land as sloped areas are considered to have limited potential for farming.
• A parcel with 0.3 ha of available land. • A parcel with 45% if its total area in land with potential for farming.
Figure 23. Parcel size distribution of unavailable for farming parcels in the ALR
No apparent use - low availability of suitable land
Residential
Land use on unavailable for farming ALR parcels
Figure 23 shows the number of privately owned ALR parcels that that are “Unavailable for farming”. These parcels have an existing land use or low availability of suitable land that presents a significant barrier to farming.
Two-thirds (66%) of the parcels less than 1 ha are “Unavailable for farming” due to residential use. The 17 parcels with an ‘other’ use on parcels less than 1 ha are associated with a park / protected area land use.
District of Squamish & SLRD Electoral Area D – Agricultural Land Use Inventory - Page 28
66.. FFaarrmmiinngg OOuuttssiiddee tthhee AALLRR 6.1 FARMING OUTSIDE THE ALR
Farming outside of the ALR contributes to the economy and to the general agricultural landscape. However, agriculturally zoned lands outside of the ALR do not receive the same level of protection as lands within the ALR. Agricultural activities outside of the ALR are more subject to restrictions and complaints related to noise, nuisance and disturbances.
The inventory identified 13 parcels outside of the ALR that met the “Used for farming” definition. These parcels have an average parcel size of 3.7 ha and a median parcel size of 1.6 ha. Figure 24. Distribution of farmed land cover
Livestock groupNumber of activities outside the ALR
Total activities
Figure 24 shows that 31% of the farmed land cover on in Squamish and Electoral Area D occurs outside of the ALR (refer to Table 2 for more information).
In total, 21 ha of farmed land cover was identified outside the ALR.
This area is comprised of 13 ha of cultivated crops, and 8 ha of farm infrastructure.
Table 11 details the cultivated crops identified outside the ALR. Pasture is the primary crop type.
The majority of the crops found outside of the ALR occur in Squamish.
Table 12 shows the number and type of livestock activities recorded outside of the ALR.
Of the identified 18 livestock activities, all are “small” or “very small” scale with less than 25 animals. Equine was the most common livestock type.
Sixteen of the identified livestock activities occurred in Squamish.
District of Squamish & SLRD Electoral Area D – Agricultural Land Use Inventory - Page 29
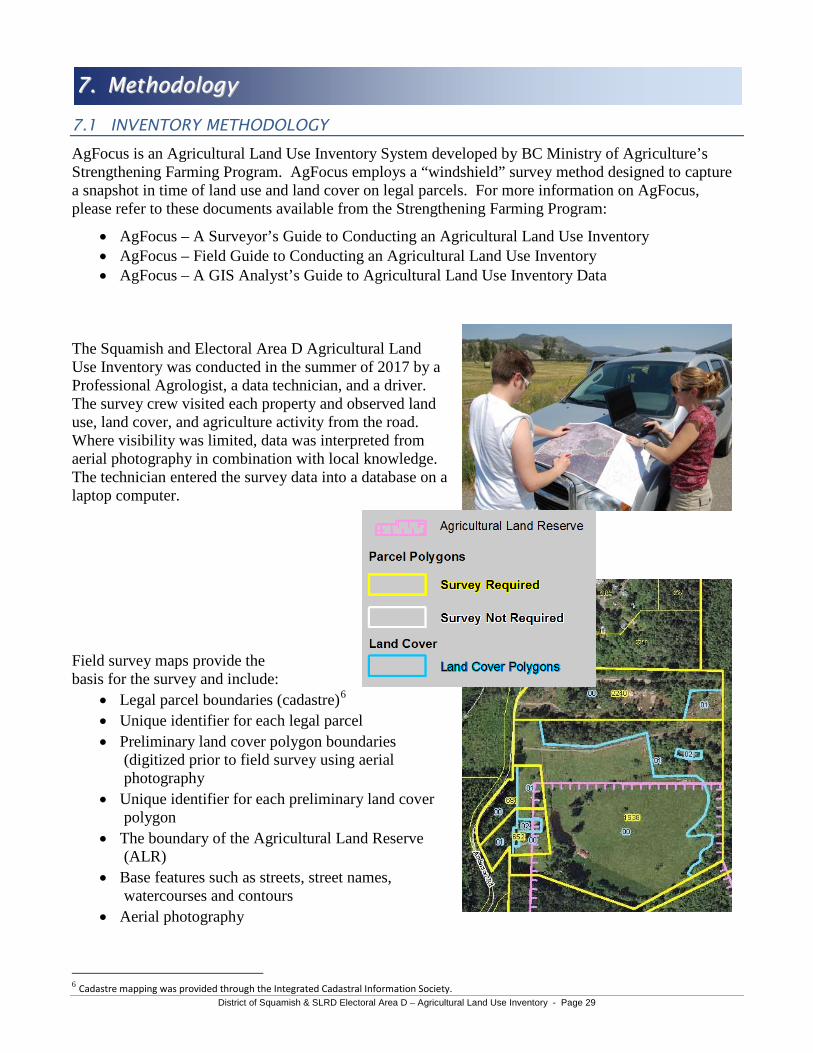
AgFocus is an Agricultural Land Use Inventory System developed by BC Ministry of Agriculture’s Strengthening Farming Program. AgFocus employs a “windshield” survey method designed to capture a snapshot in time of land use and land cover on legal parcels. For more information on AgFocus, please refer to these documents available from the Strengthening Farming Program:
• AgFocus – A Surveyor’s Guide to Conducting an Agricultural Land Use Inventory • AgFocus – Field Guide to Conducting an Agricultural Land Use Inventory • AgFocus – A GIS Analyst’s Guide to Agricultural Land Use Inventory Data
The Squamish and Electoral Area D Agricultural Land Use Inventory was conducted in the summer of 2017 by a Professional Agrologist, a data technician, and a driver. The survey crew visited each property and observed land use, land cover, and agriculture activity from the road. Where visibility was limited, data was interpreted from aerial photography in combination with local knowledge. The technician entered the survey data into a database on a laptop computer. Field survey maps provide the basis for the survey and include:
• Legal parcel boundaries (cadastre)6 • Unique identifier for each legal parcel • Preliminary land cover polygon boundaries
(digitized prior to field survey using aerial photography
• Unique identifier for each preliminary land cover polygon
• The boundary of the Agricultural Land Reserve (ALR)
• Base features such as streets, street names, watercourses and contours
• Aerial photography
6 Cadastre mapping was provided through the Integrated Cadastral Information Society.
District of Squamish & SLRD Electoral Area D – Agricultural Land Use Inventory - Page 30
7.2 DESCRIPTION OF THE DATA
For each property in the study area, data was collected on general land use and land cover. For properties with agricultural activities, data was collected on agricultural practices, irrigation, crop production methods, livestock, agricultural support (storage, compost, waste), and activities which add value to raw agricultural products. Once acquired through the survey, the data was brought into a Geographic Information System (GIS) to facilitate analysis and mapping. Digital data, in the form of a tabular database and GIS spatial layers (for maps), may be available with certain restrictions through a terms of use agreement. Land cover: Land cover refers to the biophysical features of the land (e.g. crops, buildings, forested areas, woodlots, streams). Land cover was surveyed by separating the parcel into homogeneous components and assigning each a description. Prior to field survey, polygons were delineated in the office using orthophotography. Further delineation occurred during the field survey until one of the following was achieved:
• Minimum polygon size (500 sq m ~5400 sq ft) or minimum polygon width (10 m ~33 ft)
• Polygon is homogeneous in physical cover and homogeneous in irrigation method
• Maximum level of detail required was reached In most cases, more than one land cover was recorded for each parcel surveyed. General land use: Up to two general land uses (e.g. residential, commercial) were recorded for each property based on an assessment of overall economic importance, the property’s tax status, and/or the extent of the land use. The survey for general land use focuses solely on human use and considers:
• The actual human use of land and related structures and modifications to the landscape
• Use-related land cover (where land cover implies a use or is important to interpreting patterns of use)
• Declared interests in the land (which may limit use) such as parks
In addition, the availability of properties for future farming was assessed based on the amount of potential land for farming on the property and the compatibility of existing uses with future farming activities.
Agriculture Use Livestock Dairy Milking
Other Use Residential Single Family Household
Anthropogenic Terrestrial Bare or Built Farm
Natural & Semi Natural Terrestrial Vegetated Open Treed
Anthropogenic Terrestrial Bare or Built Built Residential Single Family Small house
District of Squamish & SLRD Electoral Area D – Agricultural Land Use Inventory - Page 31
Livestock: Livestock operations and confinement methods along with the scale of the activity were estimated and recorded. Livestock not visible at the time of survey may have been inferred based on grazed pastures, manure storage, size of barn and other evidence. Agricultural practices: Surveyors recorded agricultural practices associated with crops or livestock activities. For example, if a forage crop was being harvested for hay, it was recorded. Irrigation was also recorded, including the type of system used. Agricultural crop production: Crop production and crop protection methods observed on the parcel were recorded such as wildlife scare devices, temperature or light control, or organic production. Organic production is not always visible and may have been recorded based on local knowledge or farmer interviews. Agricultural support: Ancillary agricultural activities, such as storage, compost or waste, supporting the production of a raw commodity on a farm unit were recorded. Agricultural value added: Activities that add value to a raw commodity where at least 50% of the raw commodity is produced on the farm unit were recorded. This value-added activity included processing, direct sales and agri-tourism activities. 7.3 PRESENTATION OF THE DATA
The data in this report is presented in the form of summarized tables and charts. In the final formatting of the tables and charts, data values are rounded to the nearest whole number. As a result, the data may not appear to add up correctly.
District of Squamish & SLRD Electoral Area D – Agricultural Land Use Inventory - Page 32
AAppppeennddiixx AA –– GGlloossssaarryy
Actively farmed – Land cover considered Farmed but excludes unused / unmaintained field crops, and unmaintained greenhouses. Does not include natural pasture or rangeland.
Agricultural Land Reserve (ALR) – A provincial zone in which agriculture is recognized as the priority use. Farming is encouraged and non-agricultural uses are controlled.
Animal Unit Equivalent – A standard measure used to compare different livestock types. One animal unit equivalent is approximately equal to one adult cow or horse.
Anthropogenic – The term anthropogenic describes an effect or object resulting from human activity. In this report, the term anthropogenic refers to land cover originating and maintained by human actions but excludes farmed land cover; cultivated field crops, farm infrastructure, and crop cover structures.
Anthropogenic – Built up - Other – Lands covered by various unused or unmaintained built objects (structures) and associated yards that are not directly used for farming.
Anthropogenic – Managed vegetation – Lands seeded or planted for landscaping, dust or soil control but not cultivated for harvest or pasture. Includes parklands, golf courses, landscaping, lawns, vegetated enclosures, remediation areas.
Anthropogenic – Non Built or Bare – Human created bare areas such as extraction or disposal sites. Includes piles, pits, fill dumps, dirt parking or storage areas.
Anthropogenic – Residential – Lands covered by built objects (structures) and their associated auxiliary buildings, yards, roads, and parking. Includes single family dwellings, multifamily dwellings, and mobile homes.
Anthropogenic – Residential footprint – Includes the main residence plus its associated yard, driveway, parking and any auxiliary buildings or structures. When two residences are on a property, areas associated to both (such as shared driveways, parking or yard), are assigned to the closest residence.
Anthropogenic – Settlement – Lands covered by built objects (structures) and their associated yards, roads, and parking. Includes institutional, commercial, industrial, sports / recreation, military, non linear utility areas and storage / parking.
Anthropogenic – Transportation – Lands covered by built objects (structures). Includes roads, railways, airports and associated buffers and yards.
Anthropogenic – Utilities – Lands covered by built objects (structures). Includes linear features such as pipelines or transmission lines.
Anthropogenic Waterbodies – Areas covered by water, snow or ice due to human construction. Includes reservoirs, canals, ditches, and artificial lakes - with or without non cultivated vegetation.
Available for farming – Parcels that can be used for agricultural purposes without displacing a current use. Includes all parcels that do not meet the “Unavailable for farming” criteria.
BC Assessment – The Crown corporation which produces annual, uniform property assessments that are used to calculate local and provincial taxation. The database purchased from BC Assessment
District of Squamish & SLRD Electoral Area D – Agricultural Land Use Inventory - Page 33
contains information about property ownership, land use, and farm classification, which is useful for land use surveys.
Cadastre – The GIS layer containing parcel boundaries, i.e. legal lot lines.
Crop cover structures – Land covered with built objects including permanent enclosed glass or poly structures (greenhouses) with or without climate control facilities for growing plants and vegetation under controlled environments, and barns used for growing crops such as mushrooms. Excludes non- permanent structures such as hoop or tunnel covers.
Crown ownership – Crown ownership includes parcels which are owned by provincial or federal governments. Parcel ownership is determined by the Integrated Cadastre Fabric maintained by the Parcel Fabric Section of the BC Government.
Cultivated field crops - Land under cultivation for harvest or pasture. Includes crop land, fallow farmland, unused forage or pasture, un-housed container crops and crops under temporary covers. Excludes natural pasture, rangeland, greenhouses, mushroom barns and other crop houses.
Effective ALR – The Agricultural Land Reserve area that is in legally surveyed parcels and under the jurisdiction of the area of interest. The effective ALR is the total ALR area excluding ALR on Indian reserves and ALR outside of legally surveyed parcels. Effective ALR can be used to compare land cover categories across different jurisdictions.
Farm classification for tax assessment – Applies to parcels producing the minimum dollar amount to be classified as a farm by BC Assessment. Local governments apply a tax rate to farmland which is usually lower than for other land. To receive and maintain the farm classification, the land must generate annual income from agricultural production.
Farm infrastructure – Land covered by farm related built objects (structures) and their associated yards, roads, parking. Includes barns, storage structures, paddocks, corrals, riding rings, farm equipment storage, and specialized farm buildings such as hatcheries. Excludes greenhouses, mushroom barns and other crop houses.
Farm Unit – An area of land used for a farm operation consisting of one or more contiguous or non-contiguous parcels, that may be owned, rented or leased, which form and are managed as a single farm.
Farmed – Land cover directly contributing to agricultural production (both actively farmed and inactively farmed) and intentionally planted or built. Includes land in Cultivated field crops, Farm infrastructure and Crop cover structures (see individual definitions). Does not include natural pasture or rangeland.
Grazed – Land in natural pasture or rangeland that is used for grazing domestic livestock. These areas are considered separate from Farmed land cover.
Greenhouses – See Crop cover structures.
Homesite (livestock) – The homesite is the primary location of a farm unit or livestock operation where most livestock management occurs. It is the location of the main ranch or main barn of a farm unit.
Inactively farmed – Land cover considered “Farmed” but is currently inactive. Includes unused / unmaintained forage and pasture, unmaintained field crops, and unmaintained greenhouses or crop barns. Does not include natural pasture or rangeland.
District of Squamish & SLRD Electoral Area D – Agricultural Land Use Inventory - Page 34
Intensive livestock – Intensive livestock have specialized structures such as barns, feedlots, or stockyards designed for confined feeding at high stocking densities.
Land use – Dumps & deposits – Parcels with landfills, green waste, or outdoor composting facilities. Also includes parcels with significant fill deposits.
Land use – First Nations – Parcels designated for ceremonial use, food & material harvesting, or cultural landforms. These parcels are outside of federally designated Indian reserves.
Land use – Institutional & community – Parcels with churches, cemeteries, hospitals, medical centers, education facilities, correctional facilities, or government and First Nation administration.
Land use – Land in transition – Parcels with developed land in transition. Includes construction sites, large scale tree removal, and demolished buildings.
Land use – No apparent use – Parcel with no apparent human use; natural areas, long term fallow land, cleared land not in production, abandoned or neglected land, abandoned or unused structures.
Land use – Protected area / park / reserve – Includes provincial parks, other parks, and ecological reserves. Areas may have passive recreation such as hiking, nature viewing, or camping.
Land use – Recreation & leisure – Parcels with intensive recreation (such as zoos, rinks, courts, walking/biking trails), or extensive recreation (such as horseback riding, wilderness camping sites, fishing, hunting, skiing, etc.). Golf course are reported separately.
Land use – Water management – Areas used to actively or inactively manage water. Includes reservoirs, managed wetlands, dykes and land which provides natural flood/erosion protection (land outside dyke).
Land use – Wildlife management – Areas used to actively or inactively manage wildlife. Includes wildlife reserves, breeding areas, fishing areas, and fish ladders/hatcheries.
Limited potential for farming – See potential for farming.
Livestock operation scale – See Scale of livestock operations.
Natural and Semi-natural – Land cover which has not originated from human activities or is not being maintained by human actions. See descriptions below. Includes regenerating lands, and old farm fields.
Natural and Semi-natural – Grass – Land cover dominated by naturally occurring grasses with some sedges or rushes. May include non-native naturalized species. If greater than 50% cover is grass, the land is categorized as grass.
Natural and Semi-natural – Herbaceous – Land cover dominated by low, non woody plants such as ferns, grasses, horsetails, clovers and dwarf woody plants. If greater than 10% crown cover is trees, the land is categorized as treed.
Natural and Semi-natural – Natural bare areas – Includes bare rock areas, sands and deserts.
Natural and Semi-natural – Natural pasture – Smaller fenced areas usually on private land with uncultivated (not sown) natural or semi-natural grasses, herbs or shrubs used for grazing domestic livestock.
District of Squamish & SLRD Electoral Area D – Agricultural Land Use Inventory - Page 35
Natural and Semi-natural – Rangeland – Larger areas usually on Crown land with uncultivated (not sown) natural or semi-natural vegetation used for grazing domestic livestock.
Natural and Semi-natural – Shrubs – Land where less than 10% crown cover is native trees and at least 20% crown cover is multi-stemmed woody perennial plants, both evergreen and deciduous.
Natural and Semi-natural – Treed - closed – Land where between 60 and 100% of crown cover is native trees.
Natural and Semi-natural – Treed - open – Land where between 10 and 60% of crown cover is native trees.
Natural and Semi-natural – Vegetation – Land covered by Natural and Semi-natural vegetation including, grasses, herbs, shrubs, and trees. Natural pasture or rangeland is reported separately.
Natural pasture or rangeland – Land with uncultivated (not sown) natural or semi-natural vegetation used for grazing domestic livestock. This land cover is considered “Used for grazing” and “Not used for farming” although these areas are usually extensions of more intensive farming areas.
Non homesite (livestock) – A location where livestock are present, but related infrastructure is minimal. Non homesites are used for pasturing and are secondary to the farm units primary (homesite) location.
Non intensive livestock – Non intensive livestock have the ability to graze on pasture and often utilize non intensive barns and corrals/paddocks.
Not used for farming – Parcels that do not meet the “Used for farming” criteria.
Not used for farming but available – Parcels that do not meet the “Used for farming” criteria but can be used for agricultural purposes without displacing a current use.
Scale of livestock operations – The scale system used in this report to describe livestock operations includes 4 levels:
• “Very Small Approximately 1 cow or horse or bison, 3 hogs, 5 goats or deer, 10 sheep, 50 turkeys, 100 chickens (1 animal unit equivalent)
• “Small” LESS THAN 25 cows or horses or bison, 75 hogs, 125 goats or deer, 250 sheep, 1250 turkeys, 2500 chickens (2 - 25 animal unit equivalents)
• “Medium” LESS THAN 100 cows or horses or bison, 300 hogs, 500 goats or deer, 1000 sheep, 5,000 turkeys, 10,000 chickens (25 - 100 animal unit equivalents)
• “Large” MORE THAN 100 cows or horses or bison, 300 hogs, 500 goats or deer, 1000 sheep, 5,000 turkeys, 10,000 chickens (over 100 animal unit equivalents)
Potential for farming – Land without significant topographical, physical or operational constraints to farming such as steep terrain, land under water, or built structures. For example, land with little slope, sufficient soils and exhibiting a natural treed land cover would be considered as having potential for farming. Areas less than 1 acre in size are considered to have limited potential for farming.
Unavailable for farming – “Not used for farming” parcels where future agricultural development is improbable because of a conflicting land use or land cover that utilizes the majority of the parcel area. For example, most residential parcels are considered unavailable for farming if the parcel size is less than 0.4 hectares (approximately 1 acre) since most of the parcel is covered by built structures, pavement and landscaping.
District of Squamish & SLRD Electoral Area D – Agricultural Land Use Inventory - Page 36
Unmaintained field crops – Land under cultivation for field crops which has not been maintained for several years and probably would not warrant harvest.
Unmaintained forage or pasture – Land under cultivation for forage or pasture which has not been cut or grazed during the current growing season and has not been maintained for several years.
Unused forage or pasture – Land under cultivation for forage or pasture which has not been cut or grazed during the current growing season.
Used for farming – Parcels where the majority of the parcel area is farmed OR parcels which exhibit significant intensity of farming are considered “Used for farming”. Specifically, parcels that meet at least one of the following criteria:
• medium or large scale livestock, apiculture or aquaculture operations• at least 45% parcel area in cultivated field crops (excluding unused forage or pasture)• at least 50% parcel area built up with farm infrastructure• at least 25% parcel area built up with crop cover structures (excluding unmaintained structures)• at least 40% parcel area in cultivated field crops (excluding unused forage or pasture) or farm infrastructure and
small scale livestock, apiculture or aquaculture operations• at least 33% parcel area in cultivated field crops (excluding unused forage or pasture) and at least 55% parcel area in
cultivated field crops (excluding unused forage or pasture) or farm infrastructure• at least 10% parcel area in crop cover structures (excluding unmaintained structures) and at least 40% parcel area in
cultivated field crops (excluding unused forage or pasture) or farm infrastructure• at least 20% parcel area and at least 20 ha in cultivated field crops (excluding unused forage or pasture)• at least 25% parcel area and at least 10 ha in cultivated field crops (excluding unused forage or pasture)• at least 30% parcel area and at least 5 ha in cultivated field crops (excluding unused forage or pasture)• at least 10% parcel area and at least 2 ha built up with crop cover structures (excluding unmaintained structures)• at least 20% parcel area and at least 1 ha built up with crop cover structures (excluding unmaintained structures)
Used for grazing – Parcels “Not used for farming” with a significant portion of their area in natural pasture or rangeland and evidence of active grazing domestic livestock.